50 Aniversario Revista de Metalurgia 2015 - CENIM - … · 50 Aniversario Revista de Metalurgia ......
72
Sebastián F. Medina; M. Gómez; A. Quispe Centro Nacional de Investigaciones Metalúrgicas (CENIM-CSIC). Av. Gregorio del Amo 8, 28040-Madrid, Spain 50 Aniversario Revista de Metalurgia 2015 PRECIPITACIÓN INDUCIDA POR DEFORMACIÓN DE LA AUSTENITA EN ACEROS MICROALEADOS
Transcript of 50 Aniversario Revista de Metalurgia 2015 - CENIM - … · 50 Aniversario Revista de Metalurgia ......
Sebastián F. Medina; M. Gómez; A. Quispe
Centro Nacional de Investigaciones Metalúrgicas (CENIM-CSIC). Av. Gregorio del Amo 8, 28040-Madrid, Spain
50 Aniversario Revista de Metalurgia
2015
PRECIPITACIÓN INDUCIDA POR DEFORMACIÓN DE LA AUSTENITA EN ACEROS MICROALEADOS
Aceros microaleados
• Aceros microaleados: aceros del tipo C-Mn con concentraciones, individuales o combinadas, inferiores al 0,15% de vanadio, niobio o titanio.
• Tipos: -Aceros estructurales (C<0.20%): microestructura ferrita + perlita, en ocasiones +bainita. Resistencia (550-700 MPa). Excelente tenacidad. Aceros HSLA -Aceros alta resistencia (C>0.30): microestructura ferrita + perlita, bainita(>900 Mpa); Baja tenacidad.
EVOLUCIÓN DE LA MICROESTRUCTURA EN LA DEFORMACIÓN EN CALIENTE DE ACEROs ESTRUCTURALES (LAMINACIÓN, FORJA,
EXTRUSIÓN)
• En fase austenítica: • RECRISTALIZACIÓN DINÁMICA • RECRISTALIZACIÓN ESTÁTICA • PRECIPITACIÓN DE PARTICULAS
NANOMÉTRICAS (ACEROS MICROALEADOS) Una vez que el proceso de laminación ha terminado, en el enfriamiento posterior tienen lugar las • TRANSFORMACIONES DE FASE (AUSTENITA
FERRITA, PERLITA, BAINITA)
RECRISTALIZACIÓN DINÁMICA
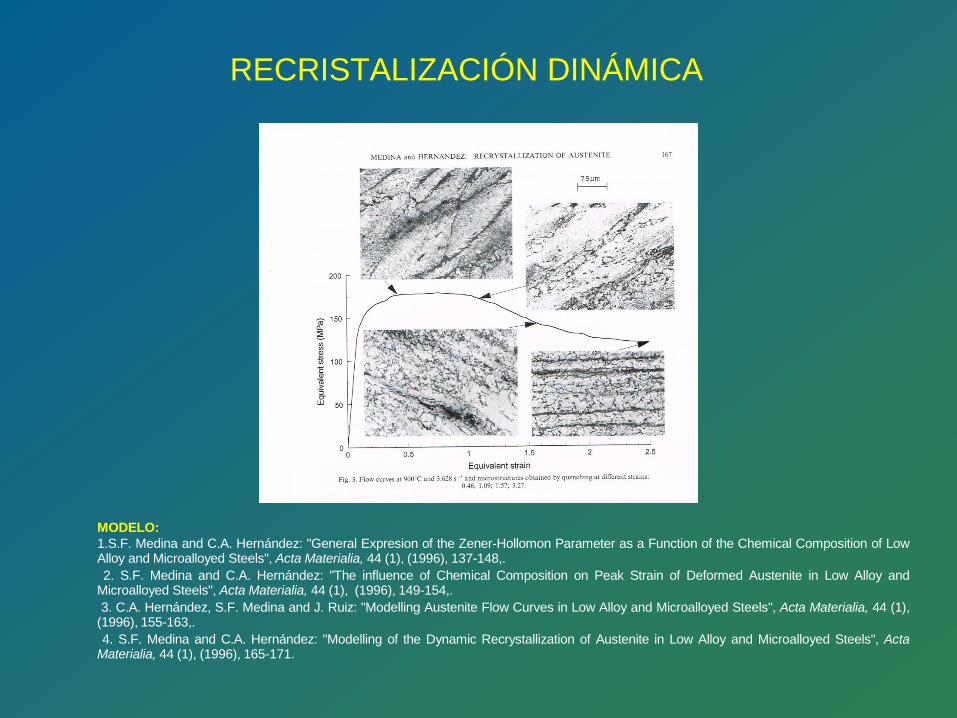
MODELO: 1.S.F. Medina and C.A. Hernández: "General Expresion of the Zener-Hollomon Parameter as a Function of the Chemical Composition of Low Alloy and Microalloyed Steels", Acta Materialia, 44 (1), (1996), 137-148,. 2. S.F. Medina and C.A. Hernández: "The influence of Chemical Composition on Peak Strain of Deformed Austenite in Low Alloy and Microalloyed Steels", Acta Materialia, 44 (1), (1996), 149-154,. 3. C.A. Hernández, S.F. Medina and J. Ruiz: "Modelling Austenite Flow Curves in Low Alloy and Microalloyed Steels", Acta Materialia, 44 (1), (1996), 155-163,. 4. S.F. Medina and C.A. Hernández: "Modelling of the Dynamic Recrystallization of Austenite in Low Alloy and Microalloyed Steels", Acta Materialia, 44 (1), (1996), 165-171.
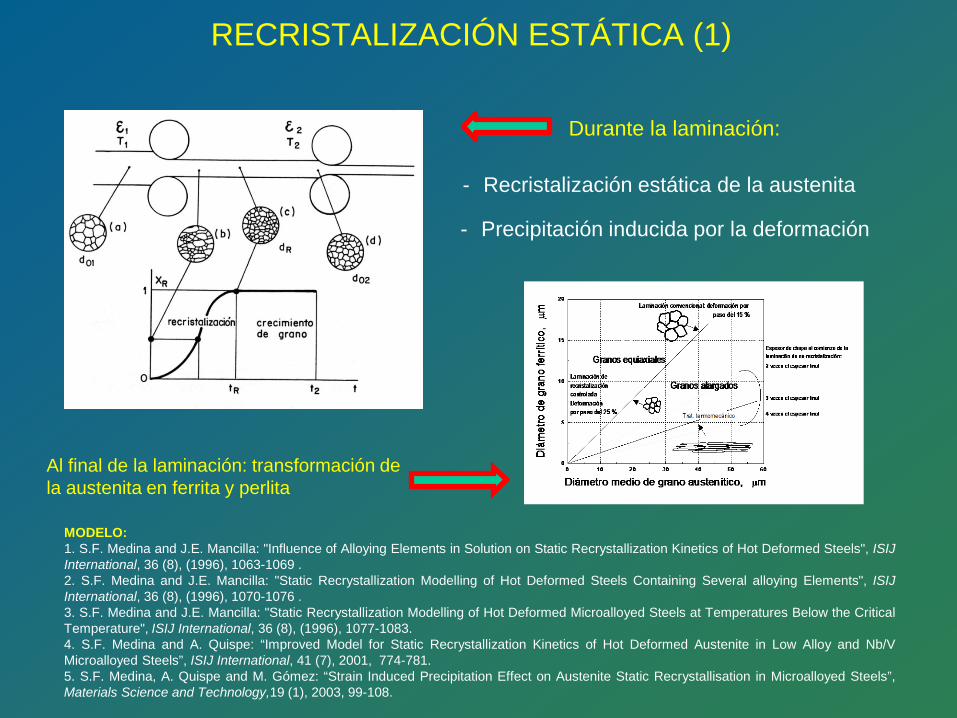
Durante la laminación:
Al final de la laminación: transformación de la austenita en ferrita y perlita
- Recristalización estática de la austenita
- Precipitación inducida por la deformación
RECRISTALIZACIÓN ESTÁTICA (1)
MODELO: 1. S.F. Medina and J.E. Mancilla: "Influence of Alloying Elements in Solution on Static Recrystallization Kinetics of Hot Deformed Steels", ISIJ International, 36 (8), (1996), 1063-1069 . 2. S.F. Medina and J.E. Mancilla: "Static Recrystallization Modelling of Hot Deformed Steels Containing Several alloying Elements", ISIJ International, 36 (8), (1996), 1070-1076 . 3. S.F. Medina and J.E. Mancilla: "Static Recrystallization Modelling of Hot Deformed Microalloyed Steels at Temperatures Below the Critical Temperature", ISIJ International, 36 (8), (1996), 1077-1083. 4. S.F. Medina and A. Quispe: “Improved Model for Static Recrystallization Kinetics of Hot Deformed Austenite in Low Alloy and Nb/V Microalloyed Steels”, ISIJ International, 41 (7), 2001, 774-781. 5. S.F. Medina, A. Quispe and M. Gómez: “Strain Induced Precipitation Effect on Austenite Static Recrystallisation in Microalloyed Steels”, Materials Science and Technology,19 (1), 2003, 99-108.
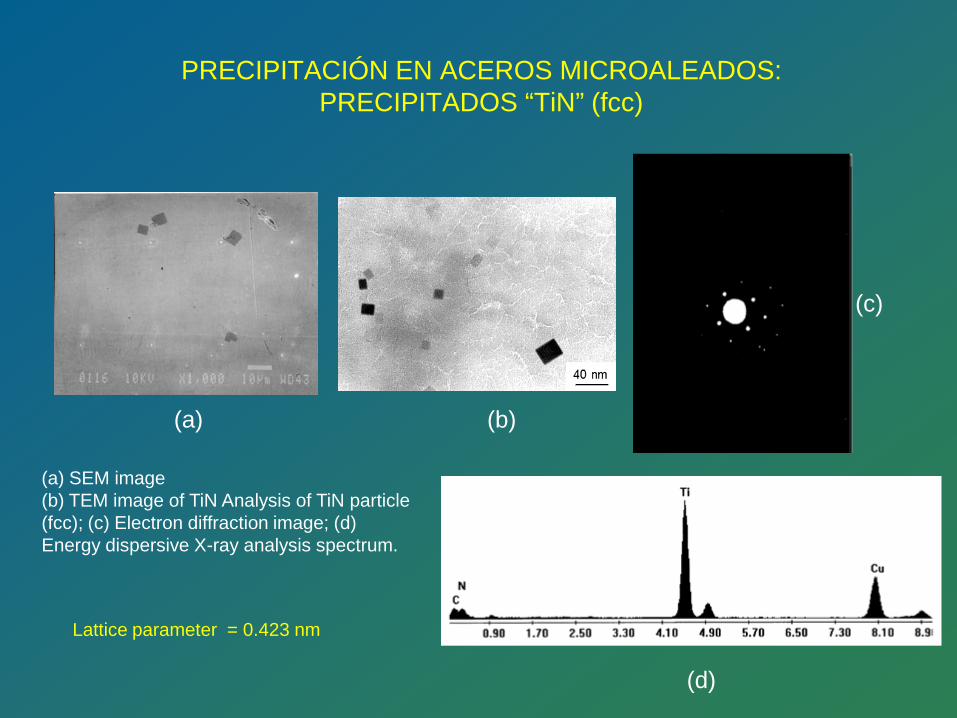
PRECIPITACIÓN EN ACEROS MICROALEADOS: PRECIPITADOS “TiN” (fcc)
(a) SEM image (b) TEM image of TiN Analysis of TiN particle (fcc); (c) Electron diffraction image; (d) Energy dispersive X-ray analysis spectrum.
(b)
(c)
(d)
Lattice parameter = 0.423 nm
(a)
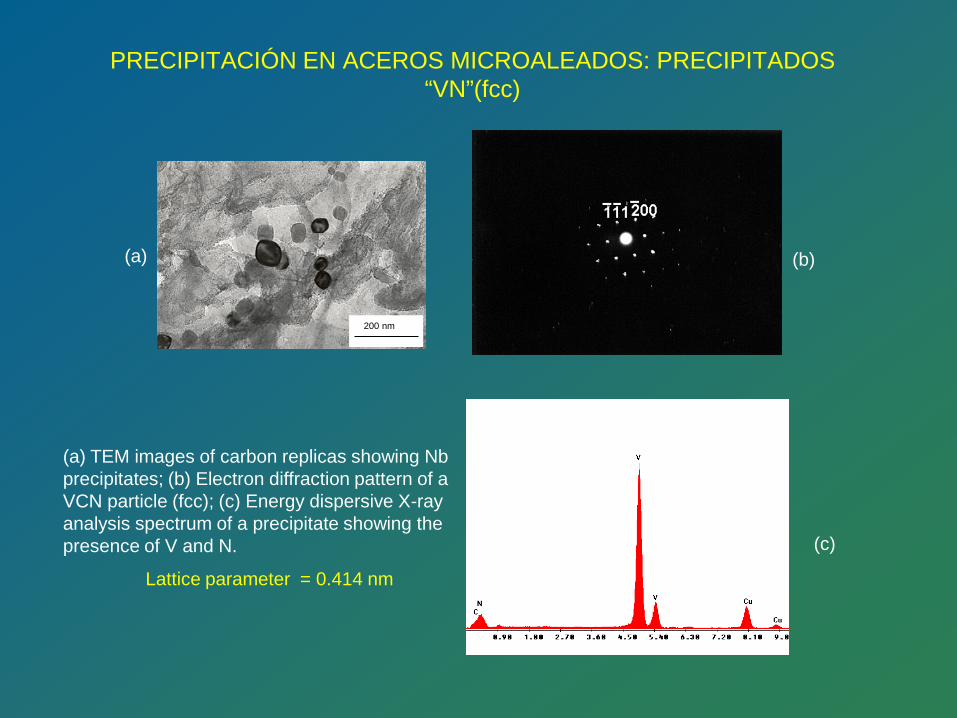
PRECIPITACIÓN EN ACEROS MICROALEADOS: PRECIPITADOS “VN”(fcc)
200 nm
(a) TEM images of carbon replicas showing Nb precipitates; (b) Electron diffraction pattern of a VCN particle (fcc); (c) Energy dispersive X-ray analysis spectrum of a precipitate showing the presence of V and N.
(a) (b)
(c)
Lattice parameter = 0.414 nm
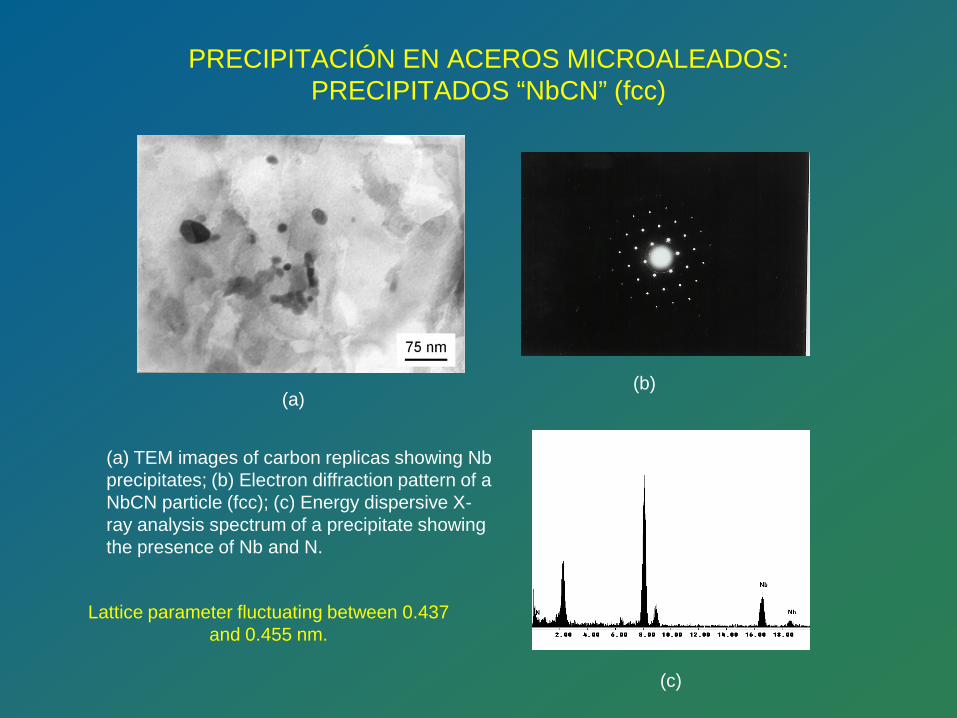
PRECIPITACIÓN EN ACEROS MICROALEADOS: PRECIPITADOS “NbCN” (fcc)
(a) TEM images of carbon replicas showing Nb precipitates; (b) Electron diffraction pattern of a NbCN particle (fcc); (c) Energy dispersive X-ray analysis spectrum of a precipitate showing the presence of Nb and N.
(a) (b)
(c)
Lattice parameter fluctuating between 0.437 and 0.455 nm.
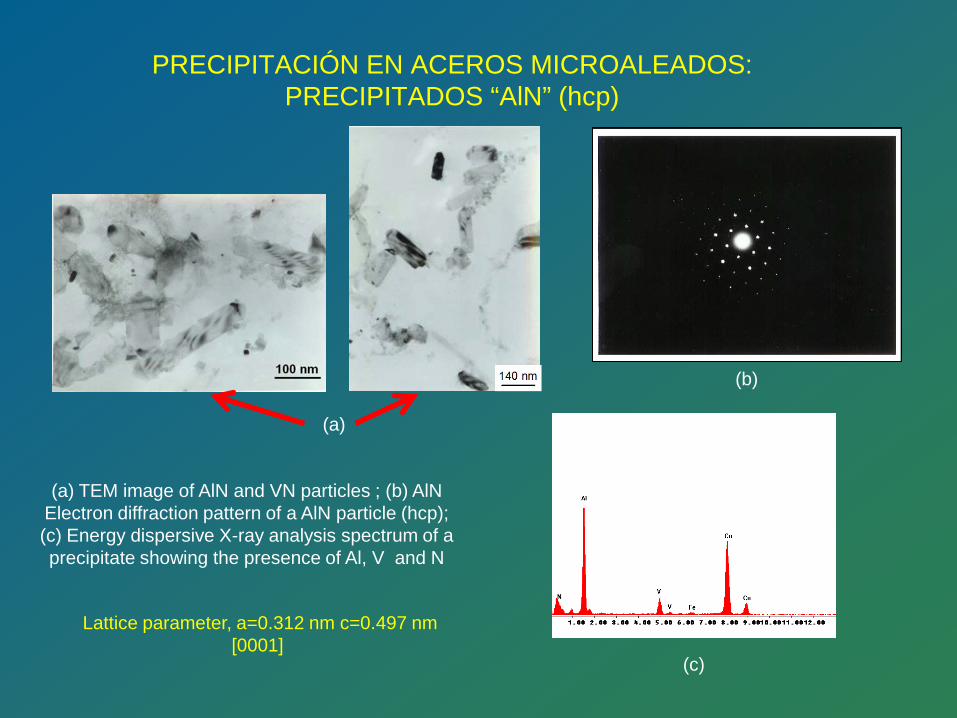
PRECIPITACIÓN EN ACEROS MICROALEADOS: PRECIPITADOS “AlN” (hcp)
(a) TEM image of AlN and VN particles ; (b) AlN Electron diffraction pattern of a AlN particle (hcp); (c) Energy dispersive X-ray analysis spectrum of a precipitate showing the presence of Al, V and N
Lattice parameter, a=0.312 nm c=0.497 nm [0001]
(a)
(b)
(c)
MODELO DE PRECIPITACIÓN
1. A. Quispe , S.F. Medina, M. Gómez and J.I. Chaves: “Influence of austenite grain size on recrystallisation-precipitation interaction in a V-microalloyed steel”, Materials Science Engineering A, 447, 2007, 11-18 . 2. A. Quispe , S.F. Medina, M. Gómez and J.I. Chaves: “Influence of austenite grain size on recrystallisation-precipitation interaction in a V-microalloyed steel”, Materials Science Engineering A, 447, 2007, 11-18. 3. S.F. Medina, M. Gómez, P. Valles, P.P. Gómez: Effects of TiN and AlN Nanoparticles in Hot Deformation of Austenite in Steels, Steel Research International, 81(11), (2010), 1010-1015. 4. S.F. Medina, A. Quispe, M. Gomez: New model for strain induced precipitation kinetics in microalloyed steels, Metallurgical and Materials Transactions A, 45 (3) (2014) 1524-1539. 5. S.F. Medina: From heterogeneous to homogeneous nucleation for precipitation in austenite of microalloyed steels, Acta Materialia, 84 (2015) 202–207.
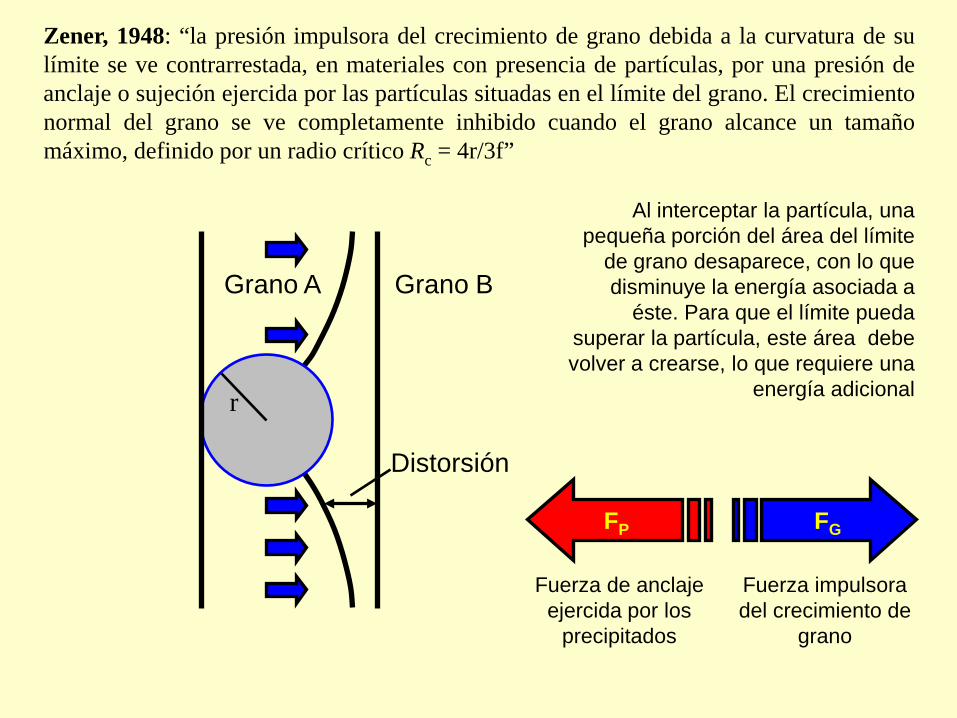
Al interceptar la partícula, una pequeña porción del área del límite
de grano desaparece, con lo que disminuye la energía asociada a
éste. Para que el límite pueda superar la partícula, este área debe volver a crearse, lo que requiere una
energía adicional
Zener, 1948: “la presión impulsora del crecimiento de grano debida a la curvatura de su límite se ve contrarrestada, en materiales con presencia de partículas, por una presión de anclaje o sujeción ejercida por las partículas situadas en el límite del grano. El crecimiento normal del grano se ve completamente inhibido cuando el grano alcance un tamaño máximo, definido por un radio crítico Rc = 4r/3f”
Grano A Grano B
Distorsión
Fuerza de anclaje
ejercida por los precipitados
Fuerza impulsora del crecimiento de
grano
FP FG
r
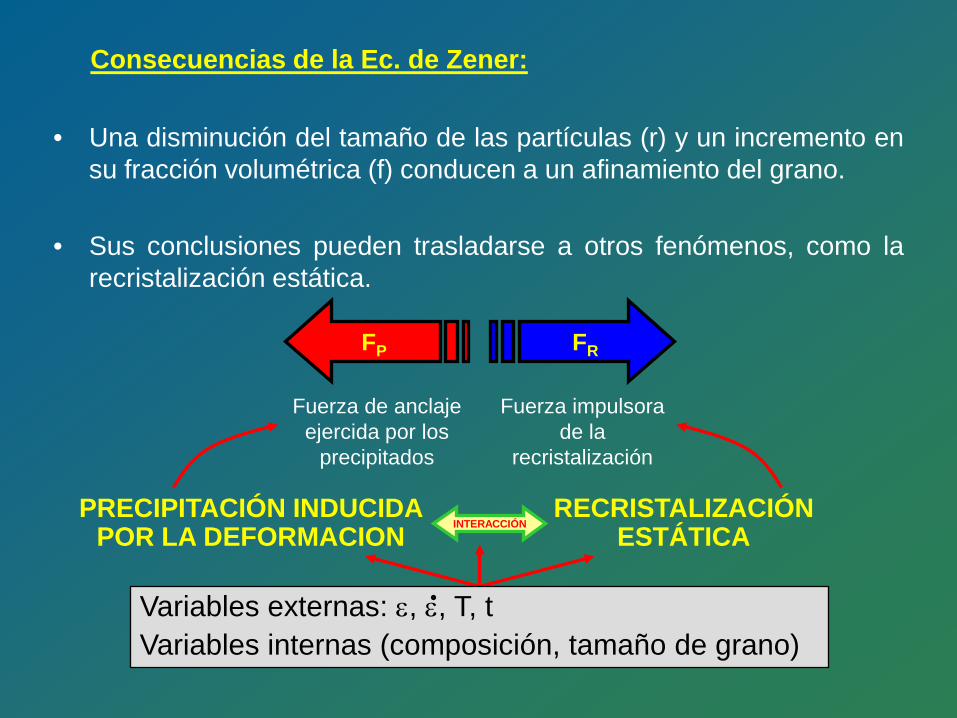
Consecuencias de la Ec. de Zener:
PRECIPITACIÓN INDUCIDA POR LA DEFORMACION
Fuerza de anclaje
ejercida por los precipitados
Fuerza impulsora
de la recristalización
FP FR
RECRISTALIZACIÓN ESTÁTICA INTERACCIÓN
Variables externas: ε, ε, T, t Variables internas (composición, tamaño de grano)
• Una disminución del tamaño de las partículas (r) y un incremento en
su fracción volumétrica (f) conducen a un afinamiento del grano.
• Sus conclusiones pueden trasladarse a otros fenómenos, como la recristalización estática.
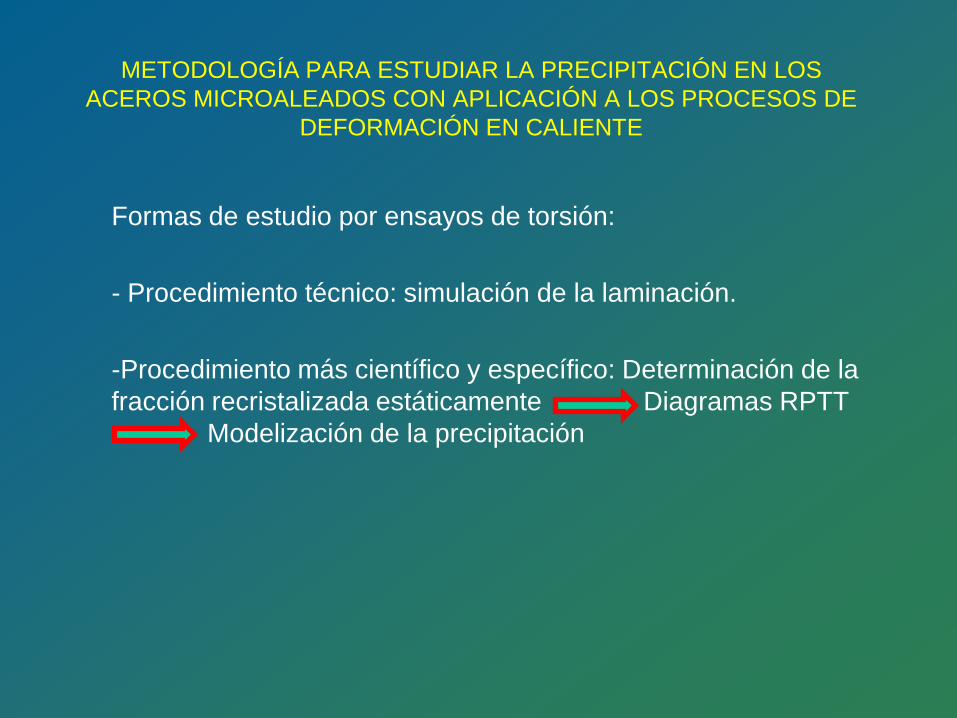
METODOLOGÍA PARA ESTUDIAR LA PRECIPITACIÓN EN LOS ACEROS MICROALEADOS CON APLICACIÓN A LOS PROCESOS DE
DEFORMACIÓN EN CALIENTE
Formas de estudio por ensayos de torsión: - Procedimiento técnico: simulación de la laminación. -Procedimiento más científico y específico: Determinación de la fracción recristalizada estáticamente Diagramas RPTT Modelización de la precipitación
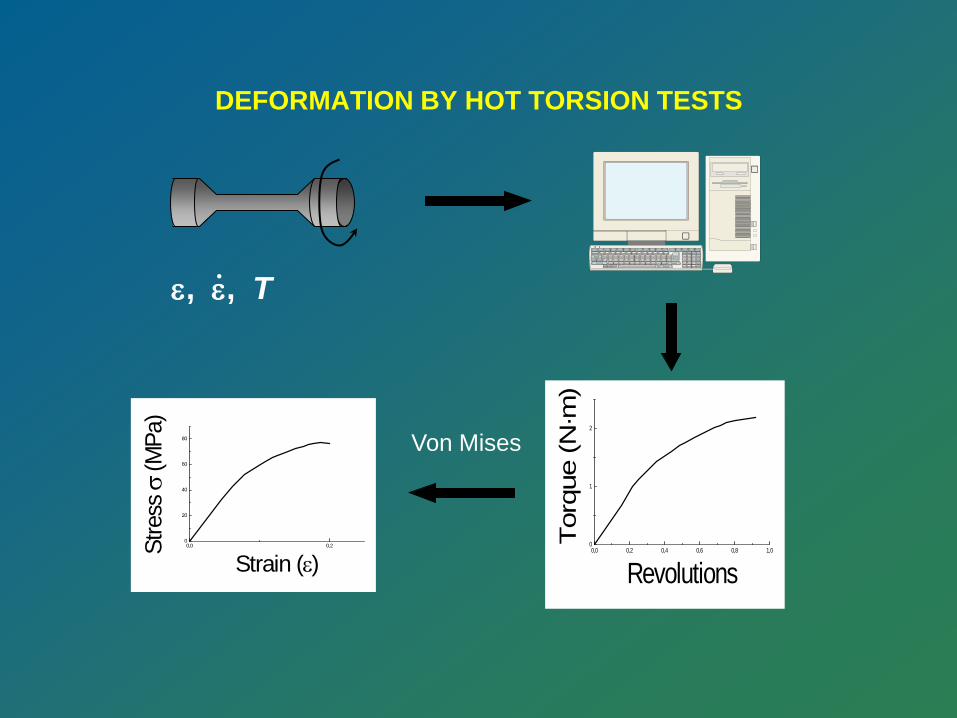
DEFORMATION BY HOT TORSION TESTS
Von Mises
0,0 0,20
20
40
60
80
Stre
ss σ
(MPa
)
Strain (ε)0,0 0,2 0,4 0,6 0,8 1,0
0
1
2
Tor
que
(N·m
)Revolutions
ε, ε, T ·
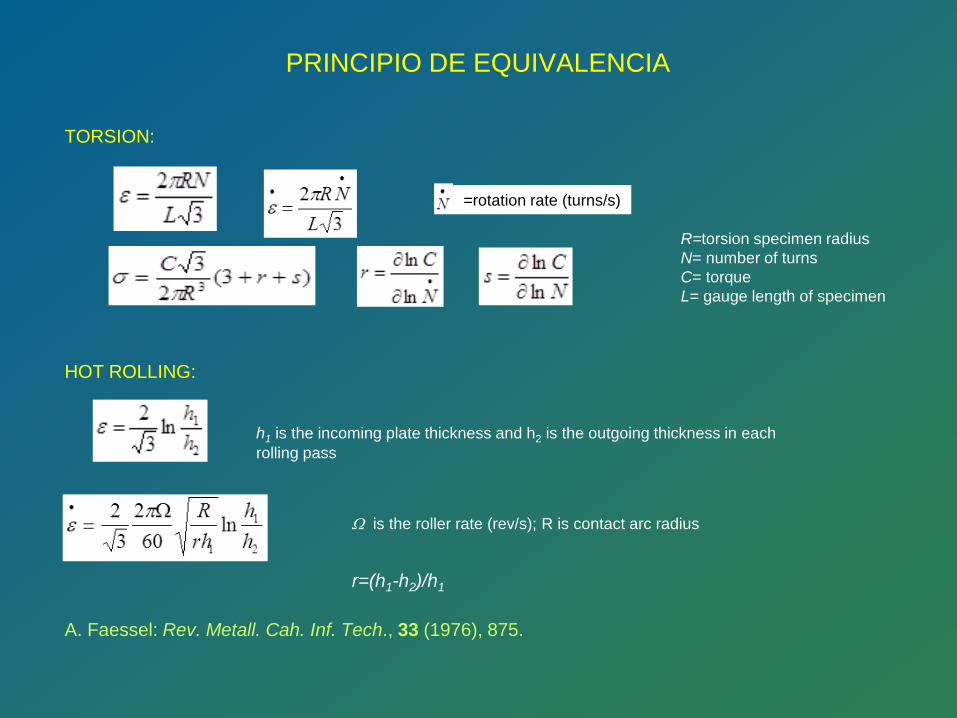
PRINCIPIO DE EQUIVALENCIA
TORSION:
HOT ROLLING:
h1 is the incoming plate thickness and h2 is the outgoing thickness in each rolling pass
Ω is the roller rate (rev/s); R is contact arc radius
r=(h1-h2)/h1
A. Faessel: Rev. Metall. Cah. Inf. Tech., 33 (1976), 875.
R=torsion specimen radius N= number of turns C= torque L= gauge length of specimen
=rotation rate (turns/s)
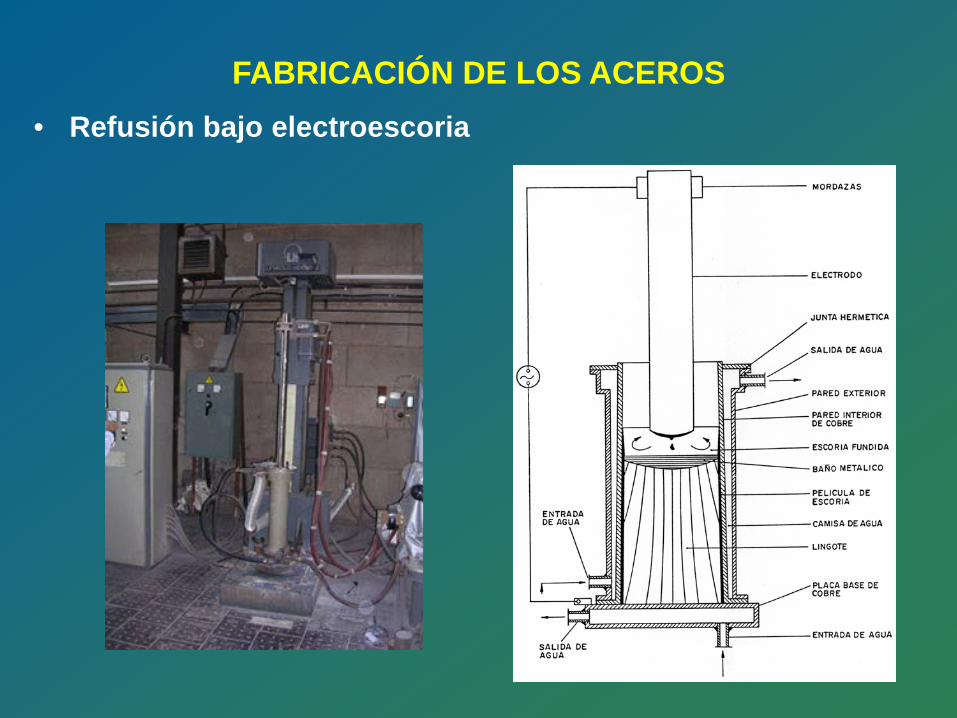
• Refusión bajo electroescoria
FABRICACIÓN DE LOS ACEROS
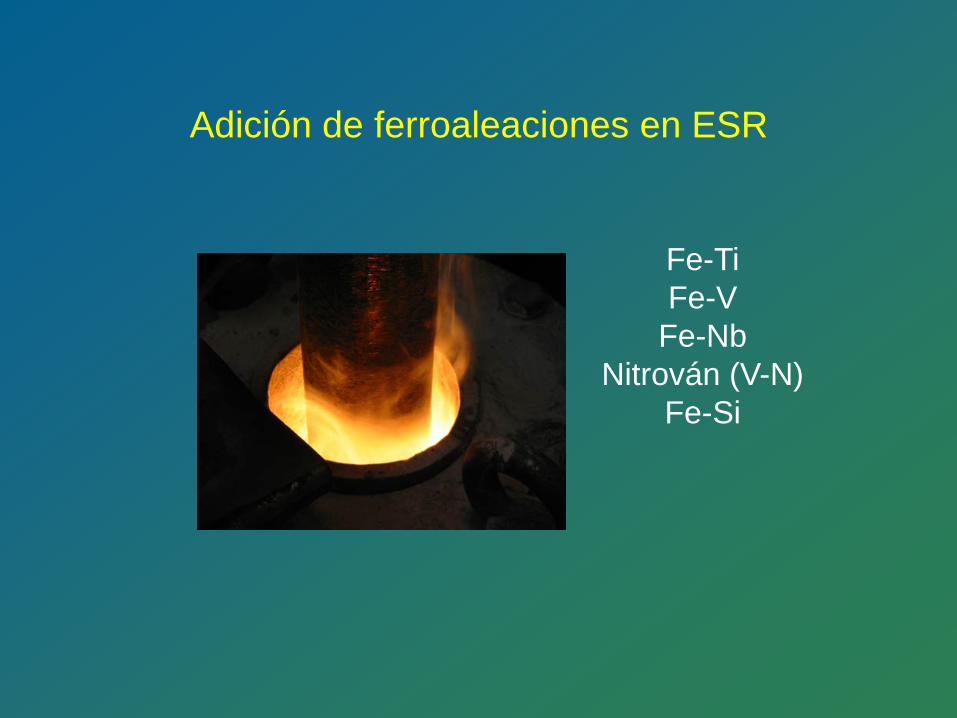
Adición de ferroaleaciones en ESR
Fe-Ti Fe-V
Fe-Nb Nitrován (V-N)
Fe-Si
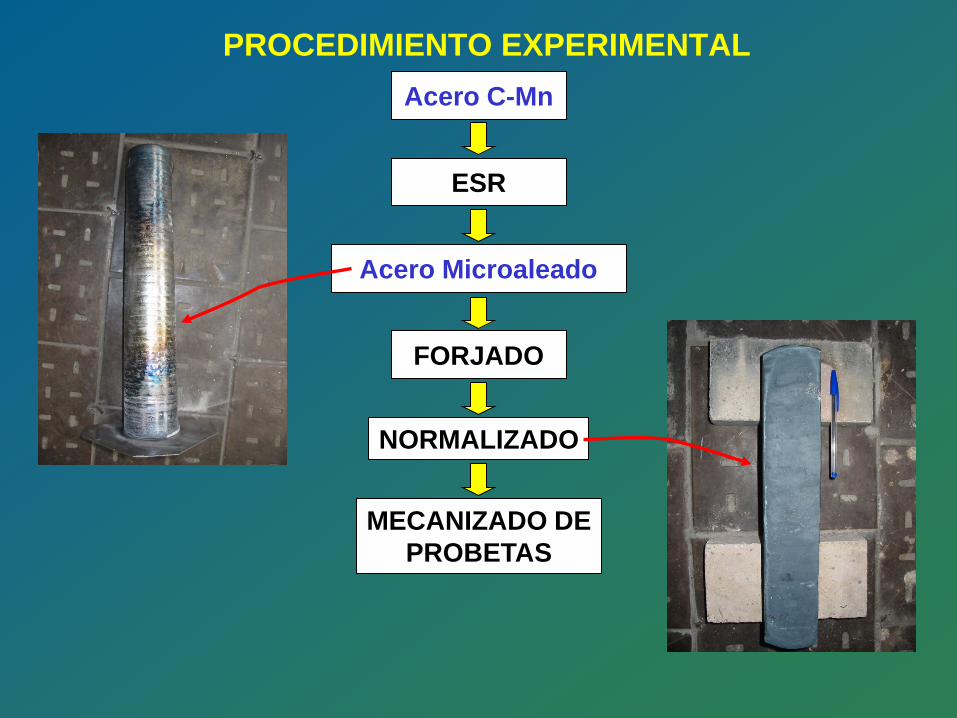
PROCEDIMIENTO EXPERIMENTAL Acero C-Mn
ESR
Acero Microaleado
FORJADO
MECANIZADO DE PROBETAS
NORMALIZADO
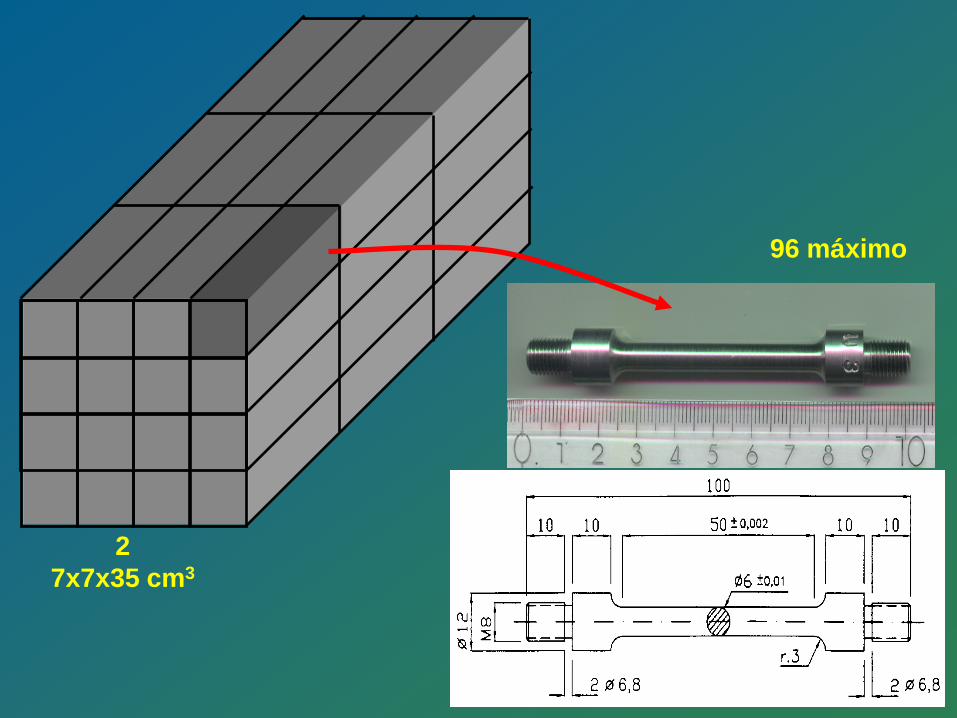
2 7x7x35 cm3
96 máximo
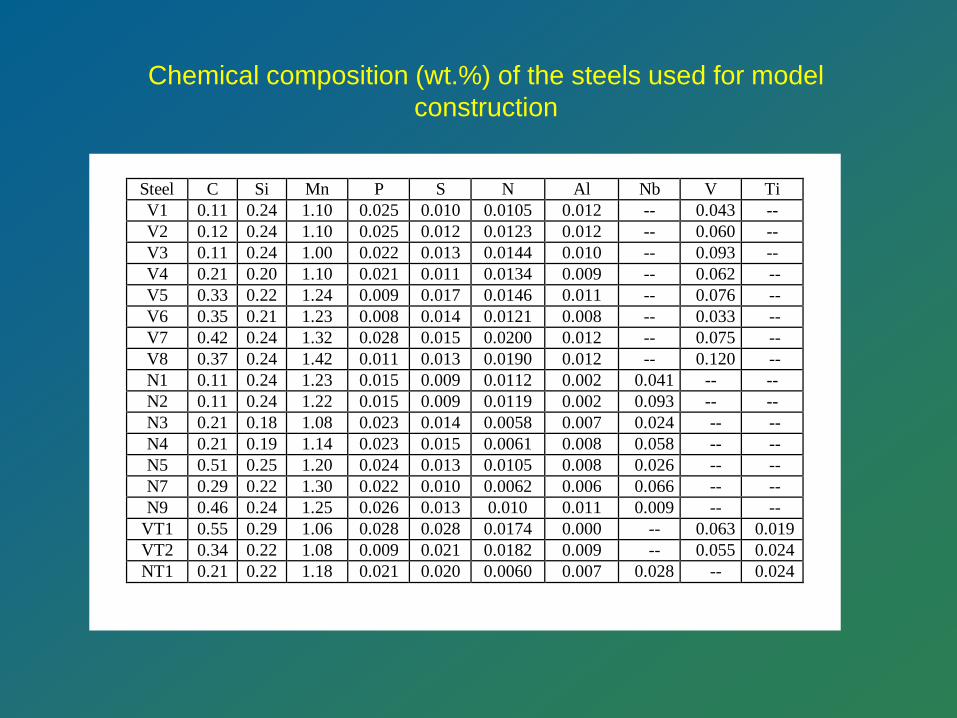
Chemical composition (wt.%) of the steels used for model construction
Steel C Si Mn P S N Al Nb V Ti V1 0.11 0.24 1.10 0.025 0.010 0.0105 0.012 -- 0.043 -- V2 0.12 0.24 1.10 0.025 0.012 0.0123 0.012 -- 0.060 -- V3 0.11 0.24 1.00 0.022 0.013 0.0144 0.010 -- 0.093 -- V4 0.21 0.20 1.10 0.021 0.011 0.0134 0.009 -- 0.062 -- V5 0.33 0.22 1.24 0.009 0.017 0.0146 0.011 -- 0.076 -- V6 0.35 0.21 1.23 0.008 0.014 0.0121 0.008 -- 0.033 -- V7 0.42 0.24 1.32 0.028 0.015 0.0200 0.012 -- 0.075 -- V8 0.37 0.24 1.42 0.011 0.013 0.0190 0.012 -- 0.120 -- N1 0.11 0.24 1.23 0.015 0.009 0.0112 0.002 0.041 -- -- N2 0.11 0.24 1.22 0.015 0.009 0.0119 0.002 0.093 -- -- N3 0.21 0.18 1.08 0.023 0.014 0.0058 0.007 0.024 -- -- N4 0.21 0.19 1.14 0.023 0.015 0.0061 0.008 0.058 -- -- N5 0.51 0.25 1.20 0.024 0.013 0.0105 0.008 0.026 -- -- N7 0.29 0.22 1.30 0.022 0.010 0.0062 0.006 0.066 -- -- N9 0.46 0.24 1.25 0.026 0.013 0.010 0.011 0.009 -- --
VT1 0.55 0.29 1.06 0.028 0.028 0.0174 0.000 -- 0.063 0.019 VT2 0.34 0.22 1.08 0.009 0.021 0.0182 0.009 -- 0.055 0.024 NT1 0.21 0.22 1.18 0.021 0.020 0.0060 0.007 0.028 -- 0.024
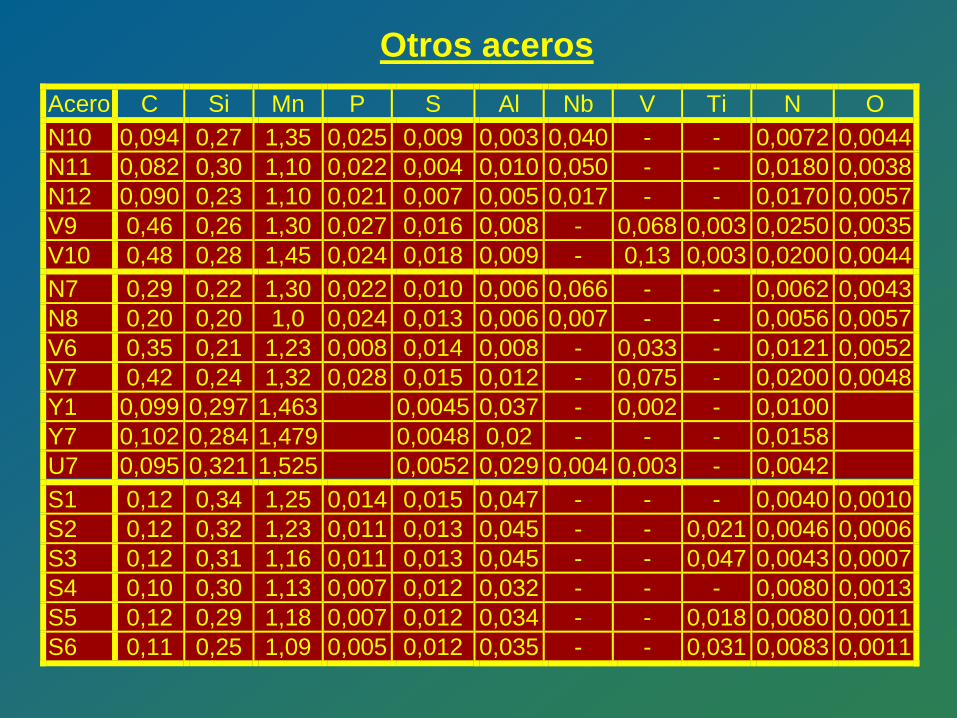
Otros aceros Acero C Si Mn P S Al Nb V Ti N O N10 0,094 0,27 1,35 0,025 0,009 0,003 0,040 - - 0,0072 0,0044 N11 0,082 0,30 1,10 0,022 0,004 0,010 0,050 - - 0,0180 0,0038 N12 0,090 0,23 1,10 0,021 0,007 0,005 0,017 - - 0,0170 0,0057 V9 0,46 0,26 1,30 0,027 0,016 0,008 - 0,068 0,003 0,0250 0,0035
V10 0,48 0,28 1,45 0,024 0,018 0,009 - 0,13 0,003 0,0200 0,0044 N7 0,29 0,22 1,30 0,022 0,010 0,006 0,066 - - 0,0062 0,0043 N8 0,20 0,20 1,0 0,024 0,013 0,006 0,007 - - 0,0056 0,0057 V6 0,35 0,21 1,23 0,008 0,014 0,008 - 0,033 - 0,0121 0,0052 V7 0,42 0,24 1,32 0,028 0,015 0,012 - 0,075 - 0,0200 0,0048 Y1 0,099 0,297 1,463 0,0045 0,037 - 0,002 - 0,0100 Y7 0,102 0,284 1,479 0,0048 0,02 - - - 0,0158 U7 0,095 0,321 1,525 0,0052 0,029 0,004 0,003 - 0,0042 S1 0,12 0,34 1,25 0,014 0,015 0,047 - - - 0,0040 0,0010 S2 0,12 0,32 1,23 0,011 0,013 0,045 - - 0,021 0,0046 0,0006 S3 0,12 0,31 1,16 0,011 0,013 0,045 - - 0,047 0,0043 0,0007 S4 0,10 0,30 1,13 0,007 0,012 0,032 - - - 0,0080 0,0013 S5 0,12 0,29 1,18 0,007 0,012 0,034 - - 0,018 0,0080 0,0011 S6 0,11 0,25 1,09 0,005 0,012 0,035 - - 0,031 0,0083 0,0011
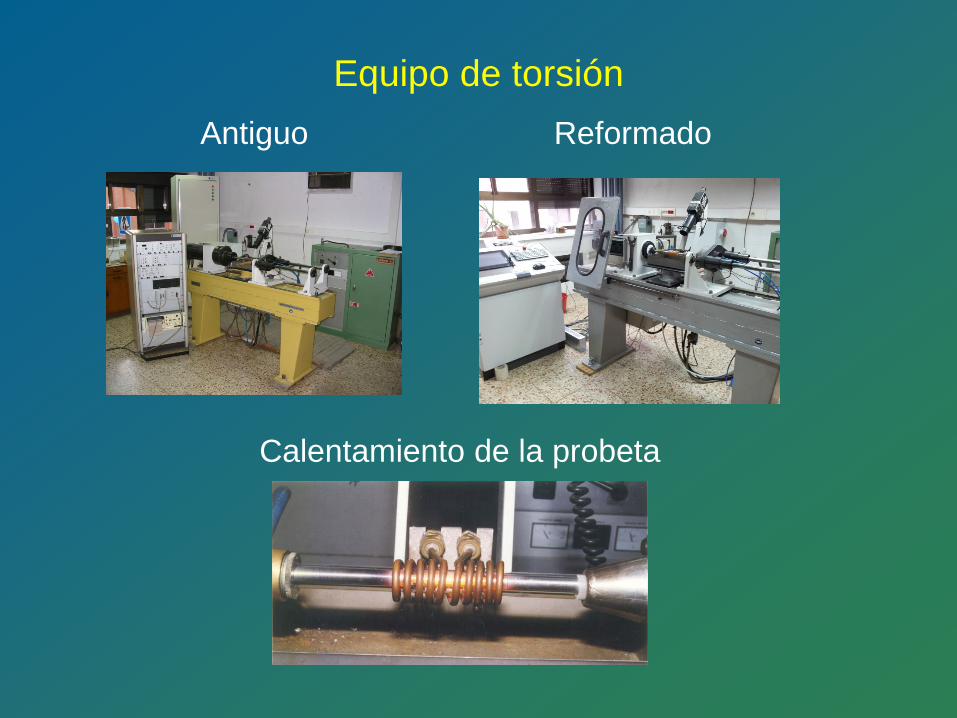
Equipo de torsión Antiguo Reformado
Calentamiento de la probeta
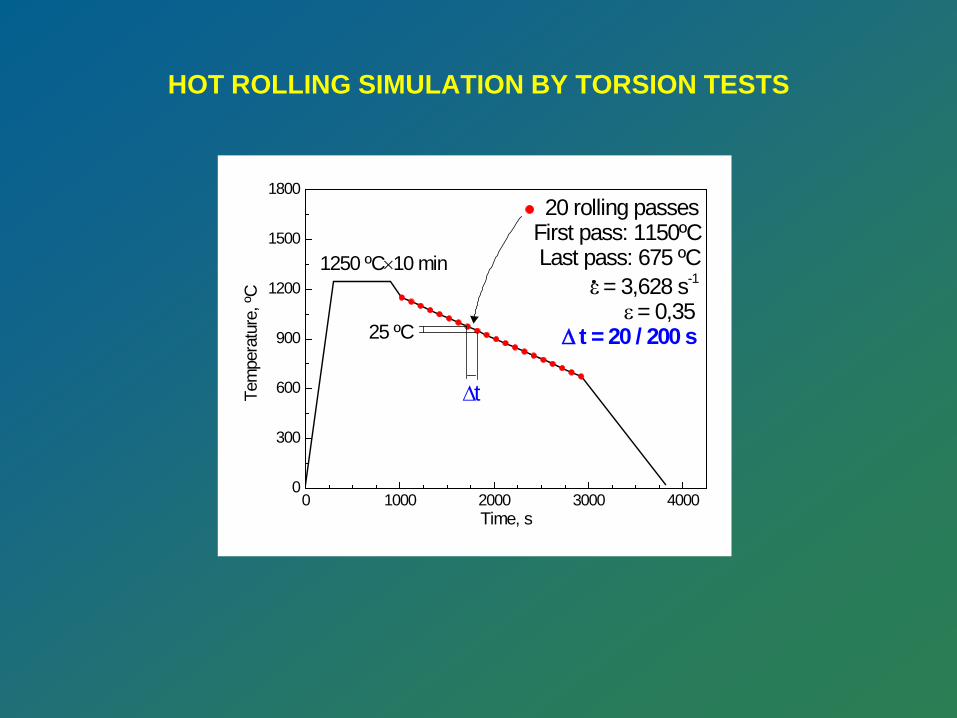
HOT ROLLING SIMULATION BY TORSION TESTS
0 1000 2000 3000 40000
300
600
900
1200
1500
1800
1250 ºC×10 min
20 rolling passesFirst pass: 1150ºC Last pass: 675 ºC ε = 3,628 s-1
ε = 0,35 ∆ t = 20 / 200 s
Tem
pera
ture
, ºC
Time, s
25 ºC
∆t
0 1 2 3 40
50
100
150
200
250
300
350
400
450Acero: V10Austenización: 1200 ºC×10 minPrimer Paso: 1150 ºCUltimo Paso: 675 ºCTiempo interpaso: 20 sε: 0,2ε: 3,63 s-1
Tens
ión
Equi
vale
nte
(MPa
)
Deformación Equivalente
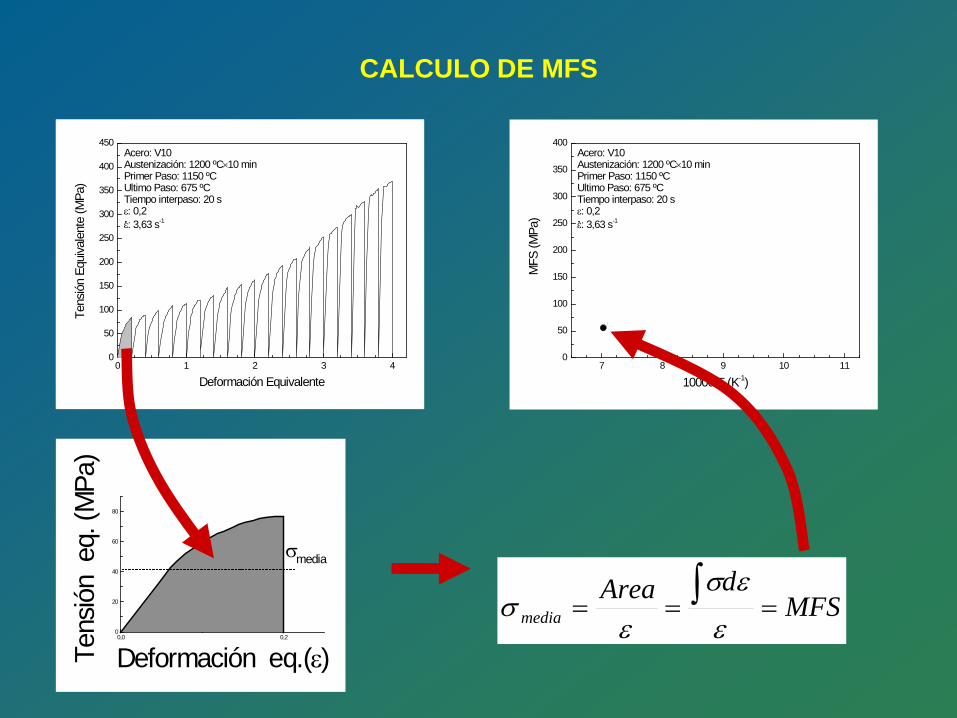
CALCULO DE MFS
0,0 0,20
20
40
60
80
σmedia
Tens
ión
eq.
(MPa
)
Deformación eq.(ε)
0 1 2 3 40
50
100
150
200
250
300
350
400
450Acero: V10Austenización: 1200 ºC×10 minPrimer Paso: 1150 ºCUltimo Paso: 675 ºCTiempo interpaso: 20 sε: 0,2ε: 3,63 s-1
Tens
ión
Equi
vale
nte
(MPa
)
Deformación Equivalente7 8 9 10 11
0
50
100
150
200
250
300
350
400
MFS
(MPa
)
10000/T (K-1)
Acero: V10Austenización: 1200 ºC×10 minPrimer Paso: 1150 ºCUltimo Paso: 675 ºCTiempo interpaso: 20 sε: 0,2ε: 3,63 s-1
MFSdArea
media === ∫ε
εσ
εσ
7 8 9 10 110
50
100
150
200
250
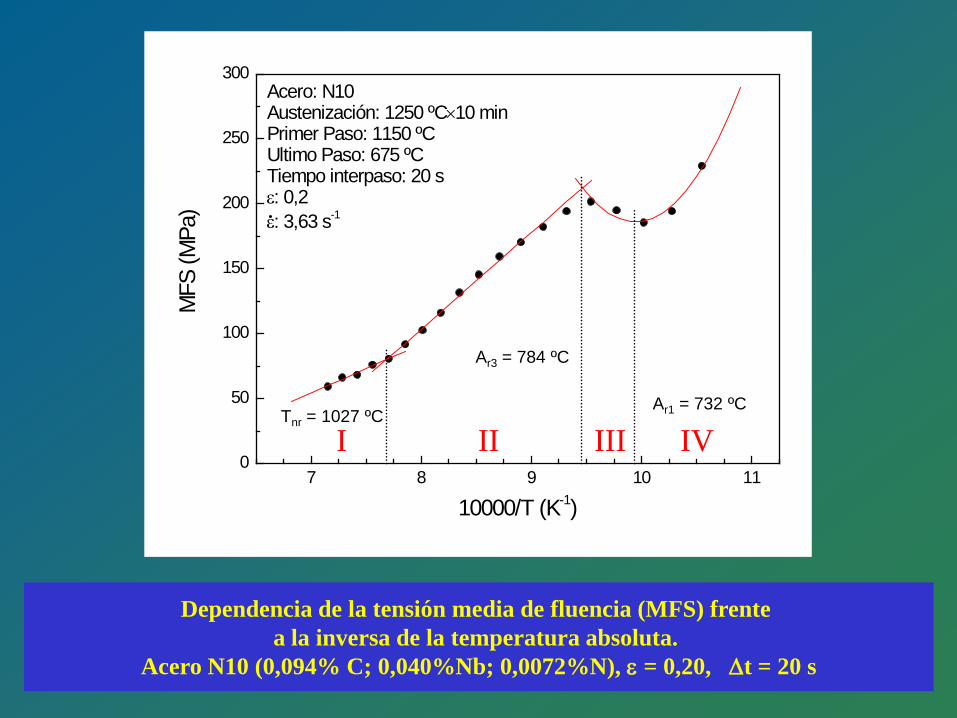
300Acero: N10Austenización: 1250 ºC×10 minPrimer Paso: 1150 ºCUltimo Paso: 675 ºCTiempo interpaso: 20 sε: 0,2ε: 3,63 s-1
MFS
(MPa
)
10000/T (K-1)
Dependencia de la tensión media de fluencia (MFS) frente a la inversa de la temperatura absoluta.
Acero N10 (0,094% C; 0,040%Nb; 0,0072%N), ε = 0,20, ∆t = 20 s
I II III Tnr = 1027 ºC
Ar3 = 784 ºC
Ar1 = 732 ºC
IV
7 8 9 10 110
50
100
150
200
250
300
350
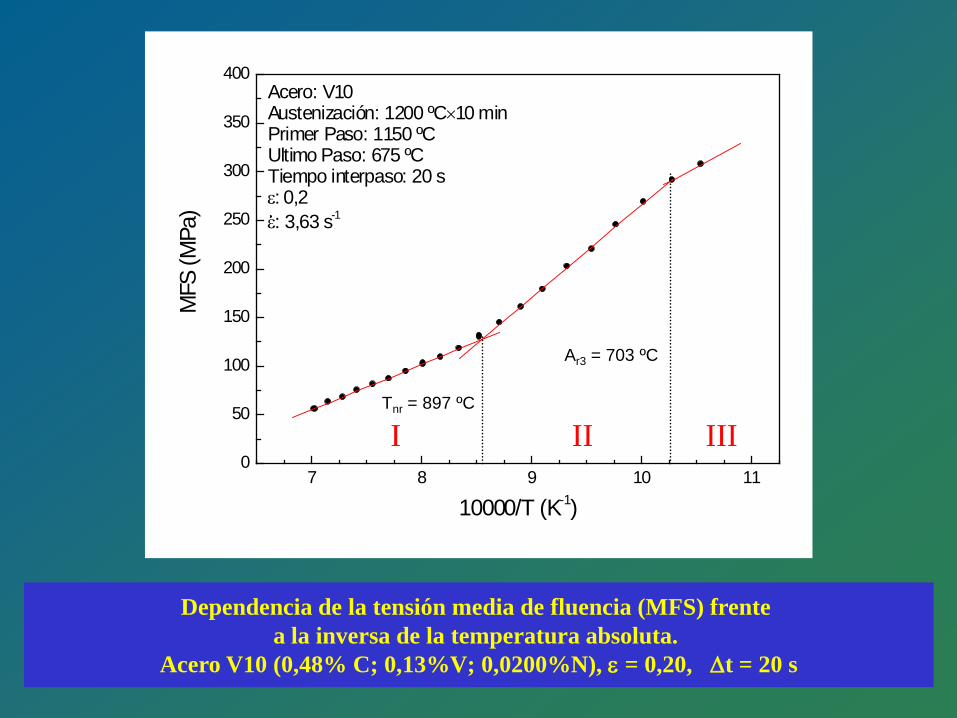
400Acero: V10Austenización: 1200 ºC×10 minPrimer Paso: 1150 ºCUltimo Paso: 675 ºCTiempo interpaso: 20 sε: 0,2ε: 3,63 s-1
MFS
(MPa
)
10000/T (K-1)
Dependencia de la tensión media de fluencia (MFS) frente a la inversa de la temperatura absoluta.
Acero V10 (0,48% C; 0,13%V; 0,0200%N), ε = 0,20, ∆t = 20 s
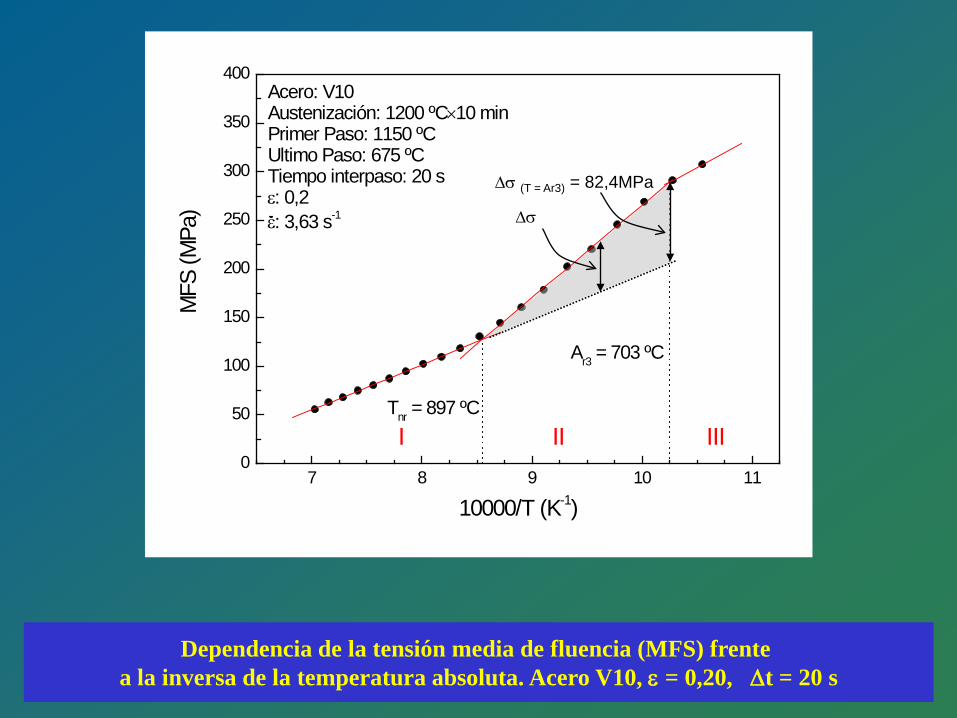
I II III Tnr = 897 ºC
Ar3 = 703 ºC
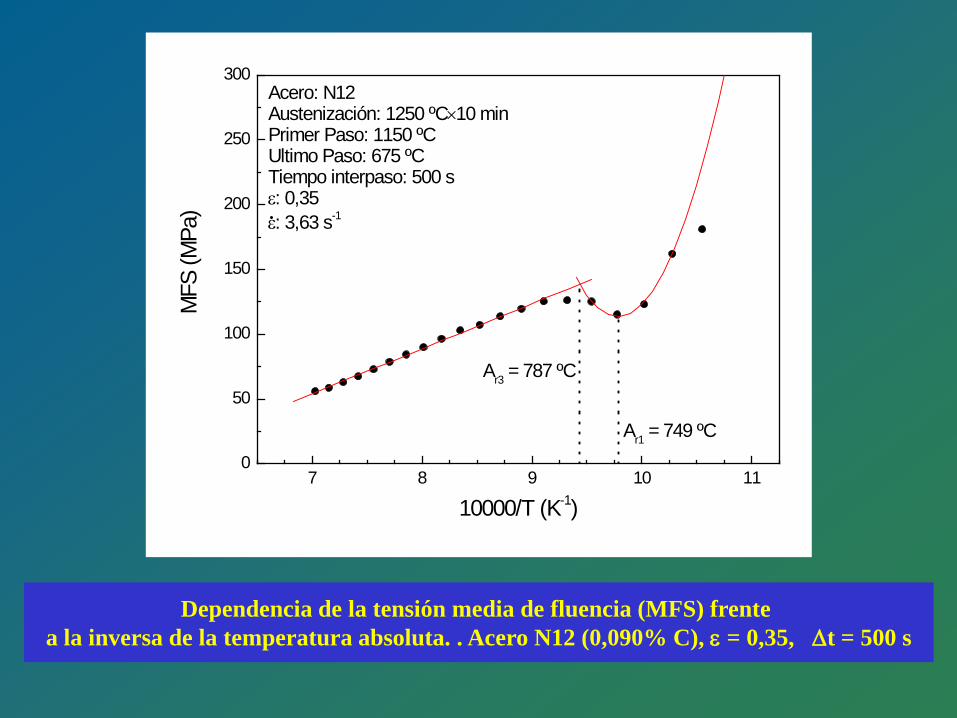
Dependencia de la tensión media de fluencia (MFS) frente a la inversa de la temperatura absoluta. . Acero N12 (0,090% C), ε = 0,35, ∆t = 500 s
7 8 9 10 110
50
100
150
200
250
300Acero: N12Austenización: 1250 ºC×10 minPrimer Paso: 1150 ºCUltimo Paso: 675 ºCTiempo interpaso: 500 sε: 0,35ε: 3,63 s-1
Ar1 = 749 ºC
Ar3 = 787 ºC
MFS
(MPa
)
10000/T (K-1)
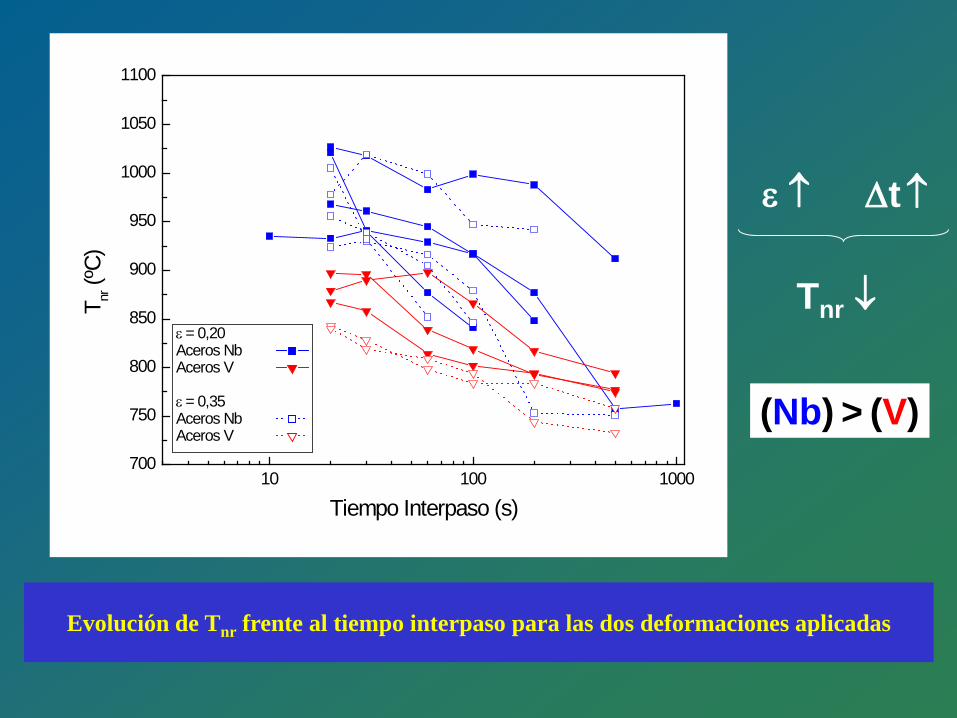
Evolución de Tnr frente al tiempo interpaso para las dos deformaciones aplicadas
10 100 1000700
750
800
850
900
950
1000
1050
1100
ε = 0,20Aceros NbAceros V
ε = 0,35Aceros NbAceros V
T nr (º
C)
Tiempo Interpaso (s)
ε ↑
Tnr ↓
∆t ↑
(Nb) > (V)
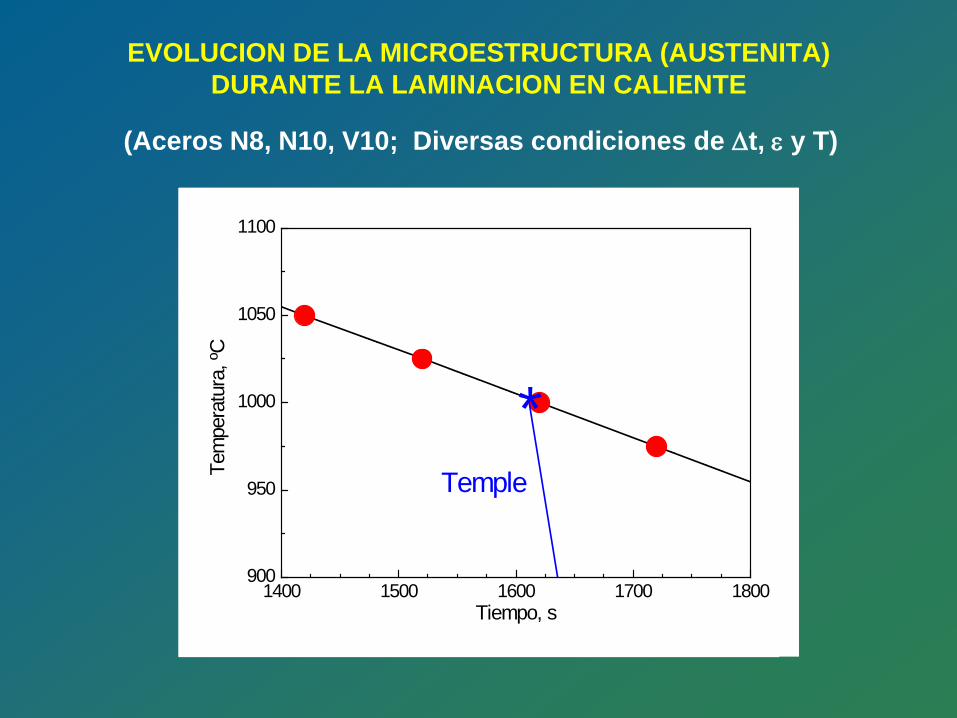
EVOLUCION DE LA MICROESTRUCTURA (AUSTENITA) DURANTE LA LAMINACION EN CALIENTE
(Aceros N8, N10, V10; Diversas condiciones de ∆t, ε y T)
0 1000 2000 3000 40000
300
600
900
1200
1500
1800
TAust ×10 min
20/21 pasos de laminación Primer paso: 1150ºC Último paso: 675/650ºC ε = 3,628 s-1
ε = 0,2 / 0,35 ∆ t = 10 - 1000 s
Tem
pera
tura
, ºC
Tiempo, s
25 ºC
∆t
Temple
1400 1500 1600 1700 1800900
950
1000
1050
1100
*TempleTe
mpe
ratu
ra, º
C
Tiempo, s
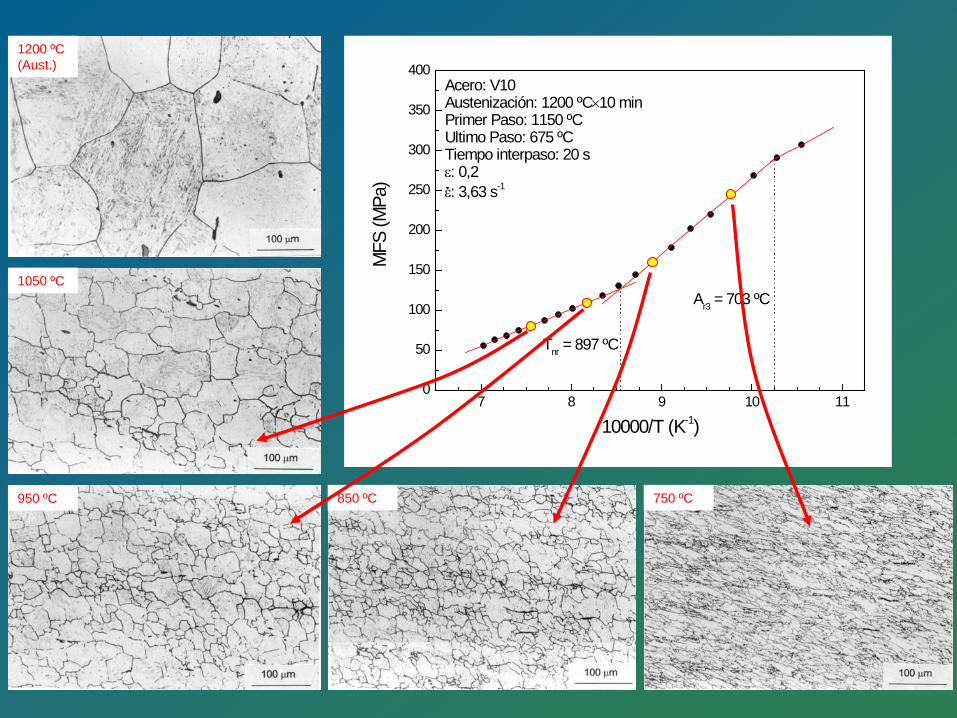
1200 ºC (Aust.)
1050 ºC
950 ºC 850 ºC 750 ºC
7 8 9 10 110
50
100
150
200
250
300
350
400Acero: V10Austenización: 1200 ºC×10 minPrimer Paso: 1150 ºCUltimo Paso: 675 ºCTiempo interpaso: 20 sε: 0,2ε: 3,63 s-1
Ar3 = 703 ºC
Tnr = 897 ºC
MFS
(MPa
)
10000/T (K-1)
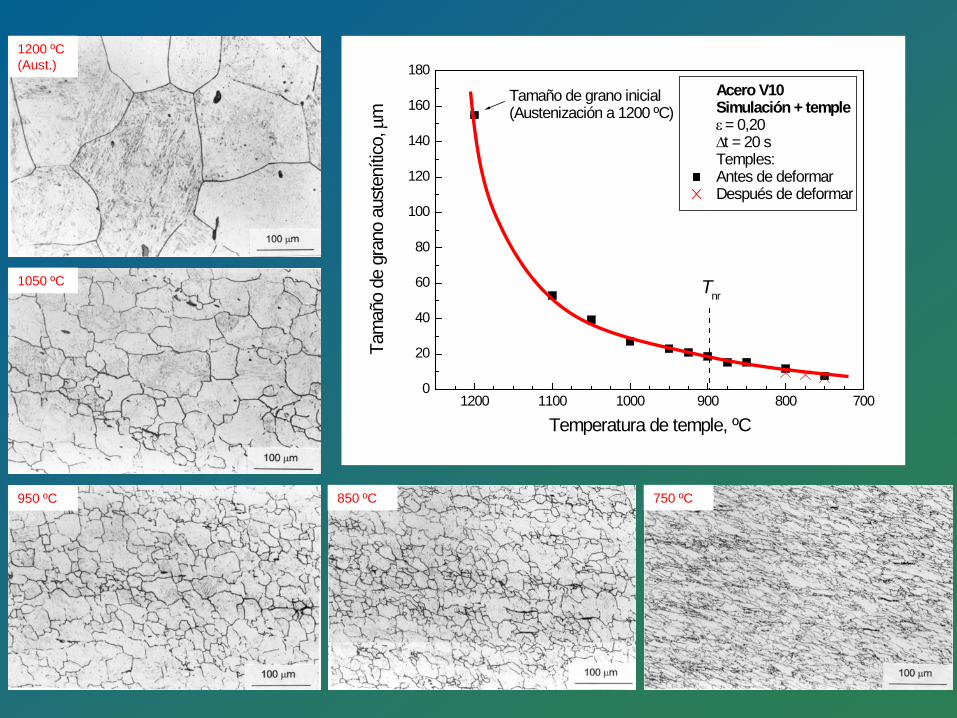
1200 1100 1000 900 800 7000
20
40
60
80
100
120
140
160
180
Tnr
Tamaño de grano inicial(Austenización a 1200 ºC)
Acero V10 Simulación + temple ε = 0,20 ∆t = 20 s Temples:
Antes de deformar Después de deformar
Tam
año
de g
rano
aus
tení
tico,
µm
Temperatura de temple, ºC
1200 ºC (Aust.)
1050 ºC
950 ºC 850 ºC 750 ºC
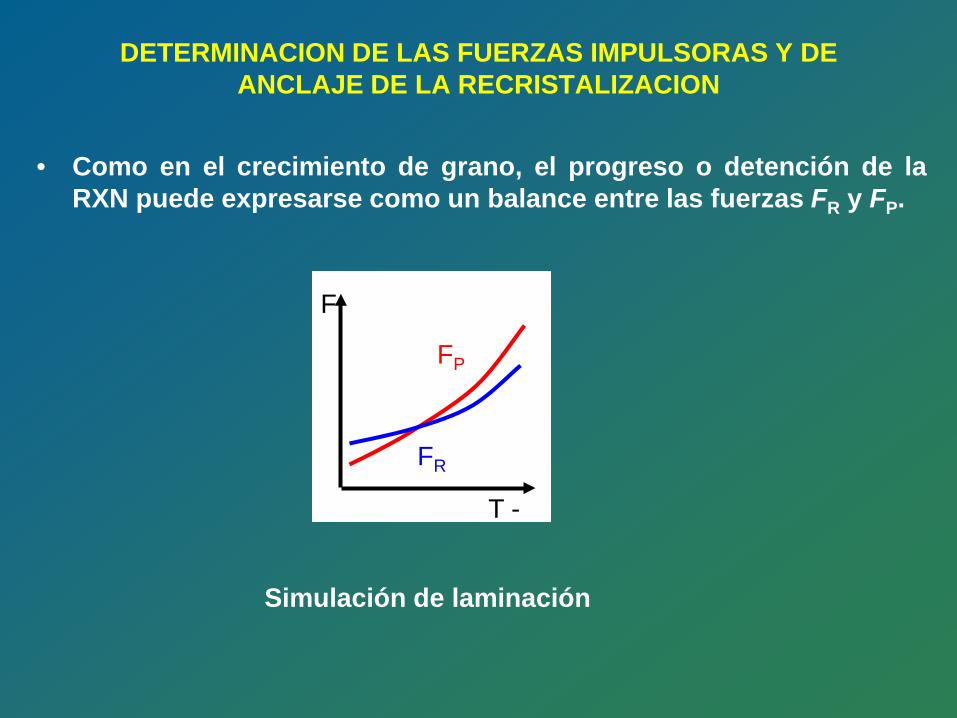
DETERMINACION DE LAS FUERZAS IMPULSORAS Y DE ANCLAJE DE LA RECRISTALIZACION
• Como en el crecimiento de grano, el progreso o detención de la RXN puede expresarse como un balance entre las fuerzas FR y FP.
FP
FR
F
T -
Simulación de laminación
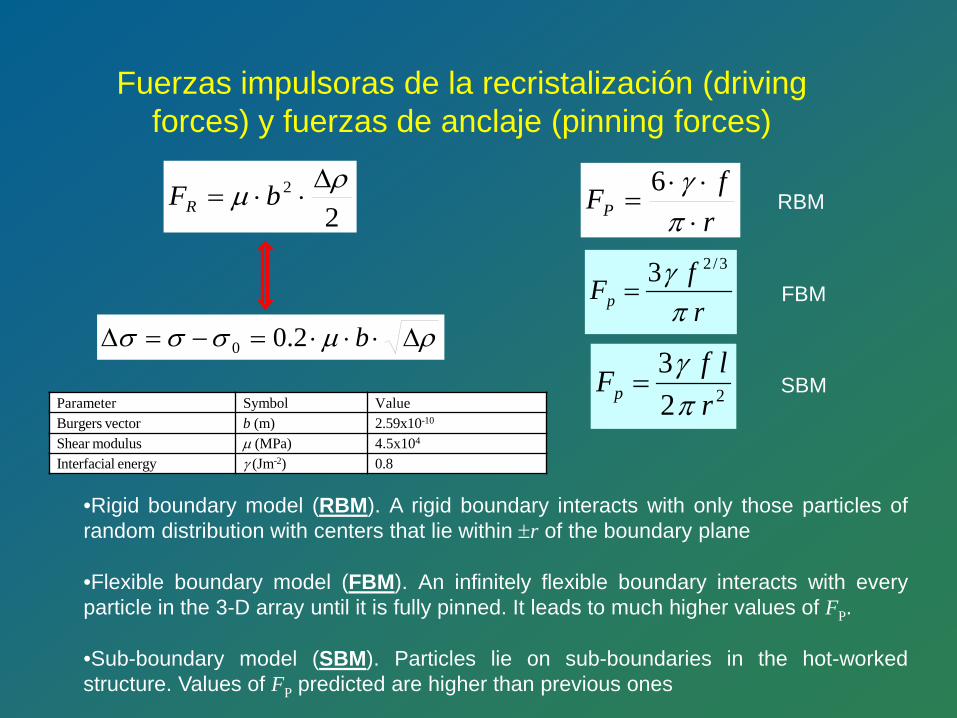
Fuerzas impulsoras de la recristalización (driving forces) y fuerzas de anclaje (pinning forces)
22 ρµ ∆
⋅⋅= bFR
ρµσσσ ∆⋅⋅⋅=−=∆ b2.00
rfFP ⋅
⋅⋅=
πγ6
Parameter Symbol Value Burgers vector b (m) 2.59x10⁻¹⁰ Shear modulus µ (MPa) 4.5x10⁴ Interfacial energy γ (Jm-2) 0.8
rfFp π
γ 3/23=
223
rlfFp π
γ=
RBM
FBM
SBM
•Rigid boundary model (RBM). A rigid boundary interacts with only those particles of random distribution with centers that lie within ±r of the boundary plane
•Flexible boundary model (FBM). An infinitely flexible boundary interacts with every particle in the 3-D array until it is fully pinned. It leads to much higher values of FP.
•Sub-boundary model (SBM). Particles lie on sub-boundaries in the hot-worked structure. Values of FP predicted are higher than previous ones
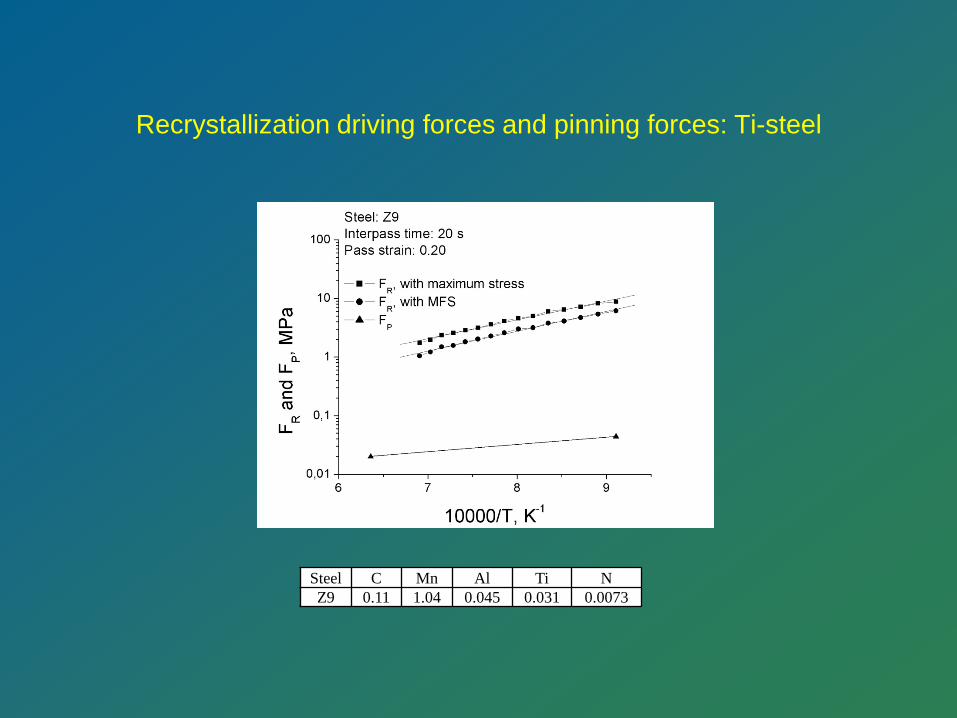
Recrystallization driving forces and pinning forces: Ti-steel
Steel C Mn Al Ti N Z9 0.11 1.04 0.045 0.031 0.0073
925 900 875 850 825 800 775 7500
5
10
15
20
25
30
35
40
45
ε = 0.35ε = 3.63 s-1
Driving (FR) and Pinning (FP) Forces for RXNMean Values
FR; ∆t = 20 s FR; ∆t = 200 s FP; ∆t = 20 s FP; ∆t = 200 s
Forc
e (M
N/m
2 )
Temperature, ºC
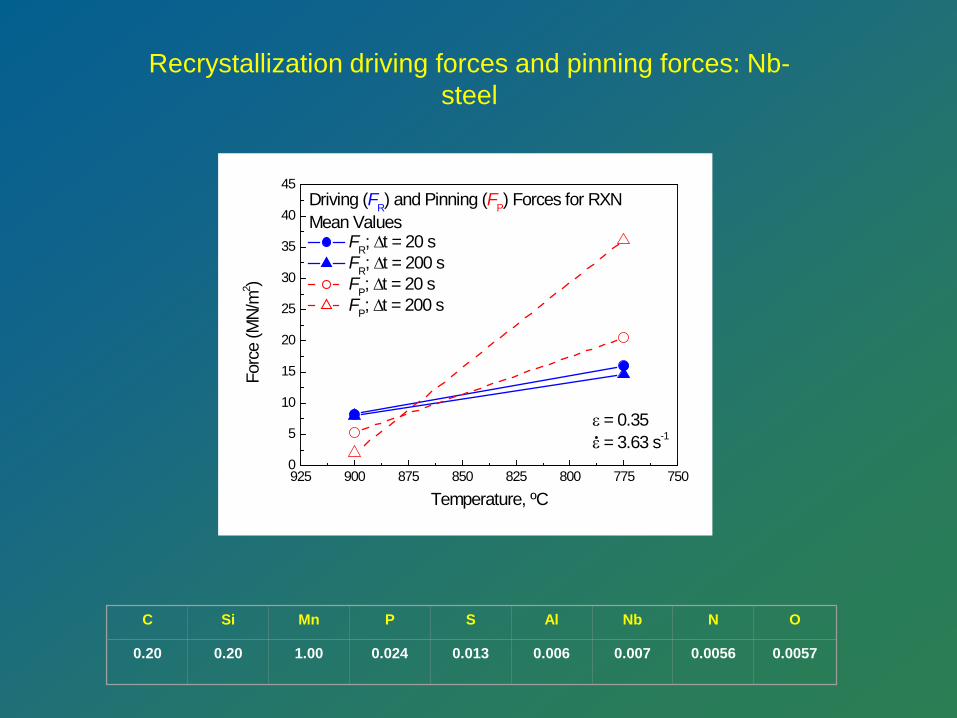
Recrystallization driving forces and pinning forces: Nb-steel
C
Si
Mn
P
S
Al
Nb
N
O
0.20 0.20
1.00
0.024
0.013
0.006
0.007 0.0056 0.0057
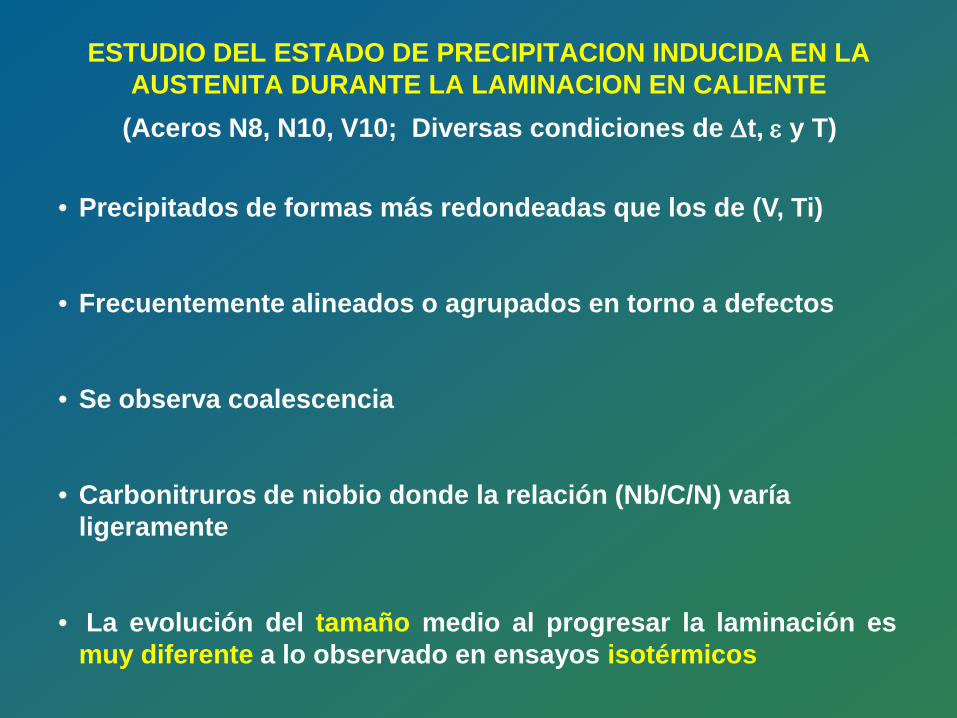
ESTUDIO DEL ESTADO DE PRECIPITACION INDUCIDA EN LA AUSTENITA DURANTE LA LAMINACION EN CALIENTE
(Aceros N8, N10, V10; Diversas condiciones de ∆t, ε y T)
• Extracción de precipitados por réplica de carbono
• Estudio por microscopia electrónica de transmisión (TEM)
Observación directa: forma, agrupamiento, abundancia o
distribución de los precipitados.
Espectros EDX: composición química cualitativa. Patrones de difracción de electrones: identificación del
sistema de cristalización y del parámetro de red.
Recuento y medición: distribución de tamaños.
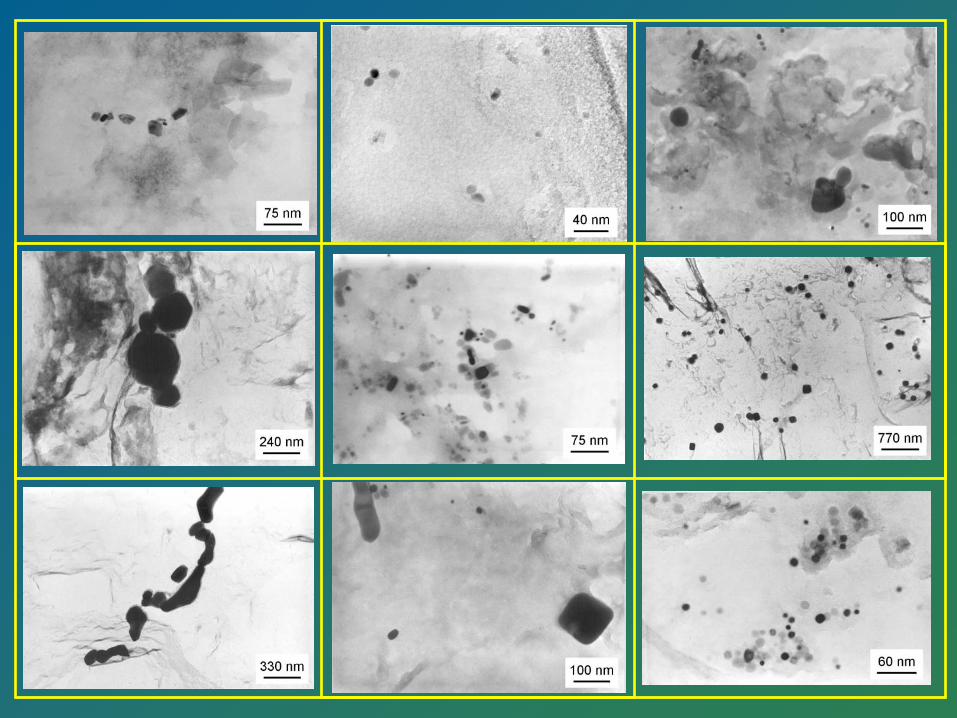
N8 ε = 0,35 ∆t = 20 s T = 950 ºC
N8 ε = 0,35 ∆t = 20 s T = 900 ºC
N8 ε = 0,35 ∆t = 200 s T = 900 ºC
N8 ε = 0,35 ∆t = 200 s T = 775ºC
N10 ε = 0,20 ∆t = 100 s T = 950 ºC
N10 ε = 0,20 ∆t = 100 s T = 875 ºC
N8 ε = 0,35 ∆t = 20 s T = 775 ºC
N10 ε = 0,20 ∆t = 100 s T = 1025 ºC
N10 ε = 0,20 ∆t = 100 s T = 825 ºC
ESTUDIO DEL ESTADO DE PRECIPITACION INDUCIDA EN LA AUSTENITA DURANTE LA LAMINACION EN CALIENTE
(Aceros N8, N10, V10; Diversas condiciones de ∆t, ε y T)
• Precipitados de formas más redondeadas que los de (V, Ti)
• Frecuentemente alineados o agrupados en torno a defectos
• Se observa coalescencia
• Carbonitruros de niobio donde la relación (Nb/C/N) varía ligeramente
• La evolución del tamaño medio al progresar la laminación es muy diferente a lo observado en ensayos isotérmicos
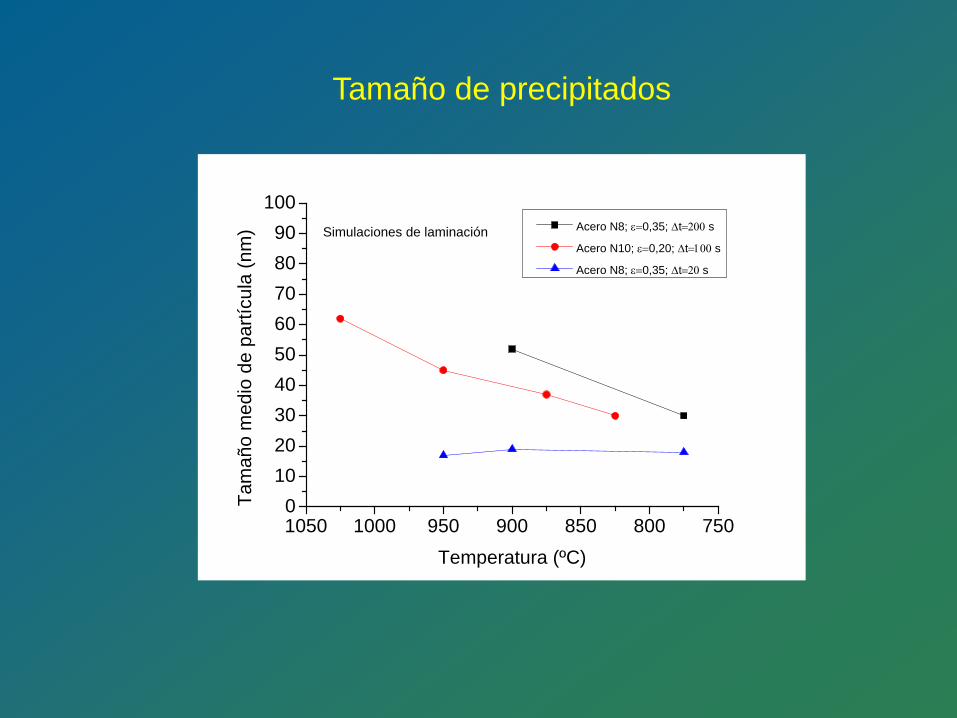
1050 1000 950 900 850 800 7500
102030405060708090
100
Tam
año
med
io d
e pa
rtícu
la (n
m)
Temperatura (ºC)
Acero N8; ε=0,35; ∆t=200 s
Acero N10; ε=0,20; ∆t=100 s
Acero N8; ε=0,35; ∆t=20 s
Simulaciones de laminación
Tamaño de precipitados
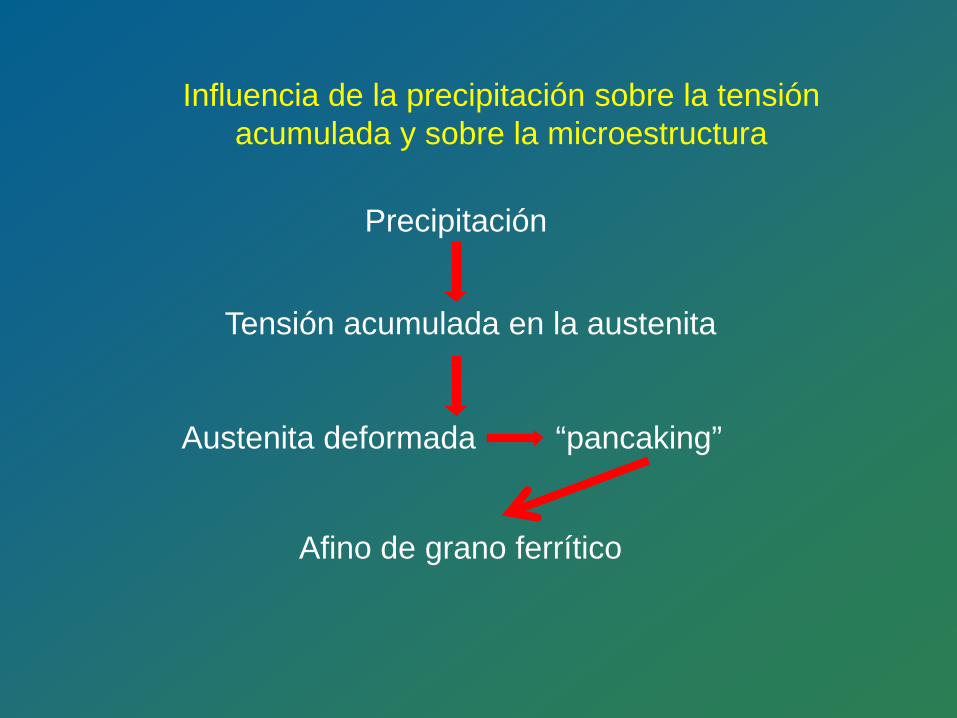
Influencia de la precipitación sobre la tensión acumulada y sobre la microestructura
Tensión acumulada en la austenita
Precipitación
Austenita deformada “pancaking”
Afino de grano ferrítico
7 8 9 10 110
50
100
150
200
250
300
350
400
I II III
Acero: V10Austenización: 1200 ºC×10 minPrimer Paso: 1150 ºCUltimo Paso: 675 ºCTiempo interpaso: 20 sε: 0,2ε: 3,63 s-1
Ar3 = 703 ºC
Tnr = 897 ºC
MFS
(MPa
)
10000/T (K-1)
Dependencia de la tensión media de fluencia (MFS) frente a la inversa de la temperatura absoluta. Acero V10, ε = 0,20, ∆t = 20 s
∆σ
∆σ (T = Ar3) = 82,4MPa
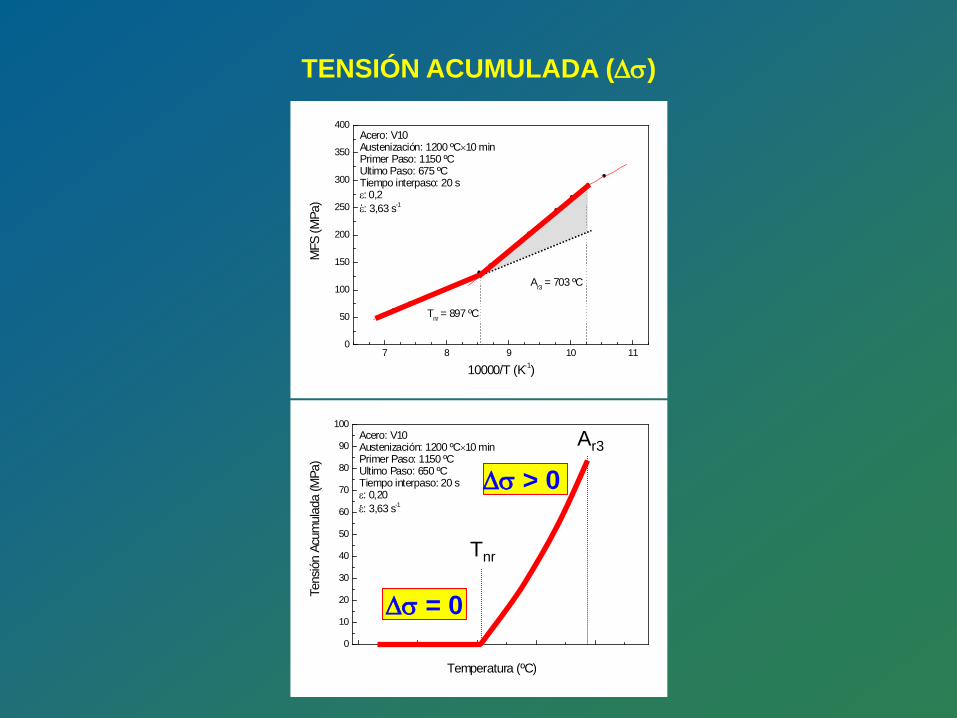
TENSIÓN ACUMULADA (∆σ)
7 8 9 10 110
50
100
150
200
250
300
350
400Acero: V10Austenización: 1200 ºC×10 minPrimer Paso: 1150 ºCUltimo Paso: 675 ºCTiempo interpaso: 20 sε: 0,2ε: 3,63 s-1
Ar3 = 703 ºC
Tnr = 897 ºCM
FS (M
Pa)
10000/T (K-1)
0
10
20
30
40
50
60
70
80
90
100
Tens
ión
Acum
ulad
a (M
Pa)
Temperatura (ºC)
Acero: V10Austenización: 1200 ºC×10 minPrimer Paso: 1150 ºCUltimo Paso: 650 ºCTiempo interpaso: 20 sε: 0,20ε: 3,63 s-1
Tnr
Ar3
∆σ = 0
∆σ > 0
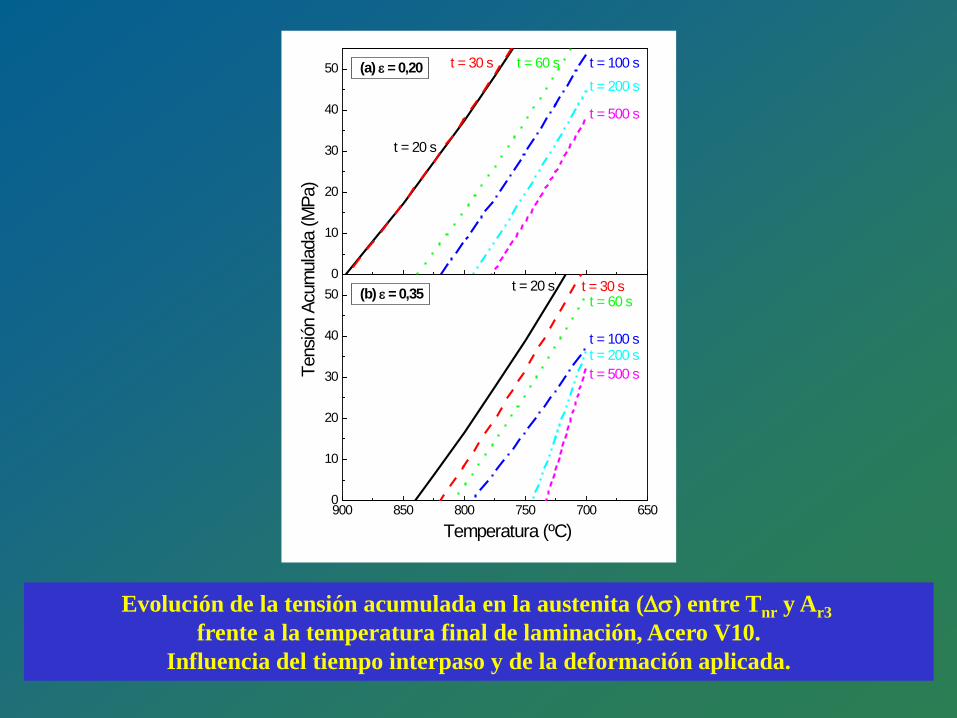
Evolución de la tensión acumulada en la austenita (∆σ) entre Tnr y Ar3 frente a la temperatura final de laminación, Acero V10.
Influencia del tiempo interpaso y de la deformación aplicada.
900 850 800 750 700 6500
10
20
30
40
500
10
20
30
40
50
Temperatura (ºC)
(b) ε = 0,35 t = 20 s t = 30 st = 60 s
t = 100 st = 200 st = 500 sTe
nsió
n Ac
umul
ada
(MPa
)
(a) ε = 0,20
t = 20 s
t = 30 s t = 60 s t = 100 st = 200 s
t = 500 s
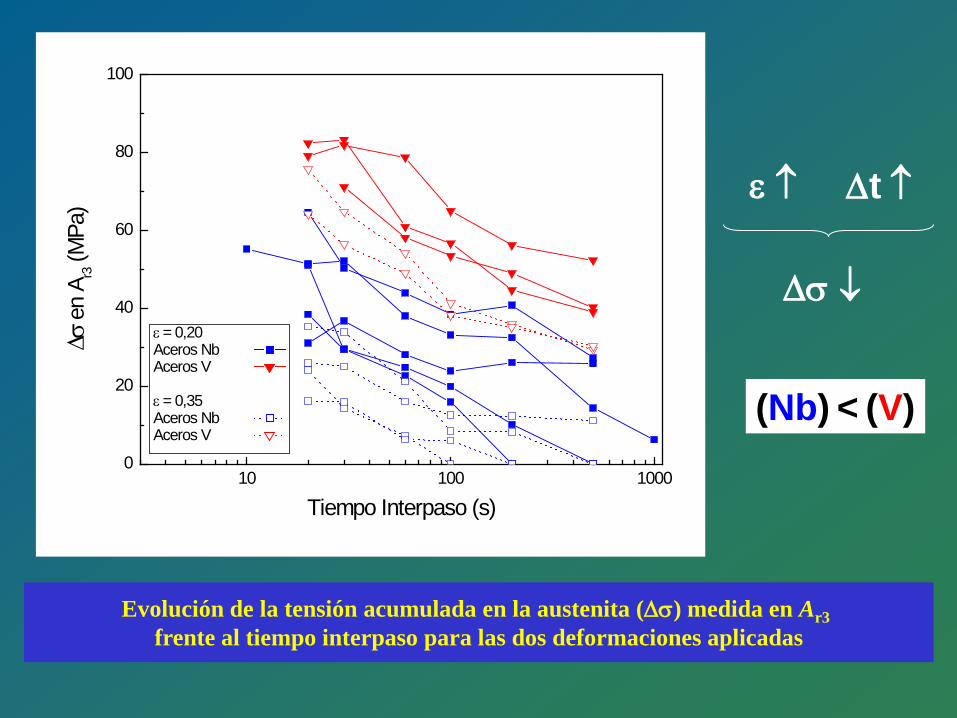
Evolución de la tensión acumulada en la austenita (∆σ) medida en Ar3 frente al tiempo interpaso para las dos deformaciones aplicadas
10 100 10000
20
40
60
80
100
ε = 0,20Aceros NbAceros V
ε = 0,35Aceros NbAceros V
∆σ e
n A r3
(MPa
)
Tiempo Interpaso (s)
ε ↑
∆σ ↓
∆t ↑
(Nb) < (V)
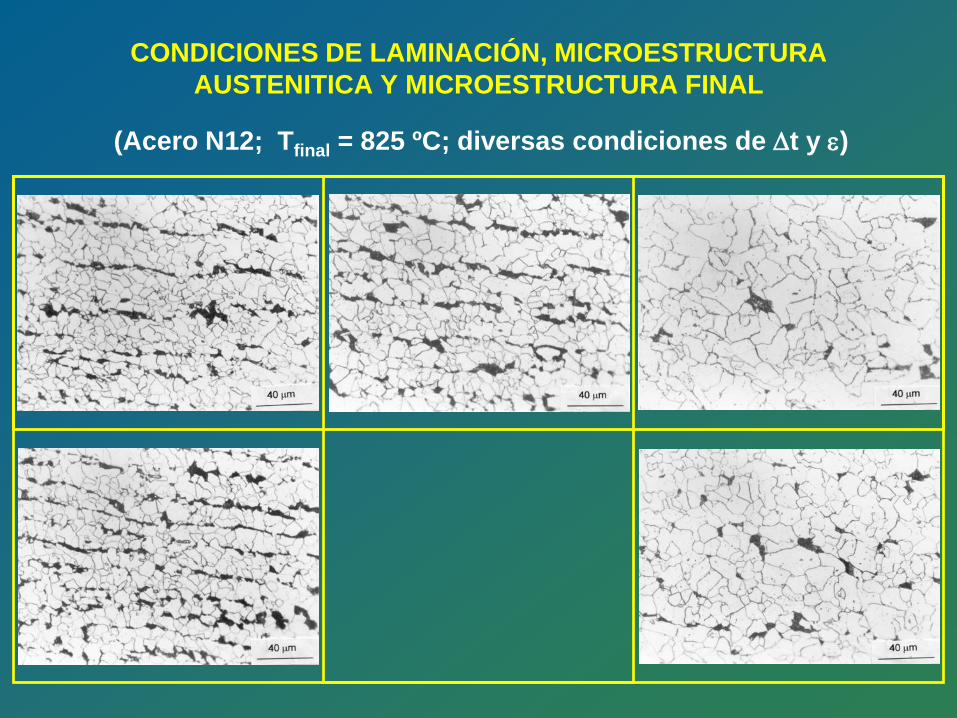
N12 ε = 0,20 ∆t = 20 s
N12 ε = 0,35 ∆t = 20 s
N12 ε = 0,20 ∆t = 100 s
N12 ε = 0,20 ∆t = 500 s
N12 ε = 0,35 ∆t = 500 s
CONDICIONES DE LAMINACIÓN, MICROESTRUCTURA AUSTENITICA Y MICROESTRUCTURA FINAL
(Acero N12; Tfinal = 825 ºC; diversas condiciones de ∆t y ε)
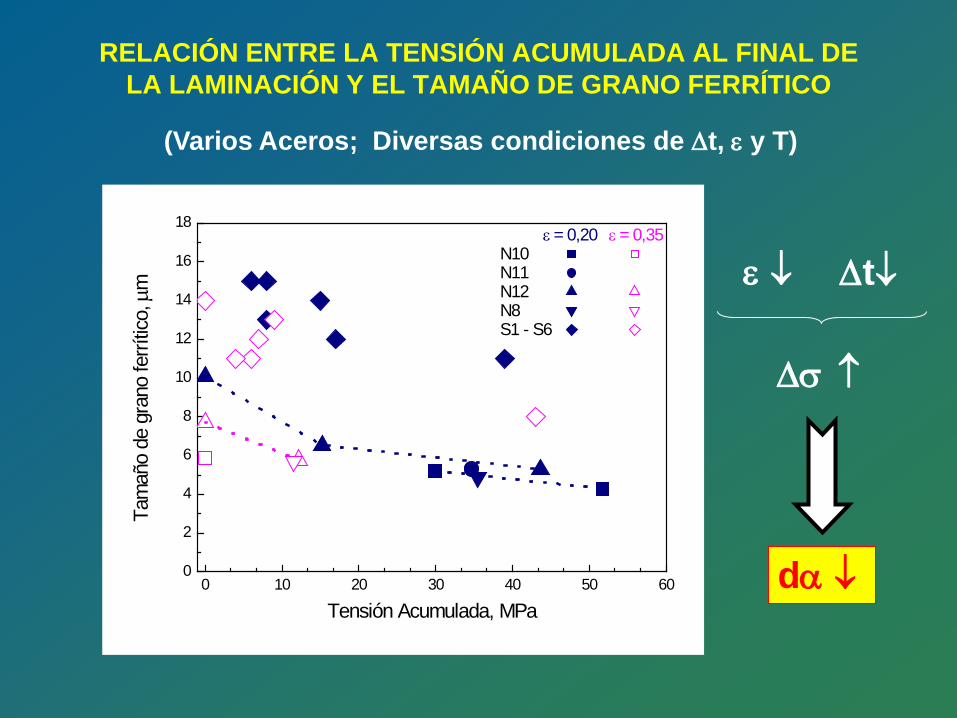
RELACIÓN ENTRE LA TENSIÓN ACUMULADA AL FINAL DE LA LAMINACIÓN Y EL TAMAÑO DE GRANO FERRÍTICO
(Varios Aceros; Diversas condiciones de ∆t, ε y T)
ε ↓
∆σ ↑
dα ↓
∆t↓
0 10 20 30 40 50 600
2
4
6
8
10
12
14
16
18 ε = 0,20 ε = 0,35N10 N11 N12 N8 S1 - S6
Tam
año
de g
rano
ferrí
tico,
µm
Tensión Acumulada, MPa
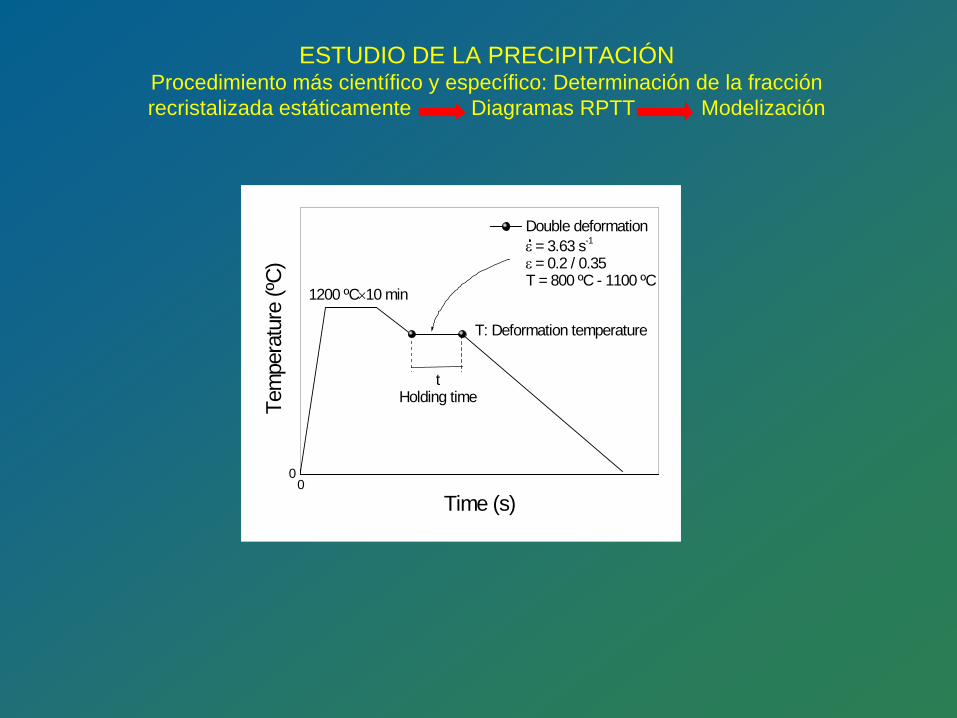
ESTUDIO DE LA PRECIPITACIÓN Procedimiento más científico y específico: Determinación de la fracción recristalizada estáticamente Diagramas RPTT Modelización
00
T: Deformation temperature
tHolding time
1200 ºC×10 minTe
mpe
ratu
re (º
C)
Time (s)
Double deformation ε = 3.63 s-1
ε = 0.2 / 0.35 T = 800 ºC - 1100 ºC
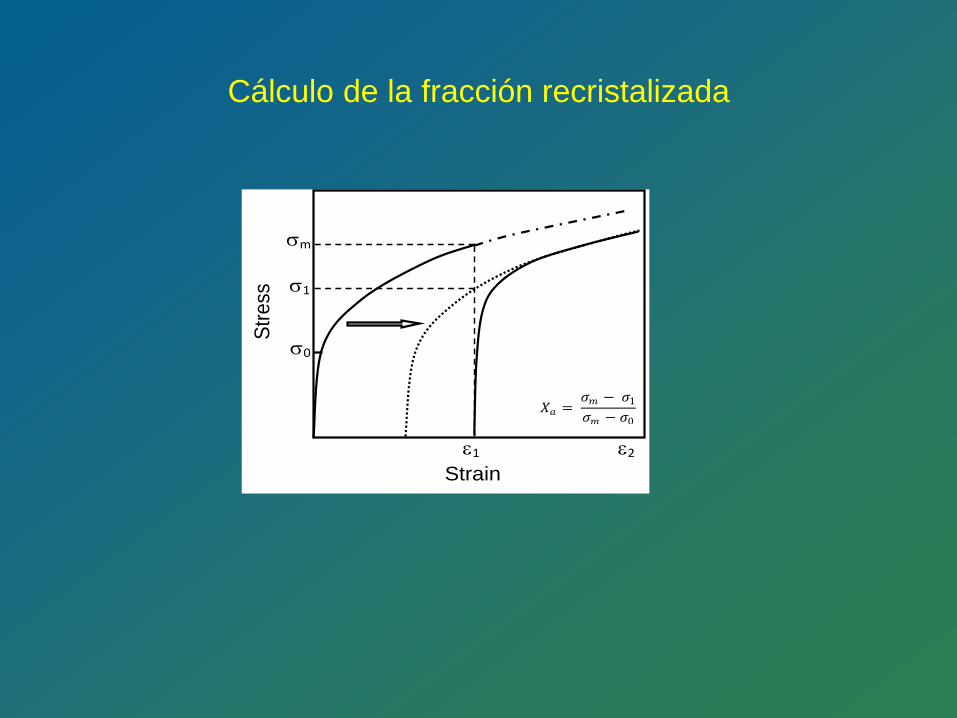
Cálculo de la fracción recristalizada
ε1 ε2
σ1
σm
σ0
Strain
Stre
ss
𝑋𝑋𝑎𝑎 = 𝜎𝜎𝑚𝑚 − 𝜎𝜎1
𝜎𝜎𝑚𝑚 − 𝜎𝜎0
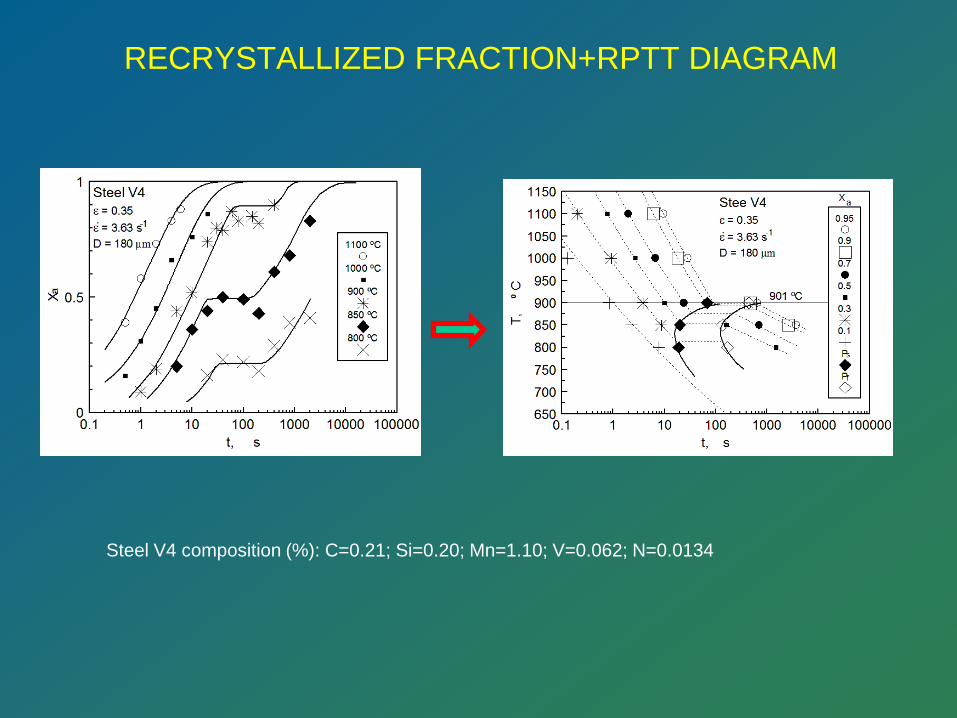
RECRYSTALLIZED FRACTION+RPTT DIAGRAM
Steel V4 composition (%): C=0.21; Si=0.20; Mn=1.10; V=0.062; N=0.0134
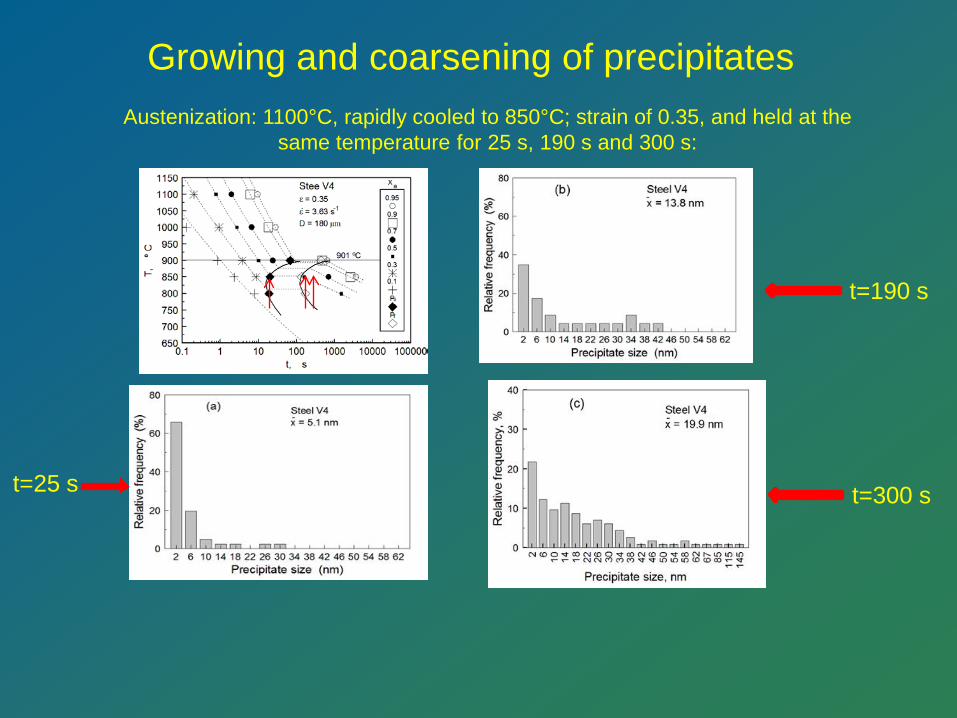
Growing and coarsening of precipitates Austenization: 1100°C, rapidly cooled to 850°C; strain of 0.35, and held at the
same temperature for 25 s, 190 s and 300 s:
t=25 s
t=190 s
t=300 s
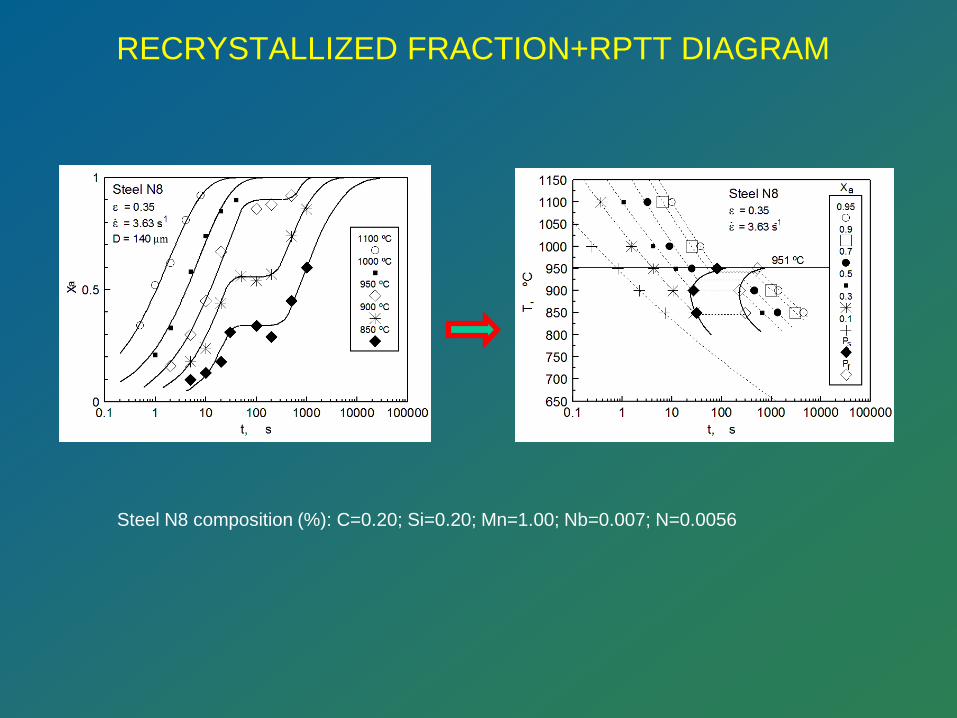
RECRYSTALLIZED FRACTION+RPTT DIAGRAM
Steel N8 composition (%): C=0.20; Si=0.20; Mn=1.00; Nb=0.007; N=0.0056
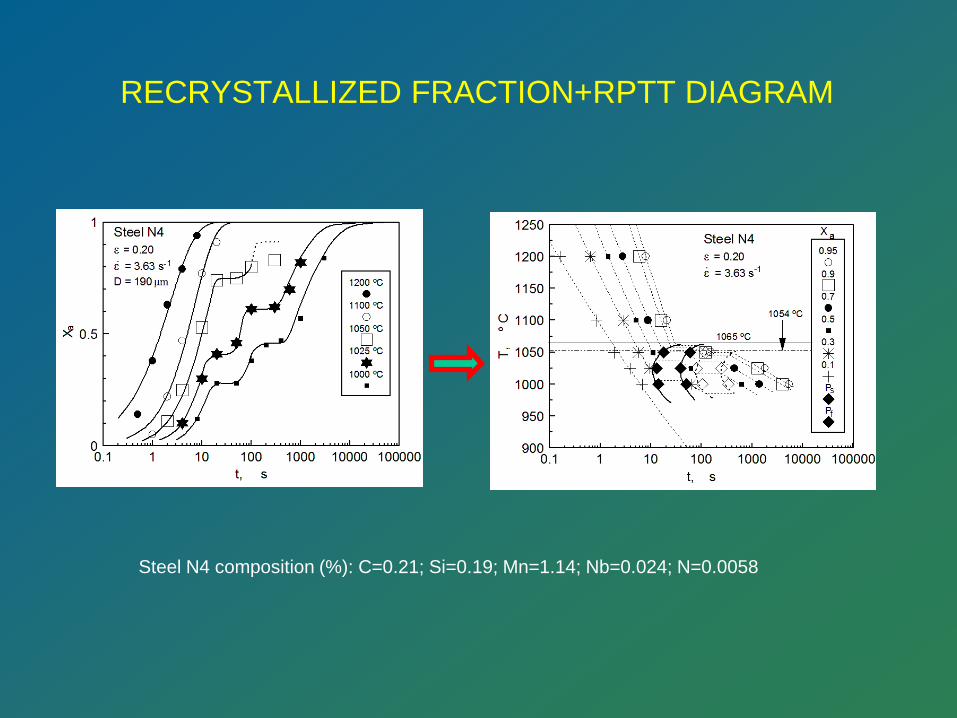
RECRYSTALLIZED FRACTION+RPTT DIAGRAM
Steel N4 composition (%): C=0.21; Si=0.19; Mn=1.14; Nb=0.024; N=0.0058
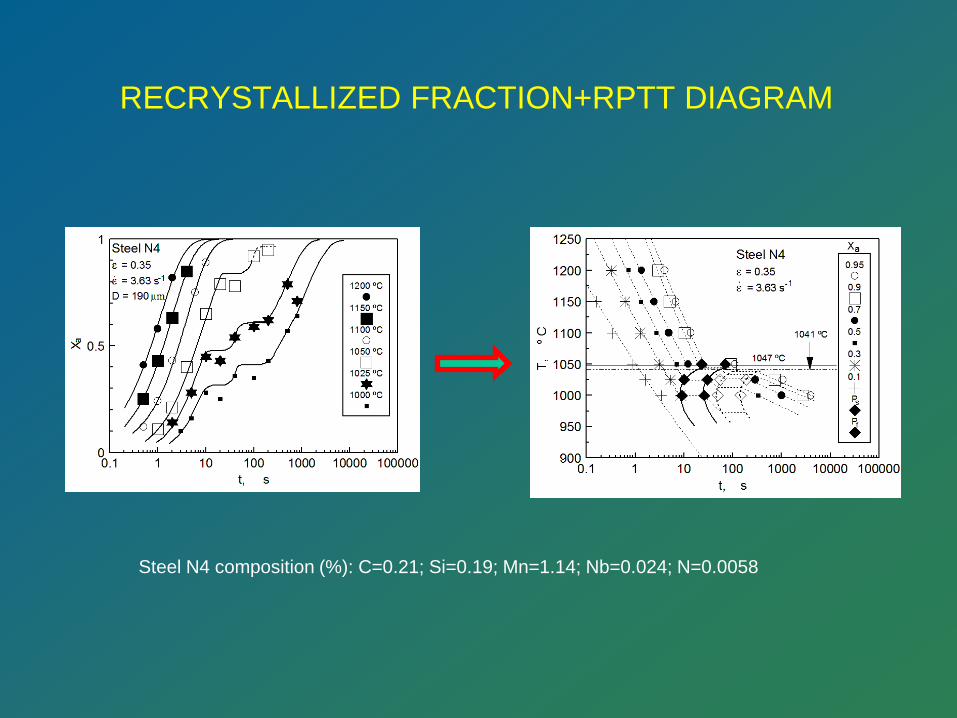
RECRYSTALLIZED FRACTION+RPTT DIAGRAM
Steel N4 composition (%): C=0.21; Si=0.19; Mn=1.14; Nb=0.024; N=0.0058
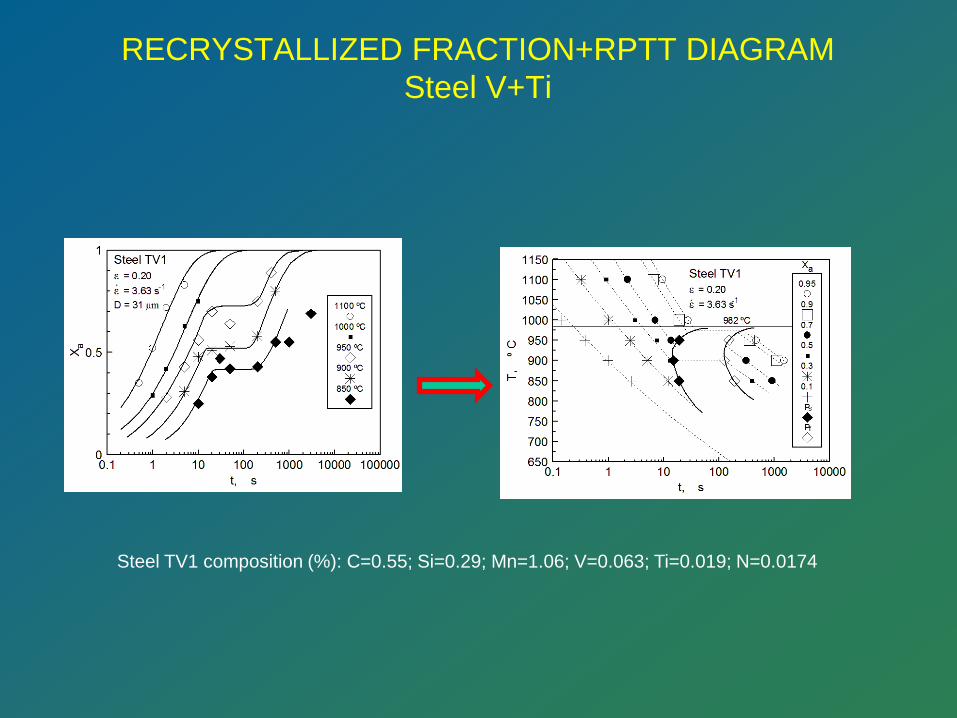
RECRYSTALLIZED FRACTION+RPTT DIAGRAM Steel V+Ti
Steel TV1 composition (%): C=0.55; Si=0.29; Mn=1.06; V=0.063; Ti=0.019; N=0.0174
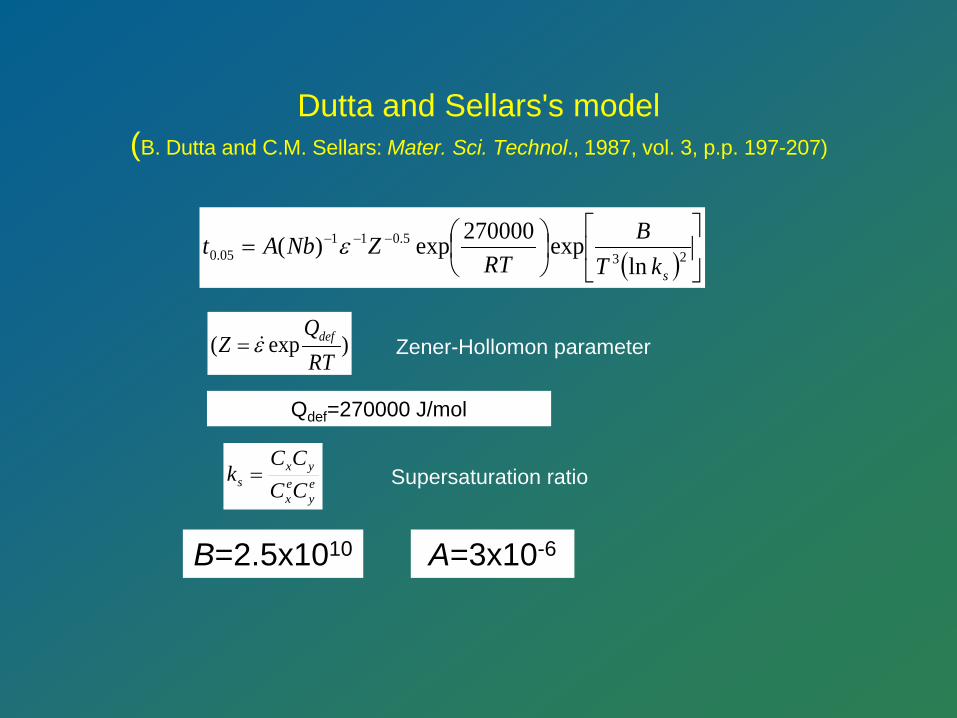
Dutta and Sellars's model (B. Dutta and C.M. Sellars: Mater. Sci. Technol., 1987, vol. 3, p.p. 197-207)
( )
= −−−
235.011
05.0 lnexp270000exp)(
skTB
RTZNbAt ε
)exp(RTQ
Z defε= Zener-Hollomon parameter
ey
ex
yxs CC
CCk = Supersaturation ratio
B=2.5x10¹⁰ A=3x10⁻⁶
Qdef=270000 J/mol
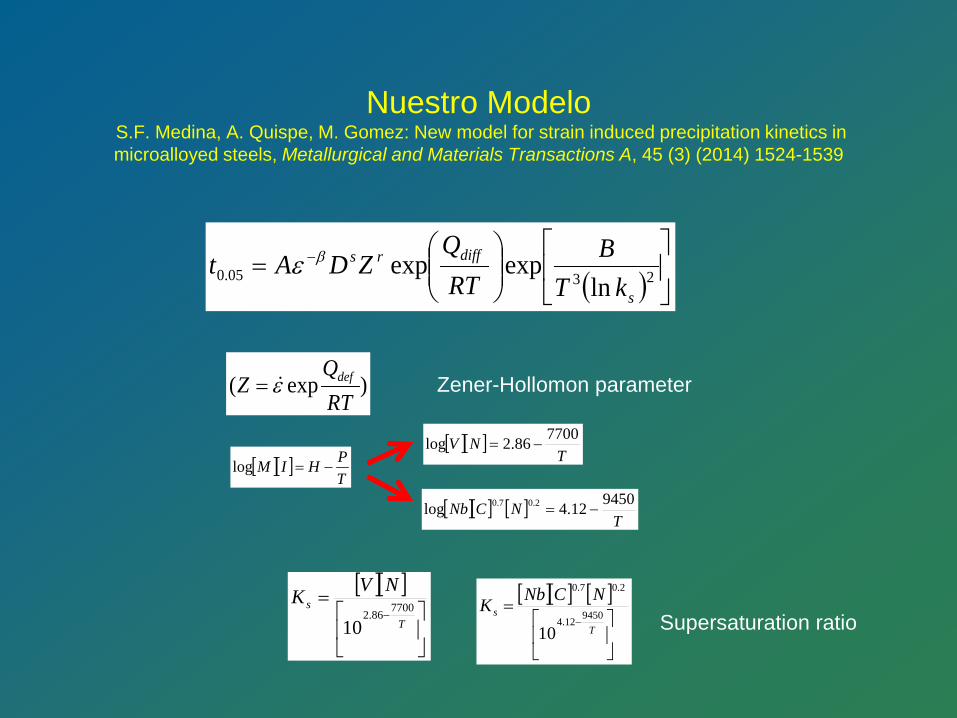
Nuestro Modelo S.F. Medina, A. Quispe, M. Gomez: New model for strain induced precipitation kinetics in microalloyed steels, Metallurgical and Materials Transactions A, 45 (3) (2014) 1524-1539
( )
= −
2305.0 lnexpexp
s
diffrs
kTB
RTQ
ZDAt βε
)exp(RTQ
Z defε=
[ ][ ] [ ]
=
−T
sNCNbK
945012.4
2.07.0
10
[ ][ ]
=
−T
sNVK770086.2
10 Supersaturation ratio
Zener-Hollomon parameter
[ ][ ]TPHIM −=log
[ ][ ]T
NV 770086.2log −=
[ ][ ] [ ]T
NCNb 945012.4log 2.07.0 −=
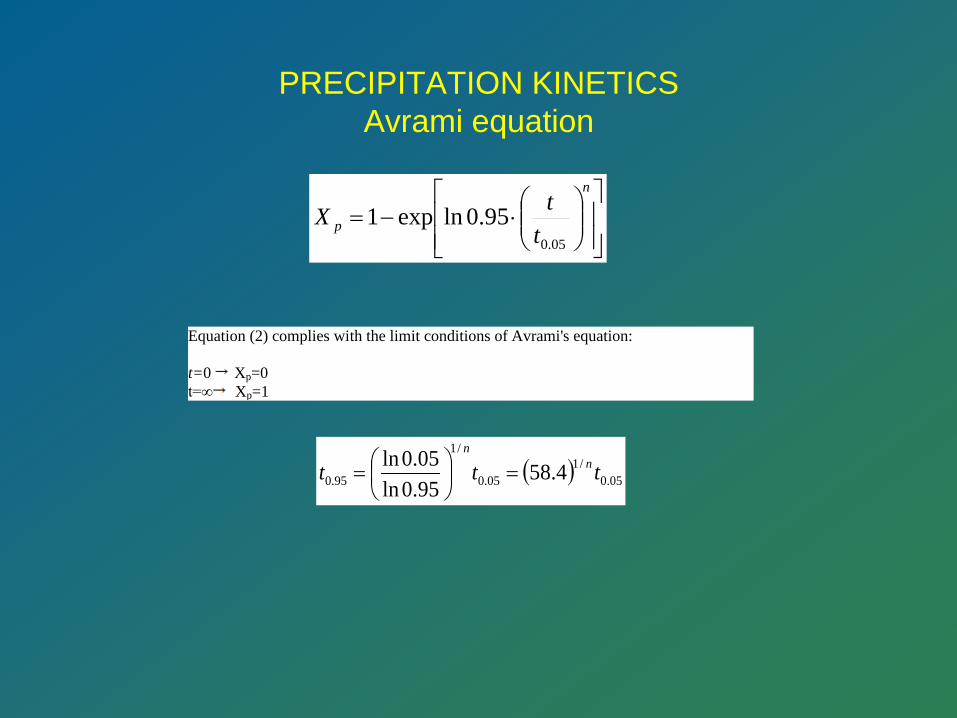
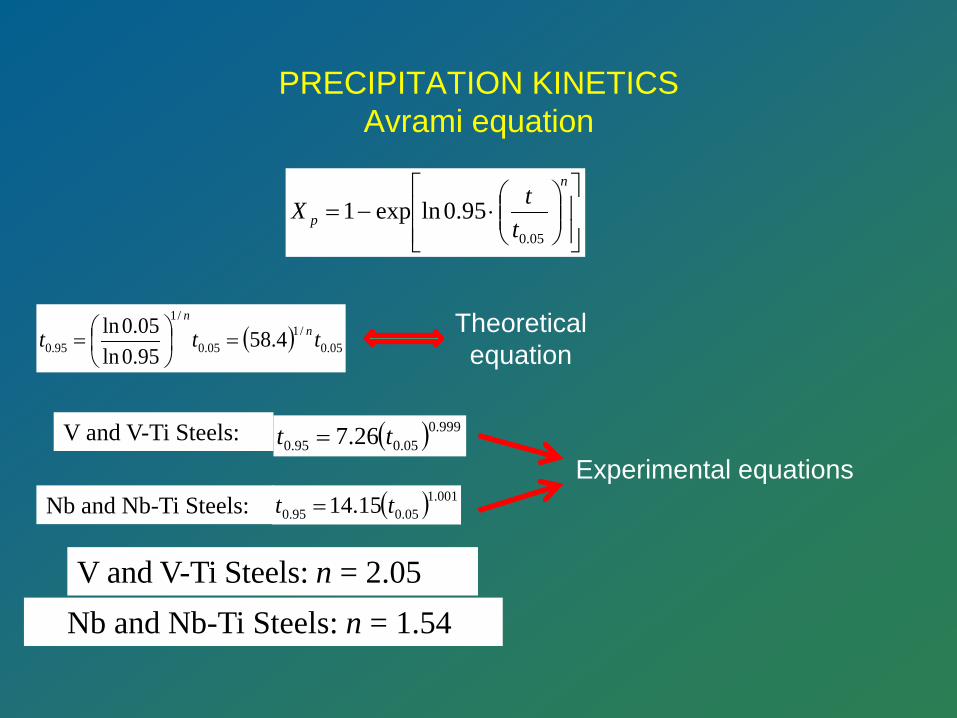
PRECIPITATION KINETICS Avrami equation
⋅−=
n
p ttX05.0
95.0lnexp1
Equation (2) complies with the limit conditions of Avrami's equation: t=0 Xp=0 t=∞ Xp=1
( ) 05.0/1
05.0
/1
95.0 4.5895.0ln05.0ln ttt n
n
=
=
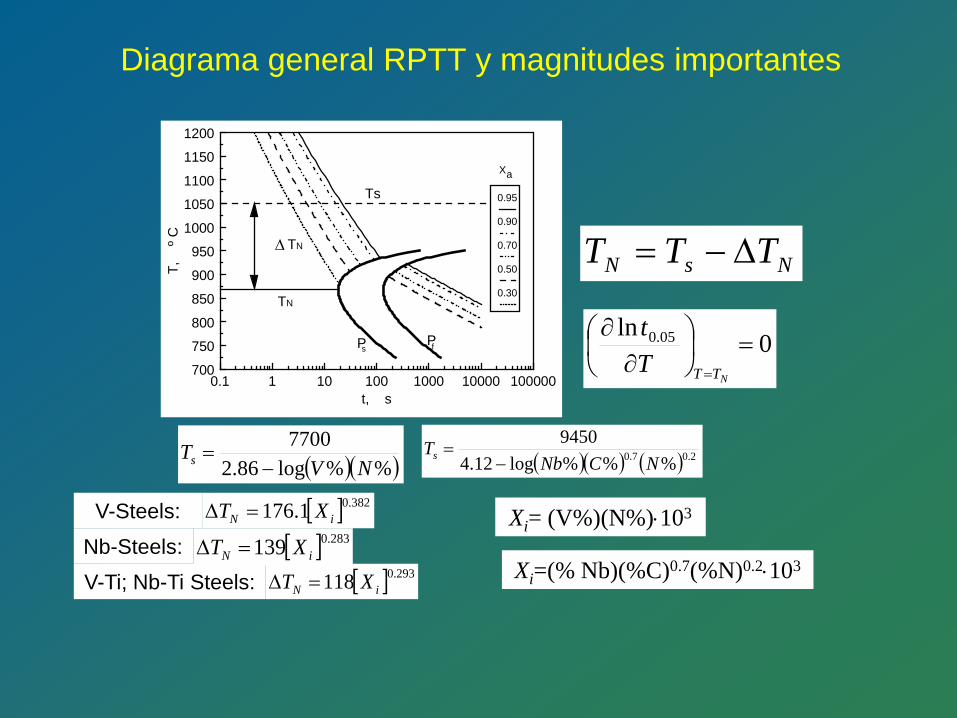
Diagrama general RPTT y magnitudes importantes
( )( )%%log86.27700
NVTs −
= ( )( ) ( ) 2.07.0 %%%log12.49450
NCNbTs −
=
V-Steels: [ ] 382.01.176 iN XT =∆
Nb-Steels: [ ] 283.0139 iN XT =∆
V-Ti; Nb-Ti Steels: [ ] 293.0118 iN XT =∆
0ln 05.0 =
∂∂
= NTTTt
Xa
0.1 1 10 100 1000 10000 100000700
750800
850900
9501000
10501100
11501200
t, s
T,
º C
0.95
0.90
0.70
0.50
0.30
TN
TN
Ts
sP fP
∆NsN TTT ∆−=
Xi= (V%)(N%)⋅103
Xi=(% Nb)(%C)0.7(%N)0.2⋅103
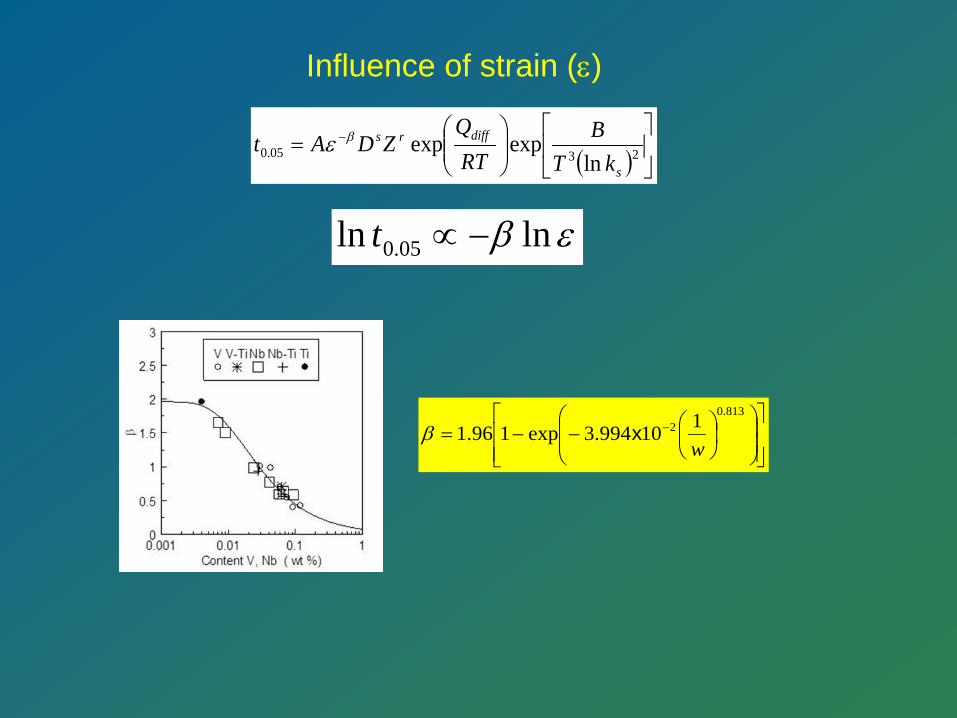
Influence of strain (ε)
( )
= −
2305.0 lnexpexp
s
diffrs
kTB
RTQ
ZDAt βε
εβ lnln 05.0 −∝t
−−= −
813.02 110994.3exp196.1
wxβ
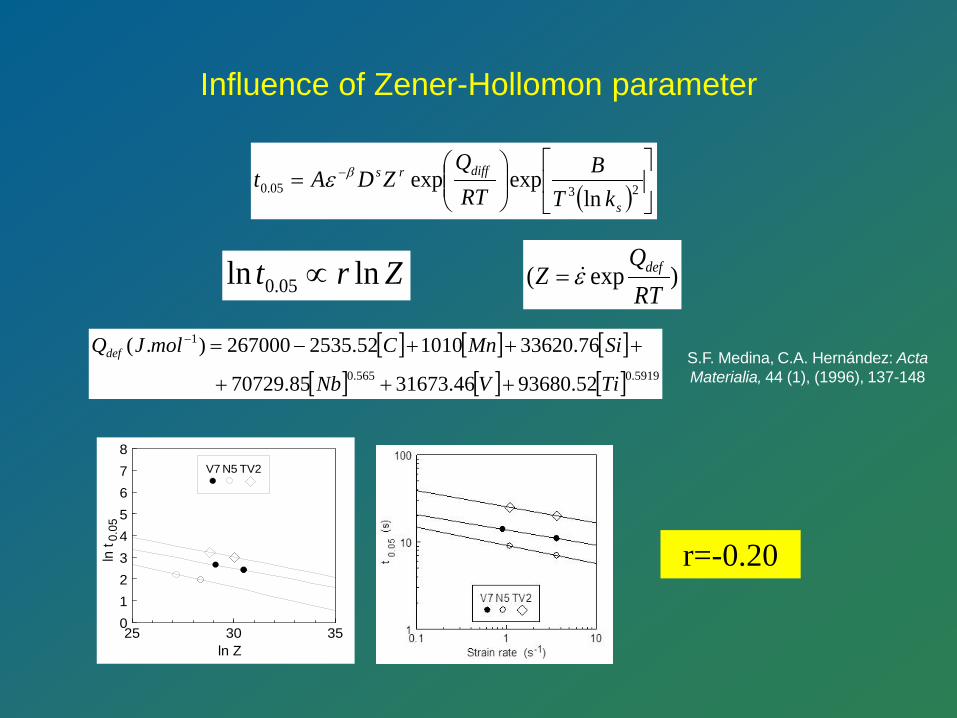
Influence of Zener-Hollomon parameter
( )
= −
2305.0 lnexpexp
s
diffrs
kTB
RTQ
ZDAt βε
Zrt lnln 05.0 ∝
0.05
25 30 35012345678
ln Z
ln t
V7 N5 TV2
)exp(RTQ
Z defε=
[ ] [ ] [ ][ ] [ ] [ ] 5919.0565.0
1
52.9368046.3167385.70729
76.33620101052.2535267000).(
TiVNb
SiMnCmolJQdef
+++
+++−=−
S.F. Medina, C.A. Hernández: Acta Materialia, 44 (1), (1996), 137-148
r=-0.20
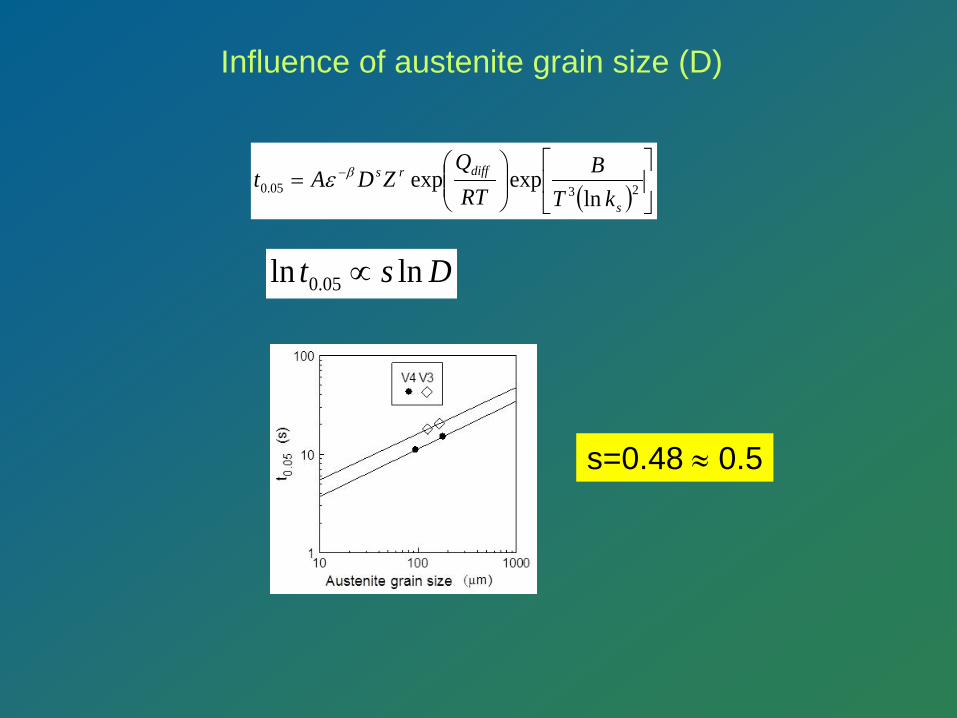
Influence of austenite grain size (D)
Dst lnln 05.0 ∝
( )
= −
2305.0 lnexpexp
s
diffrs
kTB
RTQ
ZDAt βε
s=0.48 ≈ 0.5
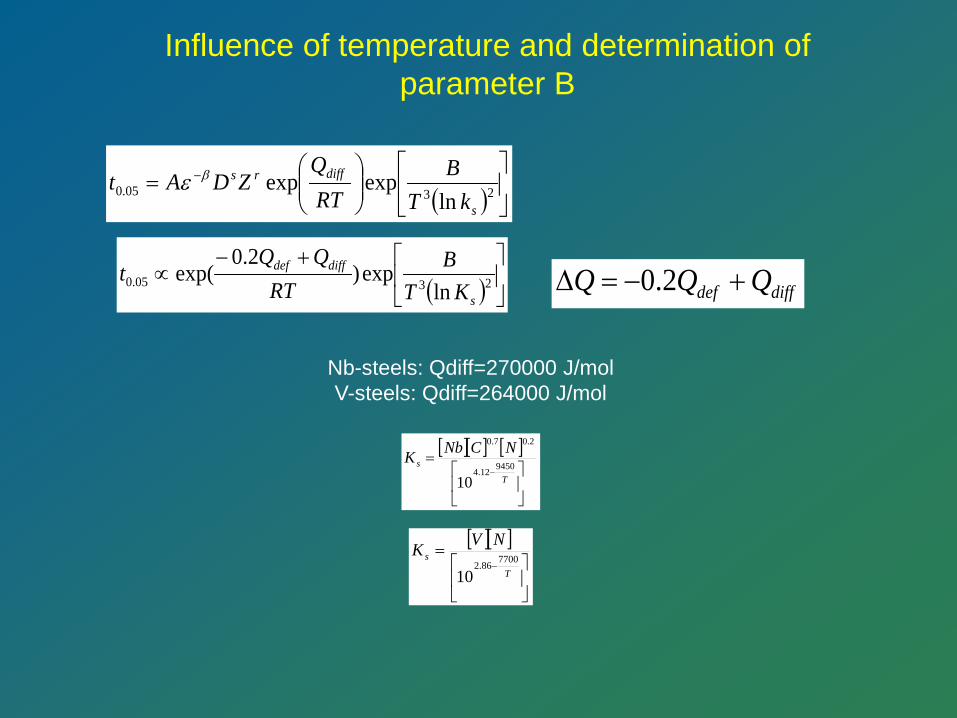
Influence of temperature and determination of
parameter B
( )
= −
2305.0 lnexpexp
s
diffrs
kTB
RTQ
ZDAt βε
( )
+−∝ 2305.0 ln
exp)2.0
exp(s
diffdef
KTB
RTQQ
t
Nb-steels: Qdiff=270000 J/mol V-steels: Qdiff=264000 J/mol
[ ][ ] [ ]
=
−T
sNCNbK
945012.4
2.07.0
10
[ ][ ]
=
−T
sNVK770086.2
10
diffdef QQQ +−=∆ 2.0
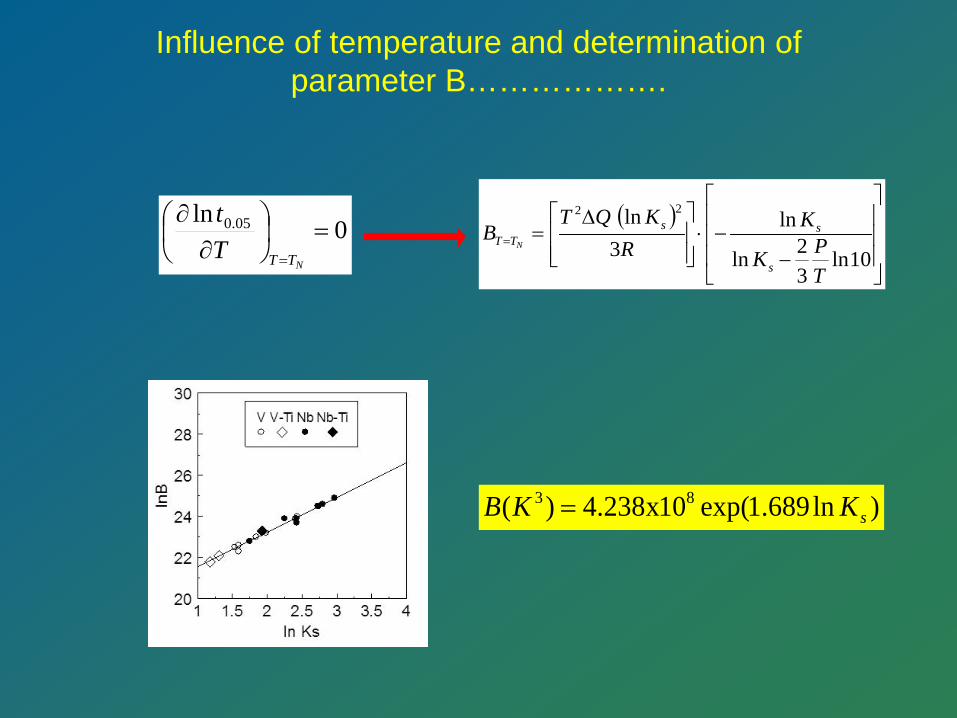
Influence of temperature and determination of
parameter B……………….
( )
−−⋅
∆==
10ln32ln
ln3
ln 22
TPK
KR
KQTB
s
ssTT N
)ln689.1exp(10x238.4)( 83sKKB =
0ln 05.0 =
∂∂
= NTTTt
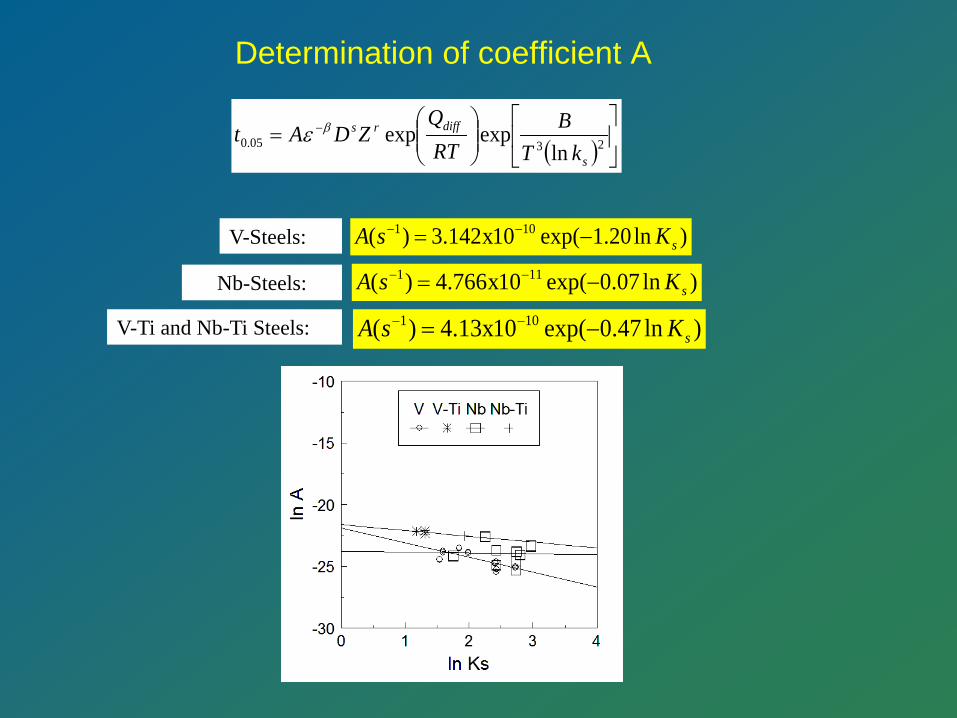
Determination of coefficient A
( )
= −
2305.0 lnexpexp
s
diffrs
kTB
RTQ
ZDAt βε
V-Steels: )ln20.1exp(10x142.3)( 101sKsA −= −−
Nb-Steels: )ln07.0exp(10x766.4)( 111sKsA −= −−
V-Ti and Nb-Ti Steels: )ln47.0exp(10x13.4)( 101sKsA −= −−
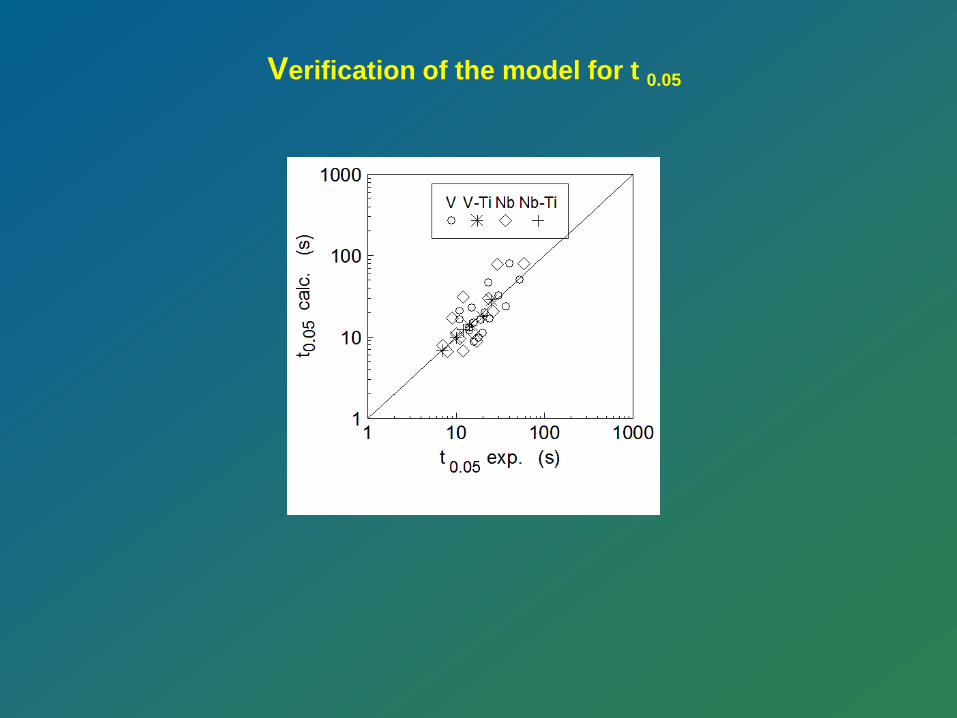
Verification of the model for t 0.05
PRECIPITATION KINETICS Avrami equation
⋅−=
n
p ttX05.0
95.0lnexp1
( ) 05.0/1
05.0
/1
95.0 4.5895.0ln05.0ln ttt n
n
=
=
( ) 999.005.095.0 26.7 tt =
( ) 001.105.095.0 15.14 tt =
Theoretical equation
V and V-Ti Steels:
Nb and Nb-Ti Steels: Experimental equations
V and V-Ti Steels: n = 2.05 Nb and Nb-Ti Steels: n = 1.54
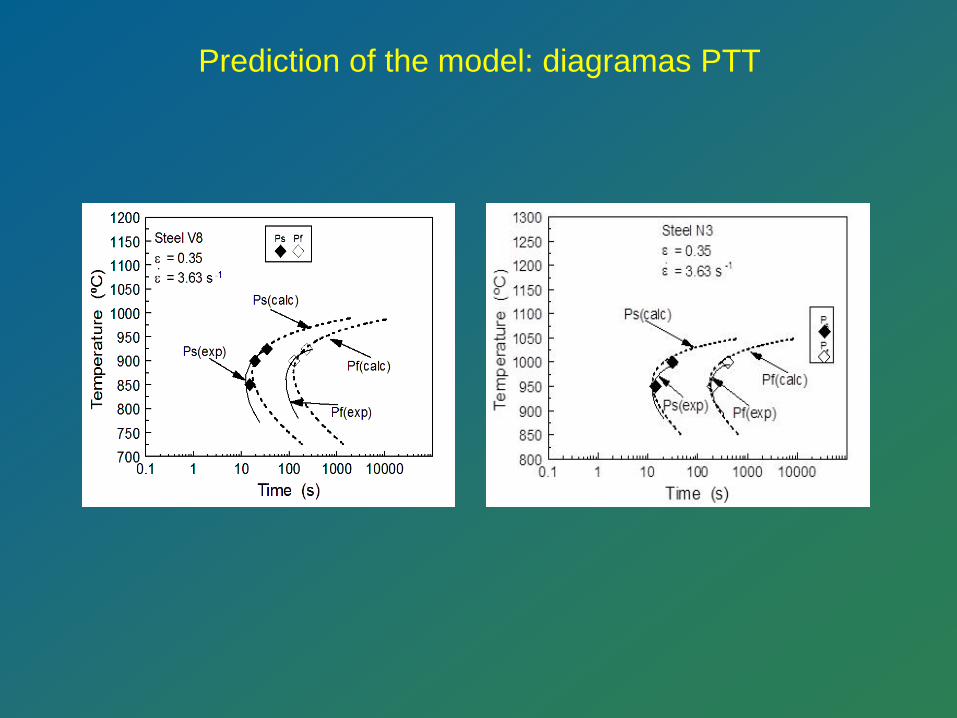
Prediction of the model: diagramas PTT
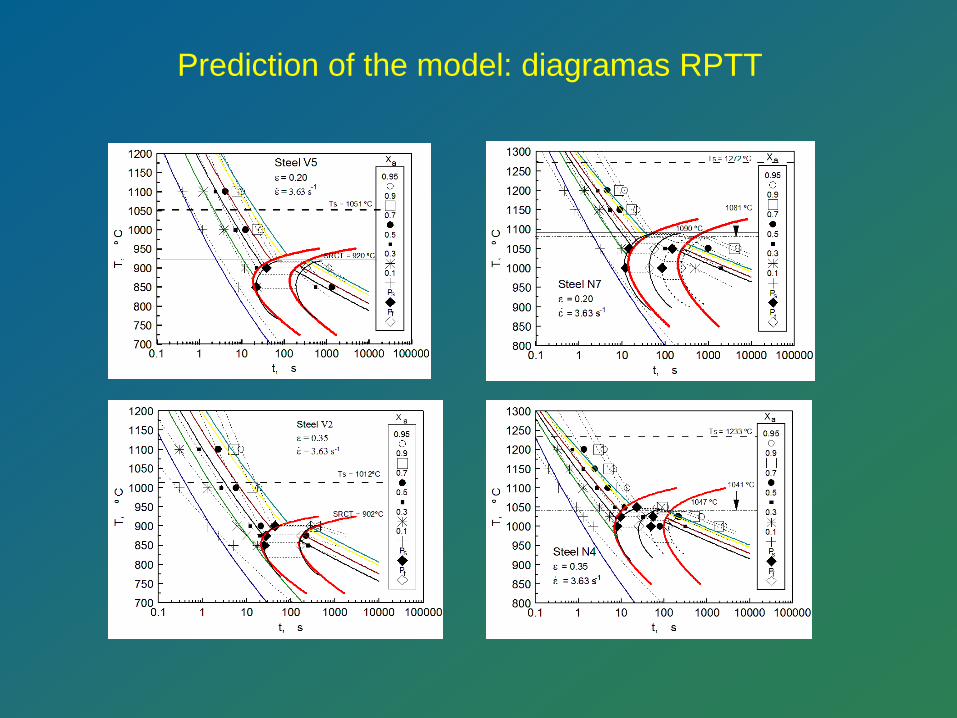
Prediction of the model: diagramas RPTT
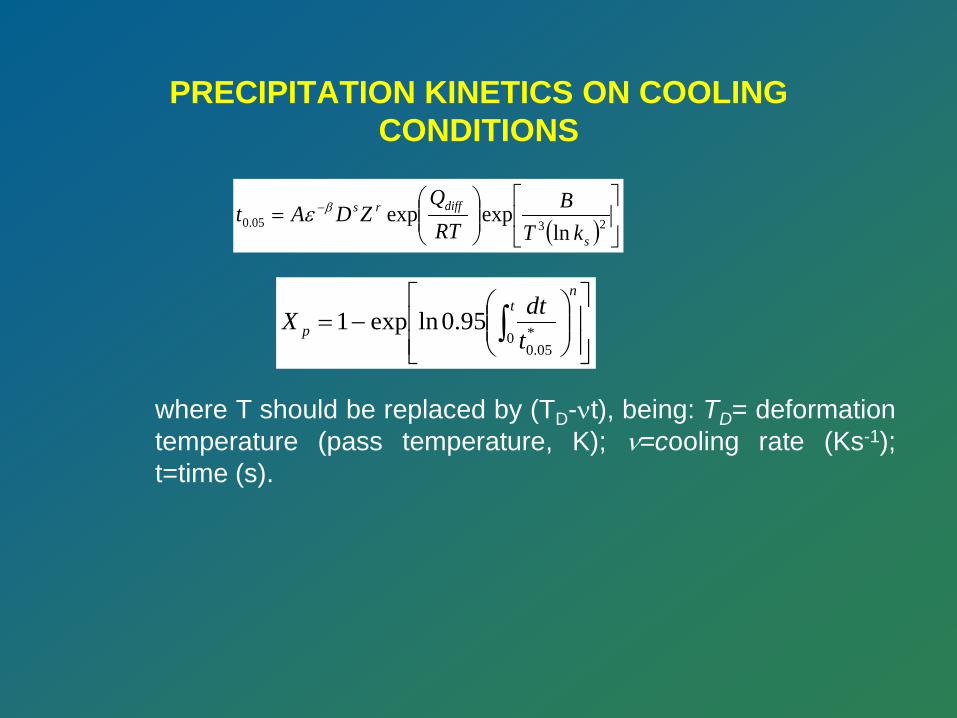
PRECIPITATION KINETICS ON COOLING CONDITIONS
−= ∫
nt
p tdtX
0 *05.0
95.0lnexp1
( )
= −
2305.0 lnexpexp
s
diffrs
kTB
RTQ
ZDAt βε
where T should be replaced by (TD-νt), being: TD= deformation temperature (pass temperature, K); ν=cooling rate (Ks-1); t=time (s).
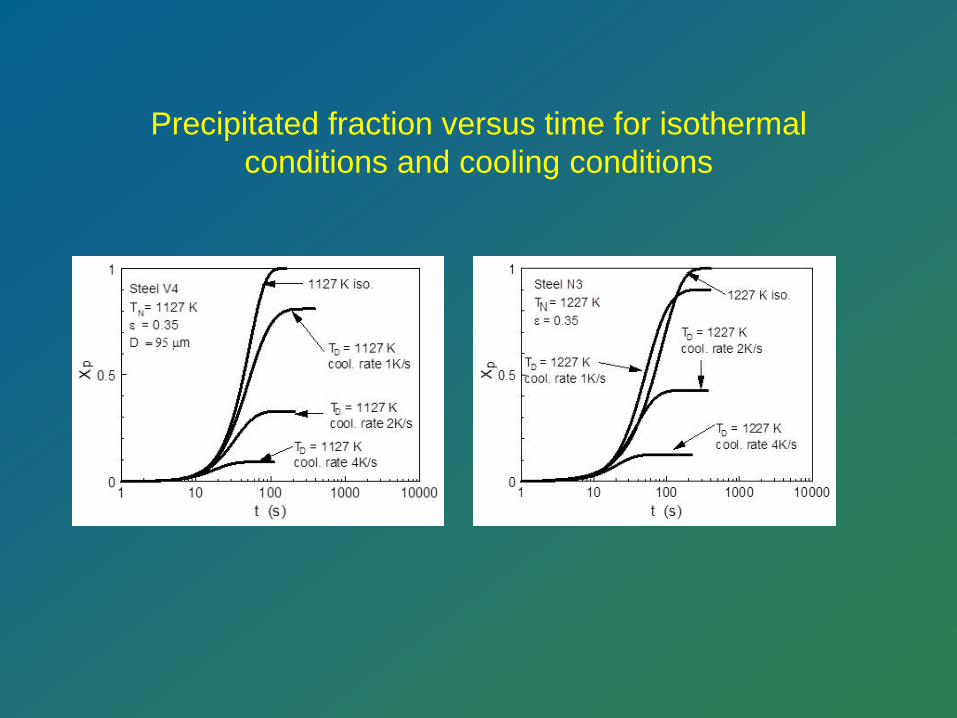
Precipitated fraction versus time for isothermal conditions and cooling conditions
Investigadores que han trabajado en el grupo Deformación a Alta Temperatura (DEFATEM)
:
• Carlos Hernández: Recristalización Dinámica. Tesis Doctoral.
• Juana E. Mancilla: Recristalización Estática. Tesis Doctoral.
• Francisco Ruiz-Valdepeñas. Simulación de laminación. • Mª. Isabel Vega: Recristalización Estática. Simulación de laminación. Precipitación. Tesis
Doctoral.
• Alberto Quispe: Recristalización Estática. Precipitación. Diagramas RPTT. Tesis Doctoral.
• José Ignacio Chaves: Simulación de laminación. Precipitación.
• Oscar Hernanz: Simulación de la laminación.
• Modesto Chapa: Tratamientos térmicos. Control de tamaño de grano.
• Manuel Gómez: Simulación de la laminación Recristalización Estática. Precipitación. Diagramas RPTT. Tesis Doctoral.
• Elizabeth Rodríguez: Simulación de la laminación
• Lucía Rancel: Tratamientos térmicos. Precipitación. Tesis Doctoral.
¡GRACIAS POR SU ATENCIÓN!