
AMEH Presentation
20
Integrated Healthcare for Better Patient Outcomes Apollo Medical Holdings, Inc. Investor Presentation December 2015
-
Upload
redchip-companies-inc -
Category
Business
-
view
315 -
download
0
Transcript of AMEH Presentation
Integrated Healthcare for Better Patient Outcomes
Apollo Medical Holdings, Inc.
Investor Presentation
December 2015
Safe Harbor Statement
This presentation may contain forward-looking statements, including information about management's view of
Apollo Medical Holdings, Inc. (“the Company”) future expectations, plans and prospects. In particular, when used
in the preceding discussion, the words "believes," "expects," "intends," "plans," "anticipates," or "may," and similar
conditional expressions are intended to identify forward-looking statements. Any statements made in this
presentation other than those of historical fact, about an action, event or development, are forward-looking
statements. These statements involve known and unknown risks, uncertainties and other factors, which may
cause the results of the Company, its subsidiaries and concepts to be materially different than those expressed or
implied in such statements. Unknown or unpredictable factors also could have material adverse effects on the
Company’s future results. The forward-looking statements included in this presentation are made only as of the
date hereof. The Company cannot guarantee future results, levels of activity, performance or
achievements. Accordingly, you should not place undue reliance on these forward-looking statements. Finally,
the Company undertakes no obligation to update these statements after the date of this release, except as
required by law, and also takes no obligation to update or correct information prepared by third parties that are
not paid for by Apollo Medical Holdings, Inc.
2

Summary
An integrated, physician driven, population healthcare services company at the
forefront of the US healthcare movement to Value Based Care:
Medical Management, Care Coordination and Physician Care for 100,000+ people
Market and industry tailwinds; both short-term and long-term
Apollo is delivering high quality, cost effective results in a risk based model
Nearly 200% Y/Y revenue growth (FY15 vs. FY14) and Q/Q YTD revenue growth
One of few small cap public companies in attractive healthcare services sector
Recent IPOs of Evolent Health (EVH) and acquisition of IPCM valuations are trend
Over $20M in investment from Fresenius Medical Care and Network Management
Growth strategy to include geographic expansion, M&A and technology offerings
3

Equity Overview
Stock Symbol: AMEH
Outstanding Shares: 6.6 Million
Recent Price: $6.00
52 week range: $4.50 - $10.00
Market Capitalization: $40M
Cash: $7M; Debt: $1.2M
Total Assets: $16M
Price / Sales: 1.0 X ttm
Fiscal Year ends March 31st (FY 2015 is from Apr 2014 to Mar 2015)
4
5
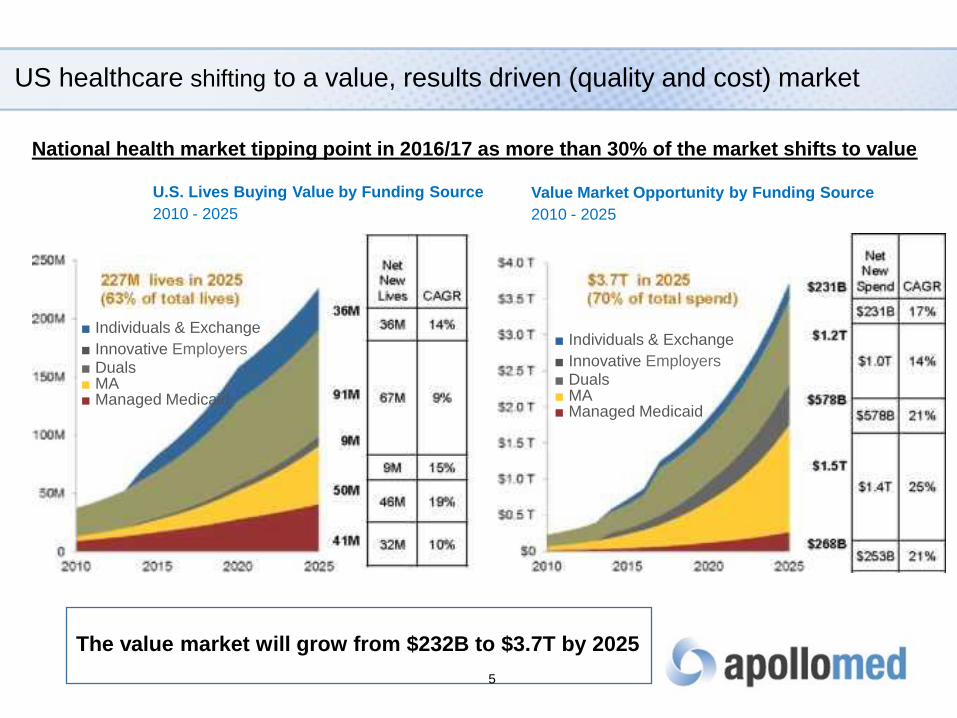
US healthcare shifting to a value, results driven (quality and cost) market
U.S. Lives Buying Value by Funding Source
2010 - 2025
Value Market Opportunity by Funding Source
2010 - 2025
National health market tipping point in 2016/17 as more than 30% of the market shifts to value
■ Individuals & Exchange ■ Innovative Employers ■ Duals ■ MA ■ Managed Medicaid
■ Individuals & Exchange ■ Innovative Employers ■ Duals ■ MA ■ Managed Medicaid
The value market will grow from $232B to $3.7T by 2025
6
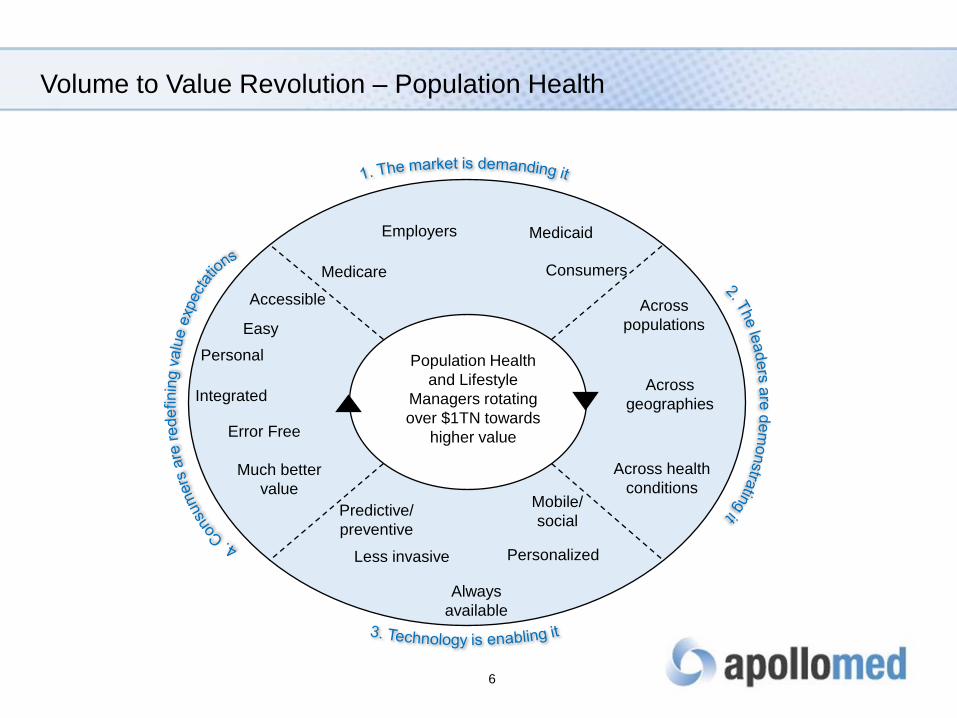
Volume to Value Revolution – Population Health
Population Health
and Lifestyle
Managers rotating
over $1TN towards
higher value
Employers Medicaid
Consumers
Across
populations
Across
geographies
Across health
conditions Mobile/
social
Personalized
Always
available
Predictive/
preventive
Less invasive
Accessible
Easy
Personal
Integrated
Error Free
Much better
value
Medicare
Industry Trends
Government and private sector trend from FFS/volume to outcome driven
Value based reimbursement, Bundled Payments, ACO, PTN
Irrespective of politics, better care and lower cost goals will continue
Transparency of information; by procedure, by physician, by hospital
New physician driven models forming and gaining traction
Physician and Patients are core of healthcare in emerging landscape
By 2016, 85% of Medicare payments will be tied to quality and value
By 2018, at least 50% of payments will be paid through “Alternative
payment models” such as ACOs, PTNs, Bundled payments
Consumers are becoming more engaged in their own care
Exchanges, Rising Premiums, Social Media
7

Healthcare Market
Seniors are increasing in number and
living longer
76 Million baby boomers
3.6 Million new Seniors/year
Largest Cost Segment
US Healthcare market
$2.8 Trillion in 2012
Growing to $4.8 Trillion by 2021
50+% US spend is on Hospital and
Physician Care (Bio & IT about 20%)
Healthcare is ~17% of US GDP
heading to near 20% by 2021
All signs point to increased market
size and more urgent need to
optimize healthcare costs
8

9
Chronic, Senior and End of Life are major healthcare cost drivers
Population Stratification Resource Consumption
Opportunities for total redesign of care delivery models
Source: Blended MarketScan Commercial, Medicare 5% LDS, and representative payer Medicare data
• ED visits • Avoidable events • Readmissions
20%
30%-25%
45%-50%
• Higher acuity episodes
than required
• Complications and
Readmissions
• Unmanaged and
engaged
20% 25%
70%
5%
• Health/minor
issues
• At risk for major
intervention
• Poly-chronic
• Frail Elders
• End of Life
Opportunities for dramatically enhanced efficiency and consistency in care delivery Opportunities to enhance value through better access and enhanced patient engagement
Apollo Differentiators
Expertise in providing high quality, cost efficient care
Particularly in managing complex, chronically ill patients
Triple Aim goal; patient satisfaction, high quality, efficient cost
Business model built on value design YEARS ago
Data analytics; past, current and predictive (i.e. goal of “real time”)
Population management and care coordination capabilities
Ability to take performance risk for total patient care profitably; most critical
attribute in value based US healthcare system
10
What we do ..
Population Health Management
Management of complex, chronically ill patients
Technology and data driven analytics
Medical Management and Care Coordination
Management of Total Cost of Care for population
Direct Patient Care (influences Population Health Management results)
Inpatient Care: Hospitalists, Critical Care Specialists, Physician Advisors
Outpatient Care: Primary Care, Specialists, Clinics, Home Health, Hospice
11
12
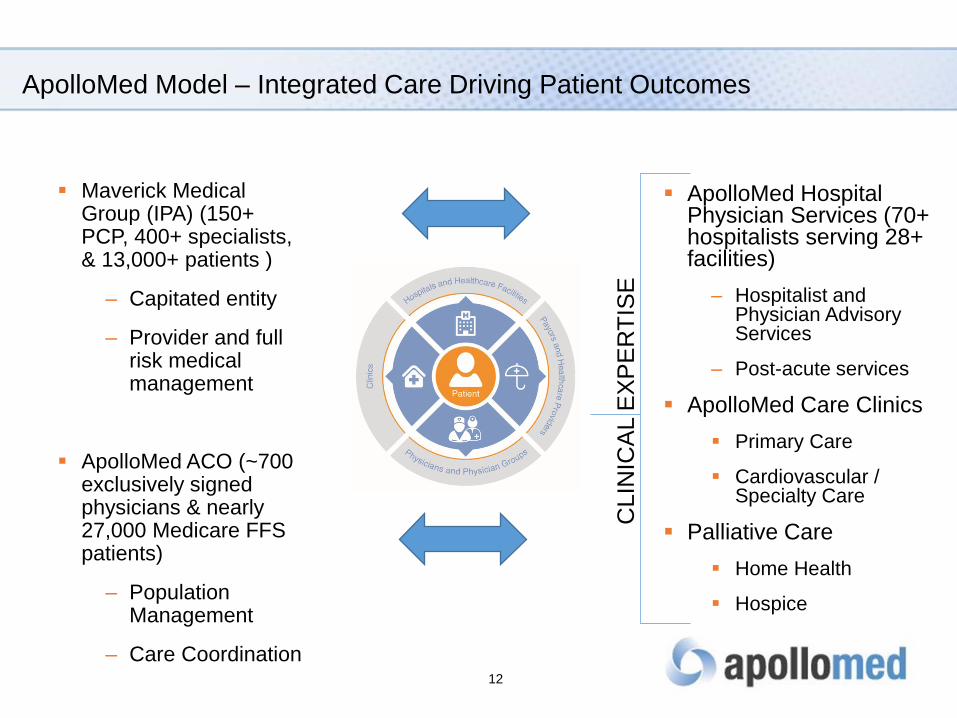
ApolloMed Model – Integrated Care Driving Patient Outcomes
Maverick Medical Group (IPA) (150+ PCP, 400+ specialists, & 13,000+ patients )
– Capitated entity
– Provider and full risk medical management
ApolloMed ACO (~700 exclusively signed physicians & nearly 27,000 Medicare FFS patients)
– Population Management
– Care Coordination
ApolloMed Hospital Physician Services (70+ hospitalists serving 28+ facilities)
– Hospitalist and Physician Advisory Services
– Post-acute services
ApolloMed Care Clinics
Primary Care
Cardiovascular / Specialty Care
Palliative Care
Home Health
Hospice
C
LIN
ICA
L E
XP
ER
TIS
E

13
Apollo Care Connection – A Physician/Patient Designed Data Platform
Population Management
platform/Hub (Medecisions)
Patient Engagement/Personal
Digital Care Plans (Healarium)
Predictive Analytics (Helynx)
Real-time admission/discharge
notification (Passport/Experian)
Telemedicine platform (Snap MD)
Wellness (Health Dialog/Rite Aid)
Personal Mobile Apps
More
Who/how customers pay us – a diversified approach
Revenue from Hospitals, Health Plans, Medical Groups and Government
Range of payments from Fee for Service (FFS) to Full Risk models
IPA is capitated entity paid monthly from Health Plan Premiums
Shared savings with hospitals and MSSP ACO on Performance
Clinics and Palliative Care mostly FFS (CMS and Specialist billing)
ApolloMed has 50+ different payors
Minimal bad debt and limited comparable pricing pressures
14
15
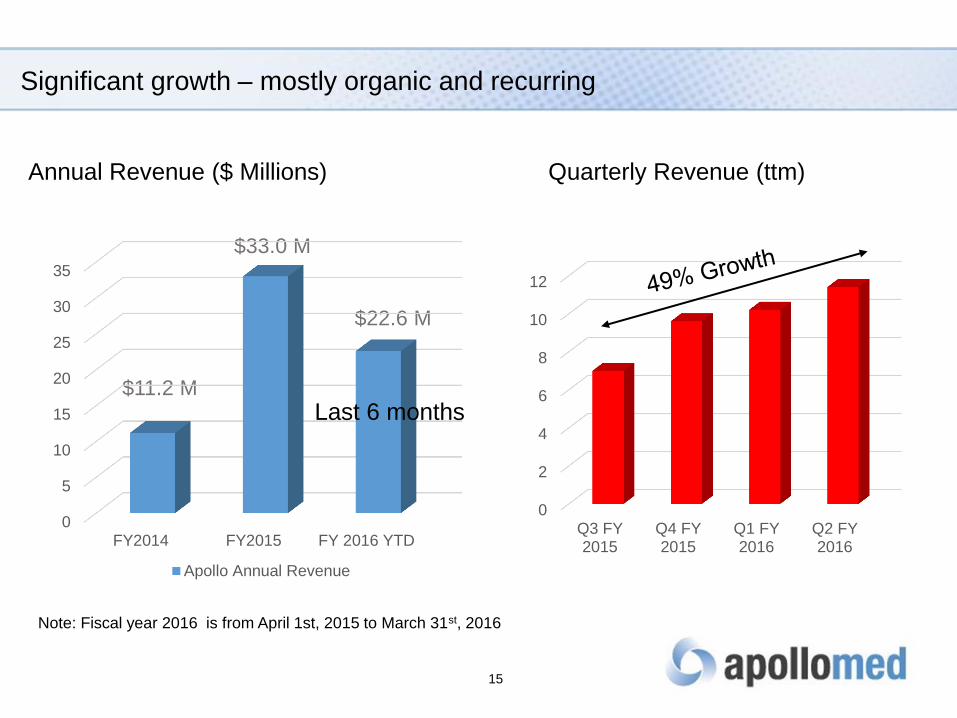
Significant growth – mostly organic and recurring
0
2
4
6
8
10
12
Q3 FY2015
Q4 FY2015
Q1 FY2016
Q2 FY2016
Note: Fiscal year 2016 is from April 1st, 2015 to March 31st, 2016
$33.0 M
$22.6 M
$11.2 M
Annual Revenue ($ Millions)
0
5
10
15
20
25
30
35
FY2014 FY2015 FY 2016 YTD
Apollo Annual Revenue
Quarterly Revenue (ttm)
Last 6 months
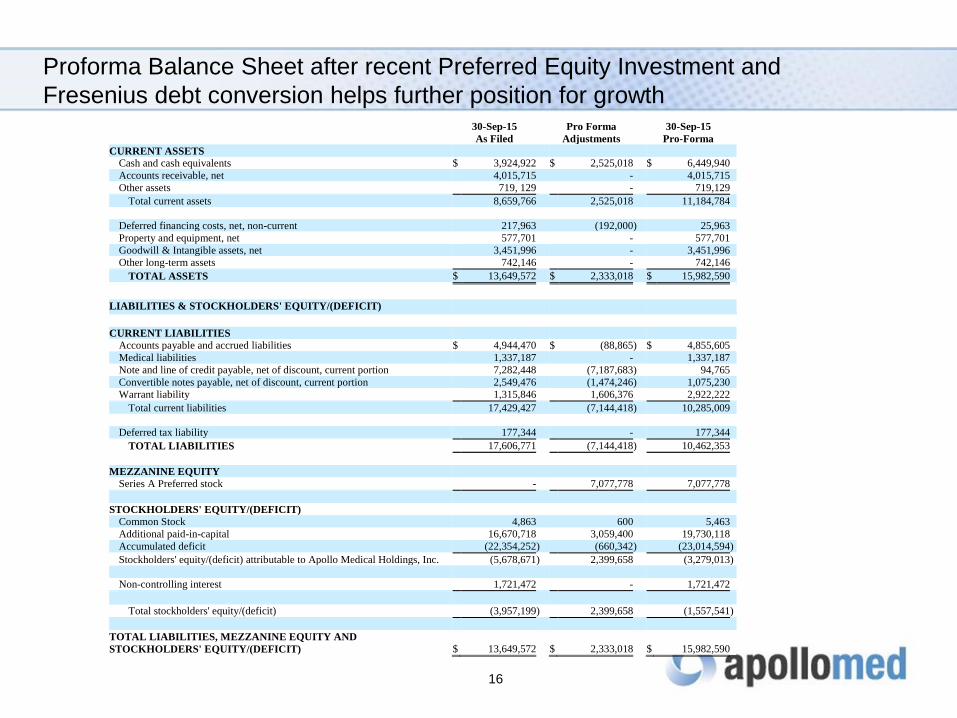
Proforma Balance Sheet after recent Preferred Equity Investment and
Fresenius debt conversion helps further position for growth
16
30-Sep-15 Pro Forma 30-Sep-15
As Filed Adjustments Pro-Forma
CURRENT ASSETS
Cash and cash equivalents $ 3,924,922 $ 2,525,018 $ 6,449,940
Accounts receivable, net 4,015,715 - 4,015,715
Other assets 719, 129 - 719,129
Total current assets 8,659,766 2,525,018 11,184,784
Deferred financing costs, net, non-current 217,963 (192,000 ) 25,963
Property and equipment, net 577,701 - 577,701
Goodwill & Intangible assets, net 3,451,996 - 3,451,996
Other long-term assets 742,146 - 742,146
TOTAL ASSETS $ 13,649,572 $ 2,333,018 $ 15,982,590
LIABILITIES & STOCKHOLDERS' EQUITY/(DEFICIT)
CURRENT LIABILITIES
Accounts payable and accrued liabilities $ 4,944,470 $ (88,865 ) $ 4,855,605
Medical liabilities 1,337,187 - 1,337,187
Note and line of credit payable, net of discount, current portion 7,282,448 (7,187,683 ) 94,765
Convertible notes payable, net of discount, current portion 2,549,476 (1,474,246 ) 1,075,230
Warrant liability 1,315,846 1,606,376 2,922,222
Total current liabilities 17,429,427 (7,144,418 ) 10,285,009
Deferred tax liability 177,344 - 177,344
TOTAL LIABILITIES 17,606,771 (7,144,418 ) 10,462,353
MEZZANINE EQUITY
Series A Preferred stock - 7,077,778 7,077,778
STOCKHOLDERS' EQUITY/(DEFICIT)
Common Stock 4,863 600 5,463
Additional paid-in-capital 16,670,718 3,059,400 19,730,118
Accumulated deficit (22,354,252 ) (660,342 ) (23,014,594 )
Stockholders' equity/(deficit) attributable to Apollo Medical Holdings, Inc. (5,678,671 ) 2,399,658 (3,279,013 )
Non-controlling interest 1,721,472 - 1,721,472
Total stockholders' equity/(deficit) (3,957,199 ) 2,399,658 (1,557,541 )
TOTAL LIABILITIES, MEZZANINE EQUITY AND
STOCKHOLDERS' EQUITY/(DEFICIT) $ 13,649,572 $ 2,333,018 $ 15,982,590

Income Statement and Balance Sheet Overview
FY 2015 revenue of $33.0M vs. $11.2M Y/Y (195% gain)
Over 67% of growth is organic and recurring with diversified revenue steam
Gross Margin of 30% and EBITDA positive for FY 2015
SG&A/OH investments decreasing and scale benefits commencing
Quarterly growth driven by increasing network size and model (multiplier effect)
Closed $10M Preferred Equity investment in Oct 2015 ($9/share and warrants)
Debt expense reduced by over $500K and working capital increased
Existing investor Fresenius converted debt and warrants to common (their choice)
Positioned for continued growth; organic and M&A/partnerships
S1 on file for potential additional growth capital
17
Strategy Going forward
Scale current businesses in California
Leverage investor/partners (NMM is 4th largest CA physician group)
Establish and grow networks outside of California leveraging
clinical know how and technology (Apollo Care Connect)
Potential acquisitions in attractive markets
Expand population management capabilities including consumer
engagement, preventative care and data analytics
Continue to assume and manage medical and financial risk and
position for Value Based seismic shift
18

Valuations are robust and accelerating for value based, risk taking models
Evolent (NYSE: EVH) – IPO June 5th 2015
Population Management and Value Based Care Offerings (w/o risk)
$1B valuation on $152M ttm revenues and operating losses
OSCAR
Valued at approximately $1.5 Billion with 40,000 risk lives and $200M revenue
Technology enabled health plan targeting millennials
Humana and Health Net Acquisitions
Potential for more M&A (Pop Mgt., Senior and Risk rationale)
Hospitalist/ER and Integrated Care Companies
Davita/HCP merger and Team Health (TMH)/IPC (IPCM) merger as examples
Valued around 1.5X-3X ttm revenues and 10X to 20+X EBITDA multiples
19
Summary
An integrated, physician driven, population healthcare services company at the
forefront of the US healthcare movement to Value Based Care:
Medical Management, Care Coordination and Physician Care for 100,000+ people
Market and industry tailwinds; both short-term and long-term
Apollo is delivering high quality, cost effective results in a risk based model
Nearly 200% Y/Y revenue growth (FY15 vs. FY14) and Q/Q YTD revenue growth
One of few small cap public companies in attractive healthcare services sector
Recent IPOs of Evolent Health (EVH) and acquisition of IPCM valuations are trend
Over $20M in investment from Fresenius Medical Care and Network Management
Growth strategy to include geographic expansion, M&A and technology offerings
20


![Presentation Guideline and Slide Gallery 16:9 · Presentation Guideline and Slide Gallery 16:9 Author [GfK Employee] Subject [Subtitle of presentation] Keywords: examples; presentation;](https://static.fdocuments.co/doc/165x107/5ffa01e2a5ee5b09787fbf25/presentation-guideline-and-slide-gallery-169-presentation-guideline-and-slide-gallery.jpg)