Anexo A Tablas de puntuación
100
Tablas de puntuación 1 Carlota Mas Carrera Anexo A Tablas de puntuación Este anejo recoge las tablas de puntuación que rigen los criterios de la certificación DGNB. En dichas tablas se especifican los requerimientos o valores a seguir y su correspondiente puntuación. Criterio 15
Transcript of Anexo A Tablas de puntuación
Tablas de puntuación 1
Carlota Mas Carrera
Anexo A
Tablas de puntuación
Este anejo recoge las tablas de puntuación que rigen los criterios de la certificación DGNB. En dichas tablas se especifican los requerimientos o valores a seguir y su correspondiente puntuación.
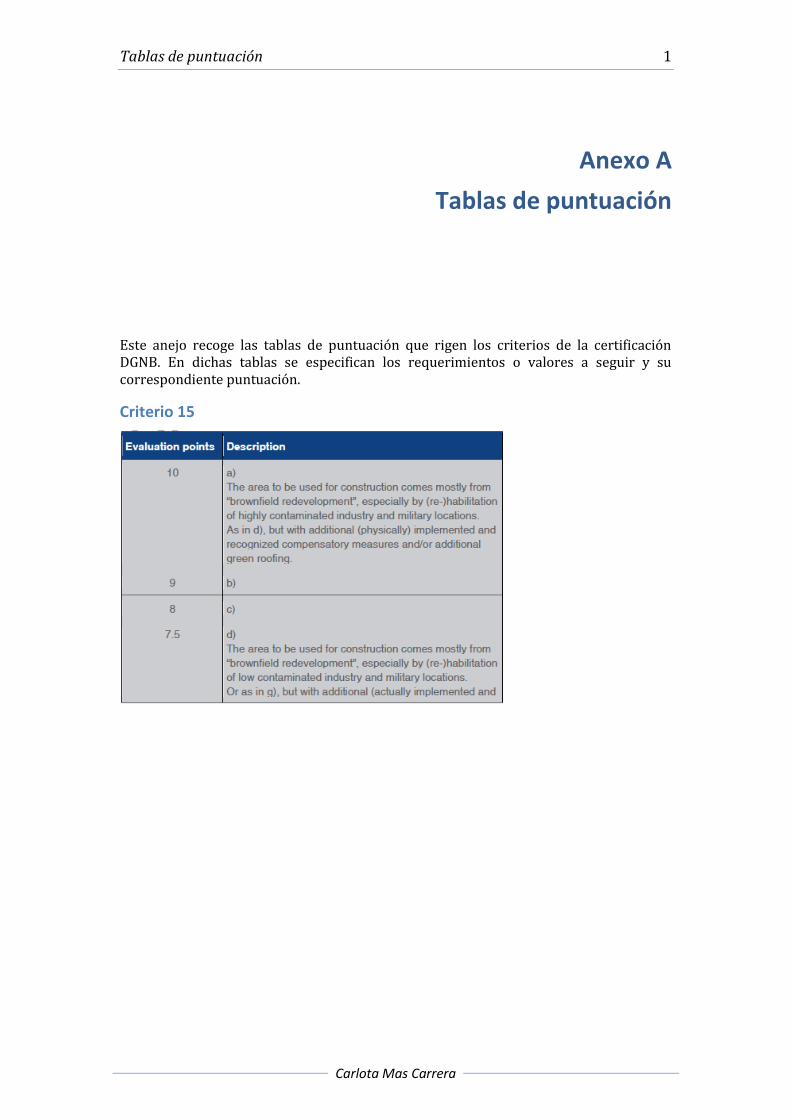
Criterio 15
2 Anexo A
Adaptación a nivel nacional del sistema de evaluación alemán DGNB
Tabla A.15

Tablas de puntuación 3
Carlota Mas Carrera
Criterio 16
Tabla A.16
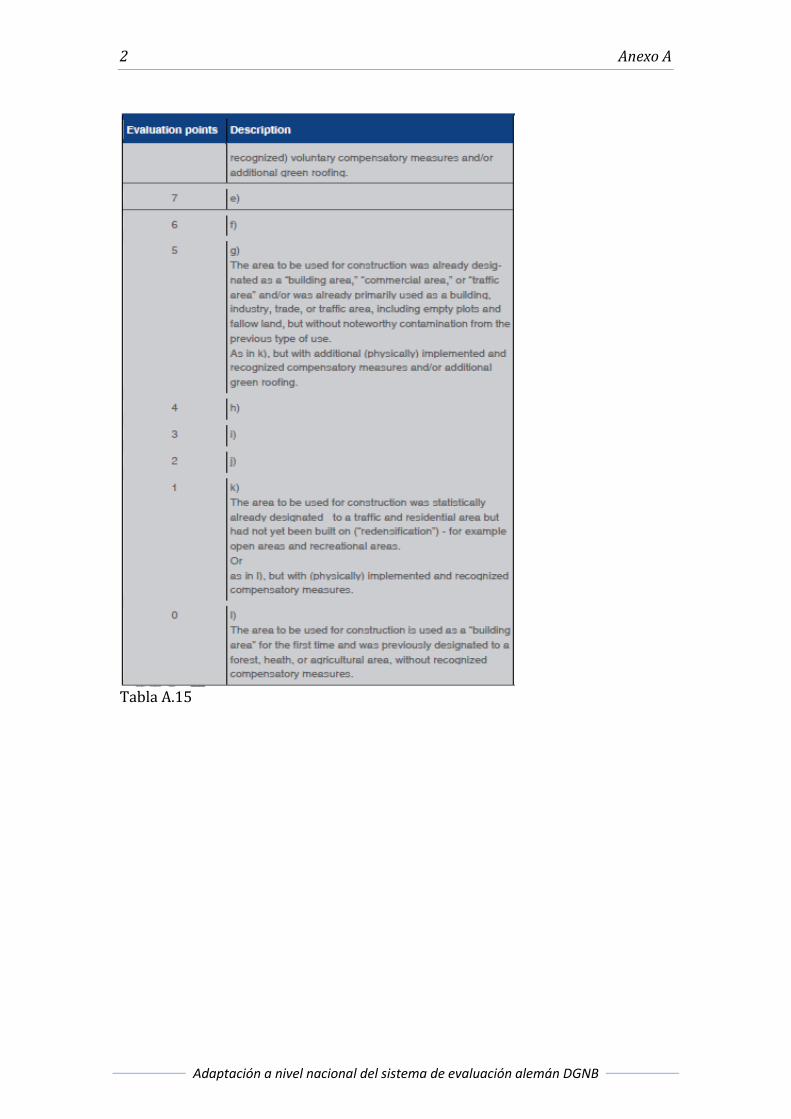
Criterio 17
4 Anexo A
Adaptación a nivel nacional del sistema de evaluación alemán DGNB
Tabla A.17.1
Tabla A.17.3
Criterio 18 y 19
Tabla A.18. 1
Tablas de puntuación 5
Carlota Mas Carrera
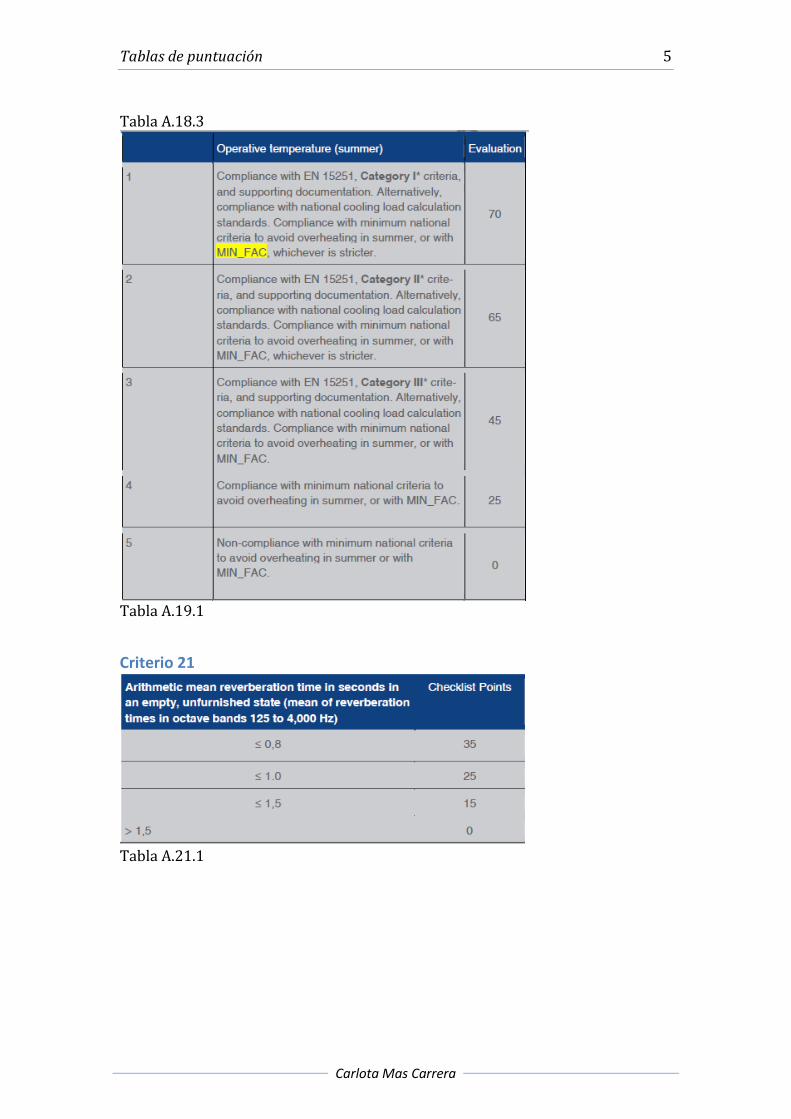
Tabla A.18.3
Tabla A.19.1
Criterio 21
Tabla A.21.1
6 Anexo A
Adaptación a nivel nacional del sistema de evaluación alemán DGNB
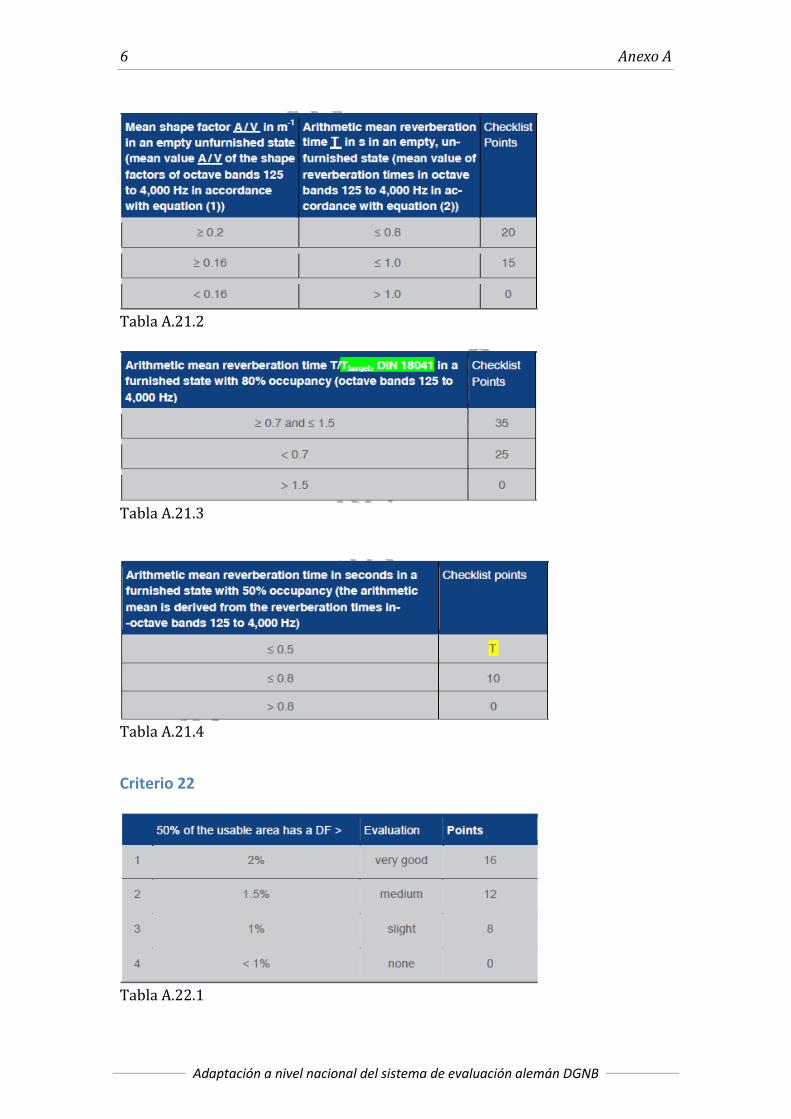
Tabla A.21.2
Tabla A.21.3
Tabla A.21.4
Criterio 22
Tabla A.22.1
Tablas de puntuación 7
Carlota Mas Carrera
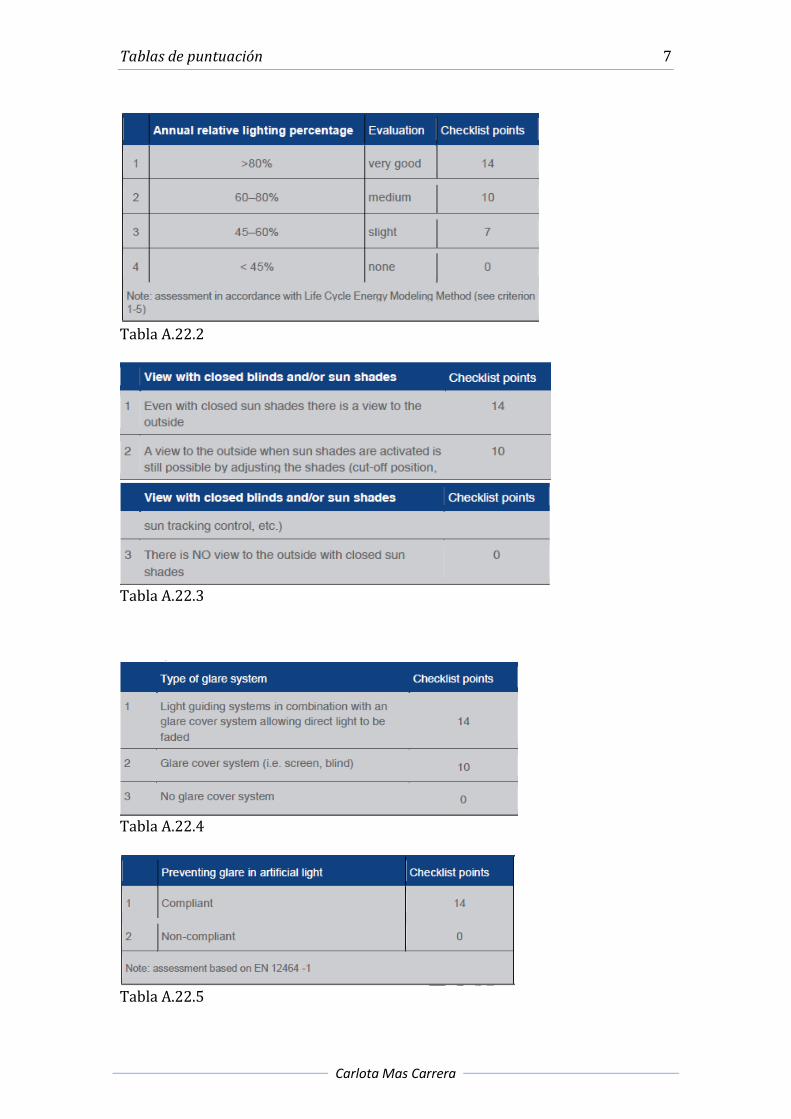
Tabla A.22.2
Tabla A.22.3
Tabla A.22.4
Tabla A.22.5
8 Anexo A
Adaptación a nivel nacional del sistema de evaluación alemán DGNB
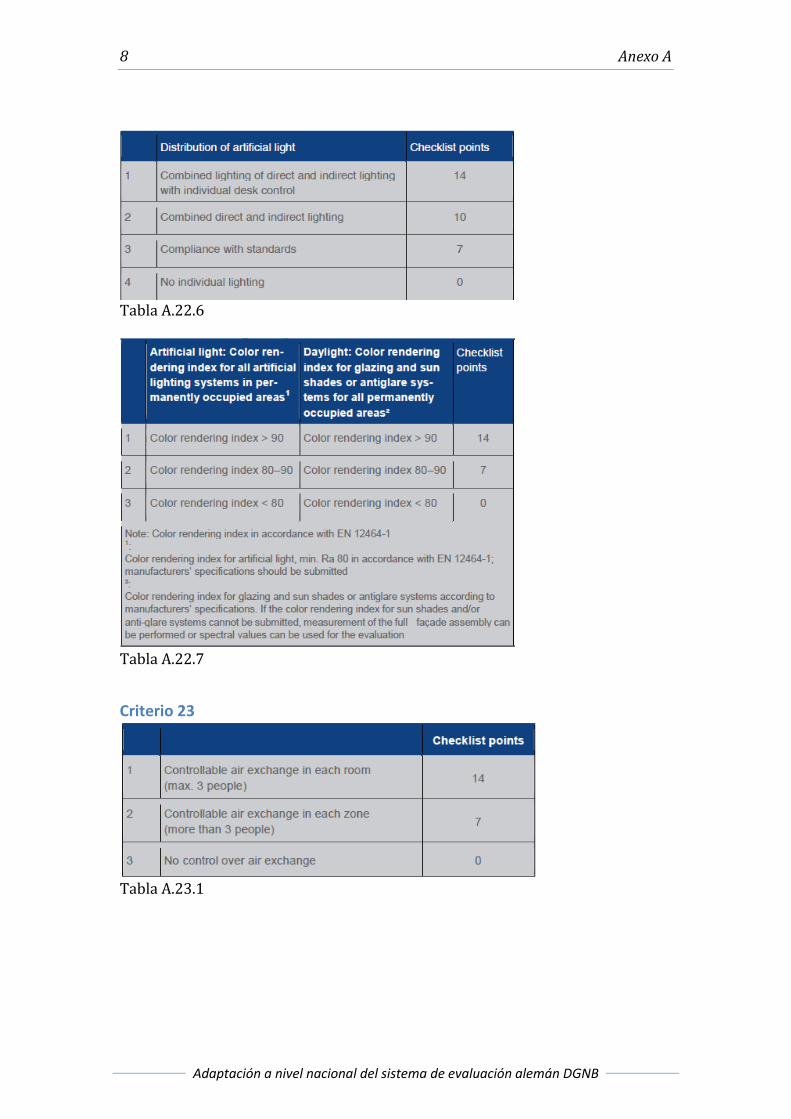
Tabla A.22.6
Tabla A.22.7
Criterio 23
Tabla A.23.1
Tablas de puntuación 9
Carlota Mas Carrera
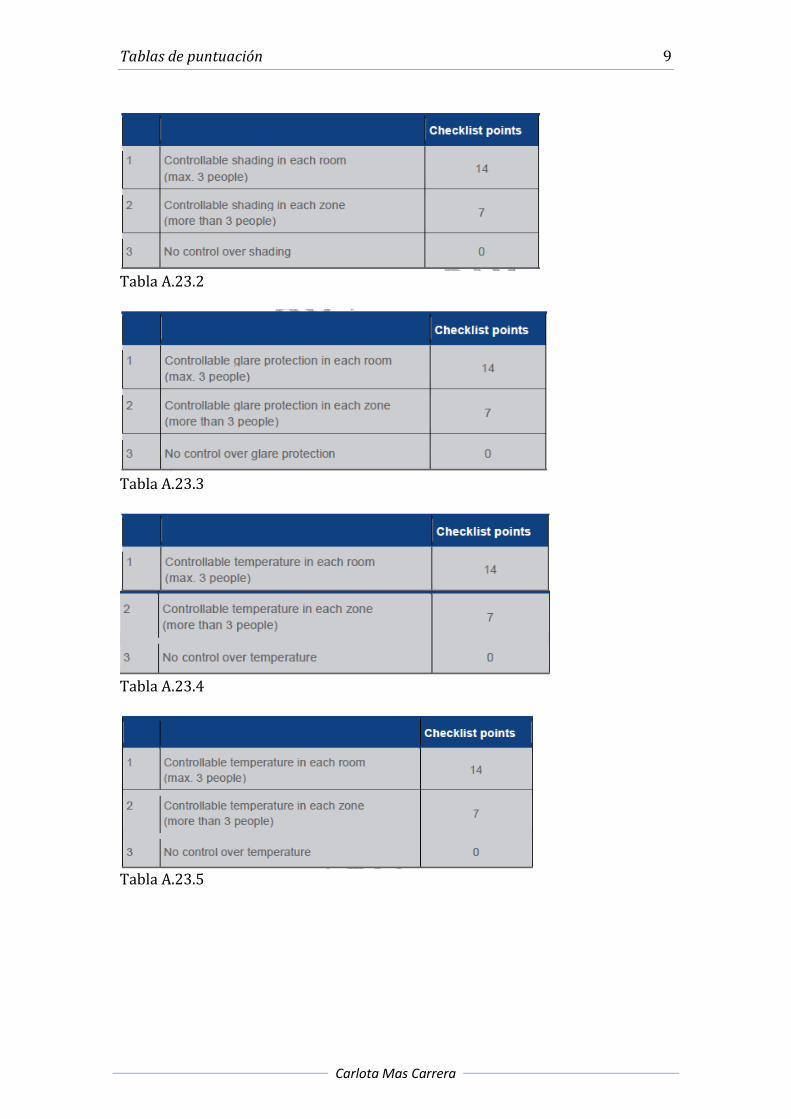
Tabla A.23.2
Tabla A.23.3
Tabla A.23.4
Tabla A.23.5
10 Anexo A
Adaptación a nivel nacional del sistema de evaluación alemán DGNB
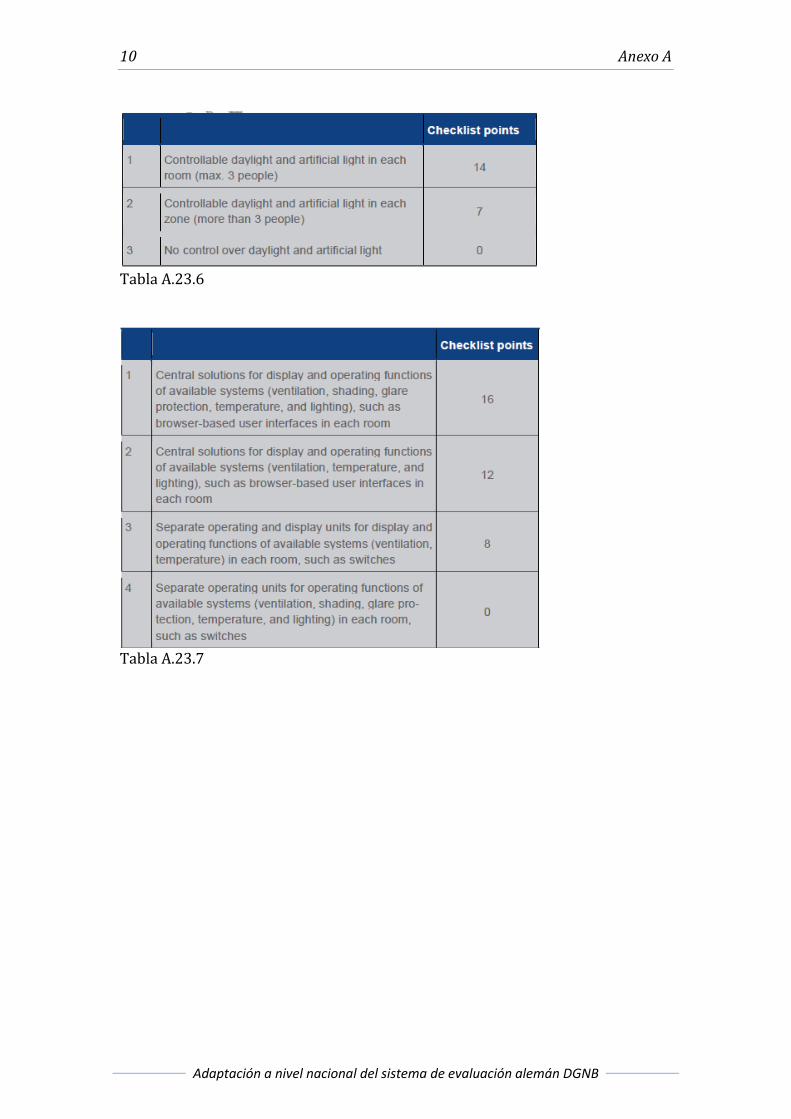
Tabla A.23.6
Tabla A.23.7

Tablas de puntuación 11
Carlota Mas Carrera
Criterio 24
Tabla A.24.1
Tabla A.24.2
12 Anexo A
Adaptación a nivel nacional del sistema de evaluación alemán DGNB
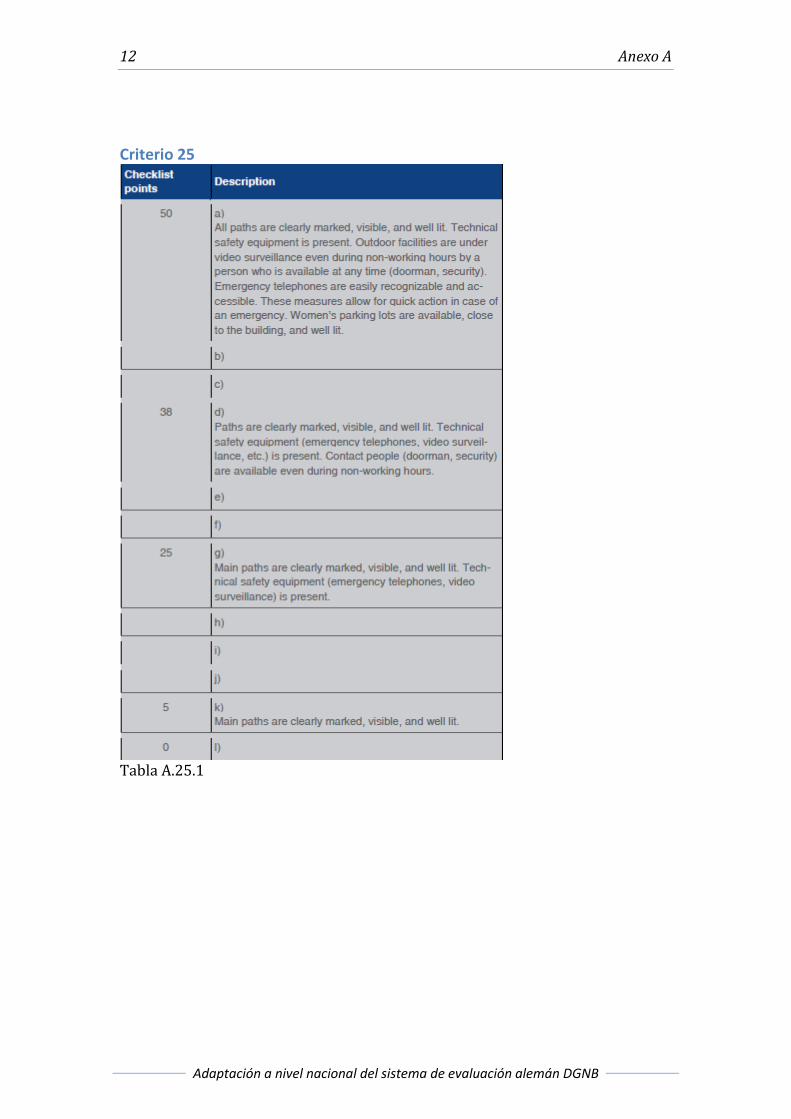
Criterio 25
Tabla A.25.1
Tablas de puntuación 13
Carlota Mas Carrera
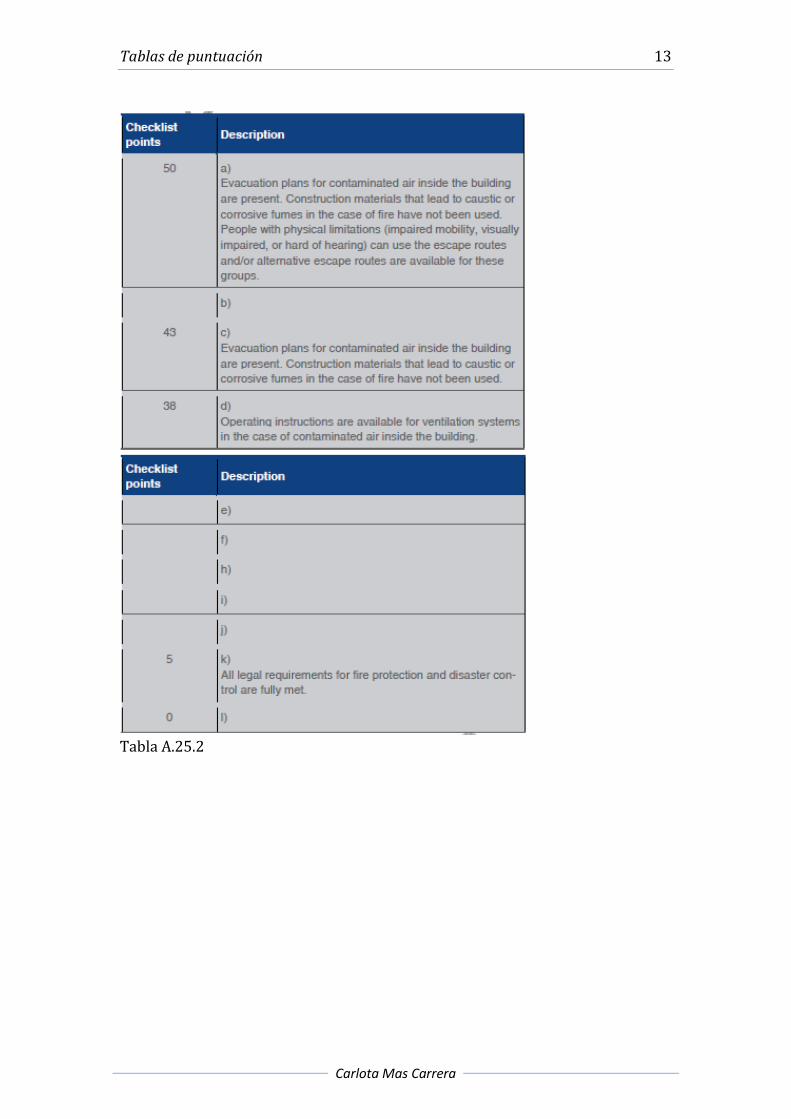
Tabla A.25.2
14 Anexo A
Adaptación a nivel nacional del sistema de evaluación alemán DGNB
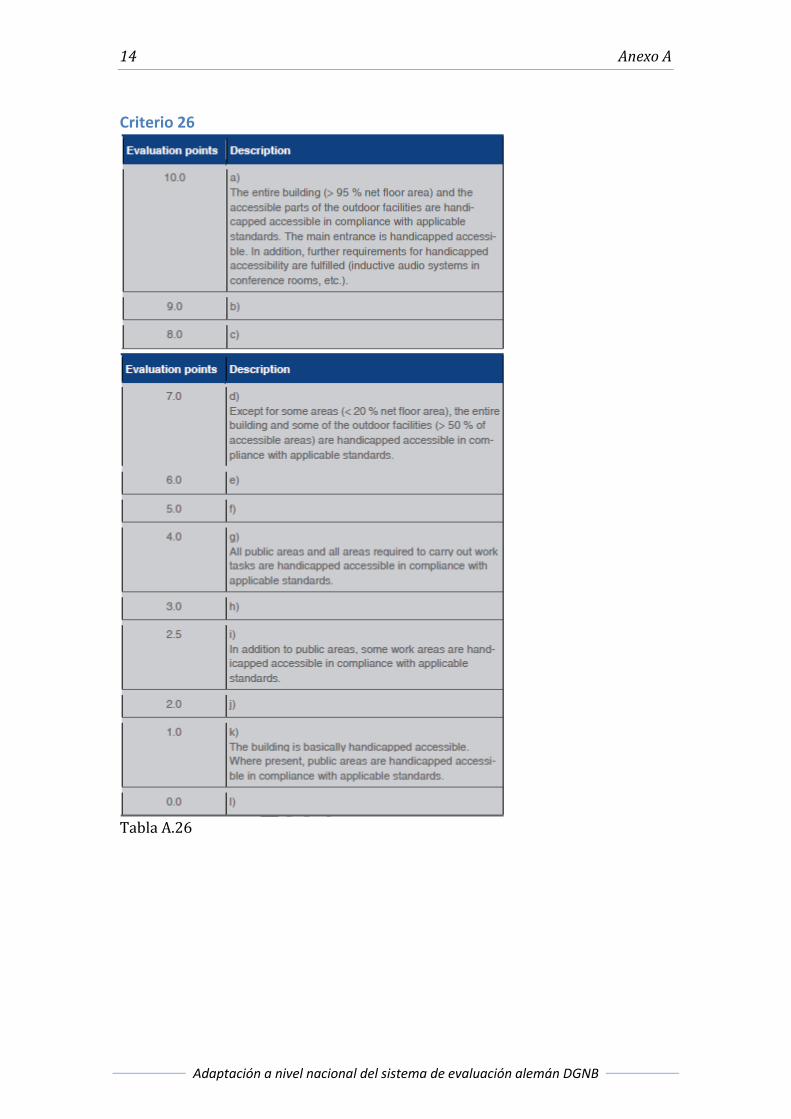
Criterio 26
Tabla A.26
Tablas de puntuación 15
Carlota Mas Carrera
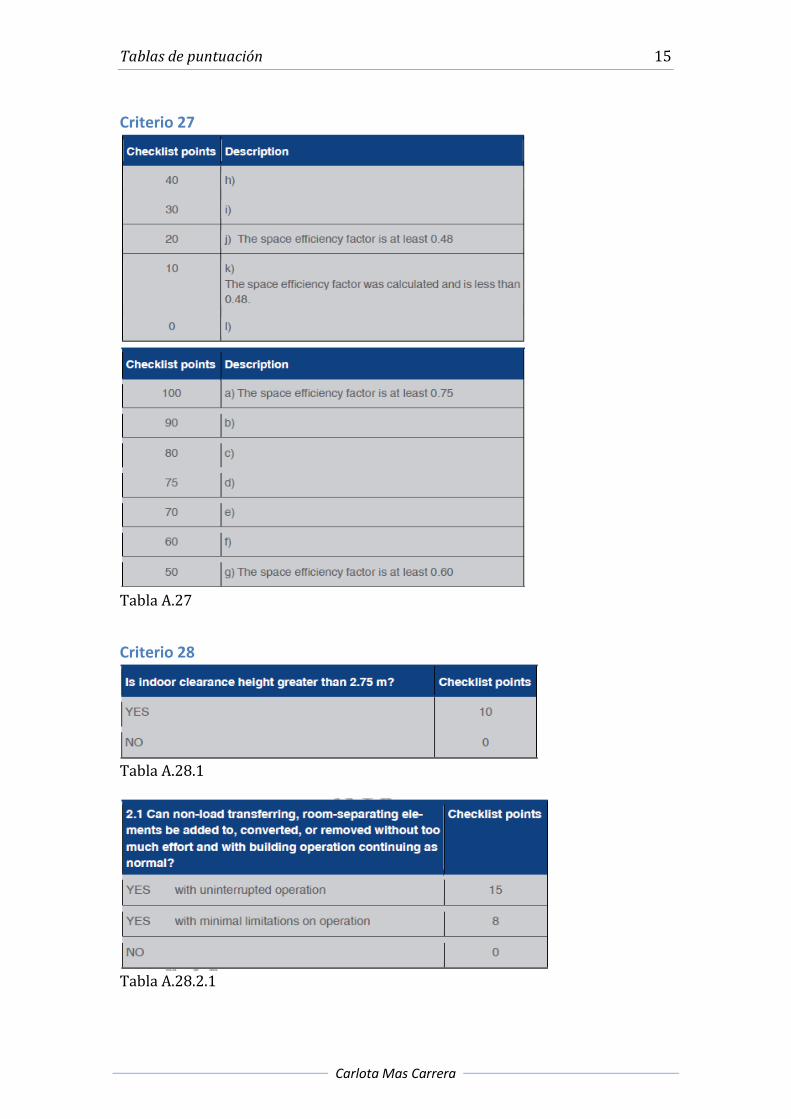
Criterio 27
Tabla A.27
Criterio 28
Tabla A.28.1
Tabla A.28.2.1

16 Anexo A
Adaptación a nivel nacional del sistema de evaluación alemán DGNB
Tabla A.28.2.2
Tabla A.28.3.1
Tabla A.28.3.2
Tabla A.28.3.3
Tabla A.28.4.1
Tablas de puntuación 17
Carlota Mas Carrera
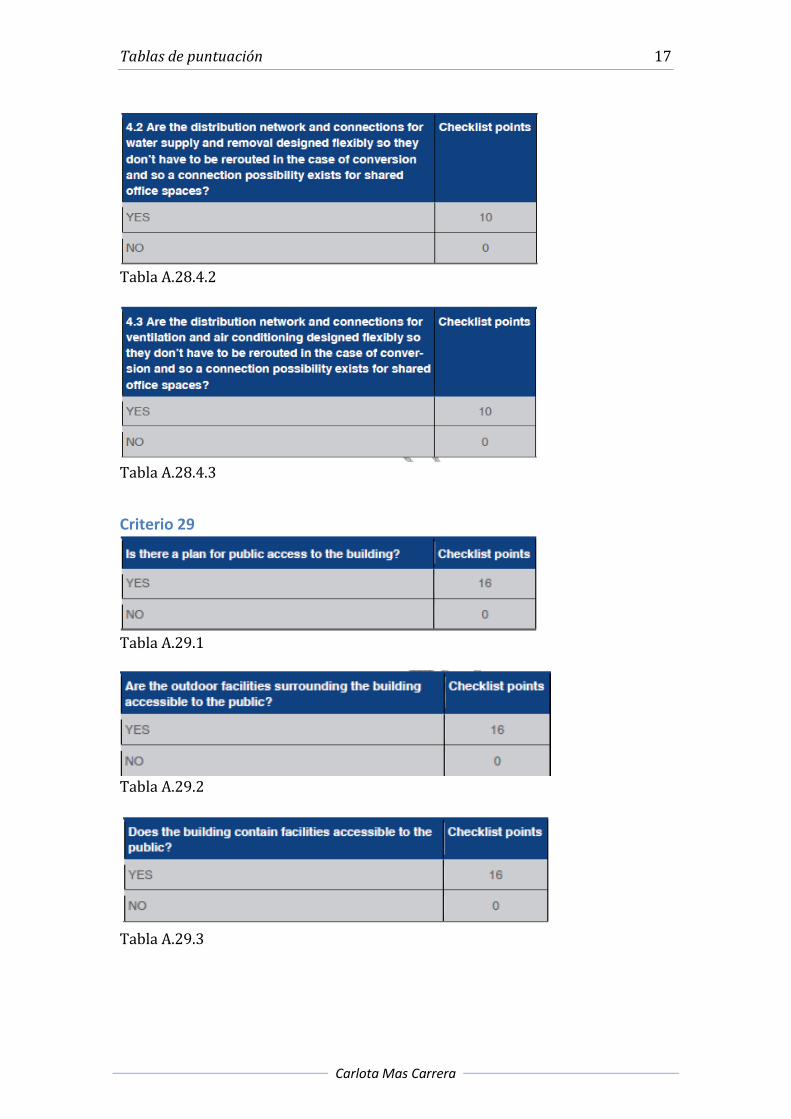
Tabla A.28.4.2
Tabla A.28.4.3
Criterio 29
Tabla A.29.1
Tabla A.29.2
Tabla A.29.3

18 Anexo A
Adaptación a nivel nacional del sistema de evaluación alemán DGNB
Tabla A.29.4
Tabla A.29.5
Criterio 30
Tabla A.30.1
Tabla A.30.2
Tablas de puntuación 19
Carlota Mas Carrera
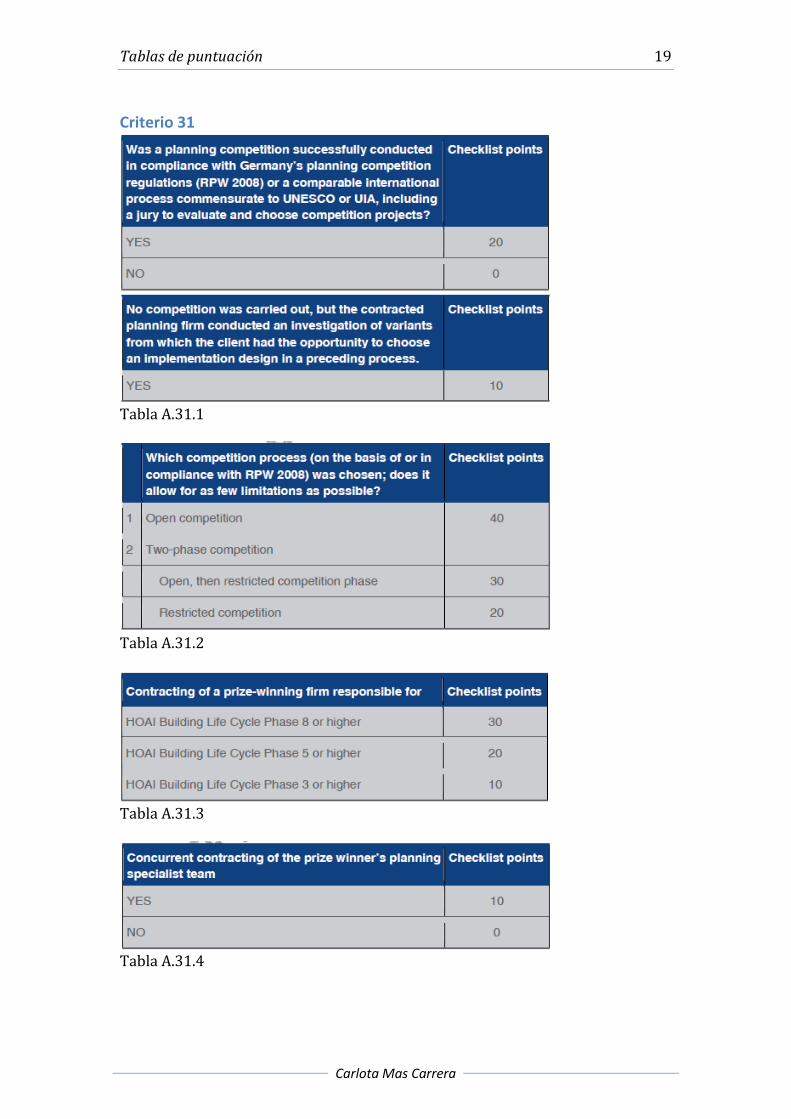
Criterio 31
Tabla A.31.1
Tabla A.31.2
Tabla A.31.3
Tabla A.31.4
20 Anexo A
Adaptación a nivel nacional del sistema de evaluación alemán DGNB
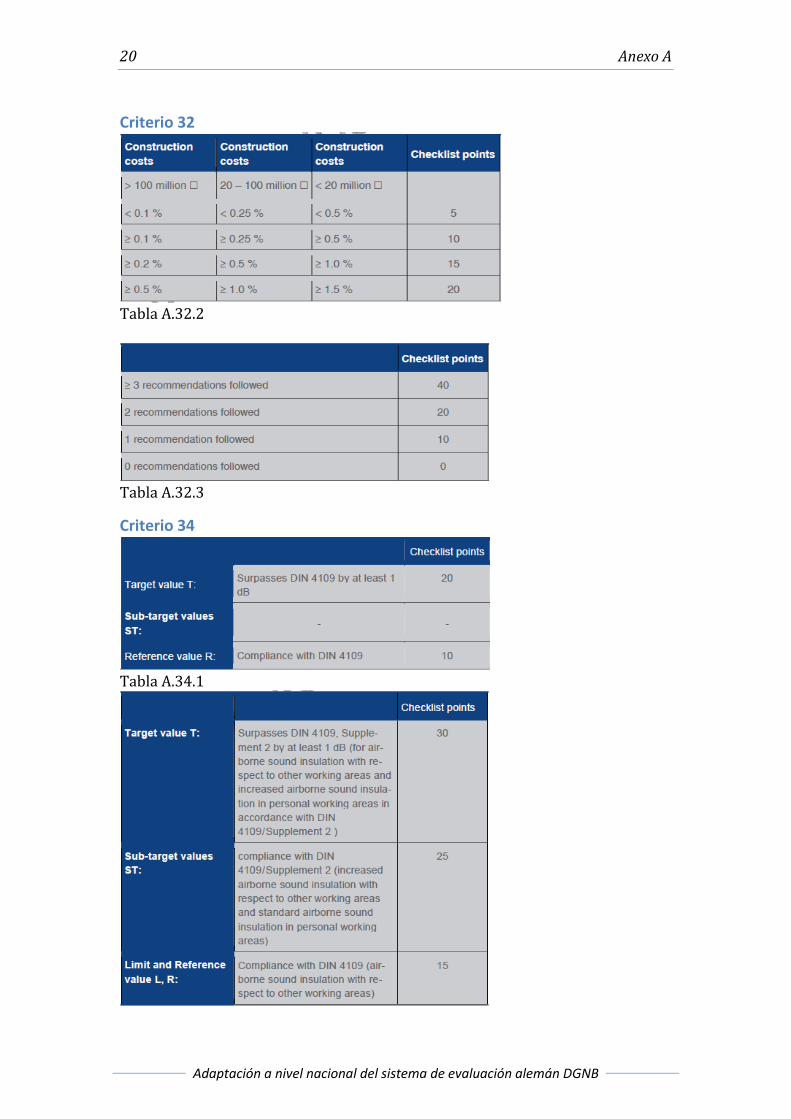
Criterio 32
Tabla A.32.2
Tabla A.32.3
Criterio 34
Tabla A.34.1
Tablas de puntuación 21
Carlota Mas Carrera
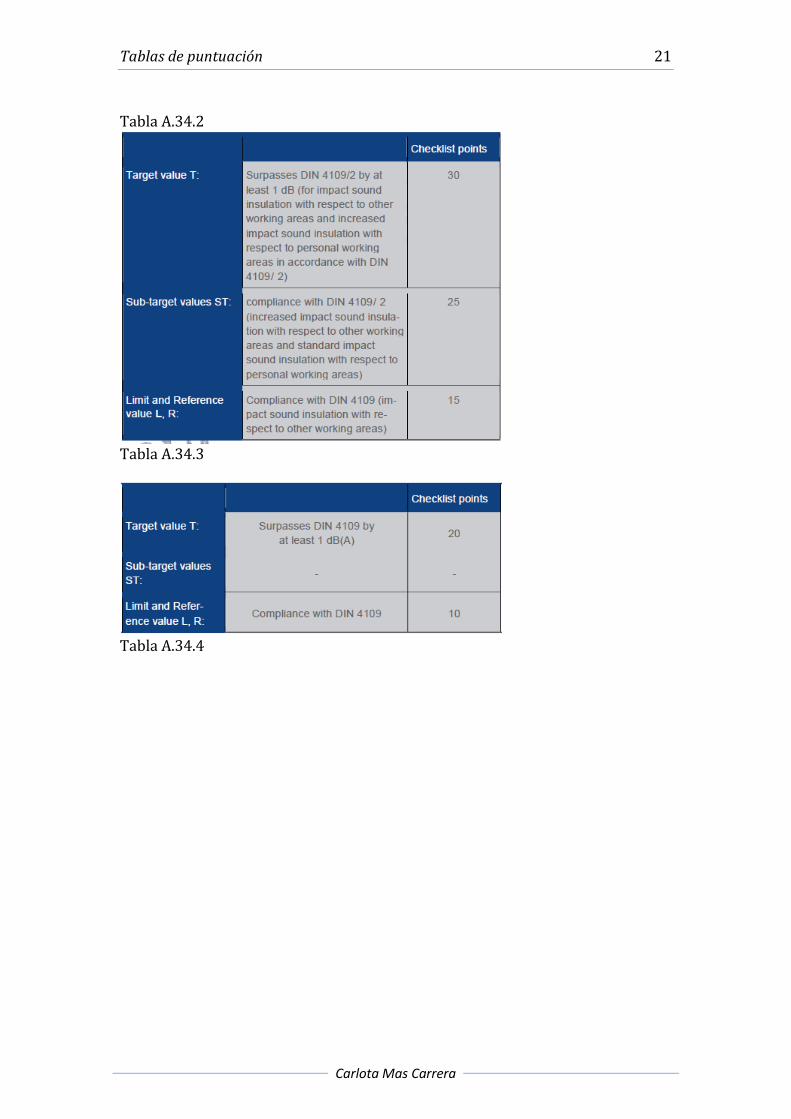
Tabla A.34.2
Tabla A.34.3
Tabla A.34.4
22 Anexo A
Adaptación a nivel nacional del sistema de evaluación alemán DGNB
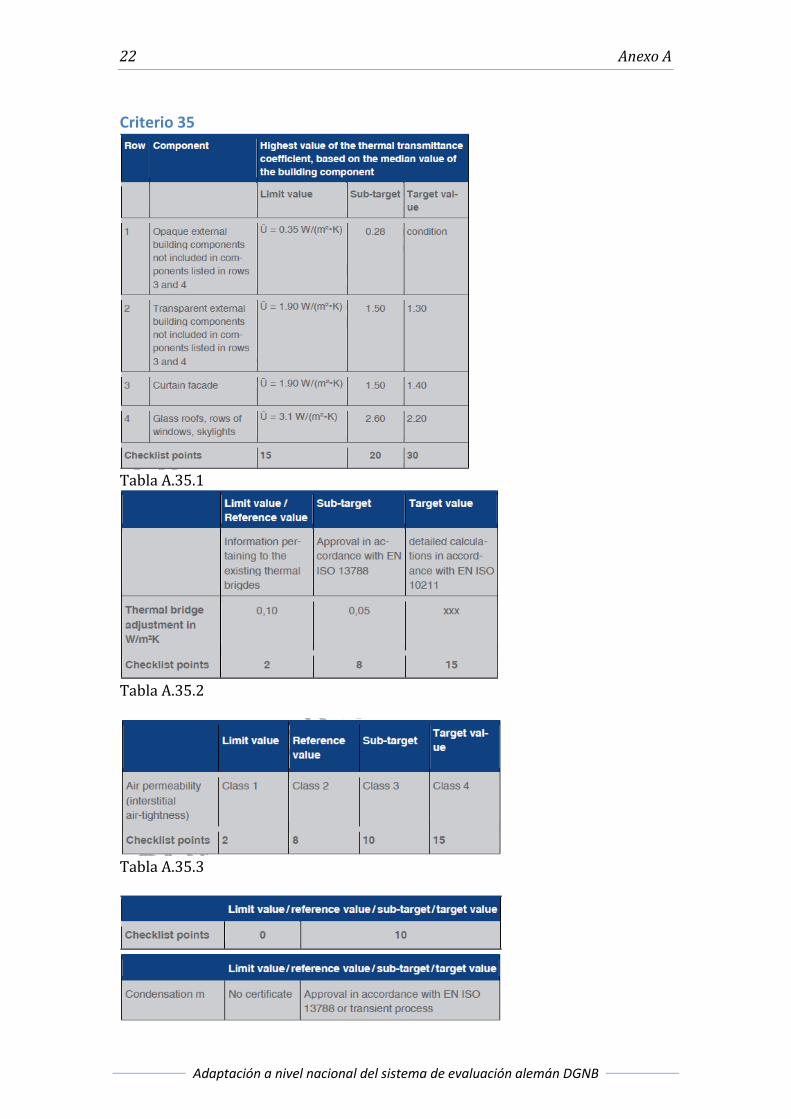
Criterio 35
Tabla A.35.1
Tabla A.35.2
Tabla A.35.3
Tablas de puntuación 23
Carlota Mas Carrera
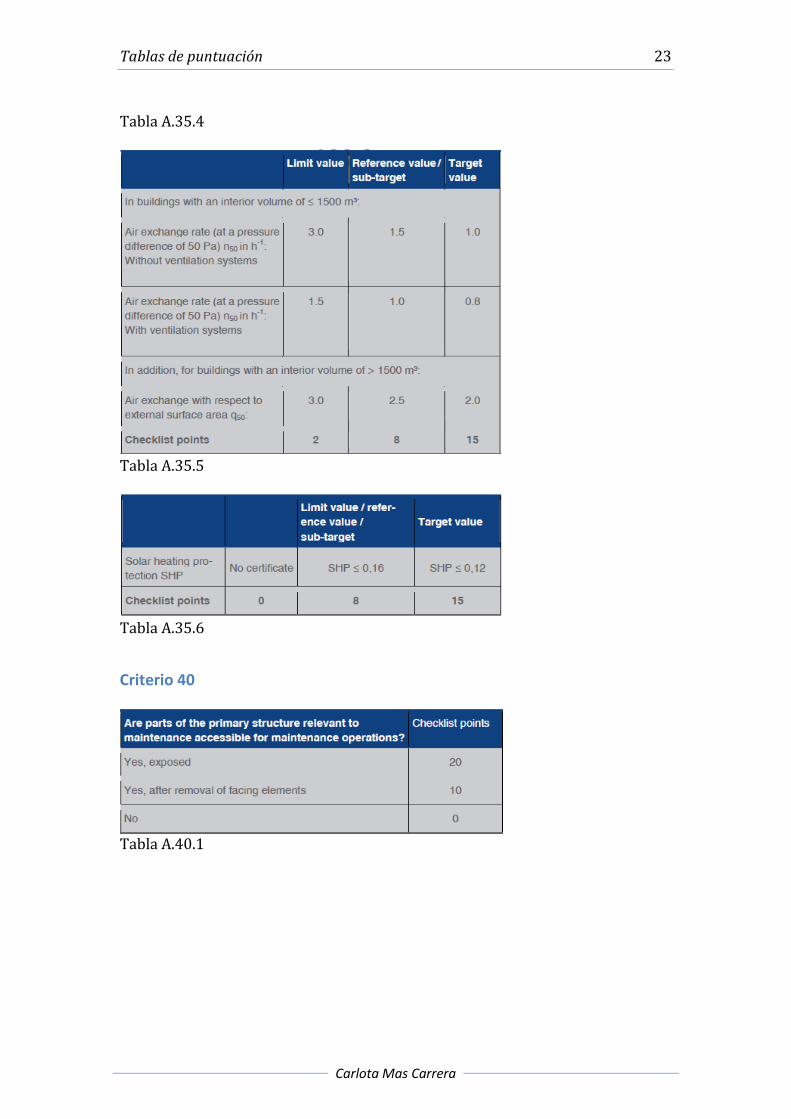
Tabla A.35.4
Tabla A.35.5
Tabla A.35.6
Criterio 40
Tabla A.40.1
24 Anexo A
Adaptación a nivel nacional del sistema de evaluación alemán DGNB
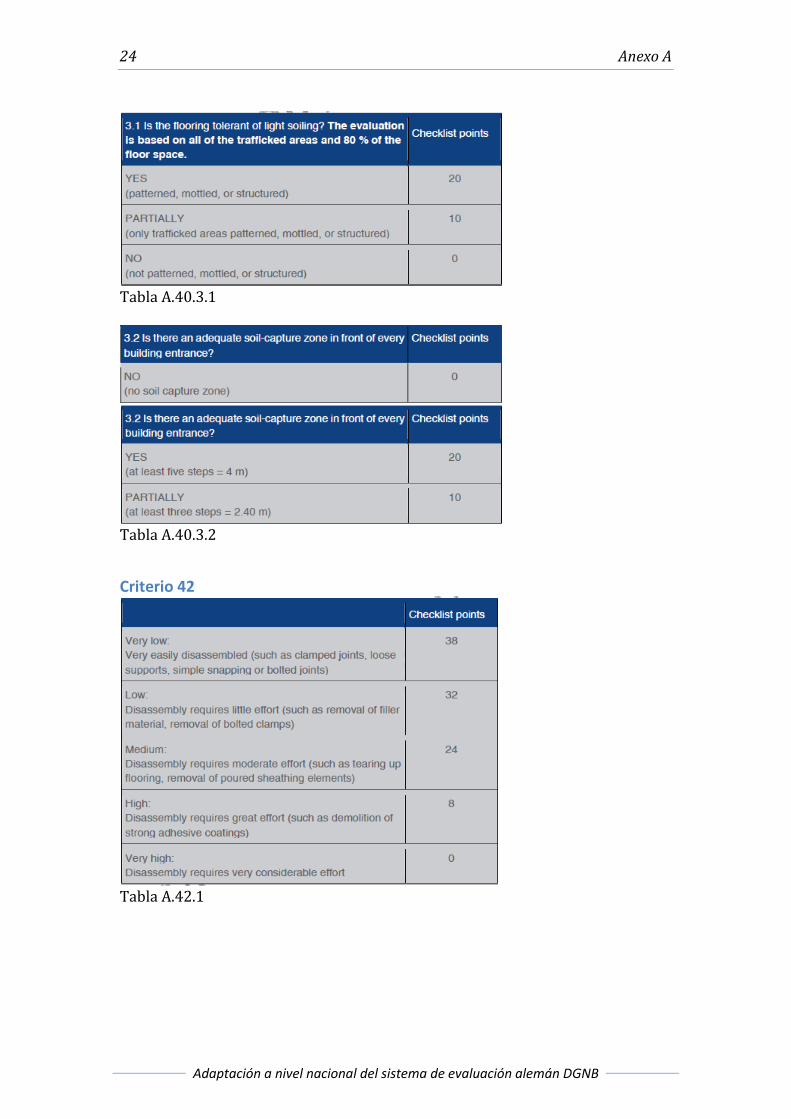
Tabla A.40.3.1
Tabla A.40.3.2
Criterio 42
Tabla A.42.1
Tablas de puntuación 25
Carlota Mas Carrera
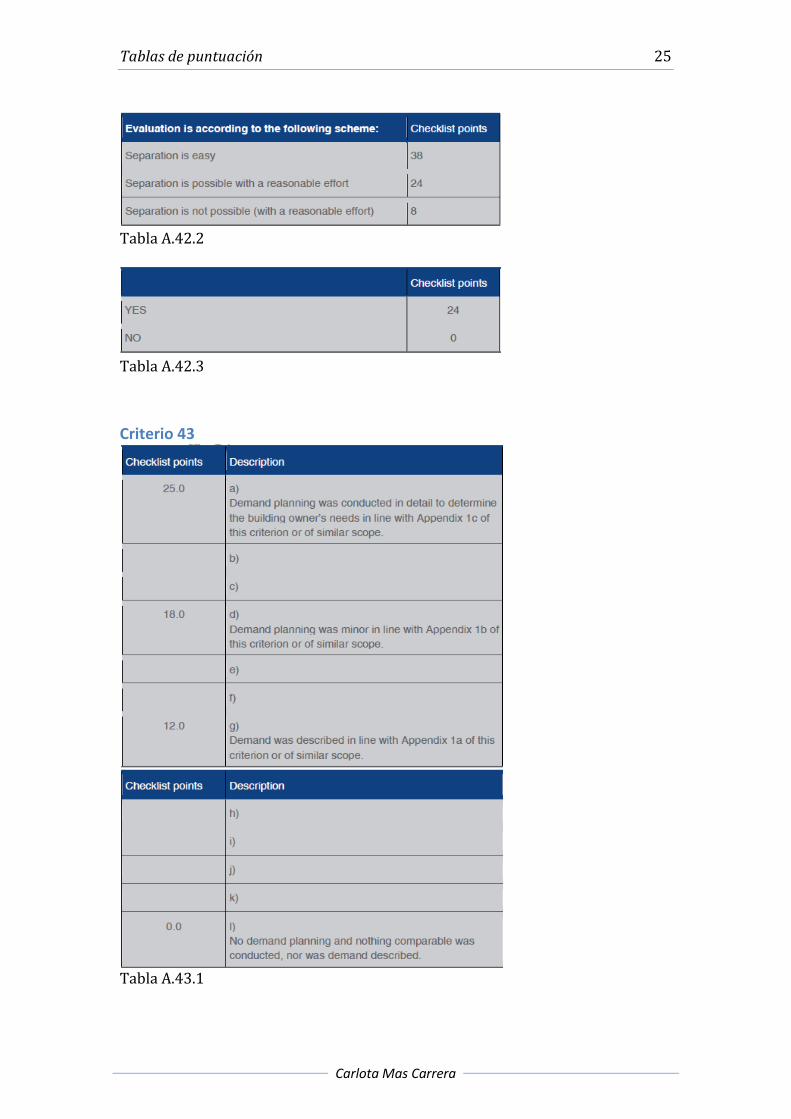
Tabla A.42.2
Tabla A.42.3
Criterio 43
Tabla A.43.1

26 Anexo A
Adaptación a nivel nacional del sistema de evaluación alemán DGNB
Tabla A.43.2
Tablas de puntuación 27
Carlota Mas Carrera
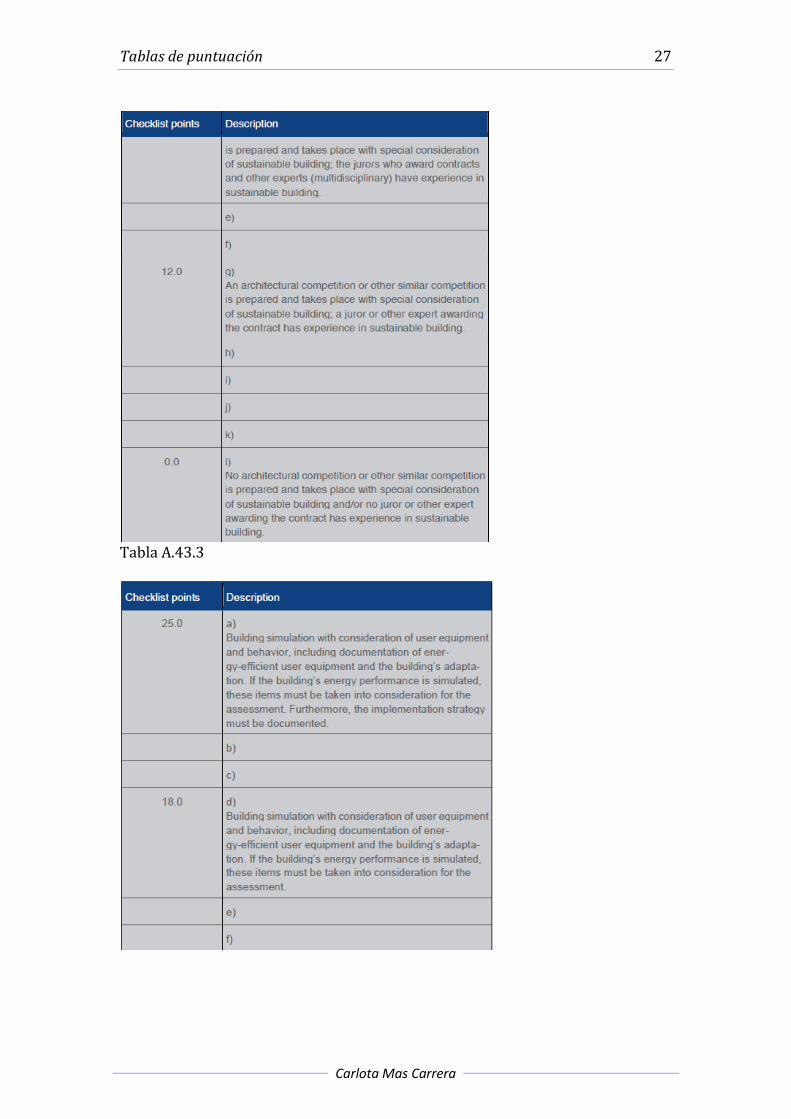
Tabla A.43.3
28 Anexo A
Adaptación a nivel nacional del sistema de evaluación alemán DGNB
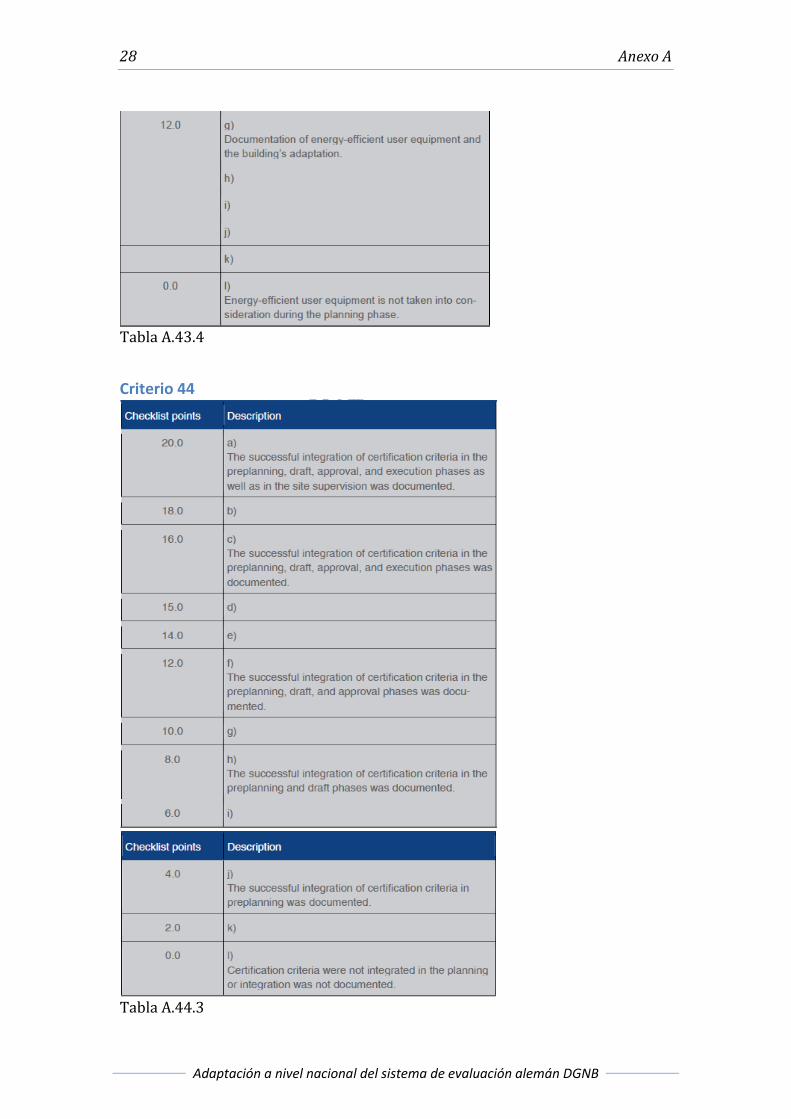
Tabla A.43.4
Criterio 44
Tabla A.44.3
Tablas de puntuación 29
Carlota Mas Carrera
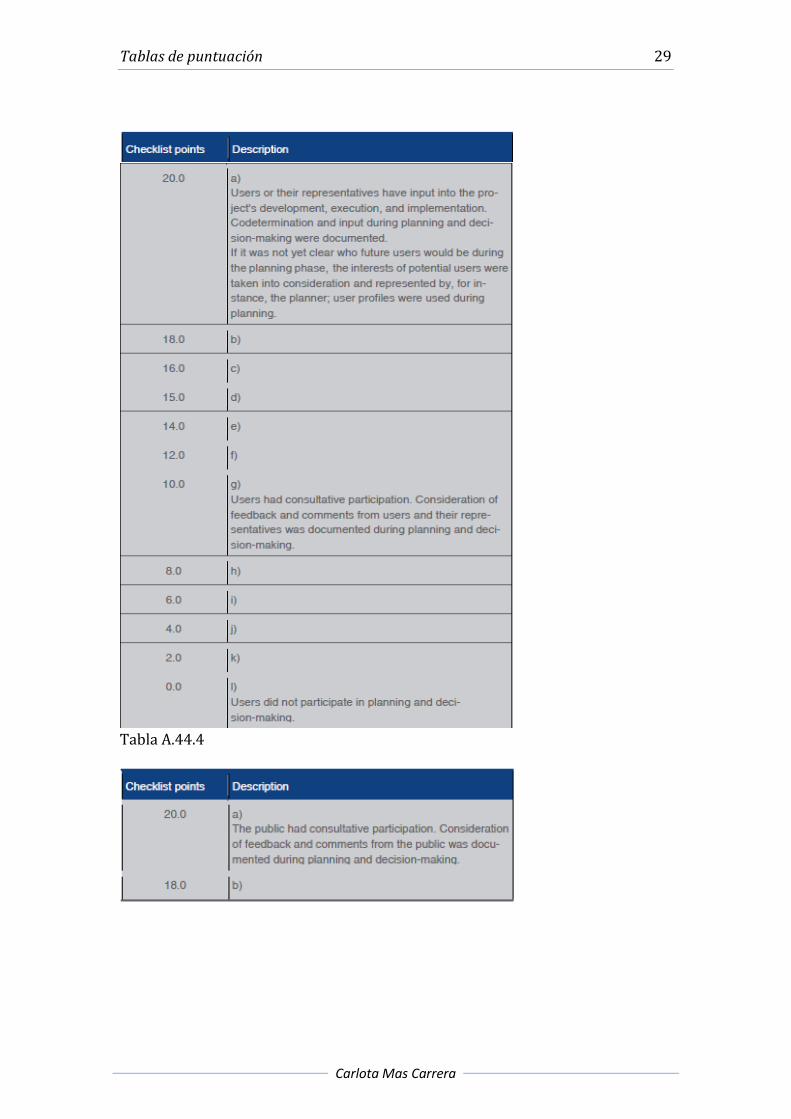
Tabla A.44.4
30 Anexo A
Adaptación a nivel nacional del sistema de evaluación alemán DGNB
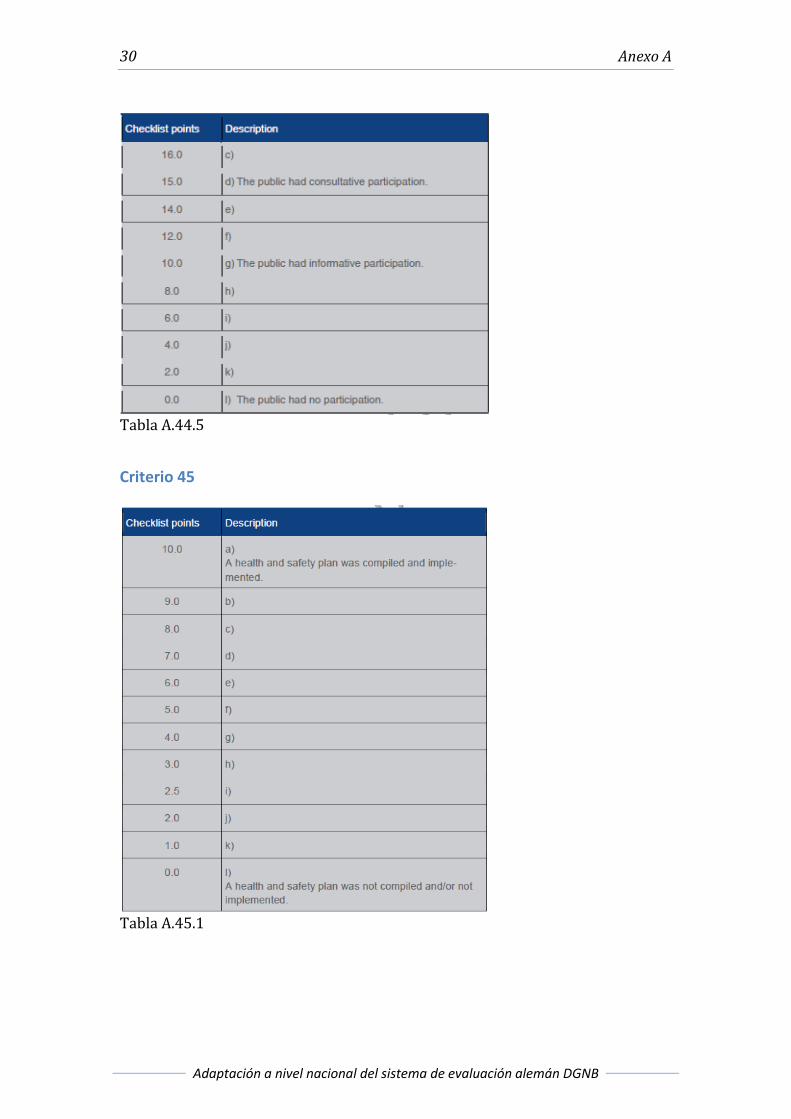
Tabla A.44.5
Criterio 45
Tabla A.45.1

Tablas de puntuación 31
Carlota Mas Carrera
Tabla A.45.2
32 Anexo A
Adaptación a nivel nacional del sistema de evaluación alemán DGNB
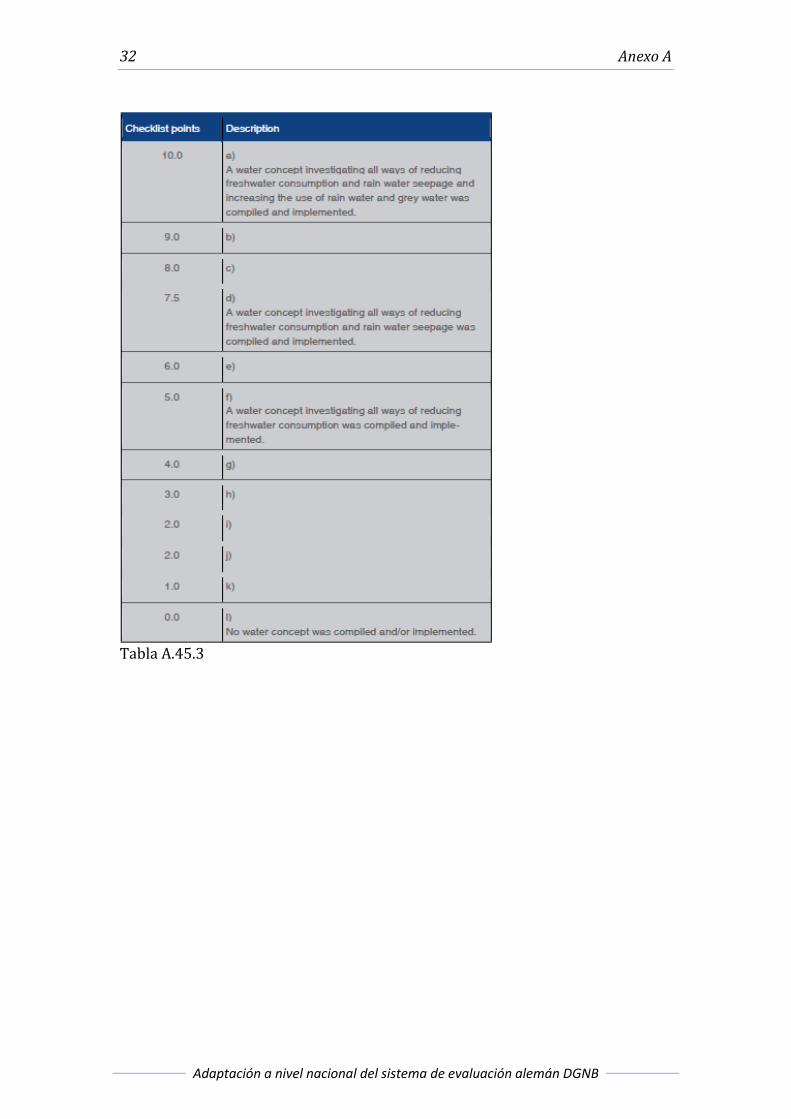
Tabla A.45.3
Tablas de puntuación 33
Carlota Mas Carrera
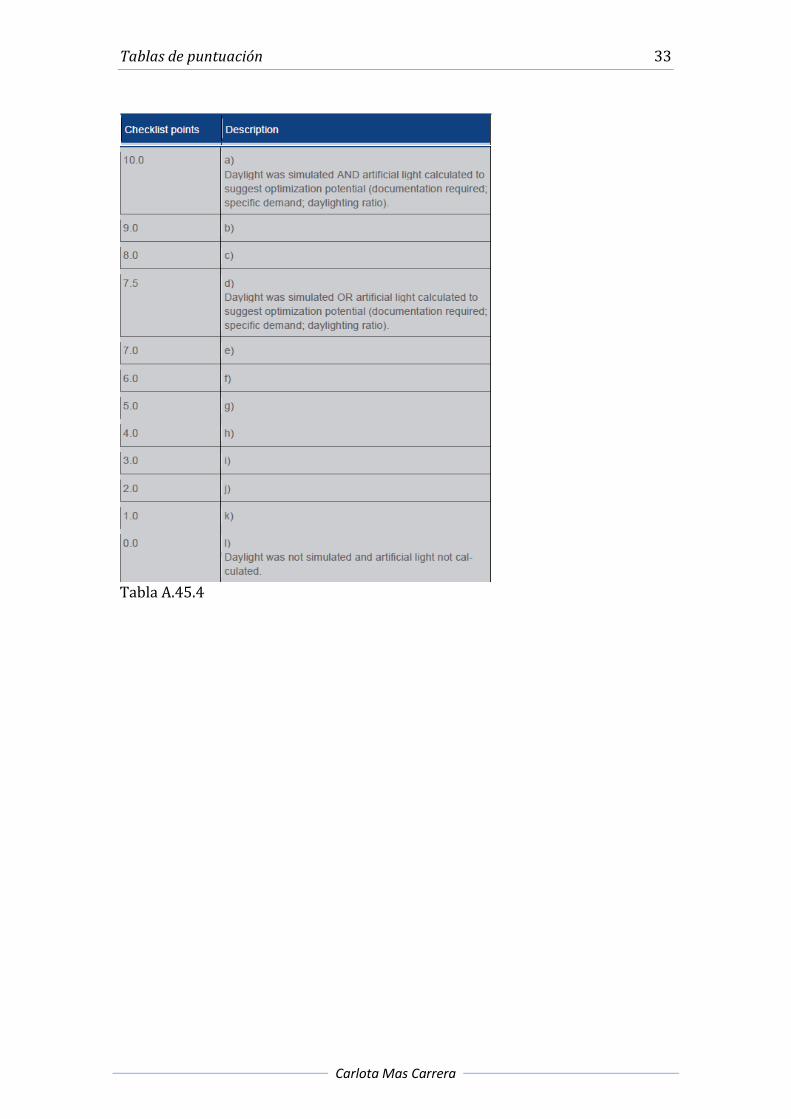
Tabla A.45.4
34 Anexo A
Adaptación a nivel nacional del sistema de evaluación alemán DGNB
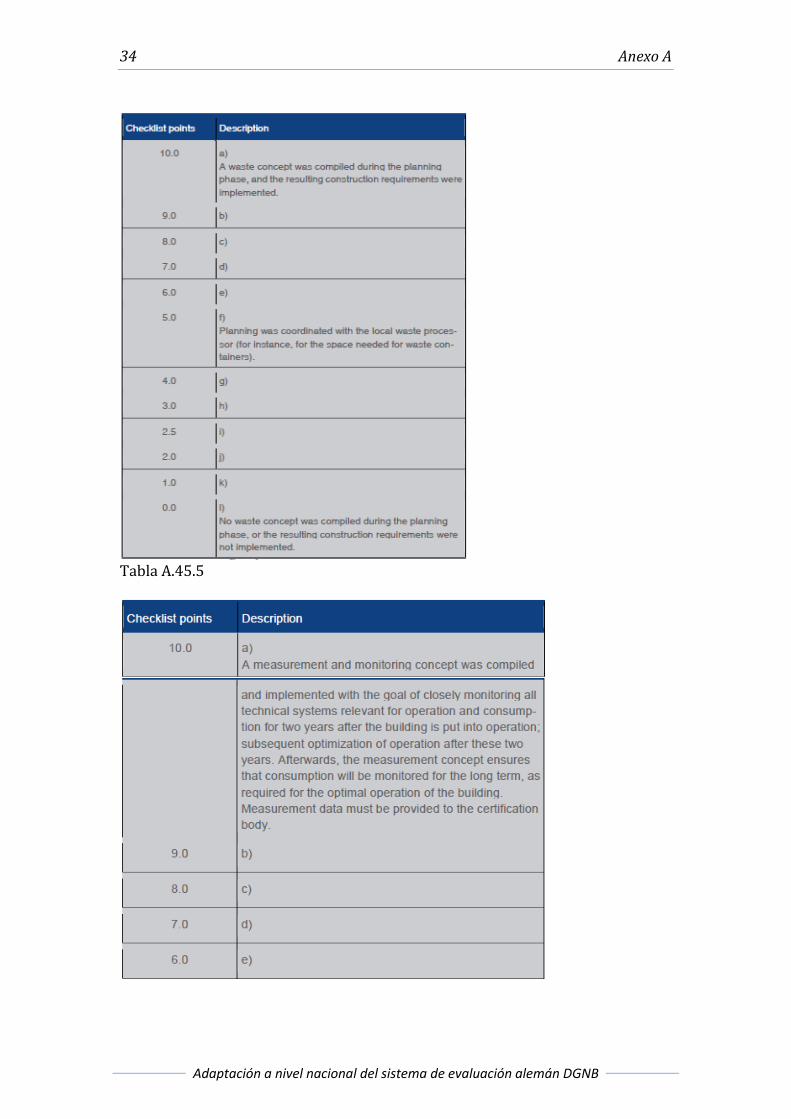
Tabla A.45.5
Tablas de puntuación 35
Carlota Mas Carrera
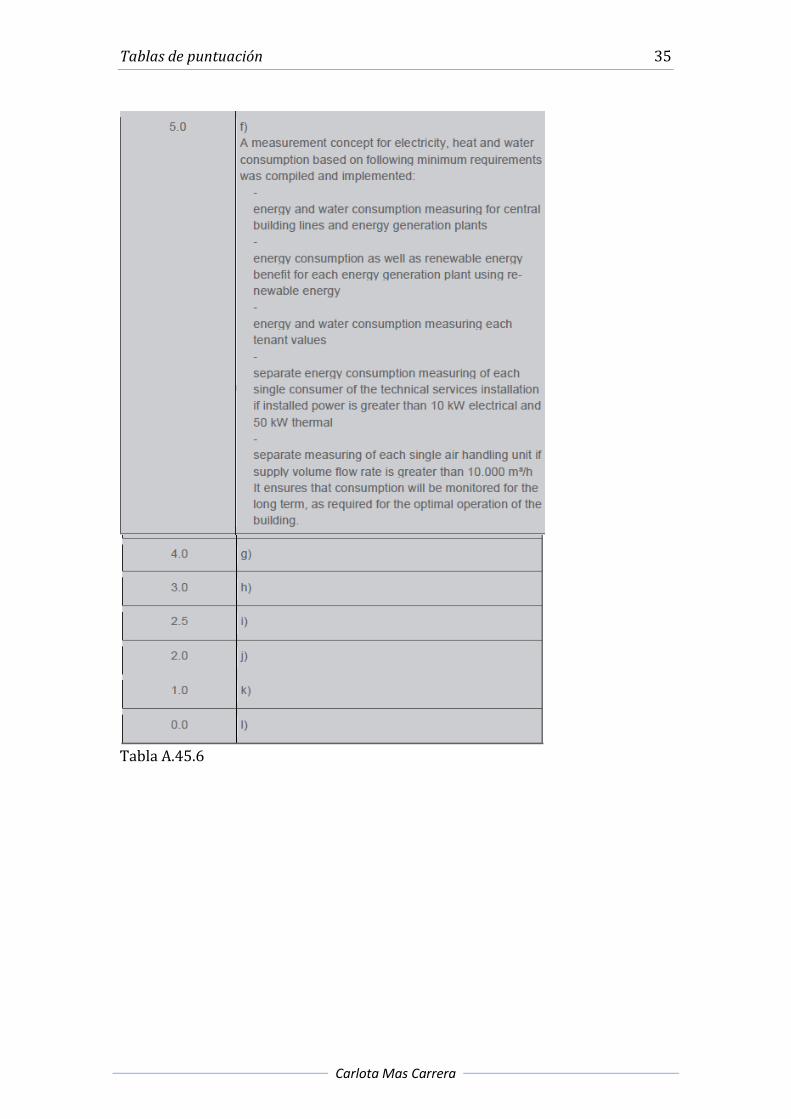
Tabla A.45.6
36 Anexo A
Adaptación a nivel nacional del sistema de evaluación alemán DGNB
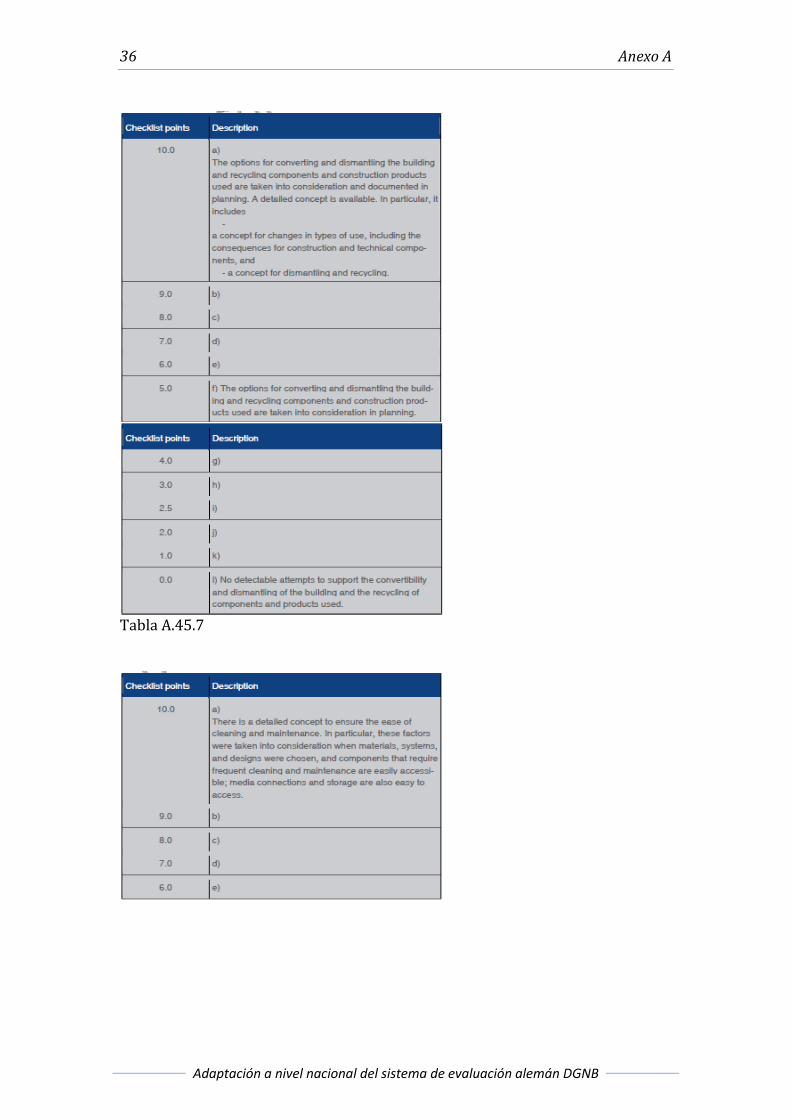
Tabla A.45.7
Tablas de puntuación 37
Carlota Mas Carrera
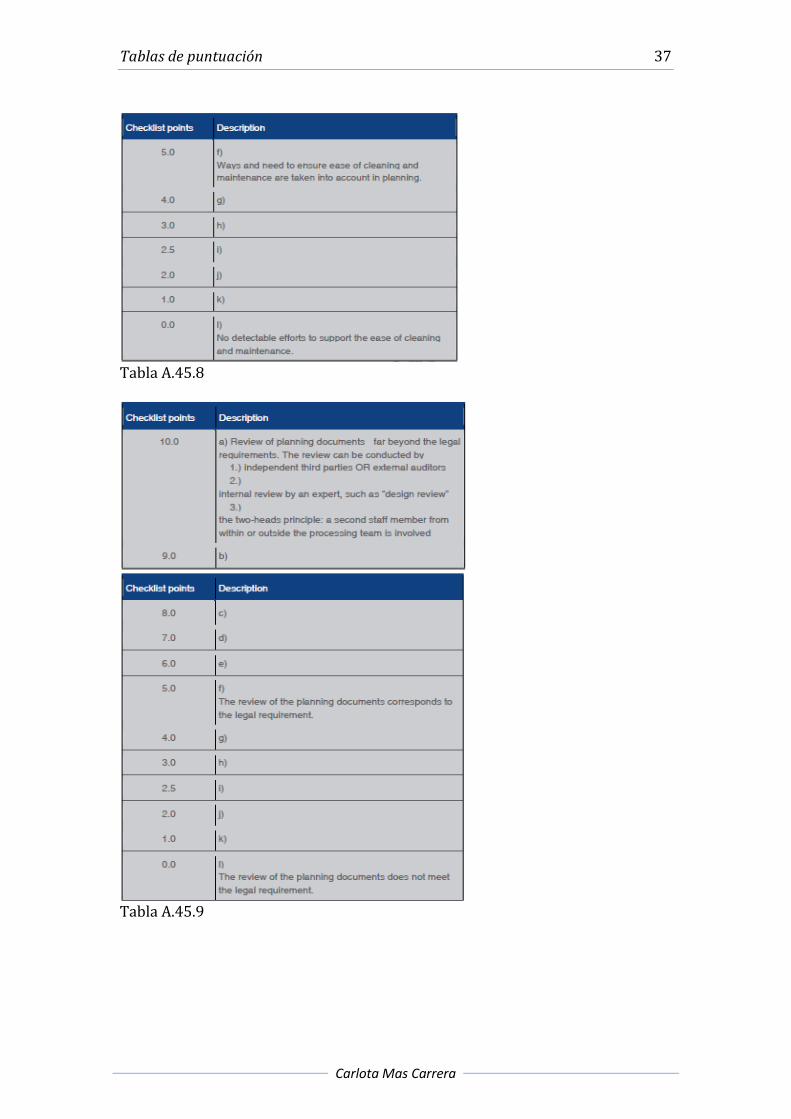
Tabla A.45.8
Tabla A.45.9

38 Anexo A
Adaptación a nivel nacional del sistema de evaluación alemán DGNB
Tabla A.45.10
Criterio 46
Tablas de puntuación 39
Carlota Mas Carrera
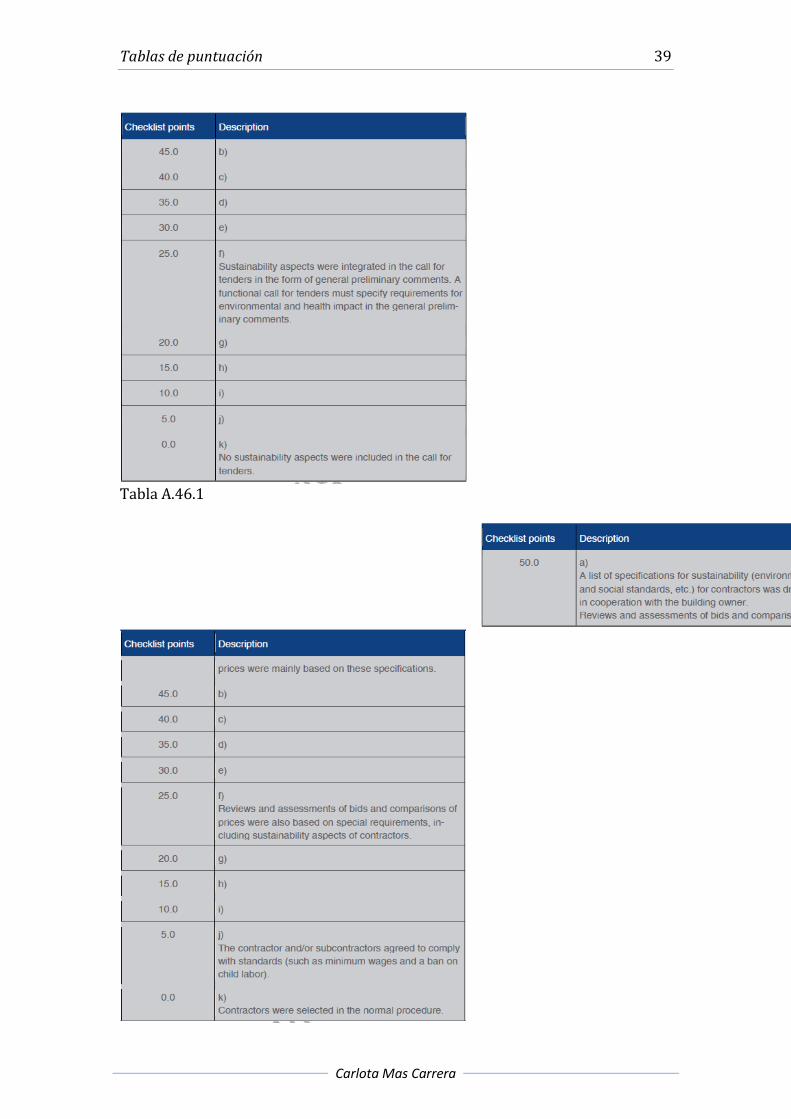
Tabla A.46.1
40 Anexo A
Adaptación a nivel nacional del sistema de evaluación alemán DGNB
Tabla A.46.2
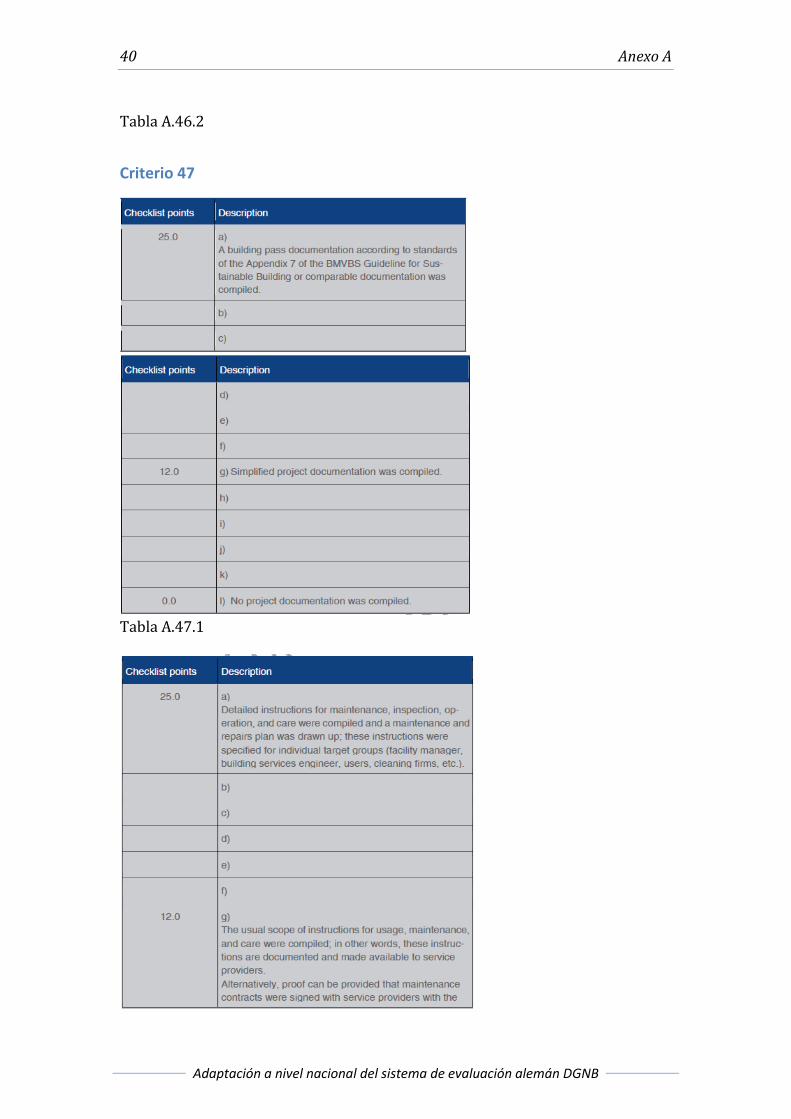
Criterio 47
Tabla A.47.1
Tablas de puntuación 41
Carlota Mas Carrera
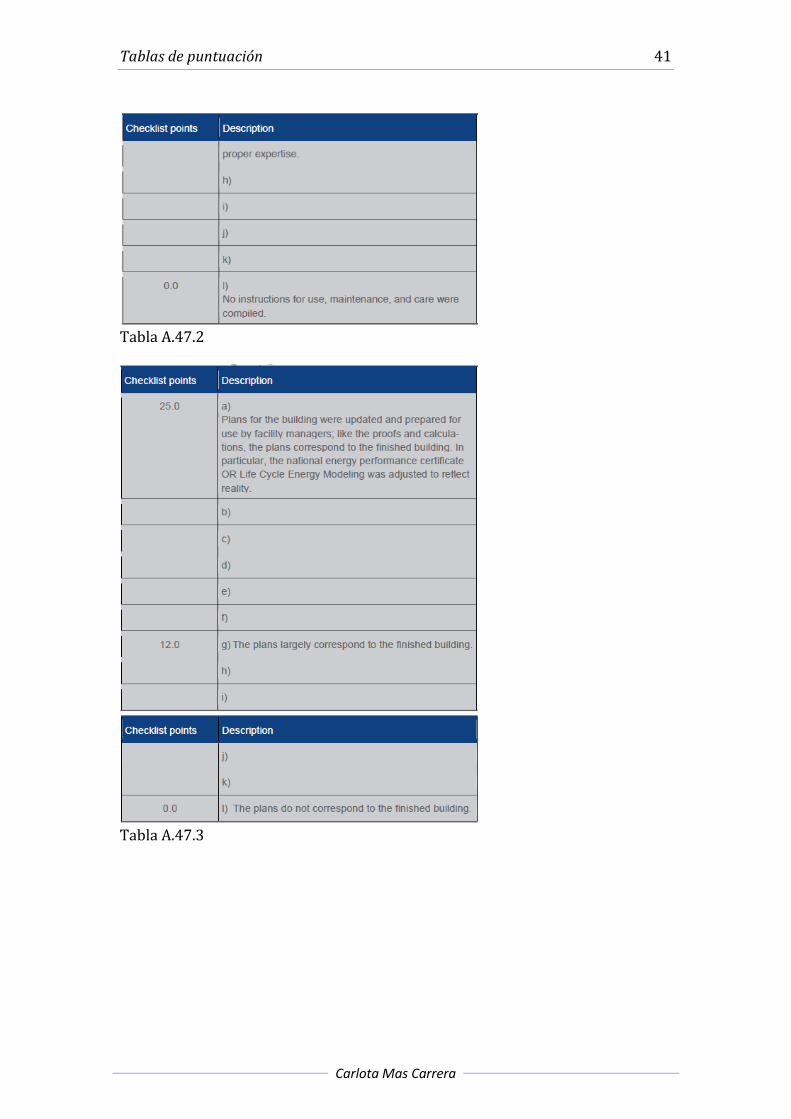
Tabla A.47.2
Tabla A.47.3
42 Anexo A
Adaptación a nivel nacional del sistema de evaluación alemán DGNB
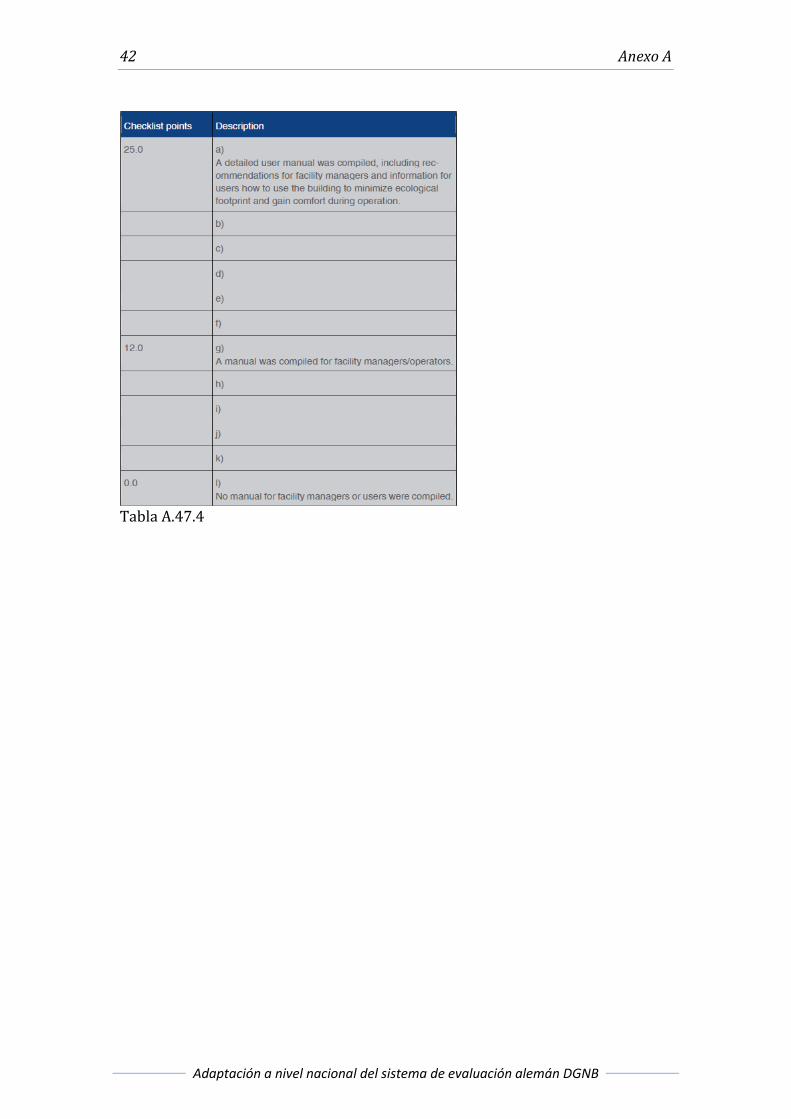
Tabla A.47.4
Tablas de puntuación 43
Carlota Mas Carrera
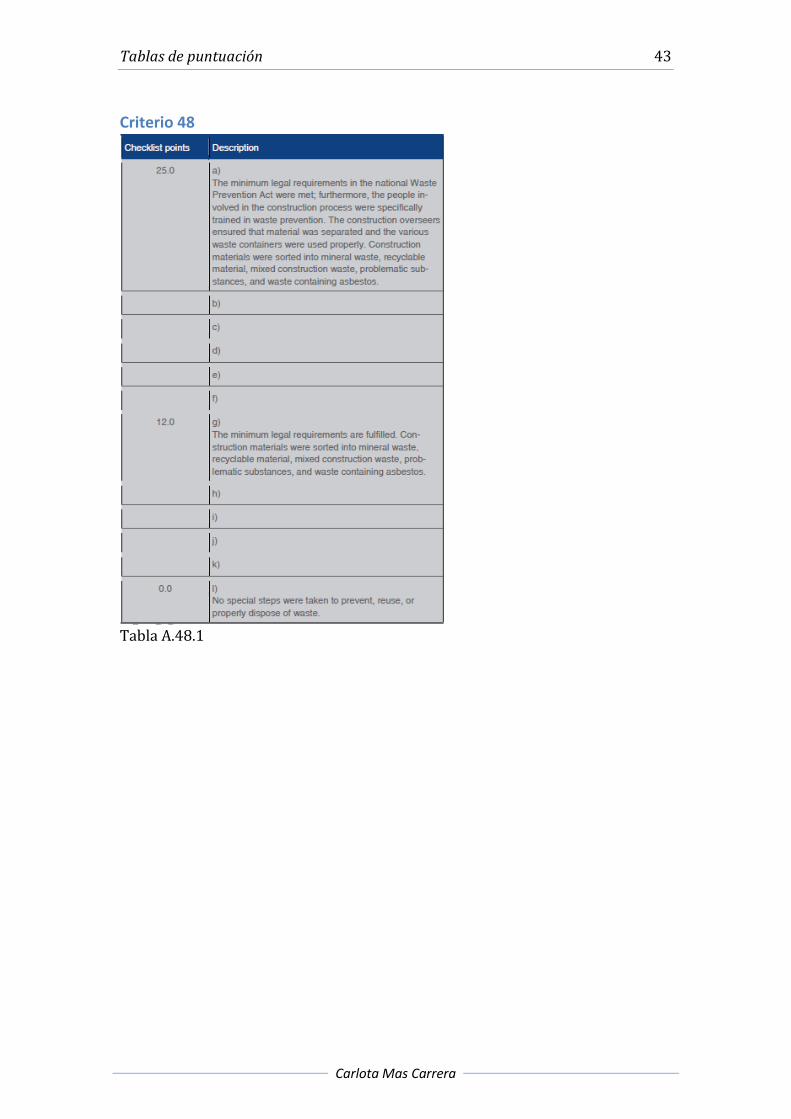
Criterio 48
Tabla A.48.1
44 Anexo A
Adaptación a nivel nacional del sistema de evaluación alemán DGNB
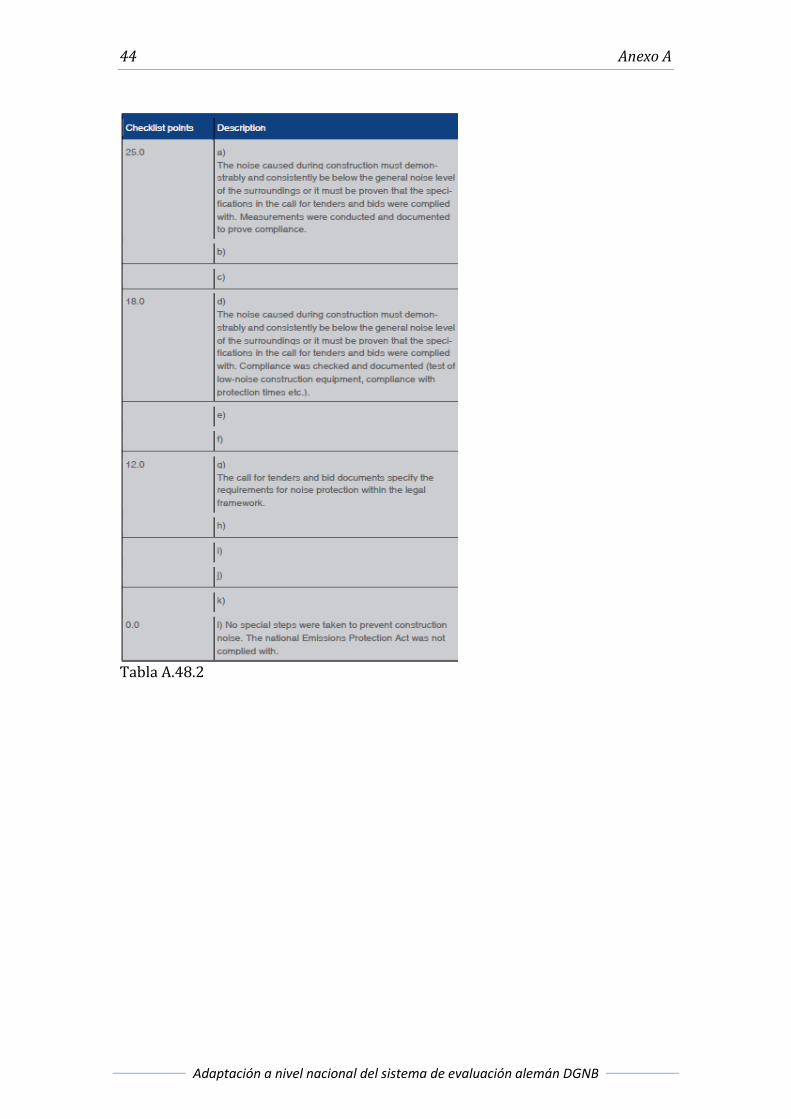
Tabla A.48.2

Tablas de puntuación 45
Carlota Mas Carrera
Tabla A.48.3

46 Anexo A
Adaptación a nivel nacional del sistema de evaluación alemán DGNB
Tabla A.48.4
Tablas de puntuación 47
Carlota Mas Carrera
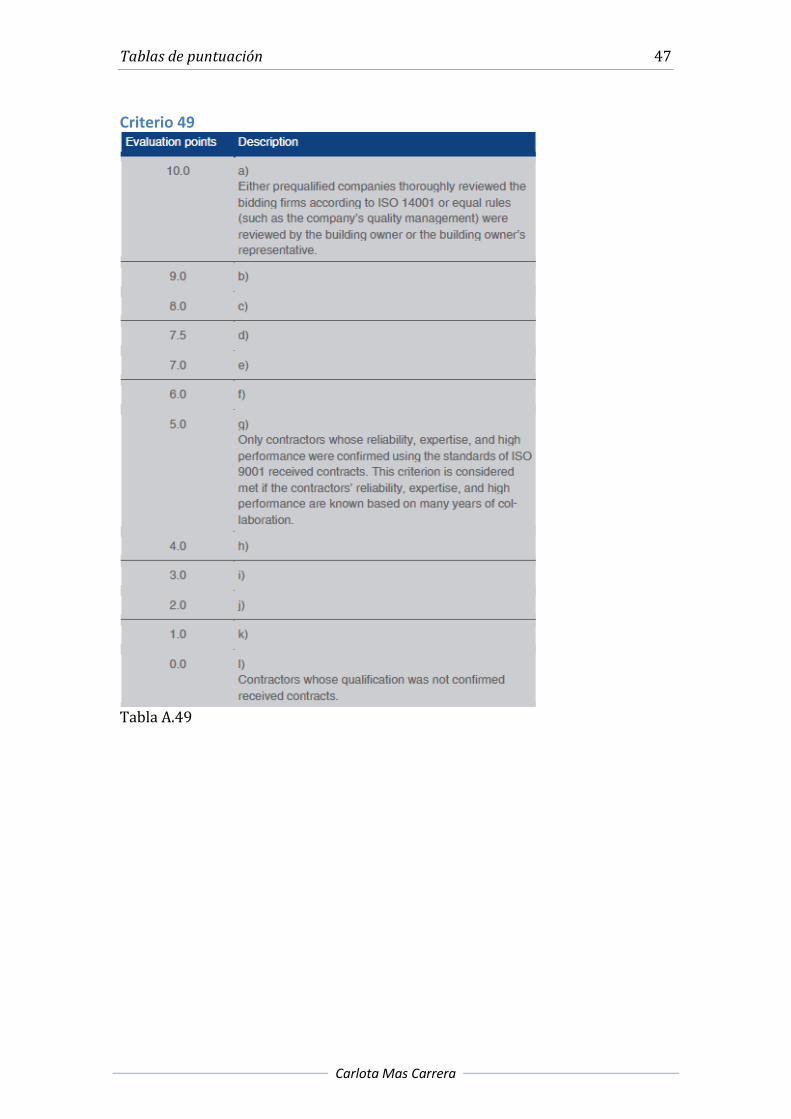
Criterio 49
Tabla A.49
48 Anexo A
Adaptación a nivel nacional del sistema de evaluación alemán DGNB
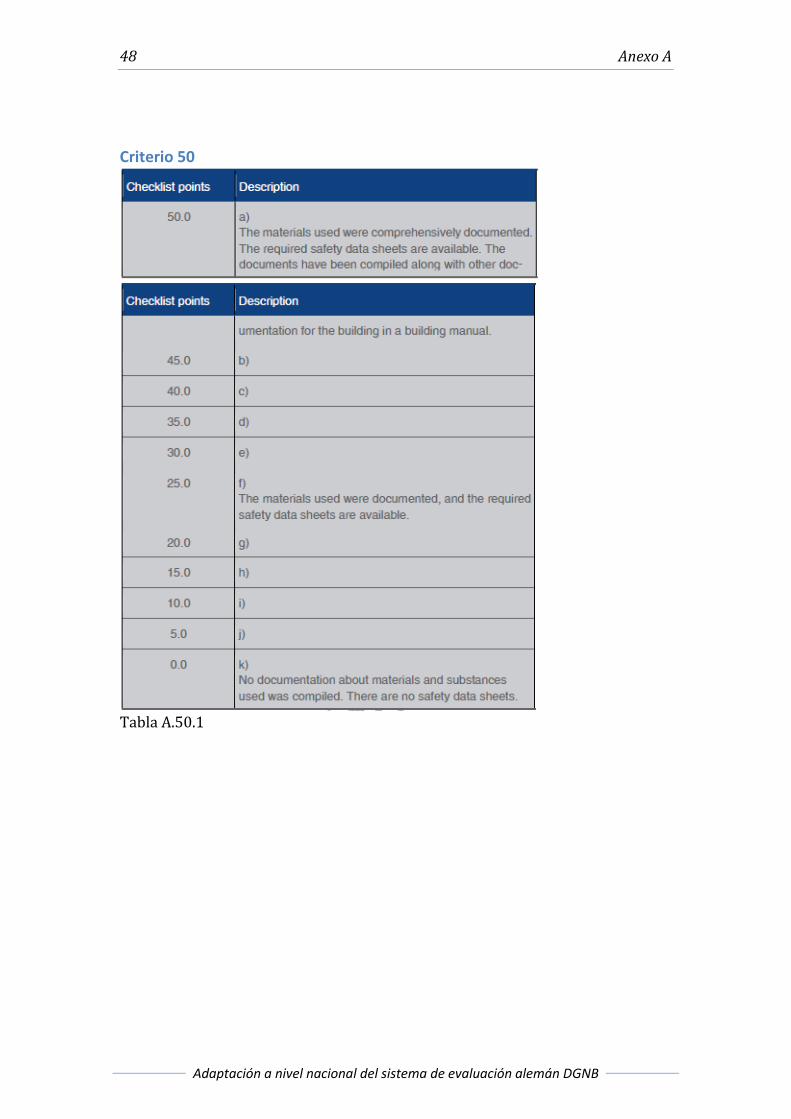
Criterio 50
Tabla A.50.1
Tablas de puntuación 49
Carlota Mas Carrera
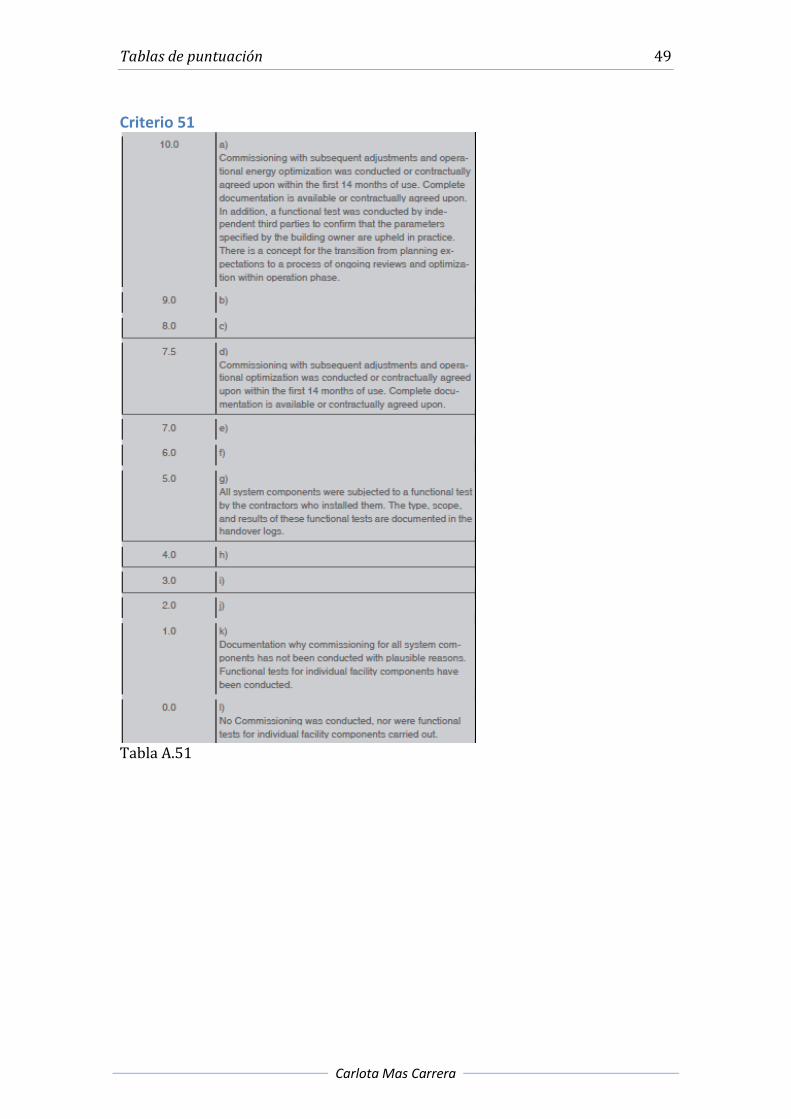
Criterio 51
Tabla A.51
50 Anexo A
Adaptación a nivel nacional del sistema de evaluación alemán DGNB
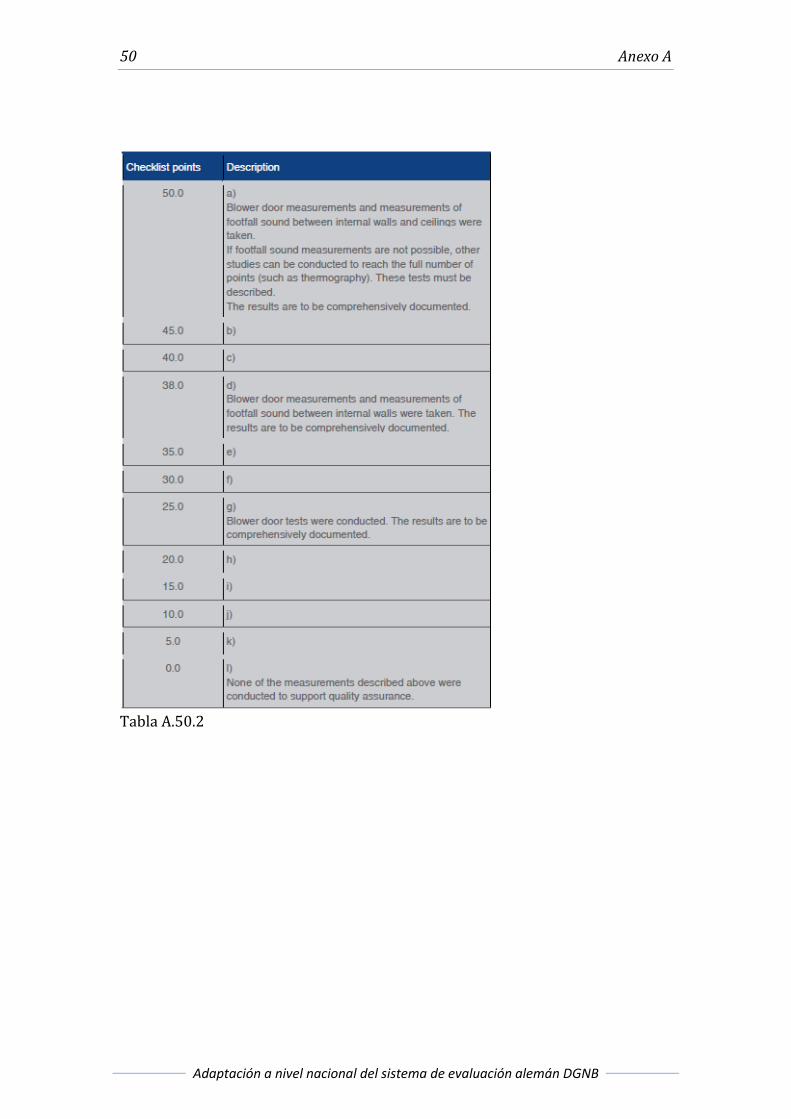
Tabla A.50.2
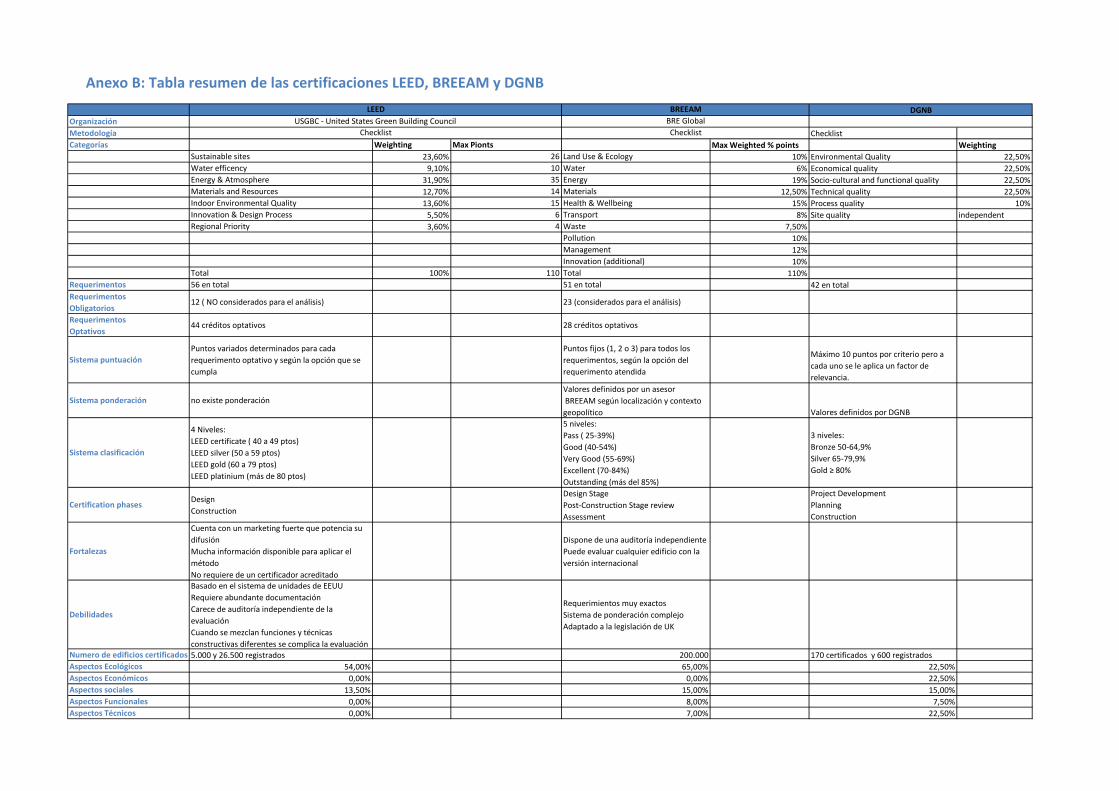
Organización
Metodología Checklist
Categorías Weighting Max Pionts Max Weighted % points Weighting
Sustainable sites 23,60% 26 Land Use & Ecology 10% Environmental Quality 22,50%
Water efficency 9,10% 10 Water 6% Economical quality 22,50%
Energy & Atmosphere 31,90% 35 Energy 19% Socio-cultural and functional quality 22,50%
Materials and Resources 12,70% 14 Materials 12,50% Technical quality 22,50%
Indoor Environmental Quality 13,60% 15 Health & Wellbeing 15% Process quality 10%
Innovation & Design Process 5,50% 6 Transport 8% Site quality independent
Regional Priority 3,60% 4 Waste 7,50%
Pollution 10%
Management 12%
Innovation (additional) 10%
Total 100% 110 Total 110%
Requerimentos 56 en total 51 en total 42 en total
Requerimentos
Obligatorios12 ( NO considerados para el análisis) 23 (considerados para el análisis)
Requerimentos
Optativos44 créditos optativos 28 créditos optativos
Sistema puntuación
Puntos variados determinados para cada
requerimento optativo y según la opción que se
cumpla
Puntos fijos (1, 2 o 3) para todos los
requerimentos, según la opción del
requerimento atendida
Máximo 10 puntos por criterio pero a
cada uno se le aplica un factor de
relevancia.
Sistema ponderación no existe ponderación
Valores definidos por un asesor
BREEAM según localización y contexto
geopolítico Valores definidos por DGNB
Sistema clasificación
4 Niveles:
LEED certificate ( 40 a 49 ptos)
LEED silver (50 a 59 ptos)
LEED gold (60 a 79 ptos)
LEED platinium (más de 80 ptos)
5 niveles:
Pass ( 25-39%)
Good (40-54%)
Very Good (55-69%)
Excellent (70-84%)
Outstanding (más del 85%)
3 niveles:
Bronze 50-64,9%
Silver 65-79,9%
Gold ≥ 80%
Certification phasesDesign
Construction
Design Stage
Post-Construction Stage review
Assessment
Project Development
Planning
Construction
Fortalezas
Cuenta con un marketing fuerte que potencia su
difusión
Mucha información disponible para aplicar el
método
No requiere de un certificador acreditado
Dispone de una auditoría independiente
Puede evaluar cualquier edificio con la
versión internacional
Debilidades
Basado en el sistema de unidades de EEUU
Requiere abundante documentación
Carece de auditoría independiente de la
evaluación
Cuando se mezclan funciones y técnicas
constructivas diferentes se complica la evaluación
Requerimientos muy exactos
Sistema de ponderación complejo
Adaptado a la legislación de UK
Numero de edificios certificados 5.000 y 26.500 registrados 200.000 170 certificados y 600 registrados
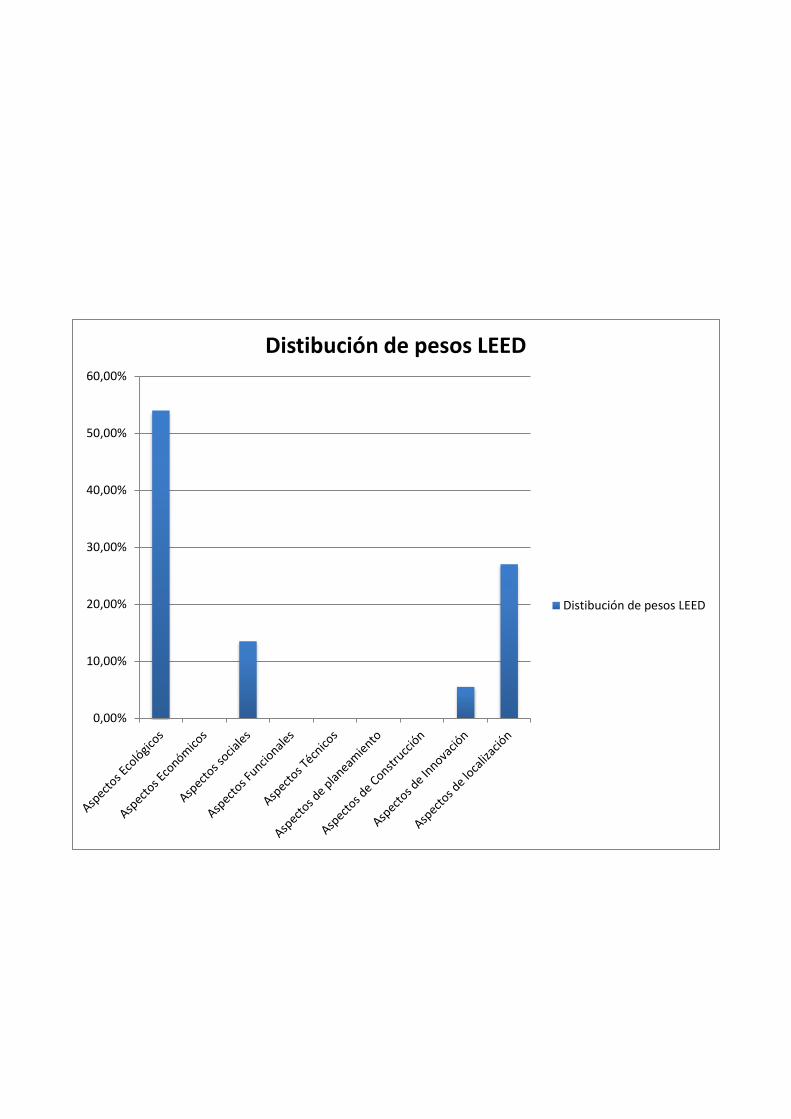
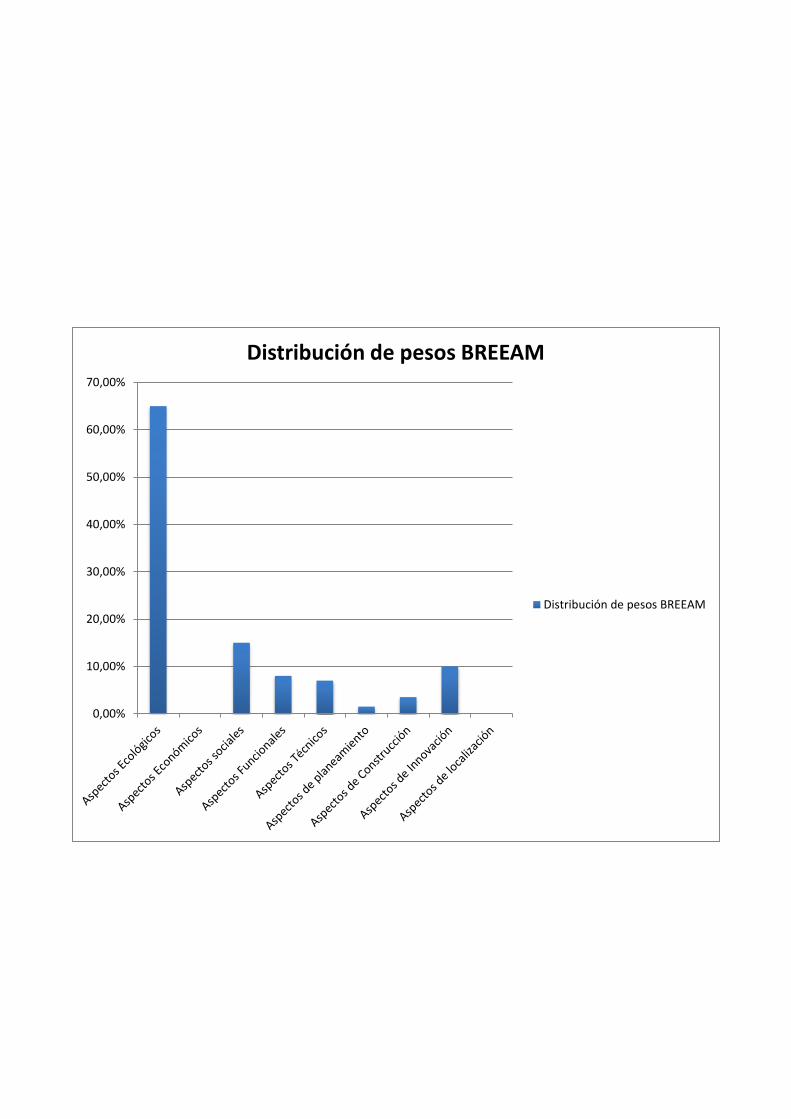
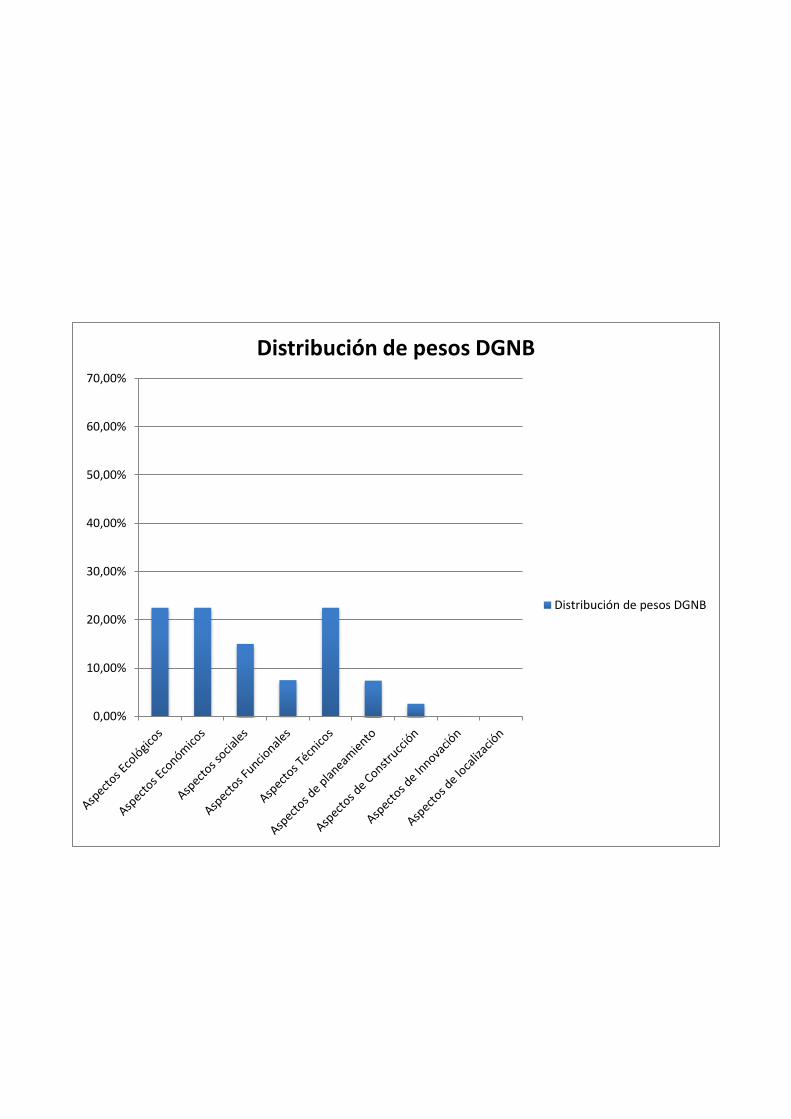
Aspectos Ecológicos 54,00% 65,00% 22,50%
Aspectos Económicos 0,00% 0,00% 22,50%
Aspectos sociales 13,50% 15,00% 15,00%
Aspectos Funcionales 0,00% 8,00% 7,50%
Aspectos Técnicos 0,00% 7,00% 22,50%
Anexo B: Tabla resumen de las certificaciones LEED, BREEAM y DGNB
DGNBLEED
USGBC - United States Green Building Council
Checklist
BREEAM
BRE Global
Checklist

Aspectos de planeamiento 0,00% 1,50% 7,40%
Aspectos de Construcción 0,00% 3,50% 2,60%
Aspectos de Innovación 5,50% 10,00% 0,00%
Aspectos de localización 27,00% 0,00% 0,00%
0,00%
10,00%
20,00%
30,00%
40,00%
50,00%
60,00%
Distibución de pesos LEED
Distibución de pesos LEED
0,00%
10,00%
20,00%
30,00%
40,00%
50,00%
60,00%
70,00%
Distribución de pesos BREEAM
Distribución de pesos BREEAM
0,00%
10,00%
20,00%
30,00%
40,00%
50,00%
60,00%
70,00%
Distribución de pesos DGNB
Distribución de pesos DGNB
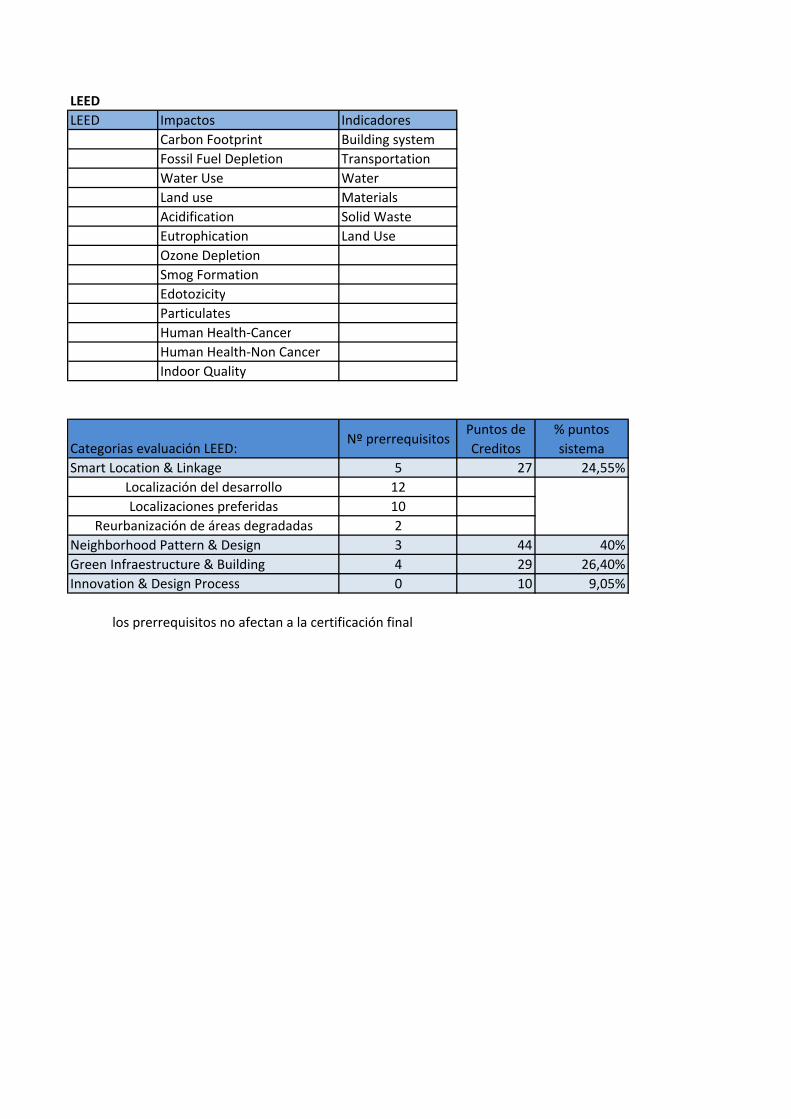
LEED
LEED Impactos Indicadores
Carbon Footprint Building system
Fossil Fuel Depletion Transportation
Water Use Water
Land use Materials
Acidification Solid Waste
Eutrophication Land Use
Ozone Depletion
Smog Formation
Edotozicity
Particulates
Human Health-Cancer
Human Health-Non Cancer
Indoor Quality
Categorias evaluación LEED:Nº prerrequisitos
Puntos de
Creditos
% puntos
sistema
Smart Location & Linkage 5 27 24,55%
12
10
2
Neighborhood Pattern & Design 3 44 40%
Green Infraestructure & Building 4 29 26,40%
Innovation & Design Process 0 10 9,05%
Localización del desarrollo
Localizaciones preferidas
Reurbanización de áreas degradadas
los prerrequisitos no afectan a la certificación final
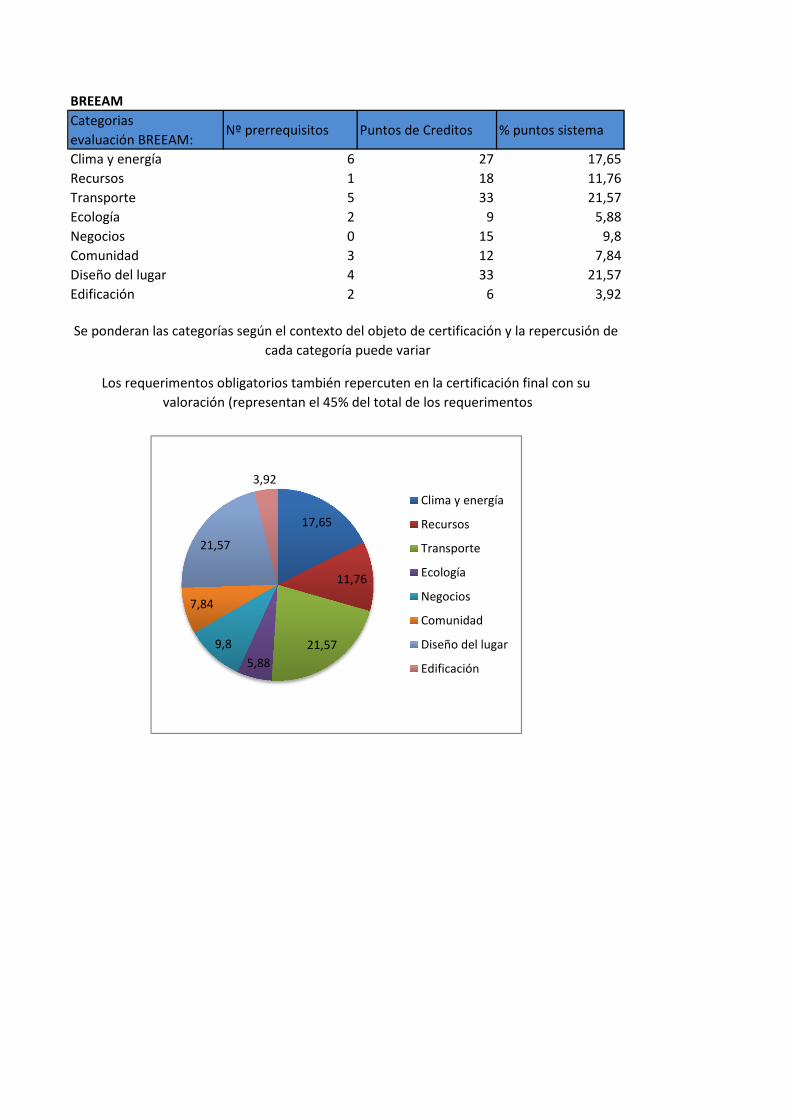
BREEAM
Categorias
evaluación BREEAM:Nº prerrequisitos Puntos de Creditos % puntos sistema
Clima y energía 6 27 17,65
Recursos 1 18 11,76
Transporte 5 33 21,57
Ecología 2 9 5,88
Negocios 0 15 9,8
Comunidad 3 12 7,84
Diseño del lugar 4 33 21,57
Edificación 2 6 3,92
Se ponderan las categorías según el contexto del objeto de certificación y la repercusión de
cada categoría puede variar
Los requerimentos obligatorios también repercuten en la certificación final con su
valoración (representan el 45% del total de los requerimentos
17,65
11,76
21,57
5,88
9,8
7,84
21,57
3,92
Clima y energía
Recursos
Transporte
Ecología
Negocios
Comunidad
Diseño del lugar
Edificación
LEED BREEAM DGNB
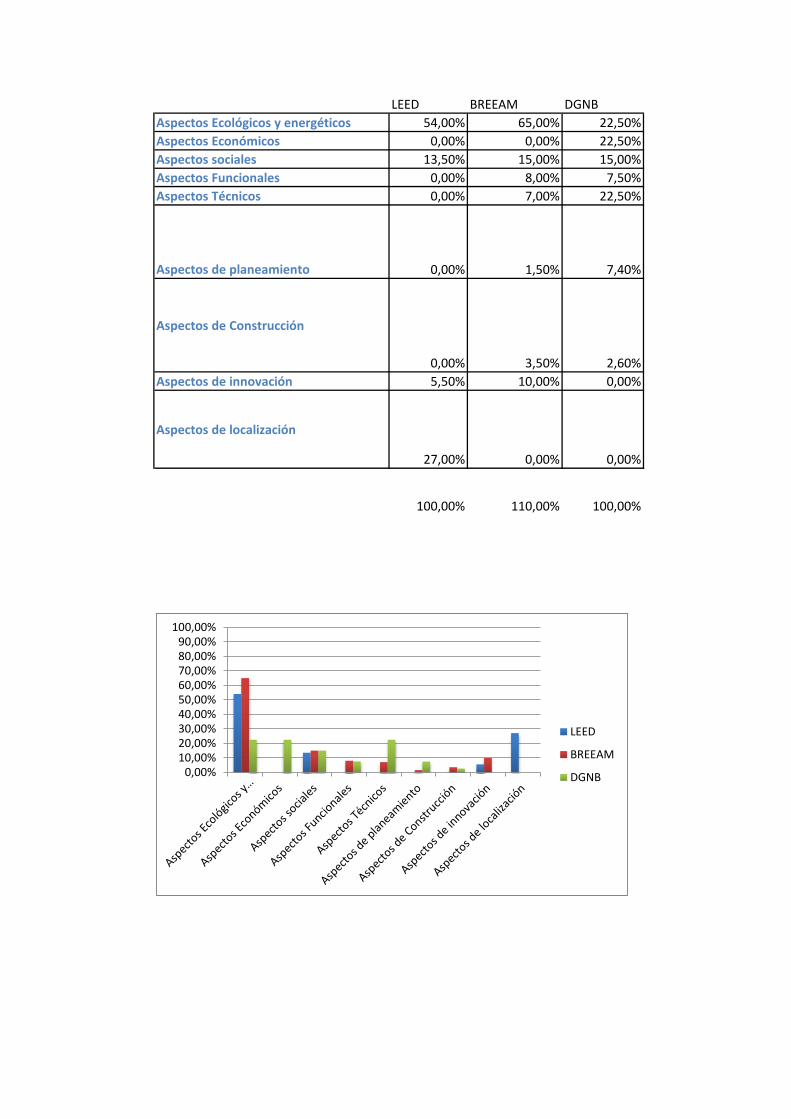
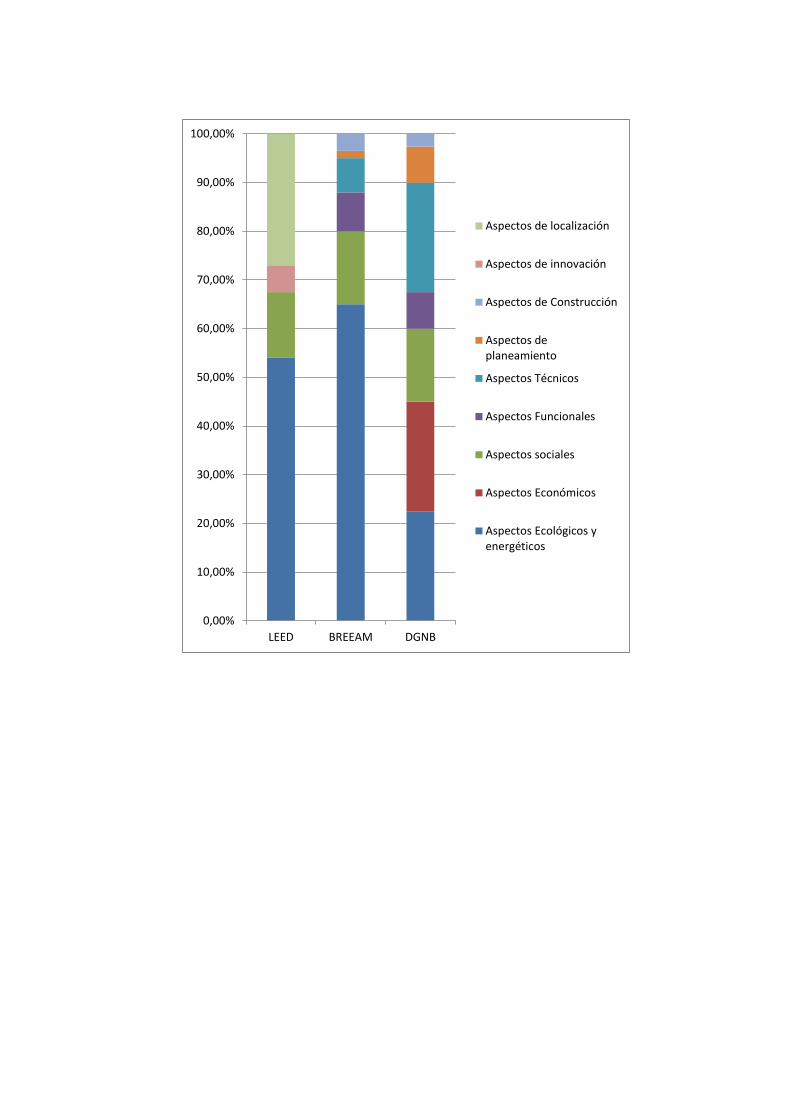
Aspectos Ecológicos y energéticos 54,00% 65,00% 22,50%
Aspectos Económicos 0,00% 0,00% 22,50%
Aspectos sociales 13,50% 15,00% 15,00%
Aspectos Funcionales 0,00% 8,00% 7,50%
Aspectos Técnicos 0,00% 7,00% 22,50%
Aspectos de planeamiento 0,00% 1,50% 7,40%
Aspectos de Construcción
0,00% 3,50% 2,60%
Aspectos de innovación 5,50% 10,00% 0,00%
Aspectos de localización
27,00% 0,00% 0,00%
100,00% 110,00% 100,00%
0,00%10,00%20,00%30,00%40,00%50,00%60,00%70,00%80,00%90,00%
100,00%
LEED
BREEAM
DGNB
0,00%
10,00%
20,00%
30,00%
40,00%
50,00%
60,00%
70,00%
80,00%
90,00%
100,00%
LEED BREEAM DGNB
Aspectos de localización
Aspectos de innovación
Aspectos de Construcción
Aspectos deplaneamiento
Aspectos Técnicos
Aspectos Funcionales
Aspectos sociales
Aspectos Económicos
Aspectos Ecológicos yenergéticos

LEED BREEAM DGNB
Aspectos Ecológicos y
energéticos
Eficiencia del agua
Energía y atmósfera
Materiales y recursos
Energía
Agua
Suelo y ecología
Materiales
Residuos
Polución
Calidad Medioambiental
Aspectos Económicos Economical Quality
Aspectos socialesCalidad del
aire interiorSalud y bienestar
Criterios de Cualidad
sociocultural y funcional:
Salud, confort y satisfacción
del usuario
Calidad estética
Aspectos Funcionales Transporte
Criterios de cualidad
Sociocultural y Funcional :
Funcionalidad
Aspectos Técnicos
Criterios de
Management:
-Páctica de los
asociados
-Contratación
sostenible
Calidad técnica
Aspectos de planeamiento
Criterio de
Management:
-Planeamiento del
servicio en el ciclo de
vida
Criterios de calidad de
Proceso:
Calidad de planificación
Aspectos de Construcción
Criterios de
Management:
-Responsabilidad en
la construcción
- Impactos de la
construcción
Criterios de calidad de
Proceso:
Calidad de la construcción
Aspectos de innovaciónInnovation & Design
Process
Innovación
(adicional)
Aspectos de localizaciónZonas sostenibles
Prioridad regionalEvaluación independiente

Assesment matrix NOA10
Legend:evaluation points to be entered
checklist points to be entered
fixed value
will be automatically calculated
cell without content
achieved
(criteria)
achieved
(indicators)
max.
possibleachieved
max.
possibleachieved
max.
possibleachieved
max.
possible
1 Global warming potential
(GWP) 0,00 10 0,00 10 3 0,00 30 0,0%
2 Ozone depletion potential
(ODP) 10,00 10 10,00 10 1 10,00 10 100,0%
3 Photochemical ozone
creation potential (POCP) 10,00 10 10,00 10 1 10,00 10 100,0%
4 Acidification potential (AP)
10,00 10 10,00 10 1 10,00 10 100,0%
5 Eutrophication potential (EP)
10,00 10 10,00 10 1 10,00 10 100,0%
6 Local environmental impact
0,00 10 0,00 10 3 0,00 30 0,0%
8 Sustainable use of
resources / wood 0,00 10 0,00 10 1 0,00 10 0,0%
10 Nonrenewable primary
energy demand (Pnren) 0,00 10 0,00 10 3 0,00 30 0,0%
11 Total primary energy
demand and proportion of
renewable primary energy 0,00 10 0,00 10 2 0,00 20 0,0%
11.1
Total primary energy
demand 0,00 10
11.2
Proportion of renewable
primary energy 0,00 5
14 Drinking water demand and
wastewater volume 3,50 10 3,50 10 2 7,00 20 35,0%
15 Land use
10,00 10 10,00 10 2 20,00 20 100,0%
Life c
ycle
costs
16Building-related life-cycle
costs2,00 10 2,00 10 3 6,00 30 20,0%
17 Suitability for third-party use
57,5 100 5,75 10 2 11,50 20 57,5%
17.1
Space efficiency
30,0 30
17.2
Suitability for conversion
27,5 50
17.3
Possibility of modification for
other types of use 0,0 20
18Thermal comfort in the
winter100,0 100 10,00 10 2 20,00 20 100,0%
18.1 Operative temperature 70,0 70
18.2 Drafts 10,0 10
18.3
Radiant temperature
asymmetry and floor
temperature
10,0 10
18.4 Relative humidity 10,0 10
19Thermal comfort in the
summer100,0 100 10,00 10 3 30,00 30 100,0%
19.1 Operative Temperatur 70,0 70
19.2 Drafts 10,0 10
19.3
Radiant temperature
asymmetry and floor
temperature
10,0 10
19.4 Relative humidity 10,0 10
Anexo C: Puntuación según ponderación DGNB
Assesment matrix of the DGNB International Certification System / Occupancy Profile New Office and Administrative Buildings, Version 2010© Copyright 2010 German Sustainable Building Council (DGNB)
Project No.
Project Name
Auditor
Indicators
Score
checklist points / evaluation pointsCrieria points
Re
lev
an
ce
Fa
cto
r
Weighted
Points
Pe
rfo
rma
nc
e I
nd
ex
(Cri
teri
a) Group Points
Gro
up
Pe
rfo
rma
nc
e
Ind
ex
Gro
up
We
igh
t
To
tal
Pe
rfo
rma
nc
e
Ind
ex
Ma
in C
rite
ria
Gro
up
Cri
teri
a G
rou
p
No. Criteria
Ec
olo
gic
al
qu
ali
ty
Life c
ycle
assessm
ent
67,00 200,00 33,5%
Effects
on the
glo
bal and local
environm
ent
49,7%
Resourc
e c
onsum
ption a
nd w
aste
genera
tion
22,5%
Ec
on
om
ic q
ua
lity
17,50 50,00 35,0% 22,5%
Econom
ic d
evelo
pm
ent
So
cio
cu
ltu
ral
an
d f
un
cti
on
al
qu
ali
ty
Health, com
fort
, and u
ser
satisfa
ction
182,83 280,00 65,3% 22,5%
18/06/2013 Page]/Pages]

Assesment matrix NOA10
achieved
(criteria)
achieved
(indicators)
max.
possibleachieved
max.
possibleachieved
max.
possibleachieved
max.
possible
Indicators
Score
checklist points / evaluation pointsCrieria points
Re
lev
an
ce
Fa
cto
r
Weighted
Points
Pe
rfo
rma
nc
e I
nd
ex
(Cri
teri
a) Group Points
Gro
up
Pe
rfo
rma
nc
e
Ind
ex
Gro
up
We
igh
t
To
tal
Pe
rfo
rma
nc
e
Ind
ex
Ma
in C
rite
ria
Gro
up
Cri
teri
a G
rou
p
No. Criteria
Ec
olo
gic
al
qu
ali
ty
Life c
ycle
assessm
ent
67,00 200,00 33,5% 49,7%22,5%20Indoor air quality 25,0 100 2,50 10 3 7,50 30 25,0%
20.1Volatile organic compounds
(TVOC, formaldehyde)0,0 50
49,7%
So
cio
cu
ltu
ral
an
d f
un
cti
on
al
qu
ali
ty
Health, com
fort
, and u
ser
satisfa
ction
182,83 280,00 65,3% 22,5%
18/06/2013 Page]/Pages]

Assesment matrix NOA10
achieved
(criteria)
achieved
(indicators)
max.
possibleachieved
max.
possibleachieved
max.
possibleachieved
max.
possible
Indicators
Score
checklist points / evaluation pointsCrieria points
Re
lev
an
ce
Fa
cto
r
Weighted
Points
Pe
rfo
rma
nc
e I
nd
ex
(Cri
teri
a) Group Points
Gro
up
Pe
rfo
rma
nc
e
Ind
ex
Gro
up
We
igh
t
To
tal
Pe
rfo
rma
nc
e
Ind
ex
Ma
in C
rite
ria
Gro
up
Cri
teri
a G
rou
p
No. Criteria
Ec
olo
gic
al
qu
ali
ty
Life c
ycle
assessm
ent
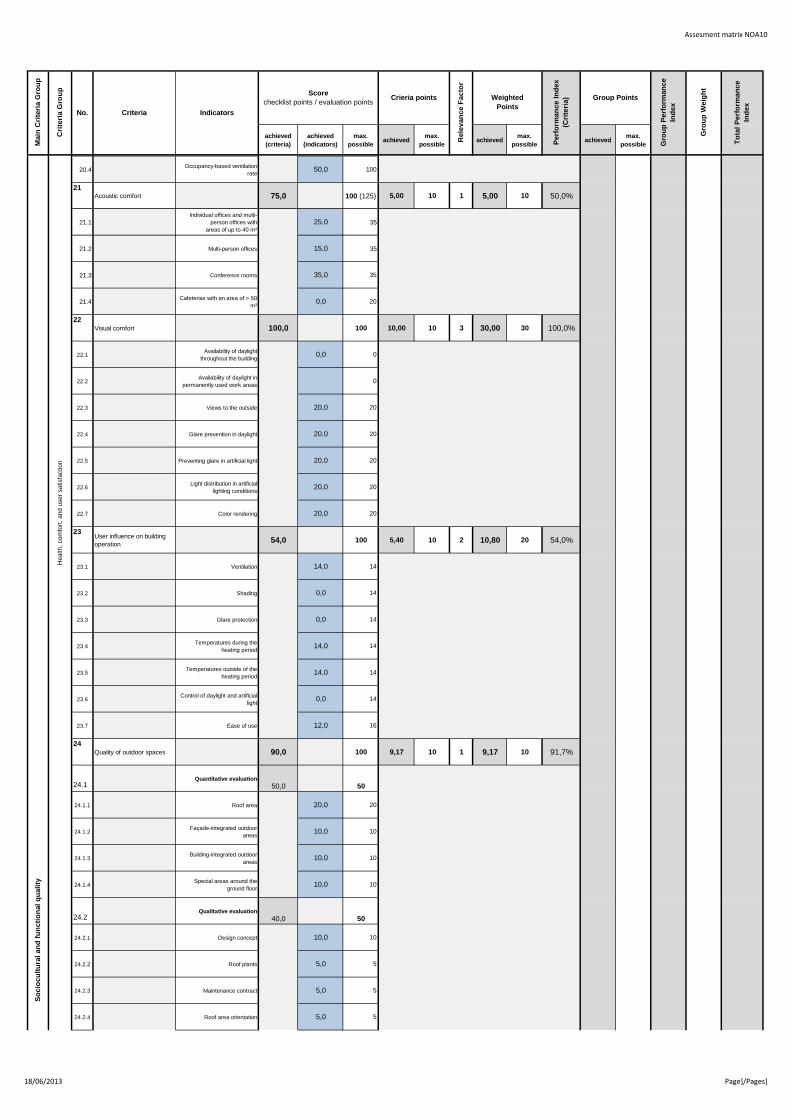
67,00 200,00 33,5% 49,7%22,5%20.4
Occupancy-based ventilation
rate25,0 50
21Acoustic comfort 75,0 100 (125) 5,00 10 1 5,00 10 50,0%
21.1
Individual offices and multi-
person offices with
areas of up to 40 m²
25,0 35
21.2 Multi-person offices 15,0 35
21.3 Conference rooms 35,0 35
21.4Cafeterias with an area of > 50
m²0,0 20
22Visual comfort 70,0 100 6,88 10 3 20,64 30 68,8%
22.1Availability of daylight
throughout the building0,0 16
22.2Availability of daylight in
permanently used work areas0,0 14
22.3 Views to the outside 14,0 14
22.4 Glare prevention in daylight 14,0 14
22.5 Preventing glare in artificial light 14,0 14
22.6Light distribution in artificial
lighting conditions14,0 14
22.7 Color rendering 14,0 14
23User influence on building
operation54,0 100 5,40 10 2 10,80 20 54,0%
23.1 Ventilation 14,0 14
23.2 Shading 0,0 14
23.3 Glare protection 0,0 14
23.4Temperatures during the
heating period14,0 14
23.5Temperatures outside of the
heating period14,0 14
23.6Control of daylight and artificial
light0,0 14
23.7 Ease of use 12,0 16
24Quality of outdoor spaces 90,0 100 9,17 10 1 9,17 10 91,7%
24.1Quantitative evaluation
50,0 50
24.1.1 Roof area 20,0 20
24.1.2Façade-integrated outdoor
areas10,0 10
24.1.3Building-integrated outdoor
areas10,0 10
24.1.4Special areas around the
ground floor10,0 10
24.2Qualitative evaluation
40,0 50
24.2.1 Design concept 10,0 10
24.2.2 Roof plants 5,0 5
24.2.3 Maintenance contract 5,0 5
24.2.4 Roof area orientation 5,0 5
49,7%
So
cio
cu
ltu
ral
an
d f
un
cti
on
al
qu
ali
ty
Health, com
fort
, and u
ser
satisfa
ction
182,83 280,00 65,3% 22,5%
18/06/2013 Page]/Pages]

Assesment matrix NOA10
achieved
(criteria)
achieved
(indicators)
max.
possibleachieved
max.
possibleachieved
max.
possibleachieved
max.
possible
Indicators
Score
checklist points / evaluation pointsCrieria points
Re
lev
an
ce
Fa
cto
r
Weighted
Points
Pe
rfo
rma
nc
e I
nd
ex
(Cri
teri
a) Group Points
Gro
up
Pe
rfo
rma
nc
e
Ind
ex
Gro
up
We
igh
t
To
tal
Pe
rfo
rma
nc
e
Ind
ex
Ma
in C
rite
ria
Gro
up
Cri
teri
a G
rou
p
No. Criteria
Ec
olo
gic
al
qu
ali
ty
Life c
ycle
assessm
ent
67,00 200,00 33,5% 49,7%22,5%24.2.5 Socio-cultural use 5,0 5
24.2.6 Outdoor surface design 5,0 5
49,7%
So
cio
cu
ltu
ral
an
d f
un
cti
on
al
qu
ali
ty
Health, com
fort
, and u
ser
satisfa
ction
182,83 280,00 65,3% 22,5%
18/06/2013 Page]/Pages]
Assesment matrix NOA10
achieved
(criteria)
achieved
(indicators)
max.
possibleachieved
max.
possibleachieved
max.
possibleachieved
max.
possible
Indicators
Score
checklist points / evaluation pointsCrieria points
Re
lev
an
ce
Fa
cto
r
Weighted
Points
Pe
rfo
rma
nc
e I
nd
ex
(Cri
teri
a) Group Points
Gro
up
Pe
rfo
rma
nc
e
Ind
ex
Gro
up
We
igh
t
To
tal
Pe
rfo
rma
nc
e
Ind
ex
Ma
in C
rite
ria
Gro
up
Cri
teri
a G
rou
p
No. Criteria
Ec
olo
gic
al
qu
ali
ty
Life c
ycle
assessm
ent
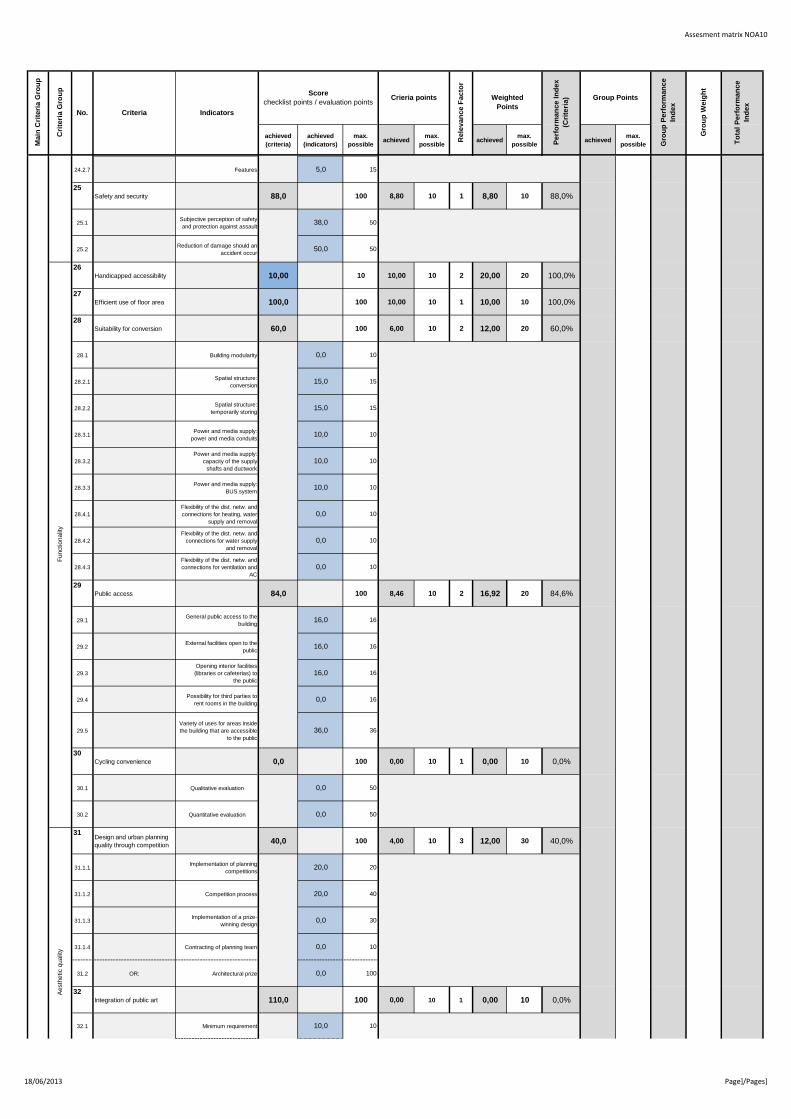
67,00 200,00 33,5% 49,7%22,5%24.2.7 Features 5,0 15
25Safety and security 88,0 100 8,80 10 1 8,80 10 88,0%
25.1Subjective perception of safety
and protection against assault38,0 50
25.2Reduction of damage should an
accident occur50,0 50
26Handicapped accessibility 10,00 10 10,00 10 2 20,00 20 100,0%
27Efficient use of floor area 100,0 100 10,00 10 1 10,00 10 100,0%
28Suitability for conversion 60,0 100 6,00 10 2 12,00 20 60,0%
28.1 Building modularity 0,0 10
28.2.1Spatial structure:
conversion15,0 15
28.2.2Spatial structure:
temporarily storing15,0 15
28.3.1Power and media supply:
power and media conduits10,0 10
28.3.2
Power and media supply:
capacity of the supply
shafts and ductwork
10,0 10
28.3.3Power and media supply:
BUS system10,0 10
28.4.1
Flexibility of the dist. netw. and
connections for heating, water
supply and removal
0,0 10
28.4.2
Flexibility of the dist. netw. and
connections for water supply
and removal
0,0 10
28.4.3
Flexibility of the dist. netw. and
connections for ventilation and
AC
0,0 10
29Public access 84,0 100 8,46 10 2 16,92 20 84,6%
29.1General public access to the
building16,0 16
29.2External facilities open to the
public16,0 16
29.3
Opening interior facilities
(libraries or cafeterias) to
the public
16,0 16
29.4Possibility for third parties to
rent rooms in the building0,0 16
29.5
Variety of uses for areas inside
the building that are accessible
to the public
36,0 36
30Cycling convenience 0,0 100 0,00 10 1 0,00 10 0,0%
30.1 Qualitative evaluation 0,0 50
30.2 Quantitative evaluation 0,0 50
31Design and urban planning
quality through competition40,0 100 4,00 10 3 12,00 30 40,0%
31.1.1Implementation of planning
competitions20,0 20
31.1.2 Competition process 20,0 40
31.1.3Implementation of a prize-
winning design0,0 30
31.1.4 Contracting of planning team 0,0 10
31.2 OR: Architectural prize 0,0 100
32Integration of public art 110,0 100 0,00 10 1 0,00 10 0,0%
32.1 Minimum requirement 10,0 10
49,7%
Functionalit
y
So
cio
cu
ltu
ral
an
d f
un
cti
on
al
qu
ali
ty
Health, com
fort
, and u
ser
satisfa
ction
182,83 280,00 65,3% 22,5%
Aesth
etic q
ualit
y
18/06/2013 Page]/Pages]

Assesment matrix NOA10
achieved
(criteria)
achieved
(indicators)
max.
possibleachieved
max.
possibleachieved
max.
possibleachieved
max.
possible
Indicators
Score
checklist points / evaluation pointsCrieria points
Re
lev
an
ce
Fa
cto
r
Weighted
Points
Pe
rfo
rma
nc
e I
nd
ex
(Cri
teri
a) Group Points
Gro
up
Pe
rfo
rma
nc
e
Ind
ex
Gro
up
We
igh
t
To
tal
Pe
rfo
rma
nc
e
Ind
ex
Ma
in C
rite
ria
Gro
up
Cri
teri
a G
rou
p
No. Criteria
Ec
olo
gic
al
qu
ali
ty
Life c
ycle
assessm
ent
67,00 200,00 33,5% 49,7%22,5%32.2.1 OR:
Provision of funding as part of
the construction project20,0 20
32.2.2 Implementation of guidelines 40,0 40
32.2.3Implementation of measures
for public awareness40,0 40
33Fire prevention 75,0 100 7,50 10 2 15,00 20 75,0%
33.1Evidence of compliance with
fire-safety regulations50,0 50
33.2Combustion gas risk from
building materials / products10,0 10
33.3Realisation of increased fire-
resistance rating0,0 10
33.4Realisation of enlarged cross-
sections for smoke extraction0,0 10
33.5 Combustion gas detectors 0,0 5
33.6Smoke detectors or heat
detectors5,0 5
33.7Automatic fire extinguishing
system5,0 5
33.8 Structural fire safety 5,0 5
34Noise protection 75,0 100 7,50 10 2 15,00 20 75,0%
34.1Airborne sound insulation with
respect to exterior sound20,0 20
34.2
Airborne sound insulation with
respect to other working areas
and within a working area itself
30,0 30
34.3
Impact sound insulation with
respect to other working areas
and to personal working areas
15,0 30
34.4Insulation from sound created
by building services10,0 20
35Building envelope quality 32,0 100 0,00 10 2 0,00 20 0,0%
35.1
Median thermal transmittance
coefficients of building
components
15,0 30
35.2 Thermal bridges 2,0 15
35.3 Air permeability class 15,0 15
35.4Amount of condensation inside
the structure0,0 10
35.5 Air exchange 0,0 15
35.6 Solar Heat Protection 0,0 15
40Ease of cleaning and
maintenance60,0 100 6,67 10 2 13,34 20 66,7%
40.1 Load bearing structure 10,0 20
40.2Non-structural external
components0,0 20
40.3.1Non-load-bearing interior
structures: flooring20,0 20
40.3.2Non-load-bearing interior
structures: soil-capture zones10,0 20
40.3.3Non-load-bearing interior
structures: baseboards10,0 10
40.3.4Non-load-bearing interior
structures: floor plan10,0 10
42Ease of dismantling and
recycling32,0 100 3,29 10 2 6,58 20 32,9%
42.1 Effort for disassembly 8,0 38
49,7%
So
cio
cu
ltu
ral
an
d f
un
cti
on
al
qu
ali
ty
182,83 280,00 65,3% 22,5%
Te
ch
nic
al
qu
ali
ty
Qualit
y o
f te
chnic
al im
ple
menta
tion
49,92 100,00 49,9% 22,5%
Aesth
etic q
ualit
y
18/06/2013 Page]/Pages]

Assesment matrix NOA10
achieved
(criteria)
achieved
(indicators)
max.
possibleachieved
max.
possibleachieved
max.
possibleachieved
max.
possible
Indicators
Score
checklist points / evaluation pointsCrieria points
Re
lev
an
ce
Fa
cto
r
Weighted
Points
Pe
rfo
rma
nc
e I
nd
ex
(Cri
teri
a) Group Points
Gro
up
Pe
rfo
rma
nc
e
Ind
ex
Gro
up
We
igh
t
To
tal
Pe
rfo
rma
nc
e
Ind
ex
Ma
in C
rite
ria
Gro
up
Cri
teri
a G
rou
p
No. Criteria
Ec
olo
gic
al
qu
ali
ty
Life c
ycle
assessm
ent
67,00 200,00 33,5% 49,7%22,5%42.2 Effort for sorting 24,0 38
42.3 Recycling / disposal concept 0,0 24
43Comprehensive project
definition86,0 100 8,16 10 3 24,48 30 81,6%
43.1 Demand planning 25,0 25
43.2 Agreement on objectives 18,0 25
43.3 Architectural competition 25,0 25
43.4
Influence on energy
consumption for user and
utilization needs
18,0 25
44Integrated planning 60,0 100 4,00 10 3 12,00 30 40,0%
44.1 Integral planning team 20,0 20
44.2 Qualification of planning team 20,0 20
44.3 Integral planning process 0,0 20
44.4 Participation of users 20,0 20
44.5 Public participation 0,0 20
45Comprehensive building
design82,5 100 7,81 10 3 23,43 30 78,1%
45.1 H&S (Health and Safety) plan 10,0 10
45.2 Energy concept 10,0 10
45.3 Water concept 5,0 10
45.4Optimization of daylight and
artificial lighting7,5 10
45.5 Waste concept 10,0 10
45.6 Measurement concept 10,0 10
45.7Concept for conversion,
dismantling, and recycling0,0 10
45.8Concept for ease of cleaning
and maintenance10,0 10
45.9Independent third-party review
of planning documents10,0 10
45.10Execution of variant
comparisons10,0 10
46Sustainability aspects in
tender phase100,0 100 10,00 10 2 20,00 20 100,0%
46.1Integration of sustainability
aspects in call for tenders50,0 50
46.2Integration of sustainability
aspects in the selection of firms50,0 50
47Documentation for Facility
Management100,0 100 10,00 10 2 20,00 20 100,0%
47.1
Compilation of project
documentation/energy
performance certificate
25,0 25
47.2
Instructions for servicing,
inspection, operation,
and care
25,0 25
47.3
Adaptation of plans,
verifications, and calculations
for the finished building
25,0 25
47.4 Compilation of a user manual 25,0 25
48 Environmental impact of
construction site /
construction process
75,0 100 6,71 10 2 13,42 20 67,1%
49,7%
Te
ch
nic
al
qu
ali
ty
Qualit
y o
f te
chnic
al im
ple
menta
tion
49,92 100,00 49,9% 22,5%
Pro
ce
ss
qu
ali
ty
Qualit
y o
f pla
nnin
g
193,33 230,00 84,1% 10,0%
18/06/2013 Page]/Pages]

Assesment matrix NOA10
achieved
(criteria)
achieved
(indicators)
max.
possibleachieved
max.
possibleachieved
max.
possibleachieved
max.
possible
Indicators
Score
checklist points / evaluation pointsCrieria points
Re
lev
an
ce
Fa
cto
r
Weighted
Points
Pe
rfo
rma
nc
e I
nd
ex
(Cri
teri
a) Group Points
Gro
up
Pe
rfo
rma
nc
e
Ind
ex
Gro
up
We
igh
t
To
tal
Pe
rfo
rma
nc
e
Ind
ex
Ma
in C
rite
ria
Gro
up
Cri
teri
a G
rou
p
No. Criteria
Ec
olo
gic
al
qu
ali
ty
Life c
ycle
assessm
ent
67,00 200,00 33,5% 49,7%22,5%48.1 Low-waste construction site 25,0 25
48.2 Low-noise construction site 25,0 25
48.3 Low-dust construction site 0,0 25
48.4
Environmental protection at the
construction site
(soil protection)
25,0 25
49Prequalification of
contractors10,00 10 10,00 10 2 20,00 20 100,0%
50Construction quality
assurance100,0 100 10,00 10 3 30,00 30 100,0%
50.1
Documentation of materials,
auxiliary materials
and safety data sheets
50,0 50
50.2Measurements for quality
control50,0 50
51Systematic commissioning 10,00 10 10,00 10 3 30,00 30 100,0%
Site evaluation: accounted for separately; does not affect a building’s overall appraisal
56Site location risks 75,0 100 0,00 10 2 0,00 20 0,0%
56.1.1 Wildfire hazard 3,0 5
56.1.2Length of dry spell affecting
forest fires5,0 5
56.2.1Dry spell length affecting
drought potential4,0 5
56.2.2Precipitation deficit as drought
potential indicator4,0 5
56.3 Landslide Hazard 0,0 10
56.4 Tsunami/storm surge 10,0 10
56.5.1 Flood recurrence 2,0 5
56.5.2 Precipitation affecting floods 5,0 5
56.6 Earthquakes 7,0 10
56.7 Extreme temperature 10,0 10
56.8 Avalanches 10,0 10
56.9 Volcanic eruptions 10,0 10
56.10 Storm 5,0 10
57Site location conditions 51,5 100 5,15 10 2 10,30 20 51,5%
57.1 Outdoor air quality 2,0 16
57.2 Outdoor noise 12,0 20
57.3 Soil and building plot 0,0 16
57.4 Electromagnetic fields 12,0 16
57.5Appearance of the city and
landscape / visualrelationships9,5 16
57.6 Radon contamination 16,0 16
58Public image and social
conditions93,0 100 9,30 10 2 18,60 20 93,0%
58.1 Public Image, attractiveness 25,0 25
49,7%
Pro
ce
ss
qu
ali
ty
Qualit
y o
f pla
nnin
g
193,33 230,00 84,1% 10,0%
Qualit
y o
f constr
uction
Sit
e q
ua
lity
86,90 130,00 66,8% 0,0%
18/06/2013 Page]/Pages]

Assesment matrix NOA10
achieved
(criteria)
achieved
(indicators)
max.
possibleachieved
max.
possibleachieved
max.
possibleachieved
max.
possible
Indicators
Score
checklist points / evaluation pointsCrieria points
Re
lev
an
ce
Fa
cto
r
Weighted
Points
Pe
rfo
rma
nc
e I
nd
ex
(Cri
teri
a) Group Points
Gro
up
Pe
rfo
rma
nc
e
Ind
ex
Gro
up
We
igh
t
To
tal
Pe
rfo
rma
nc
e
Ind
ex
Ma
in C
rite
ria
Gro
up
Cri
teri
a G
rou
p
No. Criteria
Ec
olo
gic
al
qu
ali
ty
Life c
ycle
assessm
ent
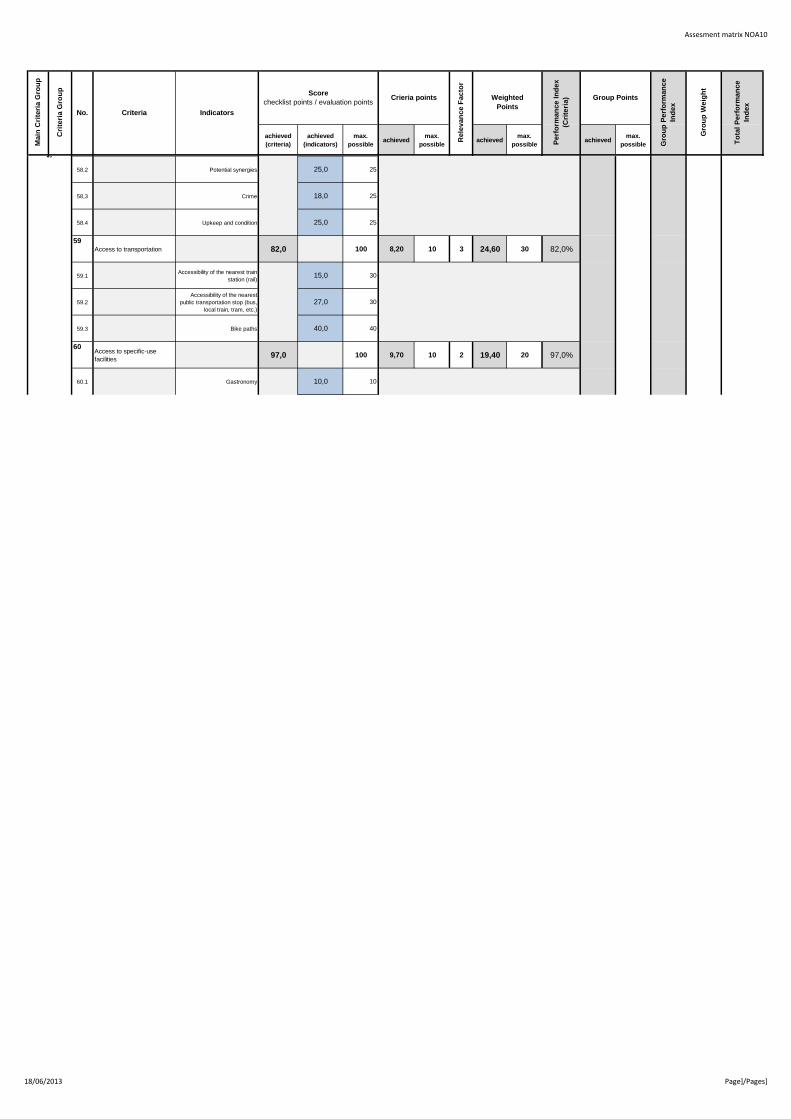
67,00 200,00 33,5% 49,7%22,5%58.2 Potential synergies 25,0 25
58,3 Crime 18,0 25
58.4 Upkeep and condition 25,0 25
59Access to transportation 82,0 100 8,20 10 3 24,60 30 82,0%
59.1Accessibility of the nearest train
station (rail)15,0 30
59.2
Accessibility of the nearest
public transportation stop (bus,
local train, tram, etc.)
27,0 30
59.3 Bike paths 40,0 40
60Access to specific-use
facilities97,0 100 9,70 10 2 19,40 20 97,0%
60.1 Gastronomy 10,0 10
Sit
e q
ua
lity
86,90 130,00 66,8% 0,0%
18/06/2013 Page]/Pages]

Assesment matrix NOA10
achieved
(criteria)
achieved
(indicators)
max.
possibleachieved
max.
possibleachieved
max.
possibleachieved
max.
possible
Indicators
Score
checklist points / evaluation pointsCrieria points
Re
lev
an
ce
Fa
cto
r
Weighted
Points
Pe
rfo
rma
nc
e I
nd
ex
(Cri
teri
a) Group Points
Gro
up
Pe
rfo
rma
nc
e
Ind
ex
Gro
up
We
igh
t
To
tal
Pe
rfo
rma
nc
e
Ind
ex
Ma
in C
rite
ria
Gro
up
Cri
teri
a G
rou
p
No. Criteria
Ec
olo
gic
al
qu
ali
ty
Life c
ycle
assessm
ent
67,00 200,00 33,5% 49,7%22,5%60.2 Local stores 10,0 10
60.3 Parks and open areas 20,0 20
60.4 Education 10,0 10
60.5 Public offices 7,0 10
60.6 Medical care 10,0 10
60.7 Sports facilities 10,0 10
60.8 Leisure 10,0 10
60.9 Service providers 10,0 10
61Connections to utilities 70,0 100 7,00 10 2 14,00 20 70,0%
61.1 Networked energy 12,0 25
61.2 Solar energy 25,0 25
61.3 Broadband connection 8,0 25
61.4 Rainwater seepage 25,0 25
Total Performance
IndexMedals Grade
≥80% GOLD 1,5
65-79,9% SILVER 2,0
50-64,9% BRONZE 3,0
* = Except Site Quality
min. 50% (bronze)
Nominal Performance
Index in Evaluation
Aeras*
Sit
e q
ua
lity
min. 35%
min. 65% (silver)
86,90 130,00 66,8% 0,0%
18/06/2013 Page]/Pages]
Assesment matrix NOA10
Legend:evaluation points to be entered
checklist points to be entered
fixed value
will be automatically calculated
cell without content
achieved
(criteria)
achieved
(indicators)
max.
possibleachieved
max.
possibleachieved
max.
possibleachieved
max.
possible
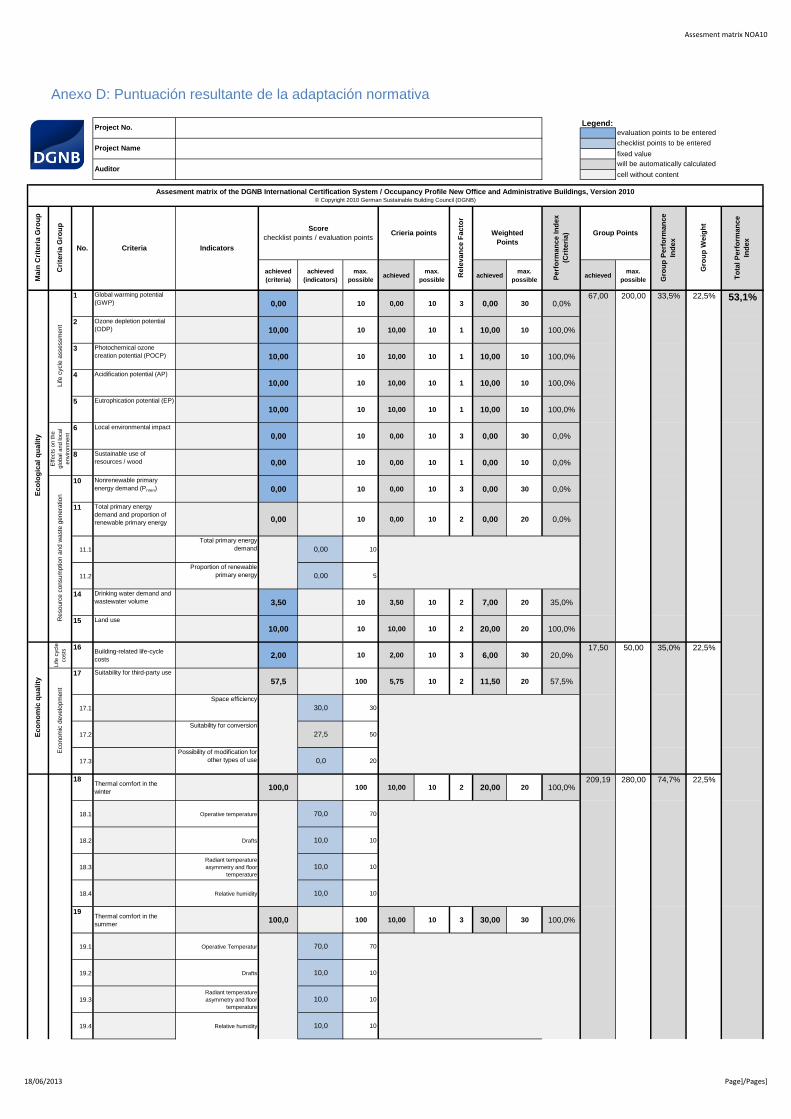
1 Global warming potential
(GWP) 0,00 10 0,00 10 3 0,00 30 0,0%
2 Ozone depletion potential
(ODP) 10,00 10 10,00 10 1 10,00 10 100,0%
3 Photochemical ozone
creation potential (POCP) 10,00 10 10,00 10 1 10,00 10 100,0%
4 Acidification potential (AP)
10,00 10 10,00 10 1 10,00 10 100,0%
5 Eutrophication potential (EP)
10,00 10 10,00 10 1 10,00 10 100,0%
6 Local environmental impact
0,00 10 0,00 10 3 0,00 30 0,0%
8 Sustainable use of
resources / wood 0,00 10 0,00 10 1 0,00 10 0,0%
10 Nonrenewable primary
energy demand (Pnren) 0,00 10 0,00 10 3 0,00 30 0,0%
11 Total primary energy
demand and proportion of
renewable primary energy 0,00 10 0,00 10 2 0,00 20 0,0%
11.1
Total primary energy
demand 0,00 10
11.2
Proportion of renewable
primary energy 0,00 5
14 Drinking water demand and
wastewater volume 3,50 10 3,50 10 2 7,00 20 35,0%
15 Land use
10,00 10 10,00 10 2 20,00 20 100,0%
Life c
ycle
costs
16Building-related life-cycle
costs2,00 10 2,00 10 3 6,00 30 20,0%
17 Suitability for third-party use
57,5 100 5,75 10 2 11,50 20 57,5%
17.1
Space efficiency
30,0 30
17.2
Suitability for conversion
27,5 50
17.3
Possibility of modification for
other types of use 0,0 20
18Thermal comfort in the
winter100,0 100 10,00 10 2 20,00 20 100,0%
18.1 Operative temperature 70,0 70
18.2 Drafts 10,0 10
18.3
Radiant temperature
asymmetry and floor
temperature
10,0 10
18.4 Relative humidity 10,0 10
19Thermal comfort in the
summer100,0 100 10,00 10 3 30,00 30 100,0%
19.1 Operative Temperatur 70,0 70
19.2 Drafts 10,0 10
19.3
Radiant temperature
asymmetry and floor
temperature
10,0 10
19.4 Relative humidity 10,0 10
Ec
on
om
ic q
ua
lity
17,50 50,00 35,0% 22,5%
Econom
ic d
evelo
pm
ent
So
cio
cu
ltu
ral
an
d f
un
cti
on
al
qu
ali
ty
Health, com
fort
, and u
ser
satisfa
ction
209,19 280,00 74,7% 22,5%
Effects
on the
glo
bal and local
environm
ent
53,1%
Resourc
e c
onsum
ption a
nd w
aste
genera
tion
22,5%
Ec
olo
gic
al
qu
ali
ty
Life c
ycle
assessm
ent
67,00 200,00 33,5%
Anexo D: Puntuación resultante de la adaptación normativa
Assesment matrix of the DGNB International Certification System / Occupancy Profile New Office and Administrative Buildings, Version 2010© Copyright 2010 German Sustainable Building Council (DGNB)
Project No.
Project Name
Auditor
Indicators
Score
checklist points / evaluation pointsCrieria points
Re
lev
an
ce
Fa
cto
r
Weighted
Points
Pe
rfo
rma
nc
e I
nd
ex
(Cri
teri
a) Group Points
Gro
up
Pe
rfo
rma
nc
e
Ind
ex
Gro
up
We
igh
t
To
tal
Pe
rfo
rma
nc
e
Ind
ex
Ma
in C
rite
ria
Gro
up
Cri
teri
a G
rou
p
No. Criteria
18/06/2013 Page]/Pages]

Assesment matrix NOA10
achieved
(criteria)
achieved
(indicators)
max.
possibleachieved
max.
possibleachieved
max.
possibleachieved
max.
possible
53,1%22,5%
Ec
olo
gic
al
qu
ali
ty
Life c
ycle
assessm
ent
67,00 200,00 33,5%
Indicators
Score
checklist points / evaluation pointsCrieria points
Re
lev
an
ce
Fa
cto
r
Weighted
Points
Pe
rfo
rma
nc
e I
nd
ex
(Cri
teri
a) Group Points
Gro
up
Pe
rfo
rma
nc
e
Ind
ex
Gro
up
We
igh
t
To
tal
Pe
rfo
rma
nc
e
Ind
ex
Ma
in C
rite
ria
Gro
up
Cri
teri
a G
rou
p
No. Criteria
20Indoor air quality 50,0 100 5,00 10 3 15,00 30 50,0%
20.1Volatile organic compounds
(TVOC, formaldehyde)0,0 0
So
cio
cu
ltu
ral
an
d f
un
cti
on
al
qu
ali
ty
Health, com
fort
, and u
ser
satisfa
ction
209,19 280,00 74,7% 22,5%
53,1%
18/06/2013 Page]/Pages]
Assesment matrix NOA10
achieved
(criteria)
achieved
(indicators)
max.
possibleachieved
max.
possibleachieved
max.
possibleachieved
max.
possible
53,1%22,5%
Ec
olo
gic
al
qu
ali
ty
Life c
ycle
assessm
ent
67,00 200,00 33,5%
Indicators
Score
checklist points / evaluation pointsCrieria points
Re
lev
an
ce
Fa
cto
r
Weighted
Points
Pe
rfo
rma
nc
e I
nd
ex
(Cri
teri
a) Group Points
Gro
up
Pe
rfo
rma
nc
e
Ind
ex
Gro
up
We
igh
t
To
tal
Pe
rfo
rma
nc
e
Ind
ex
Ma
in C
rite
ria
Gro
up
Cri
teri
a G
rou
p
No. Criteria
20.4Occupancy-based ventilation
rate50,0 100
21Acoustic comfort 75,0 100 (125) 5,00 10 1 5,00 10 50,0%
21.1
Individual offices and multi-
person offices with
areas of up to 40 m²
25,0 35
21.2 Multi-person offices 15,0 35
21.3 Conference rooms 35,0 35
21.4Cafeterias with an area of > 50
m²0,0 20
22Visual comfort 100,0 100 10,00 10 3 30,00 30 100,0%
22.1Availability of daylight
throughout the building0,0 0
22.2Availability of daylight in
permanently used work areas0
22.3 Views to the outside 20,0 20
22.4 Glare prevention in daylight 20,0 20
22.5 Preventing glare in artificial light 20,0 20
22.6Light distribution in artificial
lighting conditions20,0 20
22.7 Color rendering 20,0 20
23User influence on building
operation54,0 100 5,40 10 2 10,80 20 54,0%
23.1 Ventilation 14,0 14
23.2 Shading 0,0 14
23.3 Glare protection 0,0 14
23.4Temperatures during the
heating period14,0 14
23.5Temperatures outside of the
heating period14,0 14
23.6Control of daylight and artificial
light0,0 14
23.7 Ease of use 12,0 16
24Quality of outdoor spaces 90,0 100 9,17 10 1 9,17 10 91,7%
24.1Quantitative evaluation
50,0 50
24.1.1 Roof area 20,0 20
24.1.2Façade-integrated outdoor
areas10,0 10
24.1.3Building-integrated outdoor
areas10,0 10
24.1.4Special areas around the
ground floor10,0 10
24.2Qualitative evaluation
40,0 50
24.2.1 Design concept 10,0 10
24.2.2 Roof plants 5,0 5
24.2.3 Maintenance contract 5,0 5
24.2.4 Roof area orientation 5,0 5
So
cio
cu
ltu
ral
an
d f
un
cti
on
al
qu
ali
ty
Health, com
fort
, and u
ser
satisfa
ction
209,19 280,00 74,7% 22,5%
53,1%
18/06/2013 Page]/Pages]

Assesment matrix NOA10
achieved
(criteria)
achieved
(indicators)
max.
possibleachieved
max.
possibleachieved
max.
possibleachieved
max.
possible
53,1%22,5%
Ec
olo
gic
al
qu
ali
ty
Life c
ycle
assessm
ent
67,00 200,00 33,5%
Indicators
Score
checklist points / evaluation pointsCrieria points
Re
lev
an
ce
Fa
cto
r
Weighted
Points
Pe
rfo
rma
nc
e I
nd
ex
(Cri
teri
a) Group Points
Gro
up
Pe
rfo
rma
nc
e
Ind
ex
Gro
up
We
igh
t
To
tal
Pe
rfo
rma
nc
e
Ind
ex
Ma
in C
rite
ria
Gro
up
Cri
teri
a G
rou
p
No. Criteria
24.2.5 Socio-cultural use 5,0 5
24.2.6 Outdoor surface design 5,0 5
So
cio
cu
ltu
ral
an
d f
un
cti
on
al
qu
ali
ty
Health, com
fort
, and u
ser
satisfa
ction
209,19 280,00 74,7% 22,5%
53,1%
18/06/2013 Page]/Pages]

Assesment matrix NOA10
achieved
(criteria)
achieved
(indicators)
max.
possibleachieved
max.
possibleachieved
max.
possibleachieved
max.
possible
53,1%22,5%
Ec
olo
gic
al
qu
ali
ty
Life c
ycle
assessm
ent
67,00 200,00 33,5%
Indicators
Score
checklist points / evaluation pointsCrieria points
Re
lev
an
ce
Fa
cto
r
Weighted
Points
Pe
rfo
rma
nc
e I
nd
ex
(Cri
teri
a) Group Points
Gro
up
Pe
rfo
rma
nc
e
Ind
ex
Gro
up
We
igh
t
To
tal
Pe
rfo
rma
nc
e
Ind
ex
Ma
in C
rite
ria
Gro
up
Cri
teri
a G
rou
p
No. Criteria
24.2.7 Features 5,0 15
25Safety and security 88,0 100 8,80 10 1 8,80 10 88,0%
25.1Subjective perception of safety
and protection against assault38,0 50
25.2Reduction of damage should an
accident occur50,0 50
26Handicapped accessibility 10,00 10 10,00 10 2 20,00 20 100,0%
27Efficient use of floor area 100,0 100 10,00 10 1 10,00 10 100,0%
28Suitability for conversion 85,0 100 8,50 10 2 17,00 20 85,0%
28.1 Building modularity 0,0 15
28.2.1Spatial structure:
conversion20,0 20
28.2.2Spatial structure:
temporarily storing20,0 20
28.3.1Power and media supply:
power and media conduits15,0 15
28.3.2
Power and media supply:
capacity of the supply
shafts and ductwork
15,0 15
28.3.3Power and media supply:
BUS system15,0 15
28.4.1
Flexibility of the dist. netw. and
connections for heating, water
supply and removal
0,0 0
28.4.2
Flexibility of the dist. netw. and
connections for water supply
and removal
0,0 0
28.4.3
Flexibility of the dist. netw. and
connections for ventilation and
AC
0,0 0
29Public access 84,0 100 8,46 10 2 16,92 20 84,6%
29.1General public access to the
building16,0 16
29.2External facilities open to the
public16,0 16
29.3
Opening interior facilities
(libraries or cafeterias) to
the public
16,0 16
29.4Possibility for third parties to
rent rooms in the building0,0 16
29.5
Variety of uses for areas inside
the building that are accessible
to the public
36,0 36
30Cycling convenience 0,0 100 0,00 10 1 0,00 10 0,0%
30.1 Qualitative evaluation 0,0 50
30.2 Quantitative evaluation 0,0 50
31Design and urban planning
quality through competition55,0 100 5,50 10 3 16,50 30 55,0%
31.1.1Implementation of planning
competitions30,0 30
31.1.2 Competition process 25,0 50
31.1.3Implementation of a prize-
winning design0,0 0
31.1.4 Contracting of planning team 0,0 20
31.2 OR: Architectural prize 0,0 100
32Integration of public art 110,0 100 0,00 10 1 0,00 10 0,0%
32.1 Minimum requirement 10,0 10
Aesth
etic q
ualit
yF
unctionalit
y
So
cio
cu
ltu
ral
an
d f
un
cti
on
al
qu
ali
ty
Health, com
fort
, and u
ser
satisfa
ction
209,19 280,00 74,7% 22,5%
53,1%
18/06/2013 Page]/Pages]
Assesment matrix NOA10
achieved
(criteria)
achieved
(indicators)
max.
possibleachieved
max.
possibleachieved
max.
possibleachieved
max.
possible
53,1%22,5%
Ec
olo
gic
al
qu
ali
ty
Life c
ycle
assessm
ent
67,00 200,00 33,5%
Indicators
Score
checklist points / evaluation pointsCrieria points
Re
lev
an
ce
Fa
cto
r
Weighted
Points
Pe
rfo
rma
nc
e I
nd
ex
(Cri
teri
a) Group Points
Gro
up
Pe
rfo
rma
nc
e
Ind
ex
Gro
up
We
igh
t
To
tal
Pe
rfo
rma
nc
e
Ind
ex
Ma
in C
rite
ria
Gro
up
Cri
teri
a G
rou
p
No. Criteria
32.2.1 OR:Provision of funding as part of
the construction project20,0 20
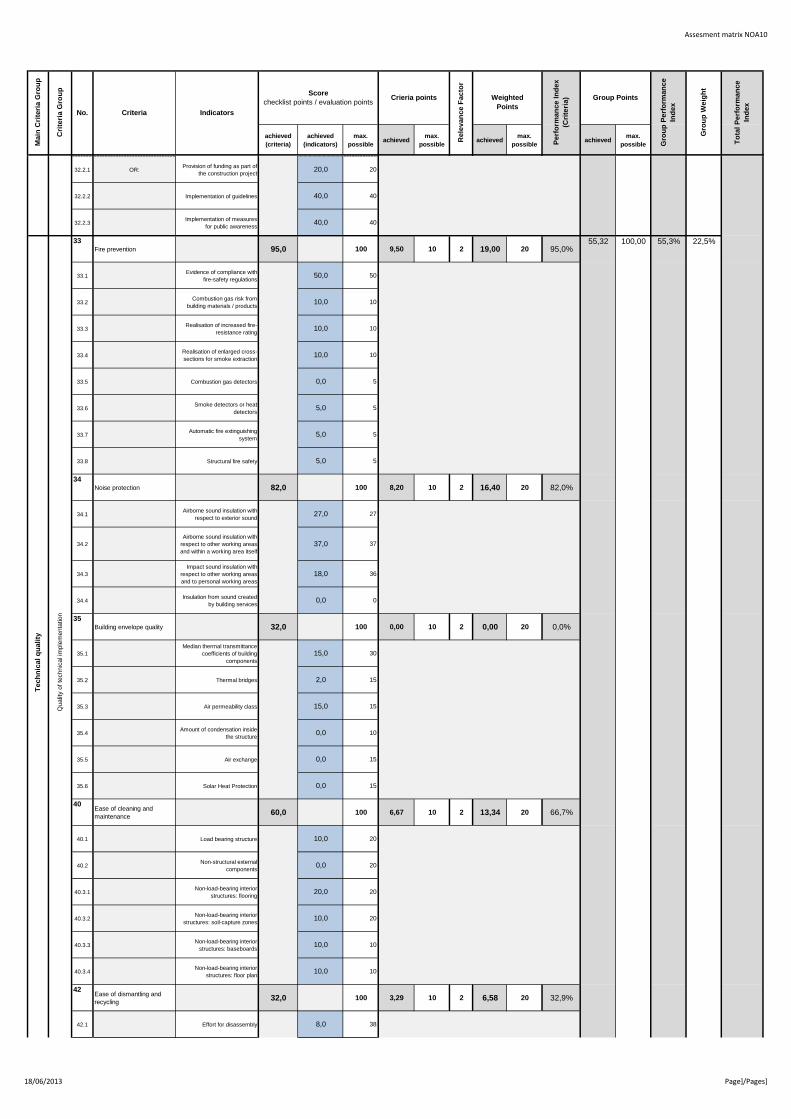
32.2.2 Implementation of guidelines 40,0 40
32.2.3Implementation of measures
for public awareness40,0 40
33Fire prevention 95,0 100 9,50 10 2 19,00 20 95,0%
33.1Evidence of compliance with
fire-safety regulations50,0 50
33.2Combustion gas risk from
building materials / products10,0 10
33.3Realisation of increased fire-
resistance rating10,0 10
33.4Realisation of enlarged cross-
sections for smoke extraction10,0 10
33.5 Combustion gas detectors 0,0 5
33.6Smoke detectors or heat
detectors5,0 5
33.7Automatic fire extinguishing
system5,0 5
33.8 Structural fire safety 5,0 5
34Noise protection 82,0 100 8,20 10 2 16,40 20 82,0%
34.1Airborne sound insulation with
respect to exterior sound27,0 27
34.2
Airborne sound insulation with
respect to other working areas
and within a working area itself
37,0 37
34.3
Impact sound insulation with
respect to other working areas
and to personal working areas
18,0 36
34.4Insulation from sound created
by building services0,0 0
35Building envelope quality 32,0 100 0,00 10 2 0,00 20 0,0%
35.1
Median thermal transmittance
coefficients of building
components
15,0 30
35.2 Thermal bridges 2,0 15
35.3 Air permeability class 15,0 15
35.4Amount of condensation inside
the structure0,0 10
35.5 Air exchange 0,0 15
35.6 Solar Heat Protection 0,0 15
40Ease of cleaning and
maintenance60,0 100 6,67 10 2 13,34 20 66,7%
40.1 Load bearing structure 10,0 20
40.2Non-structural external
components0,0 20
40.3.1Non-load-bearing interior
structures: flooring20,0 20
40.3.2Non-load-bearing interior
structures: soil-capture zones10,0 20
40.3.3Non-load-bearing interior
structures: baseboards10,0 10
40.3.4Non-load-bearing interior
structures: floor plan10,0 10
42Ease of dismantling and
recycling32,0 100 3,29 10 2 6,58 20 32,9%
42.1 Effort for disassembly 8,0 38
Te
ch
nic
al
qu
ali
ty
Qualit
y o
f te
chnic
al im
ple
menta
tion
55,32 100,00 55,3% 22,5%
Aesth
etic q
ualit
y
So
cio
cu
ltu
ral
an
d f
un
cti
on
al
qu
ali
ty
209,19 280,00 74,7% 22,5%
53,1%
18/06/2013 Page]/Pages]
Assesment matrix NOA10
achieved
(criteria)
achieved
(indicators)
max.
possibleachieved
max.
possibleachieved
max.
possibleachieved
max.
possible
53,1%22,5%
Ec
olo
gic
al
qu
ali
ty
Life c
ycle
assessm
ent
67,00 200,00 33,5%
Indicators
Score
checklist points / evaluation pointsCrieria points
Re
lev
an
ce
Fa
cto
r
Weighted
Points
Pe
rfo
rma
nc
e I
nd
ex
(Cri
teri
a) Group Points
Gro
up
Pe
rfo
rma
nc
e
Ind
ex
Gro
up
We
igh
t
To
tal
Pe
rfo
rma
nc
e
Ind
ex
Ma
in C
rite
ria
Gro
up
Cri
teri
a G
rou
p
No. Criteria
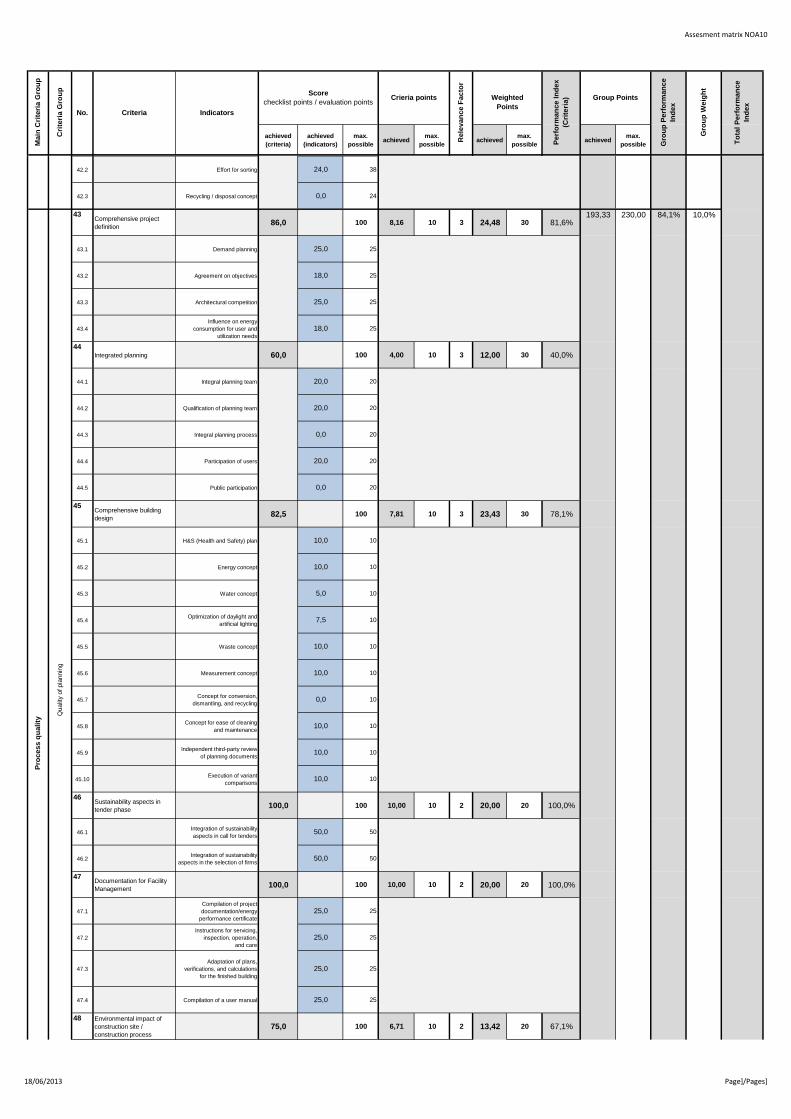
42.2 Effort for sorting 24,0 38
42.3 Recycling / disposal concept 0,0 24
43Comprehensive project
definition86,0 100 8,16 10 3 24,48 30 81,6%
43.1 Demand planning 25,0 25
43.2 Agreement on objectives 18,0 25
43.3 Architectural competition 25,0 25
43.4
Influence on energy
consumption for user and
utilization needs
18,0 25
44Integrated planning 60,0 100 4,00 10 3 12,00 30 40,0%
44.1 Integral planning team 20,0 20
44.2 Qualification of planning team 20,0 20
44.3 Integral planning process 0,0 20
44.4 Participation of users 20,0 20
44.5 Public participation 0,0 20
45Comprehensive building
design82,5 100 7,81 10 3 23,43 30 78,1%
45.1 H&S (Health and Safety) plan 10,0 10
45.2 Energy concept 10,0 10
45.3 Water concept 5,0 10
45.4Optimization of daylight and
artificial lighting7,5 10
45.5 Waste concept 10,0 10
45.6 Measurement concept 10,0 10
45.7Concept for conversion,
dismantling, and recycling0,0 10
45.8Concept for ease of cleaning
and maintenance10,0 10
45.9Independent third-party review
of planning documents10,0 10
45.10Execution of variant
comparisons10,0 10
46Sustainability aspects in
tender phase100,0 100 10,00 10 2 20,00 20 100,0%
46.1Integration of sustainability
aspects in call for tenders50,0 50
46.2Integration of sustainability
aspects in the selection of firms50,0 50
47Documentation for Facility
Management100,0 100 10,00 10 2 20,00 20 100,0%
47.1
Compilation of project
documentation/energy
performance certificate
25,0 25
47.2
Instructions for servicing,
inspection, operation,
and care
25,0 25
47.3
Adaptation of plans,
verifications, and calculations
for the finished building
25,0 25
47.4 Compilation of a user manual 25,0 25
48 Environmental impact of
construction site /
construction process
75,0 100 6,71 10 2 13,42 20 67,1%
Pro
ce
ss
qu
ali
ty
Qualit
y o
f pla
nnin
g
193,33 230,00 84,1% 10,0%
Te
ch
nic
al
qu
ali
ty
Qualit
y o
f te
chnic
al im
ple
menta
tion
55,32 100,00 55,3% 22,5%
53,1%
18/06/2013 Page]/Pages]
Assesment matrix NOA10
achieved
(criteria)
achieved
(indicators)
max.
possibleachieved
max.
possibleachieved
max.
possibleachieved
max.
possible
53,1%22,5%
Ec
olo
gic
al
qu
ali
ty
Life c
ycle
assessm
ent
67,00 200,00 33,5%
Indicators
Score
checklist points / evaluation pointsCrieria points
Re
lev
an
ce
Fa
cto
r
Weighted
Points
Pe
rfo
rma
nc
e I
nd
ex
(Cri
teri
a) Group Points
Gro
up
Pe
rfo
rma
nc
e
Ind
ex
Gro
up
We
igh
t
To
tal
Pe
rfo
rma
nc
e
Ind
ex
Ma
in C
rite
ria
Gro
up
Cri
teri
a G
rou
p
No. Criteria
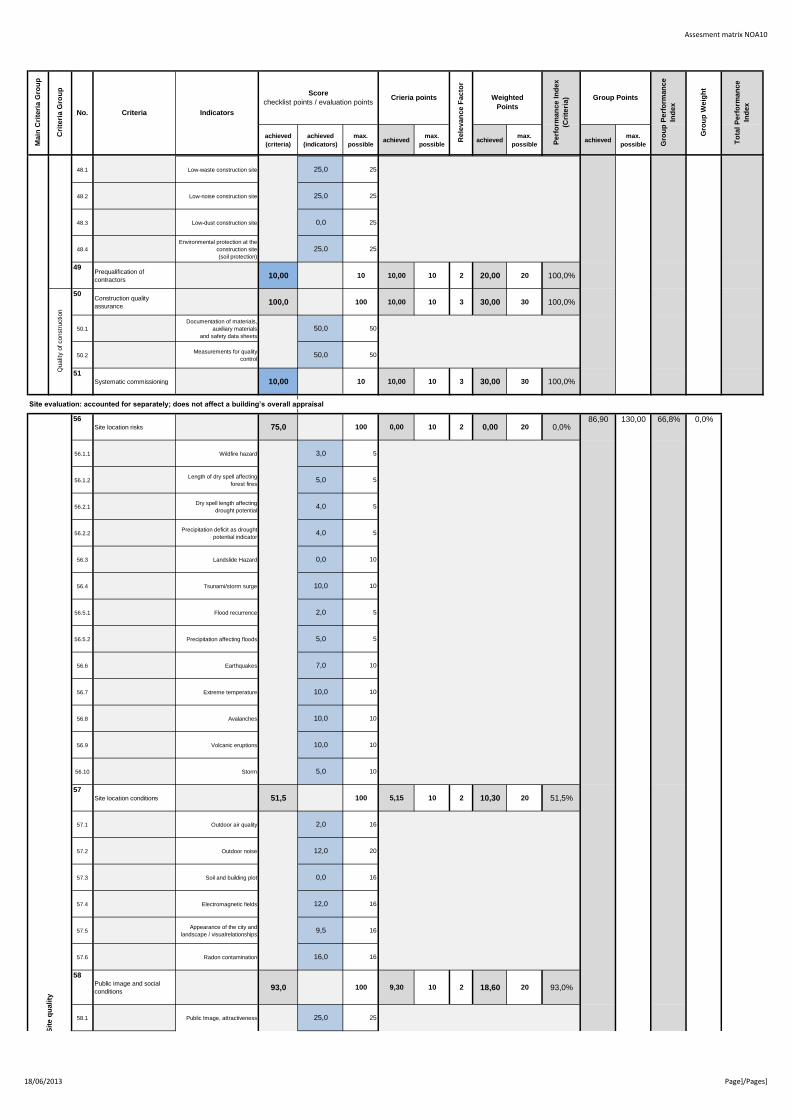
48.1 Low-waste construction site 25,0 25
48.2 Low-noise construction site 25,0 25
48.3 Low-dust construction site 0,0 25
48.4
Environmental protection at the
construction site
(soil protection)
25,0 25
49Prequalification of
contractors10,00 10 10,00 10 2 20,00 20 100,0%
50Construction quality
assurance100,0 100 10,00 10 3 30,00 30 100,0%
50.1
Documentation of materials,
auxiliary materials
and safety data sheets
50,0 50
50.2Measurements for quality
control50,0 50
51Systematic commissioning 10,00 10 10,00 10 3 30,00 30 100,0%
Site evaluation: accounted for separately; does not affect a building’s overall appraisal
56Site location risks 75,0 100 0,00 10 2 0,00 20 0,0%
56.1.1 Wildfire hazard 3,0 5
56.1.2Length of dry spell affecting
forest fires5,0 5
56.2.1Dry spell length affecting
drought potential4,0 5
56.2.2Precipitation deficit as drought
potential indicator4,0 5
56.3 Landslide Hazard 0,0 10
56.4 Tsunami/storm surge 10,0 10
56.5.1 Flood recurrence 2,0 5
56.5.2 Precipitation affecting floods 5,0 5
56.6 Earthquakes 7,0 10
56.7 Extreme temperature 10,0 10
56.8 Avalanches 10,0 10
56.9 Volcanic eruptions 10,0 10
56.10 Storm 5,0 10
57Site location conditions 51,5 100 5,15 10 2 10,30 20 51,5%
57.1 Outdoor air quality 2,0 16
57.2 Outdoor noise 12,0 20
57.3 Soil and building plot 0,0 16
57.4 Electromagnetic fields 12,0 16
57.5Appearance of the city and
landscape / visualrelationships9,5 16
57.6 Radon contamination 16,0 16
58Public image and social
conditions93,0 100 9,30 10 2 18,60 20 93,0%
58.1 Public Image, attractiveness 25,0 25
Sit
e q
ua
lity
86,90 130,00 66,8% 0,0%
Pro
ce
ss
qu
ali
ty
Qualit
y o
f pla
nnin
g
193,33 230,00 84,1% 10,0%
Qualit
y o
f constr
uction
53,1%
18/06/2013 Page]/Pages]
Assesment matrix NOA10
achieved
(criteria)
achieved
(indicators)
max.
possibleachieved
max.
possibleachieved
max.
possibleachieved
max.
possible
53,1%22,5%
Ec
olo
gic
al
qu
ali
ty
Life c
ycle
assessm
ent
67,00 200,00 33,5%
Indicators
Score
checklist points / evaluation pointsCrieria points
Re
lev
an
ce
Fa
cto
r
Weighted
Points
Pe
rfo
rma
nc
e I
nd
ex
(Cri
teri
a) Group Points
Gro
up
Pe
rfo
rma
nc
e
Ind
ex
Gro
up
We
igh
t
To
tal
Pe
rfo
rma
nc
e
Ind
ex
Ma
in C
rite
ria
Gro
up
Cri
teri
a G
rou
p
No. Criteria
58.2 Potential synergies 25,0 25
58,3 Crime 18,0 25
58.4 Upkeep and condition 25,0 25
59Access to transportation 82,0 100 8,20 10 3 24,60 30 82,0%
59.1Accessibility of the nearest train
station (rail)15,0 30
59.2
Accessibility of the nearest
public transportation stop (bus,
local train, tram, etc.)
27,0 30
59.3 Bike paths 40,0 40
60Access to specific-use
facilities97,0 100 9,70 10 2 19,40 20 97,0%
60.1 Gastronomy 10,0 10
Sit
e q
ua
lity
86,90 130,00 66,8% 0,0%
18/06/2013 Page]/Pages]
Assesment matrix NOA10
achieved
(criteria)
achieved
(indicators)
max.
possibleachieved
max.
possibleachieved
max.
possibleachieved
max.
possible
53,1%22,5%
Ec
olo
gic
al
qu
ali
ty
Life c
ycle
assessm
ent
67,00 200,00 33,5%
Indicators
Score
checklist points / evaluation pointsCrieria points
Re
lev
an
ce
Fa
cto
r
Weighted
Points
Pe
rfo
rma
nc
e I
nd
ex
(Cri
teri
a) Group Points
Gro
up
Pe
rfo
rma
nc
e
Ind
ex
Gro
up
We
igh
t
To
tal
Pe
rfo
rma
nc
e
Ind
ex
Ma
in C
rite
ria
Gro
up
Cri
teri
a G
rou
p
No. Criteria
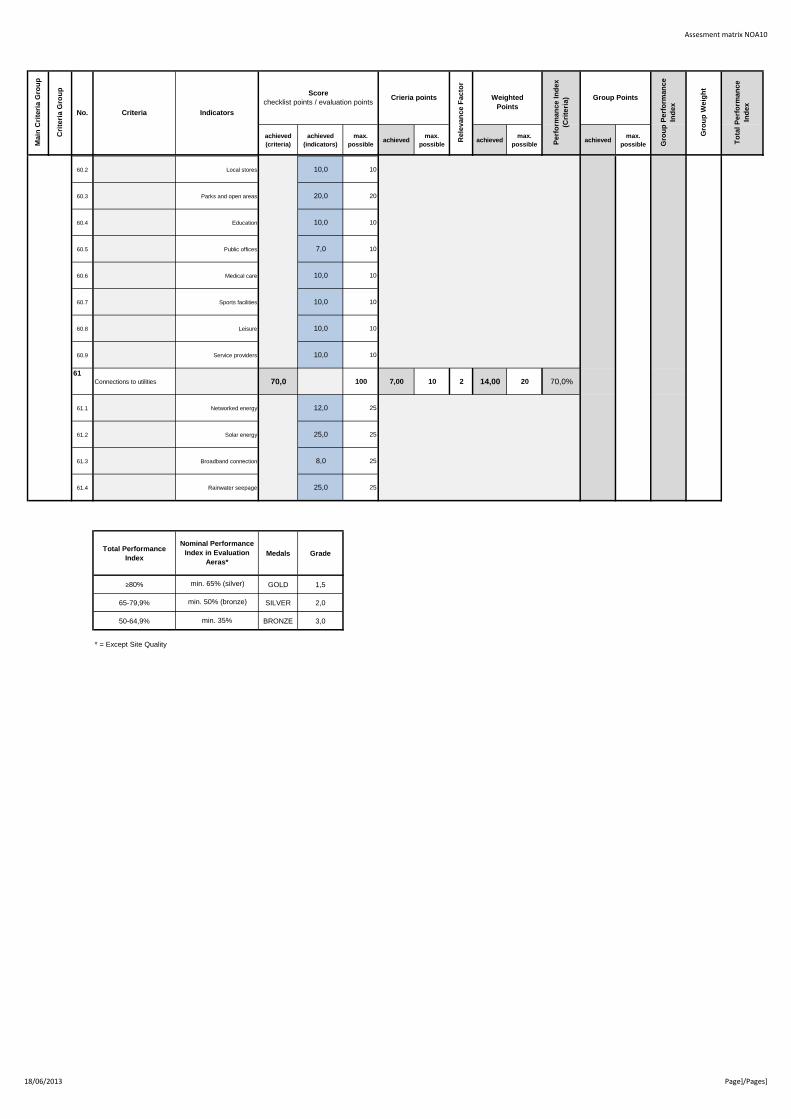
60.2 Local stores 10,0 10
60.3 Parks and open areas 20,0 20
60.4 Education 10,0 10
60.5 Public offices 7,0 10
60.6 Medical care 10,0 10
60.7 Sports facilities 10,0 10
60.8 Leisure 10,0 10
60.9 Service providers 10,0 10
61Connections to utilities 70,0 100 7,00 10 2 14,00 20 70,0%
61.1 Networked energy 12,0 25
61.2 Solar energy 25,0 25
61.3 Broadband connection 8,0 25
61.4 Rainwater seepage 25,0 25
Total Performance
IndexMedals Grade
≥80% GOLD 1,5
65-79,9% SILVER 2,0
50-64,9% BRONZE 3,0
* = Except Site Quality
min. 50% (bronze)
Nominal Performance
Index in Evaluation
Aeras*
Sit
e q
ua
lity
min. 35%
min. 65% (silver)
86,90 130,00 66,8% 0,0%
18/06/2013 Page]/Pages]

Assesment matrix NOA10
Legend:evaluation points to be entered
checklist points to be entered
fixed value
will be automatically calculated
cell without content
achieved
(criteria)
achieved
(indicators)
max.
possibleachieved
max.
possibleachieved
max.
possibleachieved
max.
possible
1 Global warming potential
(GWP) 0,00 10 0,00 10 3 0,00 30 0,0%
2 Ozone depletion potential
(ODP) 10,00 10 10,00 10 1 10,00 10 100,0%
3 Photochemical ozone
creation potential (POCP) 10,00 10 10,00 10 1 10,00 10 100,0%
4 Acidification potential (AP)
10,00 10 10,00 10 1 10,00 10 100,0%
5 Eutrophication potential (EP)
10,00 10 10,00 10 1 10,00 10 100,0%
6 Local environmental impact
0,00 10 0,00 10 3 0,00 30 0,0%
8 Sustainable use of
resources / wood 0,00 10 0,00 10 1 0,00 10 0,0%
10 Nonrenewable primary
energy demand (Pnren) 0,00 10 0,00 10 3 0,00 30 0,0%
11 Total primary energy
demand and proportion of
renewable primary energy 0,00 10 0,00 10 2 0,00 20 0,0%
11.1
Total primary energy
demand 0,00 10
11.2
Proportion of renewable
primary energy 0,00 5
14 Drinking water demand and
wastewater volume 3,50 10 3,50 10 2 7,00 20 35,0%
15 Land use
10,00 10 10,00 10 2 20,00 20 100,0%
Life c
ycle
costs
16Building-related life-cycle
costs2,00 10 2,00 10 3 6,00 30 20,0%
17 Suitability for third-party use
57,5 100 5,75 10 2 11,50 20 57,5%
17.1
Space efficiency
30,0 30
17.2
Suitability for conversion
27,5 50
17.3
Possibility of modification for
other types of use 0,0 20
18Thermal comfort in the
winter100,0 100 10,00 10 2 20,00 20 100,0%
18.1 Operative temperature 70,0 70
18.2 Drafts 10,0 10
18.3
Radiant temperature
asymmetry and floor
temperature
10,0 10
18.4 Relative humidity 10,0 10
19Thermal comfort in the
summer100,0 100 10,00 10 3 30,00 30 100,0%
19.1 Operative Temperatur 70,0 70
19.2 Drafts 10,0 10
19.3
Radiant temperature
asymmetry and floor
temperature
10,0 10
19.4 Relative humidity 10,0 10
Ec
on
om
ic q
ua
lity
17,50 50,00 35,0% 35,0%
Econom
ic d
evelo
pm
ent
So
cio
cu
ltu
ral
an
d f
un
cti
on
al
qu
ali
ty
Health, com
fort
, and u
ser
satisfa
ction
182,83 280,00 65,3% 40,0%
Effects
on the
glo
bal and local
environm
ent
50,9%
Resourc
e c
onsum
ption a
nd w
aste
genera
tion
10,0%
Ec
olo
gic
al
qu
ali
ty
Life c
ycle
assessm
ent
67,00 200,00 33,5%
Anexo E.1: Puntuación según clasificación propuesta (Promotor y destino)
Assesment matrix of the DGNB International Certification System / Occupancy Profile New Office and Administrative Buildings, Version 2010© Copyright 2010 German Sustainable Building Council (DGNB)
Project No.
Project Name
Auditor
Indicators
Score
checklist points / evaluation pointsCrieria points
Re
lev
an
ce
Fa
cto
r
Weighted
Points
Pe
rfo
rma
nc
e I
nd
ex
(Cri
teri
a) Group Points
Gro
up
Pe
rfo
rma
nc
e
Ind
ex
Gro
up
We
igh
t
To
tal
Pe
rfo
rma
nc
e
Ind
ex
Ma
in C
rite
ria
Gro
up
Cri
teri
a G
rou
p
No. Criteria
18/06/2013 Page]/Pages]

Assesment matrix NOA10
achieved
(criteria)
achieved
(indicators)
max.
possibleachieved
max.
possibleachieved
max.
possibleachieved
max.
possible
50,9%10,0%
Ec
olo
gic
al
qu
ali
ty
Life c
ycle
assessm
ent
67,00 200,00 33,5%
Indicators
Score
checklist points / evaluation pointsCrieria points
Re
lev
an
ce
Fa
cto
r
Weighted
Points
Pe
rfo
rma
nc
e I
nd
ex
(Cri
teri
a) Group Points
Gro
up
Pe
rfo
rma
nc
e
Ind
ex
Gro
up
We
igh
t
To
tal
Pe
rfo
rma
nc
e
Ind
ex
Ma
in C
rite
ria
Gro
up
Cri
teri
a G
rou
p
No. Criteria
20Indoor air quality 25,0 100 2,50 10 3 7,50 30 25,0%
20.1Volatile organic compounds
(TVOC, formaldehyde)0,0 50
So
cio
cu
ltu
ral
an
d f
un
cti
on
al
qu
ali
ty
Health, com
fort
, and u
ser
satisfa
ction
182,83 280,00 65,3% 40,0%
50,9%
18/06/2013 Page]/Pages]

Assesment matrix NOA10
achieved
(criteria)
achieved
(indicators)
max.
possibleachieved
max.
possibleachieved
max.
possibleachieved
max.
possible
50,9%10,0%
Ec
olo
gic
al
qu
ali
ty
Life c
ycle
assessm
ent
67,00 200,00 33,5%
Indicators
Score
checklist points / evaluation pointsCrieria points
Re
lev
an
ce
Fa
cto
r
Weighted
Points
Pe
rfo
rma
nc
e I
nd
ex
(Cri
teri
a) Group Points
Gro
up
Pe
rfo
rma
nc
e
Ind
ex
Gro
up
We
igh
t
To
tal
Pe
rfo
rma
nc
e
Ind
ex
Ma
in C
rite
ria
Gro
up
Cri
teri
a G
rou
p
No. Criteria
20.4Occupancy-based ventilation
rate25,0 50
21Acoustic comfort 75,0 100 (125) 5,00 10 1 5,00 10 50,0%
21.1
Individual offices and multi-
person offices with
areas of up to 40 m²
25,0 35
21.2 Multi-person offices 15,0 35
21.3 Conference rooms 35,0 35
21.4Cafeterias with an area of > 50
m²0,0 20
22Visual comfort 70,0 100 6,88 10 3 20,64 30 68,8%
22.1Availability of daylight
throughout the building0,0 16
22.2Availability of daylight in
permanently used work areas0,0 14
22.3 Views to the outside 14,0 14
22.4 Glare prevention in daylight 14,0 14
22.5 Preventing glare in artificial light 14,0 14
22.6Light distribution in artificial
lighting conditions14,0 14
22.7 Color rendering 14,0 14
23User influence on building
operation54,0 100 5,40 10 2 10,80 20 54,0%
23.1 Ventilation 14,0 14
23.2 Shading 0,0 14
23.3 Glare protection 0,0 14
23.4Temperatures during the
heating period14,0 14
23.5Temperatures outside of the
heating period14,0 14
23.6Control of daylight and artificial
light0,0 14
23.7 Ease of use 12,0 16
24Quality of outdoor spaces 90,0 100 9,17 10 1 9,17 10 91,7%
24.1Quantitative evaluation
50,0 50
24.1.1 Roof area 20,0 20
24.1.2Façade-integrated outdoor
areas10,0 10
24.1.3Building-integrated outdoor
areas10,0 10
24.1.4Special areas around the
ground floor10,0 10
24.2Qualitative evaluation
40,0 50
24.2.1 Design concept 10,0 10
24.2.2 Roof plants 5,0 5
24.2.3 Maintenance contract 5,0 5
24.2.4 Roof area orientation 5,0 5
So
cio
cu
ltu
ral
an
d f
un
cti
on
al
qu
ali
ty
Health, com
fort
, and u
ser
satisfa
ction
182,83 280,00 65,3% 40,0%
50,9%
18/06/2013 Page]/Pages]
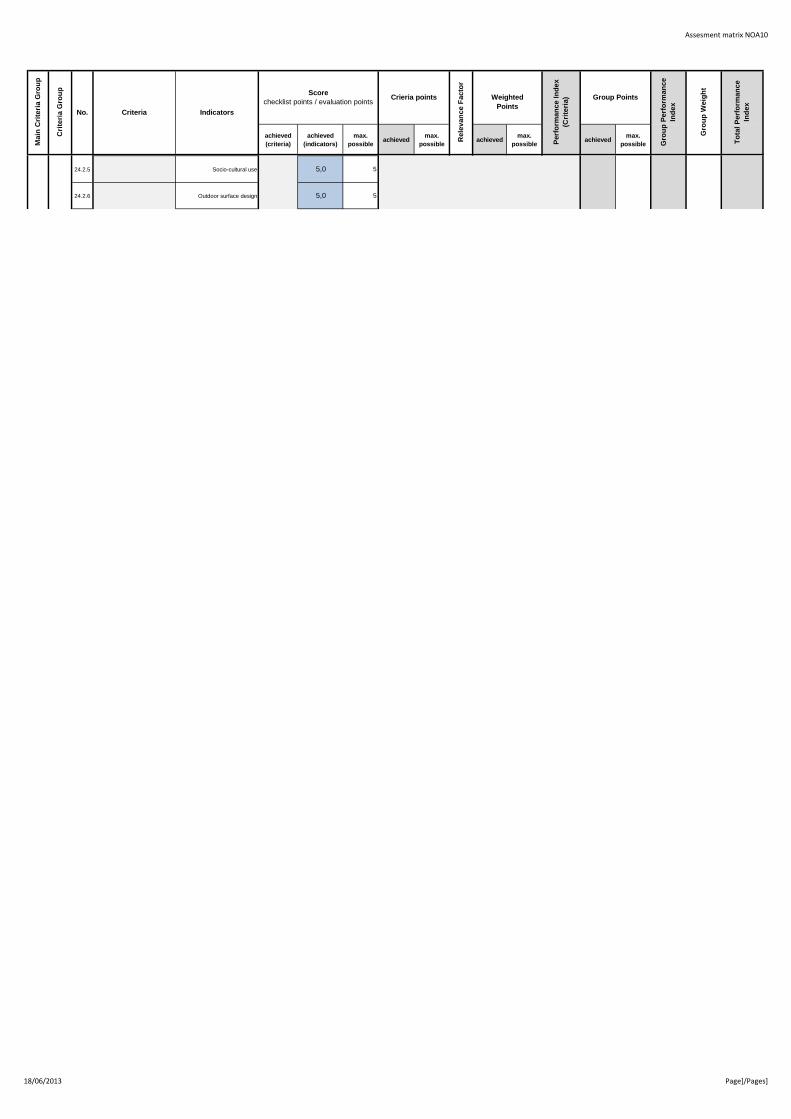
Assesment matrix NOA10
achieved
(criteria)
achieved
(indicators)
max.
possibleachieved
max.
possibleachieved
max.
possibleachieved
max.
possible
50,9%10,0%
Ec
olo
gic
al
qu
ali
ty
Life c
ycle
assessm
ent
67,00 200,00 33,5%
Indicators
Score
checklist points / evaluation pointsCrieria points
Re
lev
an
ce
Fa
cto
r
Weighted
Points
Pe
rfo
rma
nc
e I
nd
ex
(Cri
teri
a) Group Points
Gro
up
Pe
rfo
rma
nc
e
Ind
ex
Gro
up
We
igh
t
To
tal
Pe
rfo
rma
nc
e
Ind
ex
Ma
in C
rite
ria
Gro
up
Cri
teri
a G
rou
p
No. Criteria
24.2.5 Socio-cultural use 5,0 5
24.2.6 Outdoor surface design 5,0 5
So
cio
cu
ltu
ral
an
d f
un
cti
on
al
qu
ali
ty
Health, com
fort
, and u
ser
satisfa
ction
182,83 280,00 65,3% 40,0%
50,9%
18/06/2013 Page]/Pages]

Assesment matrix NOA10
achieved
(criteria)
achieved
(indicators)
max.
possibleachieved
max.
possibleachieved
max.
possibleachieved
max.
possible
50,9%10,0%
Ec
olo
gic
al
qu
ali
ty
Life c
ycle
assessm
ent
67,00 200,00 33,5%
Indicators
Score
checklist points / evaluation pointsCrieria points
Re
lev
an
ce
Fa
cto
r
Weighted
Points
Pe
rfo
rma
nc
e I
nd
ex
(Cri
teri
a) Group Points
Gro
up
Pe
rfo
rma
nc
e
Ind
ex
Gro
up
We
igh
t
To
tal
Pe
rfo
rma
nc
e
Ind
ex
Ma
in C
rite
ria
Gro
up
Cri
teri
a G
rou
p
No. Criteria
24.2.7 Features 5,0 15
25Safety and security 88,0 100 8,80 10 1 8,80 10 88,0%
25.1Subjective perception of safety
and protection against assault38,0 50
25.2Reduction of damage should an
accident occur50,0 50
26Handicapped accessibility 10,00 10 10,00 10 2 20,00 20 100,0%
27Efficient use of floor area 100,0 100 10,00 10 1 10,00 10 100,0%
28Suitability for conversion 60,0 100 6,00 10 2 12,00 20 60,0%
28.1 Building modularity 0,0 10
28.2.1Spatial structure:
conversion15,0 15
28.2.2Spatial structure:
temporarily storing15,0 15
28.3.1Power and media supply:
power and media conduits10,0 10
28.3.2
Power and media supply:
capacity of the supply
shafts and ductwork
10,0 10
28.3.3Power and media supply:
BUS system10,0 10
28.4.1
Flexibility of the dist. netw. and
connections for heating, water
supply and removal
0,0 10
28.4.2
Flexibility of the dist. netw. and
connections for water supply
and removal
0,0 10
28.4.3
Flexibility of the dist. netw. and
connections for ventilation and
AC
0,0 10
29Public access 84,0 100 8,46 10 2 16,92 20 84,6%
29.1General public access to the
building16,0 16
29.2External facilities open to the
public16,0 16
29.3
Opening interior facilities
(libraries or cafeterias) to
the public
16,0 16
29.4Possibility for third parties to
rent rooms in the building0,0 16
29.5
Variety of uses for areas inside
the building that are accessible
to the public
36,0 36
30Cycling convenience 0,0 100 0,00 10 1 0,00 10 0,0%
30.1 Qualitative evaluation 0,0 50
30.2 Quantitative evaluation 0,0 50
31Design and urban planning
quality through competition40,0 100 4,00 10 3 12,00 30 40,0%
31.1.1Implementation of planning
competitions20,0 20
31.1.2 Competition process 20,0 40
31.1.3Implementation of a prize-
winning design0,0 30
31.1.4 Contracting of planning team 0,0 10
31.2 OR: Architectural prize 0,0 100
32Integration of public art 110,0 100 0,00 10 1 0,00 10 0,0%
32.1 Minimum requirement 10,0 10
Aesth
etic q
ualit
yF
unctionalit
y
So
cio
cu
ltu
ral
an
d f
un
cti
on
al
qu
ali
ty
Health, com
fort
, and u
ser
satisfa
ction
182,83 280,00 65,3% 40,0%
50,9%
18/06/2013 Page]/Pages]

Assesment matrix NOA10
achieved
(criteria)
achieved
(indicators)
max.
possibleachieved
max.
possibleachieved
max.
possibleachieved
max.
possible
50,9%10,0%
Ec
olo
gic
al
qu
ali
ty
Life c
ycle
assessm
ent
67,00 200,00 33,5%
Indicators
Score
checklist points / evaluation pointsCrieria points
Re
lev
an
ce
Fa
cto
r
Weighted
Points
Pe
rfo
rma
nc
e I
nd
ex
(Cri
teri
a) Group Points
Gro
up
Pe
rfo
rma
nc
e
Ind
ex
Gro
up
We
igh
t
To
tal
Pe
rfo
rma
nc
e
Ind
ex
Ma
in C
rite
ria
Gro
up
Cri
teri
a G
rou
p
No. Criteria
32.2.1 OR:Provision of funding as part of
the construction project20,0 20
32.2.2 Implementation of guidelines 40,0 40
32.2.3Implementation of measures
for public awareness40,0 40
33Fire prevention 75,0 100 7,50 10 2 15,00 20 75,0%
33.1Evidence of compliance with
fire-safety regulations50,0 50
33.2Combustion gas risk from
building materials / products10,0 10
33.3Realisation of increased fire-
resistance rating0,0 10
33.4Realisation of enlarged cross-
sections for smoke extraction0,0 10
33.5 Combustion gas detectors 0,0 5
33.6Smoke detectors or heat
detectors5,0 5
33.7Automatic fire extinguishing
system5,0 5
33.8 Structural fire safety 5,0 5
34Noise protection 75,0 100 7,50 10 2 15,00 20 75,0%
34.1Airborne sound insulation with
respect to exterior sound20,0 20
34.2
Airborne sound insulation with
respect to other working areas
and within a working area itself
30,0 30
34.3
Impact sound insulation with
respect to other working areas
and to personal working areas
15,0 30
34.4Insulation from sound created
by building services10,0 20
35Building envelope quality 32,0 100 0,00 10 2 0,00 20 0,0%
35.1
Median thermal transmittance
coefficients of building
components
15,0 30
35.2 Thermal bridges 2,0 15
35.3 Air permeability class 15,0 15
35.4Amount of condensation inside
the structure0,0 10
35.5 Air exchange 0,0 15
35.6 Solar Heat Protection 0,0 15
40Ease of cleaning and
maintenance60,0 100 6,67 10 2 13,34 20 66,7%
40.1 Load bearing structure 10,0 20
40.2Non-structural external
components0,0 20
40.3.1Non-load-bearing interior
structures: flooring20,0 20
40.3.2Non-load-bearing interior
structures: soil-capture zones10,0 20
40.3.3Non-load-bearing interior
structures: baseboards10,0 10
40.3.4Non-load-bearing interior
structures: floor plan10,0 10
42Ease of dismantling and
recycling32,0 100 3,29 10 2 6,58 20 32,9%
42.1 Effort for disassembly 8,0 38
Te
ch
nic
al
qu
ali
ty
Qualit
y o
f te
chnic
al im
ple
menta
tion
49,92 100,00 49,9% 10,0%
Aesth
etic q
ualit
y
So
cio
cu
ltu
ral
an
d f
un
cti
on
al
qu
ali
ty
182,83 280,00 65,3% 40,0%
50,9%
18/06/2013 Page]/Pages]

Assesment matrix NOA10
achieved
(criteria)
achieved
(indicators)
max.
possibleachieved
max.
possibleachieved
max.
possibleachieved
max.
possible
50,9%10,0%
Ec
olo
gic
al
qu
ali
ty
Life c
ycle
assessm
ent
67,00 200,00 33,5%
Indicators
Score
checklist points / evaluation pointsCrieria points
Re
lev
an
ce
Fa
cto
r
Weighted
Points
Pe
rfo
rma
nc
e I
nd
ex
(Cri
teri
a) Group Points
Gro
up
Pe
rfo
rma
nc
e
Ind
ex
Gro
up
We
igh
t
To
tal
Pe
rfo
rma
nc
e
Ind
ex
Ma
in C
rite
ria
Gro
up
Cri
teri
a G
rou
p
No. Criteria
42.2 Effort for sorting 24,0 38
42.3 Recycling / disposal concept 0,0 24
43Comprehensive project
definition86,0 100 8,16 10 3 24,48 30 81,6%
43.1 Demand planning 25,0 25
43.2 Agreement on objectives 18,0 25
43.3 Architectural competition 25,0 25
43.4
Influence on energy
consumption for user and
utilization needs
18,0 25
44Integrated planning 60,0 100 4,00 10 3 12,00 30 40,0%
44.1 Integral planning team 20,0 20
44.2 Qualification of planning team 20,0 20
44.3 Integral planning process 0,0 20
44.4 Participation of users 20,0 20
44.5 Public participation 0,0 20
45Comprehensive building
design82,5 100 7,81 10 3 23,43 30 78,1%
45.1 H&S (Health and Safety) plan 10,0 10
45.2 Energy concept 10,0 10
45.3 Water concept 5,0 10
45.4Optimization of daylight and
artificial lighting7,5 10
45.5 Waste concept 10,0 10
45.6 Measurement concept 10,0 10
45.7Concept for conversion,
dismantling, and recycling0,0 10
45.8Concept for ease of cleaning
and maintenance10,0 10
45.9Independent third-party review
of planning documents10,0 10
45.10Execution of variant
comparisons10,0 10
46Sustainability aspects in
tender phase100,0 100 10,00 10 2 20,00 20 100,0%
46.1Integration of sustainability
aspects in call for tenders50,0 50
46.2Integration of sustainability
aspects in the selection of firms50,0 50
47Documentation for Facility
Management100,0 100 10,00 10 2 20,00 20 100,0%
47.1
Compilation of project
documentation/energy
performance certificate
25,0 25
47.2
Instructions for servicing,
inspection, operation,
and care
25,0 25
47.3
Adaptation of plans,
verifications, and calculations
for the finished building
25,0 25
47.4 Compilation of a user manual 25,0 25
48 Environmental impact of
construction site /
construction process
75,0 100 6,71 10 2 13,42 20 67,1%
Pro
ce
ss
qu
ali
ty
Qualit
y o
f pla
nnin
g
193,33 230,00 84,1% 5,0%
Te
ch
nic
al
qu
ali
ty
Qualit
y o
f te
chnic
al im
ple
menta
tion
49,92 100,00 49,9% 10,0%
50,9%
18/06/2013 Page]/Pages]

Assesment matrix NOA10
achieved
(criteria)
achieved
(indicators)
max.
possibleachieved
max.
possibleachieved
max.
possibleachieved
max.
possible
50,9%10,0%
Ec
olo
gic
al
qu
ali
ty
Life c
ycle
assessm
ent
67,00 200,00 33,5%
Indicators
Score
checklist points / evaluation pointsCrieria points
Re
lev
an
ce
Fa
cto
r
Weighted
Points
Pe
rfo
rma
nc
e I
nd
ex
(Cri
teri
a) Group Points
Gro
up
Pe
rfo
rma
nc
e
Ind
ex
Gro
up
We
igh
t
To
tal
Pe
rfo
rma
nc
e
Ind
ex
Ma
in C
rite
ria
Gro
up
Cri
teri
a G
rou
p
No. Criteria
48.1 Low-waste construction site 25,0 25
48.2 Low-noise construction site 25,0 25
48.3 Low-dust construction site 0,0 25
48.4
Environmental protection at the
construction site
(soil protection)
25,0 25
49Prequalification of
contractors10,00 10 10,00 10 2 20,00 20 100,0%
50Construction quality
assurance100,0 100 10,00 10 3 30,00 30 100,0%
50.1
Documentation of materials,
auxiliary materials
and safety data sheets
50,0 50
50.2Measurements for quality
control50,0 50
51Systematic commissioning 10,00 10 10,00 10 3 30,00 30 100,0%
Site evaluation: accounted for separately; does not affect a building’s overall appraisal
56Site location risks 75,0 100 0,00 10 2 0,00 20 0,0%
56.1.1 Wildfire hazard 3,0 5
56.1.2Length of dry spell affecting
forest fires5,0 5
56.2.1Dry spell length affecting
drought potential4,0 5
56.2.2Precipitation deficit as drought
potential indicator4,0 5
56.3 Landslide Hazard 0,0 10
56.4 Tsunami/storm surge 10,0 10
56.5.1 Flood recurrence 2,0 5
56.5.2 Precipitation affecting floods 5,0 5
56.6 Earthquakes 7,0 10
56.7 Extreme temperature 10,0 10
56.8 Avalanches 10,0 10
56.9 Volcanic eruptions 10,0 10
56.10 Storm 5,0 10
57Site location conditions 51,5 100 5,15 10 2 10,30 20 51,5%
57.1 Outdoor air quality 2,0 16
57.2 Outdoor noise 12,0 20
57.3 Soil and building plot 0,0 16
57.4 Electromagnetic fields 12,0 16
57.5Appearance of the city and
landscape / visualrelationships9,5 16
57.6 Radon contamination 16,0 16
58Public image and social
conditions93,0 100 9,30 10 2 18,60 20 93,0%
58.1 Public Image, attractiveness 25,0 25
Sit
e q
ua
lity
86,90 130,00 66,8% 0,0%
Pro
ce
ss
qu
ali
ty
Qualit
y o
f pla
nnin
g
193,33 230,00 84,1% 5,0%
Qualit
y o
f constr
uction
50,9%
18/06/2013 Page]/Pages]

Assesment matrix NOA10
achieved
(criteria)
achieved
(indicators)
max.
possibleachieved
max.
possibleachieved
max.
possibleachieved
max.
possible
50,9%10,0%
Ec
olo
gic
al
qu
ali
ty
Life c
ycle
assessm
ent
67,00 200,00 33,5%
Indicators
Score
checklist points / evaluation pointsCrieria points
Re
lev
an
ce
Fa
cto
r
Weighted
Points
Pe
rfo
rma
nc
e I
nd
ex
(Cri
teri
a) Group Points
Gro
up
Pe
rfo
rma
nc
e
Ind
ex
Gro
up
We
igh
t
To
tal
Pe
rfo
rma
nc
e
Ind
ex
Ma
in C
rite
ria
Gro
up
Cri
teri
a G
rou
p
No. Criteria
58.2 Potential synergies 25,0 25
58,3 Crime 18,0 25
58.4 Upkeep and condition 25,0 25
59Access to transportation 82,0 100 8,20 10 3 24,60 30 82,0%
59.1Accessibility of the nearest train
station (rail)15,0 30
59.2
Accessibility of the nearest
public transportation stop (bus,
local train, tram, etc.)
27,0 30
59.3 Bike paths 40,0 40
60Access to specific-use
facilities97,0 100 9,70 10 2 19,40 20 97,0%
60.1 Gastronomy 10,0 10
Sit
e q
ua
lity
86,90 130,00 66,8% 0,0%
18/06/2013 Page]/Pages]

Assesment matrix NOA10
achieved
(criteria)
achieved
(indicators)
max.
possibleachieved
max.
possibleachieved
max.
possibleachieved
max.
possible
50,9%10,0%
Ec
olo
gic
al
qu
ali
ty
Life c
ycle
assessm
ent
67,00 200,00 33,5%
Indicators
Score
checklist points / evaluation pointsCrieria points
Re
lev
an
ce
Fa
cto
r
Weighted
Points
Pe
rfo
rma
nc
e I
nd
ex
(Cri
teri
a) Group Points
Gro
up
Pe
rfo
rma
nc
e
Ind
ex
Gro
up
We
igh
t
To
tal
Pe
rfo
rma
nc
e
Ind
ex
Ma
in C
rite
ria
Gro
up
Cri
teri
a G
rou
p
No. Criteria
60.2 Local stores 10,0 10
60.3 Parks and open areas 20,0 20
60.4 Education 10,0 10
60.5 Public offices 7,0 10
60.6 Medical care 10,0 10
60.7 Sports facilities 10,0 10
60.8 Leisure 10,0 10
60.9 Service providers 10,0 10
61Connections to utilities 70,0 100 7,00 10 2 14,00 20 70,0%
61.1 Networked energy 12,0 25
61.2 Solar energy 25,0 25
61.3 Broadband connection 8,0 25
61.4 Rainwater seepage 25,0 25
Total Performance
IndexMedals Grade
≥80% GOLD 1,5
65-79,9% SILVER 2,0
50-64,9% BRONZE 3,0
* = Except Site Quality
min. 50% (bronze)
Nominal Performance
Index in Evaluation
Aeras*
Sit
e q
ua
lity
min. 35%
min. 65% (silver)
86,90 130,00 66,8% 0,0%
18/06/2013 Page]/Pages]

Assesment matrix NOA10
Legend:evaluation points to be entered
checklist points to be entered
fixed value
will be automatically calculated
cell without content
achieved
(criteria)
achieved
(indicators)
max.
possibleachieved
max.
possibleachieved
max.
possibleachieved
max.
possible
1 Global warming potential
(GWP) 0,00 10 0,00 10 3 0,00 30 0,0%
2 Ozone depletion potential
(ODP) 10,00 10 10,00 10 1 10,00 10 100,0%
3 Photochemical ozone
creation potential (POCP) 10,00 10 10,00 10 1 10,00 10 100,0%
4 Acidification potential (AP)
10,00 10 10,00 10 1 10,00 10 100,0%
5 Eutrophication potential (EP)
10,00 10 10,00 10 1 10,00 10 100,0%
6 Local environmental impact
0,00 10 0,00 10 3 0,00 30 0,0%
8 Sustainable use of
resources / wood 0,00 10 0,00 10 1 0,00 10 0,0%
10 Nonrenewable primary
energy demand (Pnren) 0,00 10 0,00 10 3 0,00 30 0,0%
11 Total primary energy
demand and proportion of
renewable primary energy 0,00 10 0,00 10 2 0,00 20 0,0%
11.1
Total primary energy
demand 0,00 10
11.2
Proportion of renewable
primary energy 0,00 5
14 Drinking water demand and
wastewater volume 3,50 10 3,50 10 2 7,00 20 35,0%
15 Land use
10,00 10 10,00 10 2 20,00 20 100,0%
Life c
ycle
costs
16Building-related life-cycle
costs2,00 10 2,00 10 3 6,00 30 20,0%
17 Suitability for third-party use
57,5 100 5,75 10 2 11,50 20 57,5%
17.1
Space efficiency
30,0 30
17.2
Suitability for conversion
27,5 50
17.3
Possibility of modification for
other types of use 0,0 20
18Thermal comfort in the
winter100,0 100 10,00 10 2 20,00 20 100,0%
18.1 Operative temperature 70,0 70
18.2 Drafts 10,0 10
18.3
Radiant temperature
asymmetry and floor
temperature
10,0 10
18.4 Relative humidity 10,0 10
19Thermal comfort in the
summer100,0 100 10,00 10 3 30,00 30 100,0%
19.1 Operative Temperatur 70,0 70
19.2 Drafts 10,0 10
19.3
Radiant temperature
asymmetry and floor
temperature
10,0 10
19.4 Relative humidity 10,0 10
Assesment matrix of the DGNB International Certification System / Occupancy Profile New Office and Administrative Buildings, Version 2010© Copyright 2010 German Sustainable Building Council (DGNB)
Project No.
Project Name
Auditor
Indicators
Score
checklist points / evaluation pointsCrieria points
Re
lev
an
ce
Fa
cto
r
Weighted
Points
Pe
rfo
rma
nc
e I
nd
ex
(Cri
teri
a) Group Points
Gro
up
Pe
rfo
rma
nc
e
Ind
ex
Gro
up
We
igh
t
To
tal
Pe
rfo
rma
nc
e
Ind
ex
Ma
in C
rite
ria
Gro
up
Cri
teri
a G
rou
p
No. Criteria
Ec
olo
gic
al
qu
ali
ty
Life c
ycle
assessm
ent
67,00 200,00 33,5%
Effects
on the
glo
bal and local
environm
ent
41,8%
Resourc
e c
onsum
ption a
nd w
aste
genera
tion
10,0%
Ec
on
om
ic q
ua
lity
17,50 50,00 35,0% 65,0%
Econom
ic d
evelo
pm
ent
So
cio
cu
ltu
ral
an
d f
un
cti
on
al
qu
ali
ty
Health, com
fort
, and u
ser
satisfa
ction
182,83 280,00 65,3% 10,0%
Anexo E.2: Puntuación según hipótesis propuesta (Promoter y destino)
18/06/2013 Page]/Pages]
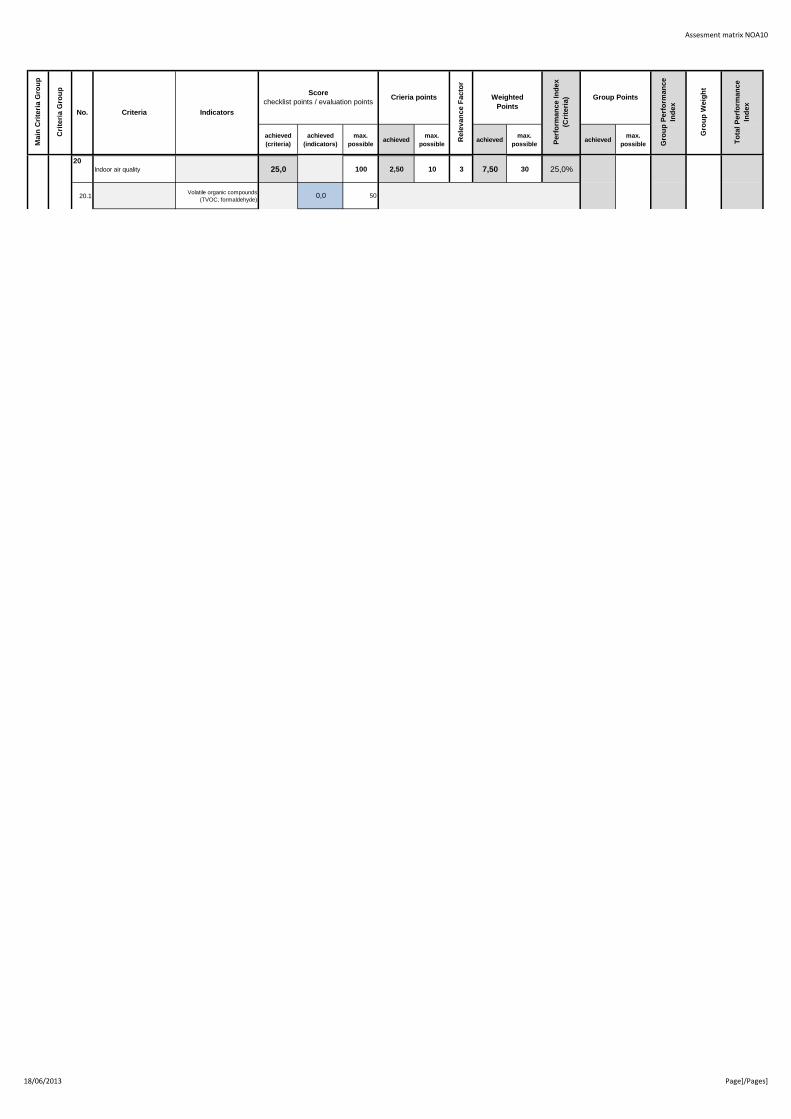
Assesment matrix NOA10
achieved
(criteria)
achieved
(indicators)
max.
possibleachieved
max.
possibleachieved
max.
possibleachieved
max.
possible
Indicators
Score
checklist points / evaluation pointsCrieria points
Re
lev
an
ce
Fa
cto
r
Weighted
Points
Pe
rfo
rma
nc
e I
nd
ex
(Cri
teri
a) Group Points
Gro
up
Pe
rfo
rma
nc
e
Ind
ex
Gro
up
We
igh
t
To
tal
Pe
rfo
rma
nc
e
Ind
ex
Ma
in C
rite
ria
Gro
up
Cri
teri
a G
rou
p
No. Criteria
Ec
olo
gic
al
qu
ali
ty
Life c
ycle
assessm
ent
67,00 200,00 33,5% 41,8%10,0%20Indoor air quality 25,0 100 2,50 10 3 7,50 30 25,0%
20.1Volatile organic compounds
(TVOC, formaldehyde)0,0 50
41,8%
So
cio
cu
ltu
ral
an
d f
un
cti
on
al
qu
ali
ty
Health, com
fort
, and u
ser
satisfa
ction
182,83 280,00 65,3% 10,0%
18/06/2013 Page]/Pages]

Assesment matrix NOA10
achieved
(criteria)
achieved
(indicators)
max.
possibleachieved
max.
possibleachieved
max.
possibleachieved
max.
possible
Indicators
Score
checklist points / evaluation pointsCrieria points
Re
lev
an
ce
Fa
cto
r
Weighted
Points
Pe
rfo
rma
nc
e I
nd
ex
(Cri
teri
a) Group Points
Gro
up
Pe
rfo
rma
nc
e
Ind
ex
Gro
up
We
igh
t
To
tal
Pe
rfo
rma
nc
e
Ind
ex
Ma
in C
rite
ria
Gro
up
Cri
teri
a G
rou
p
No. Criteria
Ec
olo
gic
al
qu
ali
ty
Life c
ycle
assessm
ent
67,00 200,00 33,5% 41,8%10,0%20.4
Occupancy-based ventilation
rate25,0 50
21Acoustic comfort 75,0 100 (125) 5,00 10 1 5,00 10 50,0%
21.1
Individual offices and multi-
person offices with
areas of up to 40 m²
25,0 35
21.2 Multi-person offices 15,0 35
21.3 Conference rooms 35,0 35
21.4Cafeterias with an area of > 50
m²0,0 20
22Visual comfort 70,0 100 6,88 10 3 20,64 30 68,8%
22.1Availability of daylight
throughout the building0,0 16
22.2Availability of daylight in
permanently used work areas0,0 14
22.3 Views to the outside 14,0 14
22.4 Glare prevention in daylight 14,0 14
22.5 Preventing glare in artificial light 14,0 14
22.6Light distribution in artificial
lighting conditions14,0 14
22.7 Color rendering 14,0 14
23User influence on building
operation54,0 100 5,40 10 2 10,80 20 54,0%
23.1 Ventilation 14,0 14
23.2 Shading 0,0 14
23.3 Glare protection 0,0 14
23.4Temperatures during the
heating period14,0 14
23.5Temperatures outside of the
heating period14,0 14
23.6Control of daylight and artificial
light0,0 14
23.7 Ease of use 12,0 16
24Quality of outdoor spaces 90,0 100 9,17 10 1 9,17 10 91,7%
24.1Quantitative evaluation
50,0 50
24.1.1 Roof area 20,0 20
24.1.2Façade-integrated outdoor
areas10,0 10
24.1.3Building-integrated outdoor
areas10,0 10
24.1.4Special areas around the
ground floor10,0 10
24.2Qualitative evaluation
40,0 50
24.2.1 Design concept 10,0 10
24.2.2 Roof plants 5,0 5
24.2.3 Maintenance contract 5,0 5
24.2.4 Roof area orientation 5,0 5
41,8%
So
cio
cu
ltu
ral
an
d f
un
cti
on
al
qu
ali
ty
Health, com
fort
, and u
ser
satisfa
ction
182,83 280,00 65,3% 10,0%
18/06/2013 Page]/Pages]

Assesment matrix NOA10
achieved
(criteria)
achieved
(indicators)
max.
possibleachieved
max.
possibleachieved
max.
possibleachieved
max.
possible
Indicators
Score
checklist points / evaluation pointsCrieria points
Re
lev
an
ce
Fa
cto
r
Weighted
Points
Pe
rfo
rma
nc
e I
nd
ex
(Cri
teri
a) Group Points
Gro
up
Pe
rfo
rma
nc
e
Ind
ex
Gro
up
We
igh
t
To
tal
Pe
rfo
rma
nc
e
Ind
ex
Ma
in C
rite
ria
Gro
up
Cri
teri
a G
rou
p
No. Criteria
Ec
olo
gic
al
qu
ali
ty
Life c
ycle
assessm
ent
67,00 200,00 33,5% 41,8%10,0%24.2.5 Socio-cultural use 5,0 5
24.2.6 Outdoor surface design 5,0 5
41,8%
So
cio
cu
ltu
ral
an
d f
un
cti
on
al
qu
ali
ty
Health, com
fort
, and u
ser
satisfa
ction
182,83 280,00 65,3% 10,0%
18/06/2013 Page]/Pages]

Assesment matrix NOA10
achieved
(criteria)
achieved
(indicators)
max.
possibleachieved
max.
possibleachieved
max.
possibleachieved
max.
possible
Indicators
Score
checklist points / evaluation pointsCrieria points
Re
lev
an
ce
Fa
cto
r
Weighted
Points
Pe
rfo
rma
nc
e I
nd
ex
(Cri
teri
a) Group Points
Gro
up
Pe
rfo
rma
nc
e
Ind
ex
Gro
up
We
igh
t
To
tal
Pe
rfo
rma
nc
e
Ind
ex
Ma
in C
rite
ria
Gro
up
Cri
teri
a G
rou
p
No. Criteria
Ec
olo
gic
al
qu
ali
ty
Life c
ycle
assessm
ent
67,00 200,00 33,5% 41,8%10,0%24.2.7 Features 5,0 15
25Safety and security 88,0 100 8,80 10 1 8,80 10 88,0%
25.1Subjective perception of safety
and protection against assault38,0 50
25.2Reduction of damage should an
accident occur50,0 50
26Handicapped accessibility 10,00 10 10,00 10 2 20,00 20 100,0%
27Efficient use of floor area 100,0 100 10,00 10 1 10,00 10 100,0%
28Suitability for conversion 60,0 100 6,00 10 2 12,00 20 60,0%
28.1 Building modularity 0,0 10
28.2.1Spatial structure:
conversion15,0 15
28.2.2Spatial structure:
temporarily storing15,0 15
28.3.1Power and media supply:
power and media conduits10,0 10
28.3.2
Power and media supply:
capacity of the supply
shafts and ductwork
10,0 10
28.3.3Power and media supply:
BUS system10,0 10
28.4.1
Flexibility of the dist. netw. and
connections for heating, water
supply and removal
0,0 10
28.4.2
Flexibility of the dist. netw. and
connections for water supply
and removal
0,0 10
28.4.3
Flexibility of the dist. netw. and
connections for ventilation and
AC
0,0 10
29Public access 84,0 100 8,46 10 2 16,92 20 84,6%
29.1General public access to the
building16,0 16
29.2External facilities open to the
public16,0 16
29.3
Opening interior facilities
(libraries or cafeterias) to
the public
16,0 16
29.4Possibility for third parties to
rent rooms in the building0,0 16
29.5
Variety of uses for areas inside
the building that are accessible
to the public
36,0 36
30Cycling convenience 0,0 100 0,00 10 1 0,00 10 0,0%
30.1 Qualitative evaluation 0,0 50
30.2 Quantitative evaluation 0,0 50
31Design and urban planning
quality through competition40,0 100 4,00 10 3 12,00 30 40,0%
31.1.1Implementation of planning
competitions20,0 20
31.1.2 Competition process 20,0 40
31.1.3Implementation of a prize-
winning design0,0 30
31.1.4 Contracting of planning team 0,0 10
31.2 OR: Architectural prize 0,0 100
32Integration of public art 110,0 100 0,00 10 1 0,00 10 0,0%
32.1 Minimum requirement 10,0 10
41,8%
Functionalit
y
So
cio
cu
ltu
ral
an
d f
un
cti
on
al
qu
ali
ty
Health, com
fort
, and u
ser
satisfa
ction
182,83 280,00 65,3% 10,0%
Aesth
etic q
ualit
y
18/06/2013 Page]/Pages]
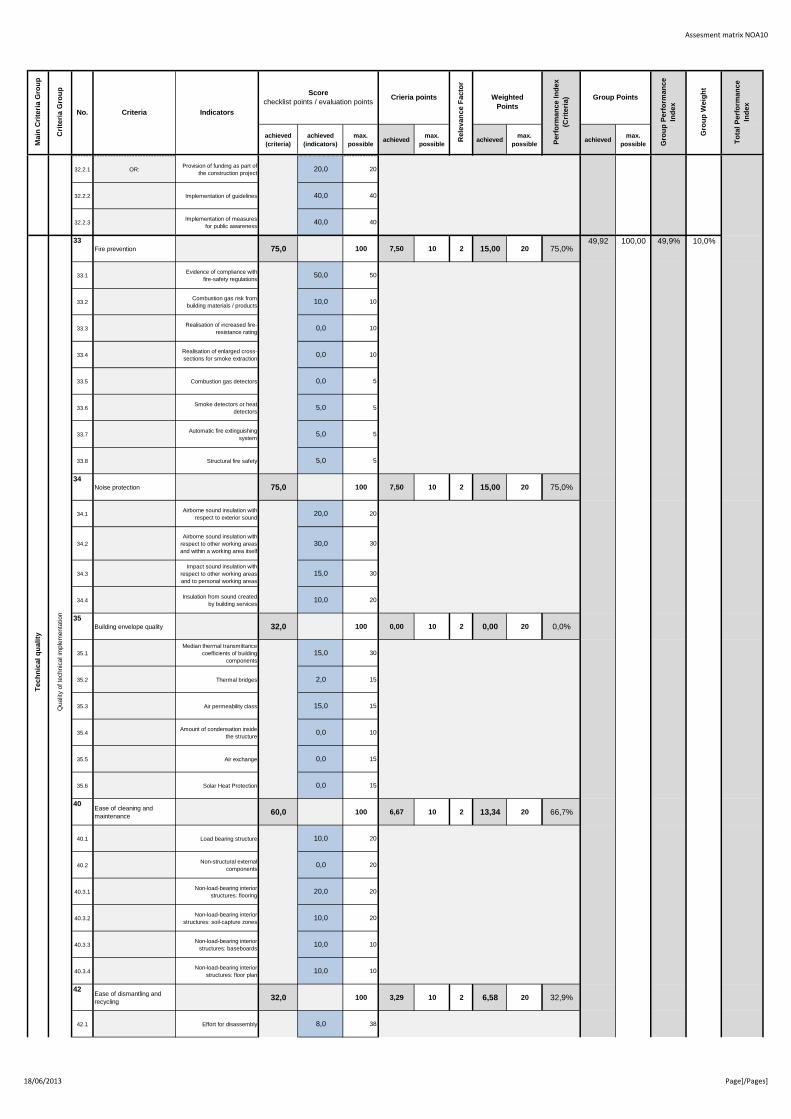
Assesment matrix NOA10
achieved
(criteria)
achieved
(indicators)
max.
possibleachieved
max.
possibleachieved
max.
possibleachieved
max.
possible
Indicators
Score
checklist points / evaluation pointsCrieria points
Re
lev
an
ce
Fa
cto
r
Weighted
Points
Pe
rfo
rma
nc
e I
nd
ex
(Cri
teri
a) Group Points
Gro
up
Pe
rfo
rma
nc
e
Ind
ex
Gro
up
We
igh
t
To
tal
Pe
rfo
rma
nc
e
Ind
ex
Ma
in C
rite
ria
Gro
up
Cri
teri
a G
rou
p
No. Criteria
Ec
olo
gic
al
qu
ali
ty
Life c
ycle
assessm
ent
67,00 200,00 33,5% 41,8%10,0%32.2.1 OR:
Provision of funding as part of
the construction project20,0 20
32.2.2 Implementation of guidelines 40,0 40
32.2.3Implementation of measures
for public awareness40,0 40
33Fire prevention 75,0 100 7,50 10 2 15,00 20 75,0%
33.1Evidence of compliance with
fire-safety regulations50,0 50
33.2Combustion gas risk from
building materials / products10,0 10
33.3Realisation of increased fire-
resistance rating0,0 10
33.4Realisation of enlarged cross-
sections for smoke extraction0,0 10
33.5 Combustion gas detectors 0,0 5
33.6Smoke detectors or heat
detectors5,0 5
33.7Automatic fire extinguishing
system5,0 5
33.8 Structural fire safety 5,0 5
34Noise protection 75,0 100 7,50 10 2 15,00 20 75,0%
34.1Airborne sound insulation with
respect to exterior sound20,0 20
34.2
Airborne sound insulation with
respect to other working areas
and within a working area itself
30,0 30
34.3
Impact sound insulation with
respect to other working areas
and to personal working areas
15,0 30
34.4Insulation from sound created
by building services10,0 20
35Building envelope quality 32,0 100 0,00 10 2 0,00 20 0,0%
35.1
Median thermal transmittance
coefficients of building
components
15,0 30
35.2 Thermal bridges 2,0 15
35.3 Air permeability class 15,0 15
35.4Amount of condensation inside
the structure0,0 10
35.5 Air exchange 0,0 15
35.6 Solar Heat Protection 0,0 15
40Ease of cleaning and
maintenance60,0 100 6,67 10 2 13,34 20 66,7%
40.1 Load bearing structure 10,0 20
40.2Non-structural external
components0,0 20
40.3.1Non-load-bearing interior
structures: flooring20,0 20
40.3.2Non-load-bearing interior
structures: soil-capture zones10,0 20
40.3.3Non-load-bearing interior
structures: baseboards10,0 10
40.3.4Non-load-bearing interior
structures: floor plan10,0 10
42Ease of dismantling and
recycling32,0 100 3,29 10 2 6,58 20 32,9%
42.1 Effort for disassembly 8,0 38
41,8%
So
cio
cu
ltu
ral
an
d f
un
cti
on
al
qu
ali
ty
182,83 280,00 65,3% 10,0%
Te
ch
nic
al
qu
ali
ty
Qualit
y o
f te
chnic
al im
ple
menta
tion
49,92 100,00 49,9% 10,0%
Aesth
etic q
ualit
y
18/06/2013 Page]/Pages]

Assesment matrix NOA10
achieved
(criteria)
achieved
(indicators)
max.
possibleachieved
max.
possibleachieved
max.
possibleachieved
max.
possible
Indicators
Score
checklist points / evaluation pointsCrieria points
Re
lev
an
ce
Fa
cto
r
Weighted
Points
Pe
rfo
rma
nc
e I
nd
ex
(Cri
teri
a) Group Points
Gro
up
Pe
rfo
rma
nc
e
Ind
ex
Gro
up
We
igh
t
To
tal
Pe
rfo
rma
nc
e
Ind
ex
Ma
in C
rite
ria
Gro
up
Cri
teri
a G
rou
p
No. Criteria
Ec
olo
gic
al
qu
ali
ty
Life c
ycle
assessm
ent
67,00 200,00 33,5% 41,8%10,0%42.2 Effort for sorting 24,0 38
42.3 Recycling / disposal concept 0,0 24
43Comprehensive project
definition86,0 100 8,16 10 3 24,48 30 81,6%
43.1 Demand planning 25,0 25
43.2 Agreement on objectives 18,0 25
43.3 Architectural competition 25,0 25
43.4
Influence on energy
consumption for user and
utilization needs
18,0 25
44Integrated planning 60,0 100 4,00 10 3 12,00 30 40,0%
44.1 Integral planning team 20,0 20
44.2 Qualification of planning team 20,0 20
44.3 Integral planning process 0,0 20
44.4 Participation of users 20,0 20
44.5 Public participation 0,0 20
45Comprehensive building
design82,5 100 7,81 10 3 23,43 30 78,1%
45.1 H&S (Health and Safety) plan 10,0 10
45.2 Energy concept 10,0 10
45.3 Water concept 5,0 10
45.4Optimization of daylight and
artificial lighting7,5 10
45.5 Waste concept 10,0 10
45.6 Measurement concept 10,0 10
45.7Concept for conversion,
dismantling, and recycling0,0 10
45.8Concept for ease of cleaning
and maintenance10,0 10
45.9Independent third-party review
of planning documents10,0 10
45.10Execution of variant
comparisons10,0 10
46Sustainability aspects in
tender phase100,0 100 10,00 10 2 20,00 20 100,0%
46.1Integration of sustainability
aspects in call for tenders50,0 50
46.2Integration of sustainability
aspects in the selection of firms50,0 50
47Documentation for Facility
Management100,0 100 10,00 10 2 20,00 20 100,0%
47.1
Compilation of project
documentation/energy
performance certificate
25,0 25
47.2
Instructions for servicing,
inspection, operation,
and care
25,0 25
47.3
Adaptation of plans,
verifications, and calculations
for the finished building
25,0 25
47.4 Compilation of a user manual 25,0 25
48 Environmental impact of
construction site /
construction process
75,0 100 6,71 10 2 13,42 20 67,1%
41,8%
Te
ch
nic
al
qu
ali
ty
Qualit
y o
f te
chnic
al im
ple
menta
tion
49,92 100,00 49,9% 10,0%
Pro
ce
ss
qu
ali
ty
Qualit
y o
f pla
nnin
g
193,33 230,00 84,1% 5,0%
18/06/2013 Page]/Pages]

Assesment matrix NOA10
achieved
(criteria)
achieved
(indicators)
max.
possibleachieved
max.
possibleachieved
max.
possibleachieved
max.
possible
Indicators
Score
checklist points / evaluation pointsCrieria points
Re
lev
an
ce
Fa
cto
r
Weighted
Points
Pe
rfo
rma
nc
e I
nd
ex
(Cri
teri
a) Group Points
Gro
up
Pe
rfo
rma
nc
e
Ind
ex
Gro
up
We
igh
t
To
tal
Pe
rfo
rma
nc
e
Ind
ex
Ma
in C
rite
ria
Gro
up
Cri
teri
a G
rou
p
No. Criteria
Ec
olo
gic
al
qu
ali
ty
Life c
ycle
assessm
ent
67,00 200,00 33,5% 41,8%10,0%48.1 Low-waste construction site 25,0 25
48.2 Low-noise construction site 25,0 25
48.3 Low-dust construction site 0,0 25
48.4
Environmental protection at the
construction site
(soil protection)
25,0 25
49Prequalification of
contractors10,00 10 10,00 10 2 20,00 20 100,0%
50Construction quality
assurance100,0 100 10,00 10 3 30,00 30 100,0%
50.1
Documentation of materials,
auxiliary materials
and safety data sheets
50,0 50
50.2Measurements for quality
control50,0 50
51Systematic commissioning 10,00 10 10,00 10 3 30,00 30 100,0%
Site evaluation: accounted for separately; does not affect a building’s overall appraisal
56Site location risks 75,0 100 0,00 10 2 0,00 20 0,0%
56.1.1 Wildfire hazard 3,0 5
56.1.2Length of dry spell affecting
forest fires5,0 5
56.2.1Dry spell length affecting
drought potential4,0 5
56.2.2Precipitation deficit as drought
potential indicator4,0 5
56.3 Landslide Hazard 0,0 10
56.4 Tsunami/storm surge 10,0 10
56.5.1 Flood recurrence 2,0 5
56.5.2 Precipitation affecting floods 5,0 5
56.6 Earthquakes 7,0 10
56.7 Extreme temperature 10,0 10
56.8 Avalanches 10,0 10
56.9 Volcanic eruptions 10,0 10
56.10 Storm 5,0 10
57Site location conditions 51,5 100 5,15 10 2 10,30 20 51,5%
57.1 Outdoor air quality 2,0 16
57.2 Outdoor noise 12,0 20
57.3 Soil and building plot 0,0 16
57.4 Electromagnetic fields 12,0 16
57.5Appearance of the city and
landscape / visualrelationships9,5 16
57.6 Radon contamination 16,0 16
58Public image and social
conditions93,0 100 9,30 10 2 18,60 20 93,0%
58.1 Public Image, attractiveness 25,0 25
41,8%
Pro
ce
ss
qu
ali
ty
Qualit
y o
f pla
nnin
g
193,33 230,00 84,1% 5,0%
Qualit
y o
f constr
uction
86,90 130,00 66,8% 0,0%
Sit
e q
ua
lity
18/06/2013 Page]/Pages]
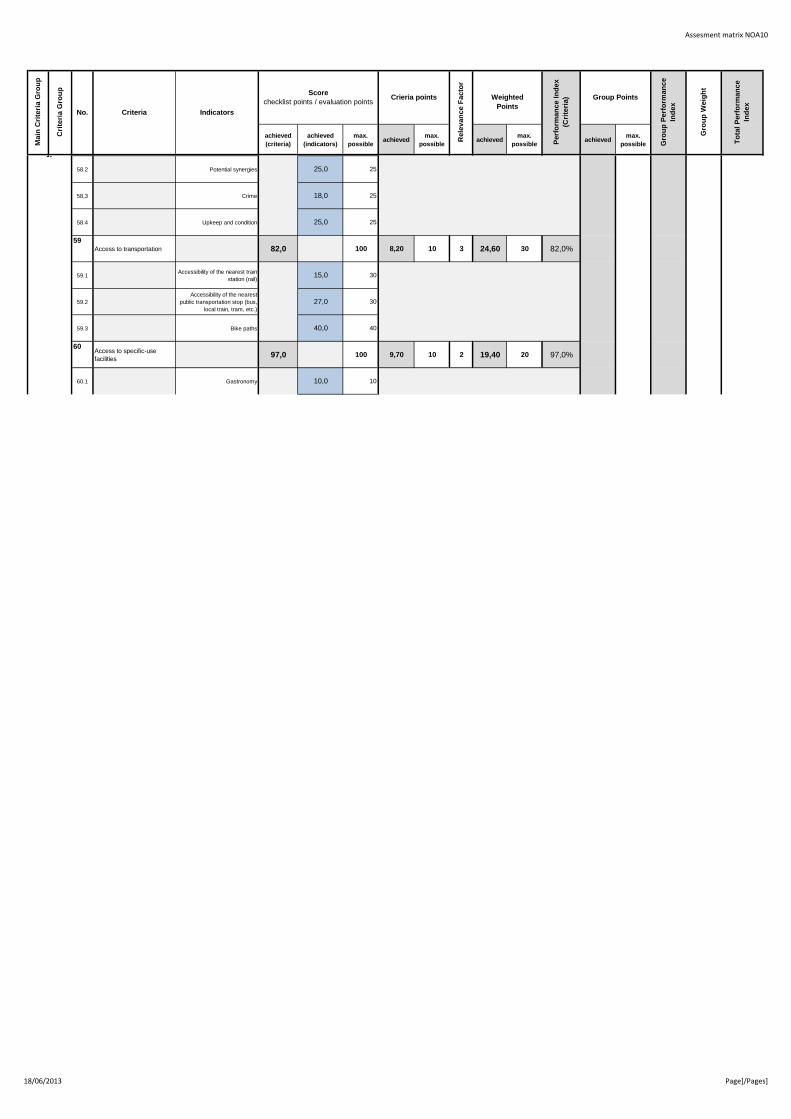
Assesment matrix NOA10
achieved
(criteria)
achieved
(indicators)
max.
possibleachieved
max.
possibleachieved
max.
possibleachieved
max.
possible
Indicators
Score
checklist points / evaluation pointsCrieria points
Re
lev
an
ce
Fa
cto
r
Weighted
Points
Pe
rfo
rma
nc
e I
nd
ex
(Cri
teri
a) Group Points
Gro
up
Pe
rfo
rma
nc
e
Ind
ex
Gro
up
We
igh
t
To
tal
Pe
rfo
rma
nc
e
Ind
ex
Ma
in C
rite
ria
Gro
up
Cri
teri
a G
rou
p
No. Criteria
Ec
olo
gic
al
qu
ali
ty
Life c
ycle
assessm
ent
67,00 200,00 33,5% 41,8%10,0%58.2 Potential synergies 25,0 25
58,3 Crime 18,0 25
58.4 Upkeep and condition 25,0 25
59Access to transportation 82,0 100 8,20 10 3 24,60 30 82,0%
59.1Accessibility of the nearest train
station (rail)15,0 30
59.2
Accessibility of the nearest
public transportation stop (bus,
local train, tram, etc.)
27,0 30
59.3 Bike paths 40,0 40
60Access to specific-use
facilities97,0 100 9,70 10 2 19,40 20 97,0%
60.1 Gastronomy 10,0 10
86,90 130,00 66,8% 0,0%
Sit
e q
ua
lity
18/06/2013 Page]/Pages]

Assesment matrix NOA10
achieved
(criteria)
achieved
(indicators)
max.
possibleachieved
max.
possibleachieved
max.
possibleachieved
max.
possible
Indicators
Score
checklist points / evaluation pointsCrieria points
Re
lev
an
ce
Fa
cto
r
Weighted
Points
Pe
rfo
rma
nc
e I
nd
ex
(Cri
teri
a) Group Points
Gro
up
Pe
rfo
rma
nc
e
Ind
ex
Gro
up
We
igh
t
To
tal
Pe
rfo
rma
nc
e
Ind
ex
Ma
in C
rite
ria
Gro
up
Cri
teri
a G
rou
p
No. Criteria
Ec
olo
gic
al
qu
ali
ty
Life c
ycle
assessm
ent
67,00 200,00 33,5% 41,8%10,0%60.2 Local stores 10,0 10
60.3 Parks and open areas 20,0 20
60.4 Education 10,0 10
60.5 Public offices 7,0 10
60.6 Medical care 10,0 10
60.7 Sports facilities 10,0 10
60.8 Leisure 10,0 10
60.9 Service providers 10,0 10
61Connections to utilities 70,0 100 7,00 10 2 14,00 20 70,0%
61.1 Networked energy 12,0 25
61.2 Solar energy 25,0 25
61.3 Broadband connection 8,0 25
61.4 Rainwater seepage 25,0 25
Total Performance
IndexMedals Grade
≥80% GOLD 1,5
65-79,9% SILVER 2,0
50-64,9% BRONZE 3,0
* = Except Site Quality
min. 35%
min. 65% (silver)
86,90 130,00 66,8% 0,0%
min. 50% (bronze)
Nominal Performance
Index in Evaluation
Aeras*
Sit
e q
ua
lity
18/06/2013 Page]/Pages]