
Arch. Min. Sci. 63 (2018), 3, 783-796
14
Arch. Min. Sci. 63 (2018), 3, 783-796 Electronic version (in color) of this paper is available: http://mining.archives.pl DOI 10.24425/123697 MOHAMMADREZA NIKZAD* # , AHMAD ASADI**, DARYOUSH KAVEH AHANGARAN**, AMIR BIJAN YASREBI***, ANDY WETHERELT****, PEYMAN AFZAL** BLAST FRAGMENTATION CLASSIFICATION USING NUMBER-SIZE (N-S) FRACTAL MODEL IN JALAL-ABAD IRON MINE KLASYFIKACJA WYMIARÓW FRAGMENTÓW SKAŁ POWSTAŁYCH W TRAKCIE PRAC STRZAŁOWYCH W KOPALNI RUD ŻELAZA JALAL-ABAD W OPARCIU O MODEL FRAKTALNY N-S (NUMBER-SIZE) One of the main purpose of accurate blasting in open pit mining is to achieve optimum rock frag- mentation. The degree of rock fragmentation plays a significant role in order to control and minimise the overall production cost including loading, hauling and crushing. In the present paper, the application of a Number-Size (N-S) fractal model is intended to classify the blast fragmentation size in the Jalal-Abad iron mine, SW Iran, using GoldSize image analysis software for four blasting with the obtained result being compared with Kuz-Ram curves. To do this, the fractal dimensions via N-S log-log plots were generated based on the output of the GoldSize software. The results indicated that the fragmented rocks have a multifractal nature with four/five different fragmented populations in terms of size namely; the fine rocks with the size of less than 16 cm, Mean-fragment values between 16 and 45 cm, In-range between 45 and 70 cm and finally, oversize larger than 70 cm. Keywords: Blasting, Fragmentation, Number-Size (N-S) fractal model, Jalal-Abad iron mine Jednym z głównych celów prowadzenia prac strzałowych w kopalniach odkrywkowych jest uzyska- nie fragmentów skał o optymalnych rozmiarach. Stopień rozkruszania skał jest kluczowym czynnikiem decydującym o całkowitych kosztach produkcji, obejmujących także koszty załadunku, odstawy urobku i rozdrobnienia. W pracy tej omówiono zastosowanie modelu fraktalnego N-S (Number-Size) do kla- syfikacji fragmentów skał uzyskanych w wyniku prowadzenia prac strzałowych w kopalni rud żelaza Jalal-Abad, w południowo-zachodnich rejonach Iranu. W analizach wykorzystano oprogramowanie do analizy obrazów GoldSize, wyniki uzyskane po czterech seriach prac strzałowych porównano następnie z wykresami Kuz-Ram. W tym celu na podstawie danych wyjściowych uzyskanych przy pomocy pakietu * YOUNG RESEARCHERS CLUB, SOUTH TEHRAN BRANCH, ISLAMIC AZAD UNIVERSITY, TEHRAN, IRAN ** DEPARTMENT OF MINING ENGINEERING, SOUTH TEHRAN BRANCH, ISLAMIC AZAD UNIVERSITY, TEHRAN, IRAN *** DEPARTMENT OF MINING AND METALLURGICAL ENGINEERING, AMIRKABIR UNIVERSITY OF TECHNOLOGY (TEHRAN POLYTECHNIC), TEHRAN, IRAN **** CAMBORNE SCHOOL OF MINES, UNIVERSITY OF EXETER, PENRYN, UK # Corresponding author: [email protected]
Transcript of Arch. Min. Sci. 63 (2018), 3, 783-796
Arch. Min. Sci. 63 (2018), 3, 783-796Electronic version (in color) of this paper is available: http://mining.archives.pl
DOI 10.24425/123697
MOHAMMADREZA NIKZAD*#, AHMAD ASADI**, DARYOUSH KAVEH AHANGARAN**, AMIR BIJAN YASREBI***, ANDY WETHERELT****, PEYMAN AFZAL**
BLAST FRAGMENTATION CLASSIFICATION USING NUMBER-SIZE (N-S) FRACTAL MODEL IN JALAL-ABAD IRON MINE
KLASYFIKACJA WYMIARÓW FRAGMENTÓW SKAŁ POWSTAŁYCH W TRAKCIE PRAC STRZAŁOWYCH W KOPALNI RUD ŻELAZA JALAL-ABAD
W OPARCIU O MODEL FRAKTALNY N-S (NUMBER-SIZE)
One of the main purpose of accurate blasting in open pit mining is to achieve optimum rock frag-mentation. The degree of rock fragmentation plays a significant role in order to control and minimise the overall production cost including loading, hauling and crushing. In the present paper, the application of a Number-Size (N-S) fractal model is intended to classify the blast fragmentation size in the Jalal-Abad iron mine, SW Iran, using GoldSize image analysis software for four blasting with the obtained result being compared with Kuz-Ram curves. To do this, the fractal dimensions via N-S log-log plots were generated based on the output of the GoldSize software. The results indicated that the fragmented rocks have a multifractal nature with four/five different fragmented populations in terms of size namely; the fine rocks with the size of less than 16 cm, Mean-fragment values between 16 and 45 cm, In-range between 45 and 70 cm and finally, oversize larger than 70 cm.
Keywords: Blasting, Fragmentation, Number-Size (N-S) fractal model, Jalal-Abad iron mine
Jednym z głównych celów prowadzenia prac strzałowych w kopalniach odkrywkowych jest uzyska-nie fragmentów skał o optymalnych rozmiarach. Stopień rozkruszania skał jest kluczowym czynnikiem decydującym o całkowitych kosztach produkcji, obejmujących także koszty załadunku, odstawy urobku i rozdrobnienia. W pracy tej omówiono zastosowanie modelu fraktalnego N-S (Number-Size) do kla-syfikacji fragmentów skał uzyskanych w wyniku prowadzenia prac strzałowych w kopalni rud żelaza Jalal-Abad, w południowo-zachodnich rejonach Iranu. W analizach wykorzystano oprogramowanie do analizy obrazów GoldSize, wyniki uzyskane po czterech seriach prac strzałowych porównano następnie z wykresami Kuz-Ram. W tym celu na podstawie danych wyjściowych uzyskanych przy pomocy pakietu
* YOUNG RESEARCHERS CLUB, SOUTH TEHRAN BRANCH, ISLAMIC AZAD UNIVERSITY, TEHRAN, IRAN** DEPARTMENT OF MINING ENGINEERING, SOUTH TEHRAN BRANCH, ISLAMIC AZAD UNIVERSITY, TEHRAN, IRAN*** DEPARTMENT OF MINING AND METALLURGICAL ENGINEERING, AMIRKABIR UNIVERSITY OF TECHNOLOGY
(TEHRAN POLYTECHNIC), TEHRAN, IRAN**** CAMBORNE SCHOOL OF MINES, UNIVERSITY OF EXETER, PENRYN, UK# Corresponding author: [email protected]
784
GoldSize wygenerowano wymiary fraktalne w oparciu o wykresy N-S w pełnej skali logarytmicznej. Otrzymane wyniki wskazują, że uzyskane fragmenty skalne miały charakter multi-fraktalny, obejmując cztery lub pięć populacji odłamków różniących się w kategorii rozmiarów: skały drobne o wymiarach poniżej 16 cm, odłamki o średniej wielkości: pomiędzy 16 a 45 cm, odłamki o rozmiarach w zakresie 45-70 cm i odłamki duże, o wymiarach powyżej 70 cm.
Słowa kluczowe: prace strzałowe, rozdrobnienie skał, model fraktalny N-S (Number-Size), kopalnia rud żelaza Jalal-Abad
1. Introduction
The main purpose of drilling and blasting is to break and prepare the fragmented rocks for crushing and transportation purposes. The degree of rock fragmentation plays an important role in order to control and minimise the total production cost involving loading, hauling, and crushing (Jiránková et al., 2010; Faramarzi et al., 2013; Karamia et al., 2012). The fragments produced by blasting should be small enough to be traversed easily through the sieve opening and also handled by transportation equipment efficiently. There are several formulas for predicting blasted rocks dimension such as the Kuznetsov equation, the Rosin-Rammler equation, Larsson’s equation, SveDeFo formula, etc., whose blasting parameters are considered to determine the size distribution of the blasted rock (Jimeno et al., 1995; Cunningham, 2005; Sanchidrian et al., 2009; Tosun et al., 2014). Furthermore, there are various techniques to evaluate the results of blasting for instance; sieving, digital processing of images, high speed photography, loading equipment productivity and boulder counting, etc. Despite several challenges regarding the digital image analysis technique, it is well received by the industry and can be utilised to determine the size distribution of the blasted rockpile (Girdner et al., 1996; Kemeny et al., 1999; Segarra et al., 2005).
Nowadays, the concepts of fractal/multifractal methodologies (introduced by Mandelbrot, 1983) have been increasingly applied in various fields of sciences especially in mine exploration and earth science because Euclidean geometry uses both the discrete and integer numbers which are not suitable for comprehensive interpretation of complex geometries that are found in nature. As a result, fractals/multifractal models are employed in various branches of the earth sciences such as geophysics and geochemistry to represent the relationship between the cumulative amounts of different variables within a deposit (Mandelbrot, 1983; Turcotte, 1986, 2002; Deng et al., 2011; Ag-terberg et al., 1993; Wang et al., 1993; Agterberg, 1995; Afzal et al., 2011; Xu, 2004). Log-log plots in fractal analysis are appropriate tools for the description and classification of data because threshold values can be identified as breakpoints within those plots (Yasrebi et al., 2013, 2014; Perfect, 1997).
In this paper, after evaluation of the blasting results in Jalal-Abad iron mine by GoldSize software, the output used to generate the necessary data for the N-S fractal model is conducted in order to classify the fragmented rocks from the blasted muckpile.
2. Jalal-Abad iron mine
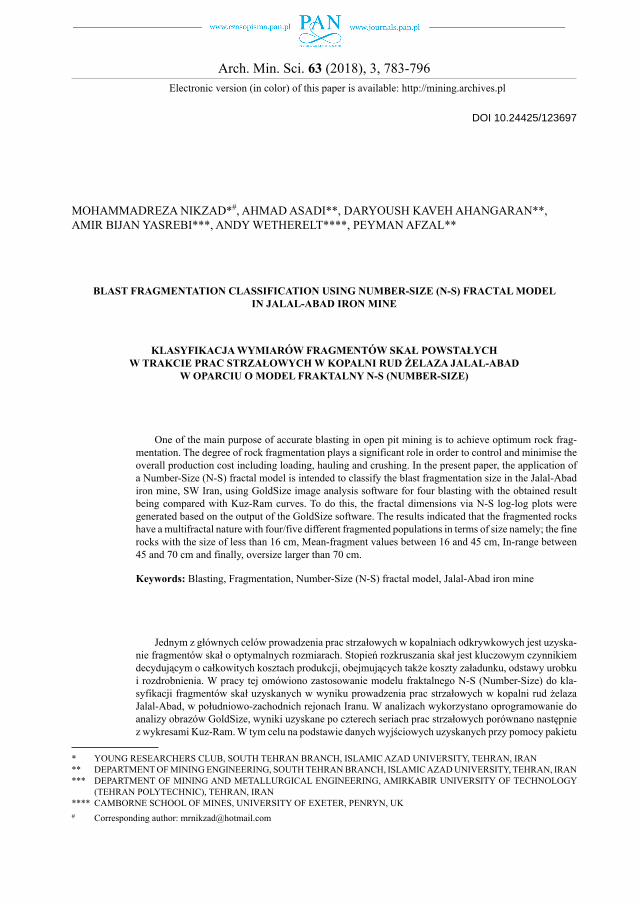
The Jalal-Abad iron mine is situated approximately 36km NW of Zarand (Fig. 1) with 200Mt of iron ore resources with an average grade of 38.5% and is one of the important iron deposits found in the Kerman Province of SE Iran (Badel, 2011).
The deposit has occurred within the intersection of the Urumia-Dokhtar magmatic zone and Sanandaj-Sirjan structural metamorphic zone. There are gabbro, diorite and diabasic rocks as
785
mass and dykes. Moreover, sedimentary rocks consisting of dolomitic limestone, siltstones and sandy-siltstones are present in the area. The main ores include magnetite and hematite which have been altered and formed to goethite and limonite in the central and NW parts of the area. In addition, there are sulfidic ore minerals especially pyrite and chalcopyrite.
3. Blasting in the mine
There is at least one blast every day carried out at the studied mine. The majority of waste rocks contain dolomite, shaly sandstone and limestone. The detailed monitoring of the production blasts is summarised in Table 1. Several problems arose during the investigation such as back break, high explosives and ground vibration. In addition, there were some large boulders after
Fig. 1. Location of Jalal-Abad iron ore mine in Iran
TABLE 1
Blasting parameters
Parameter Value UnitBench height 12 mSub-drilling 1.5 m
Spacing 4 to 4.5 mBurden 3 to 3.5 m
Weight of ANFO per hole 100 to 150 kgBlast hole diameter 165 mmStemming length 6.5 to 8.5 m
786
the blasts. ANFO is mixed with Pentaerythritol tetranitrate (PETN) and filled as column charge. Each hole also contains a base charge of between 0 to 12 kg of high explosive and is charged with a primed booster cartridge at the bottom of the hole with shock-tube for detonation.
4. Image analysing of blasts
In order to estimate the efficiency of the blasting operation, the evaluation for rock fragmen-tation of the blasted materials is considerably significant. For prediction and assessment of the blasting result, there are some direct and indirect equations and techniques. For example, a direct method would be sieve analysis and generally deemed as the most accurate technique for measur-ing the size distribution. This is not a practical method for such large scale blasting because it is costly and time consuming (Jimeno et al., 1995). Therefore, among the indirect methods, image analysis technique, as an observational, accessible and economical method is employed in this research. In this method, some photos are taken from the faces for further analysis to determine the blast fragmentation.
Digital image analysis softwares has become a common tool in mining and has been devel-oped during the last few past decades. Despite the existence of some errors associated with the digital image analysis, it permits quick and relatively good blast fragmentation size distribution assessment due to its greatest advantage which is that it does not interrupt the production cycle (Ozkahraman, 2006; Maerz et al., 1996; Enayatollahi et al., 2014). The accuracy of these image processing systems (GoldSize software in this scenario) varies between 2 to 20% so in some cases the edges of the blasted rocks should be traced one by one manually so as not to include some voids in the muckpile and mistake them for rocks (Sanchidrian et al., 2006; Tafazoli et al., 2009). Recently, the analysing technique has been used as a real-time monitoring method by installation cameras over belt conveyors or on top of the boom structure of mining shovels (Tafazoli et al., 2009).
5. Methodology
In this research, four blasts are studied and analysed. All of the blasting pattern specifications were gathered and saved in a database including rock mass description, blasting pattern size, drilling pattern, explosive weight and type, stemming length and bench height. Subsequently, specific charge and specific drilling were calculated which varied between 0.7 to 1 kg/m3 and 0.065 to 0.09 m/m3, respectively. A digital camera was used to take the images of the blasted muck.
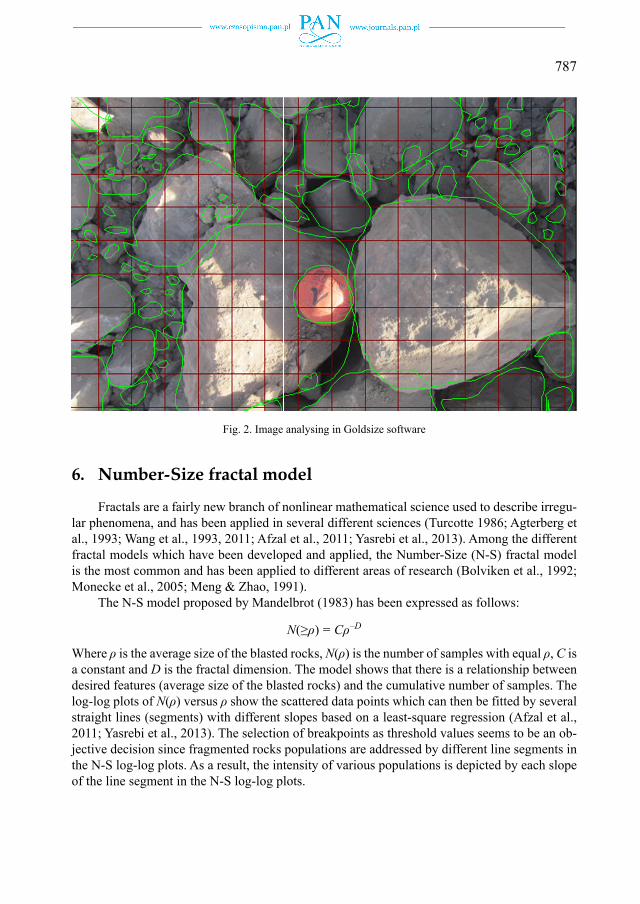
The faces’ photos regarding the blasted rocks have been used as input for GoldSize which was used to determine the fragmented rock distribution (Fig. 2). Double and single scaling objects were used in this investigation to prevent perspective errors. After each blast, 10 to 30 images were taken for analysis. It should be mentioned that manual tracing of the samples’ edges in each photo is time consuming in which more than 500 fragmented rocks are needed in each photo. Subsequently, N-S log-log plots were generated for delineation of the fragmented rocks’ popula-tions and used for separation of fine grains and boulders in the four separate blasts. Finally, the prediction fragmentation charts based on the Kuz-Ram method was introduced to correlate the results via the N-S fractal modelling.
787
Fig. 2. Image analysing in Goldsize software
6. Number-Size fractal model
Fractals are a fairly new branch of nonlinear mathematical science used to describe irregu-lar phenomena, and has been applied in several different sciences (Turcotte 1986; Agterberg et al., 1993; Wang et al., 1993, 2011; Afzal et al., 2011; Yasrebi et al., 2013). Among the different fractal models which have been developed and applied, the Number-Size (N-S) fractal model is the most common and has been applied to different areas of research (Bolviken et al., 1992; Monecke et al., 2005; Meng & Zhao, 1991).
The N-S model proposed by Mandelbrot (1983) has been expressed as follows:
N(≥ρ) = Cρ–D
Where ρ is the average size of the blasted rocks, N(ρ) is the number of samples with equal ρ, C is a constant and D is the fractal dimension. The model shows that there is a relationship between desired features (average size of the blasted rocks) and the cumulative number of samples. The log-log plots of N(ρ) versus ρ show the scattered data points which can then be fitted by several straight lines (segments) with different slopes based on a least-square regression (Afzal et al., 2011; Yasrebi et al., 2013). The selection of breakpoints as threshold values seems to be an ob-jective decision since fragmented rocks populations are addressed by different line segments in the N-S log-log plots. As a result, the intensity of various populations is depicted by each slope of the line segment in the N-S log-log plots.
788
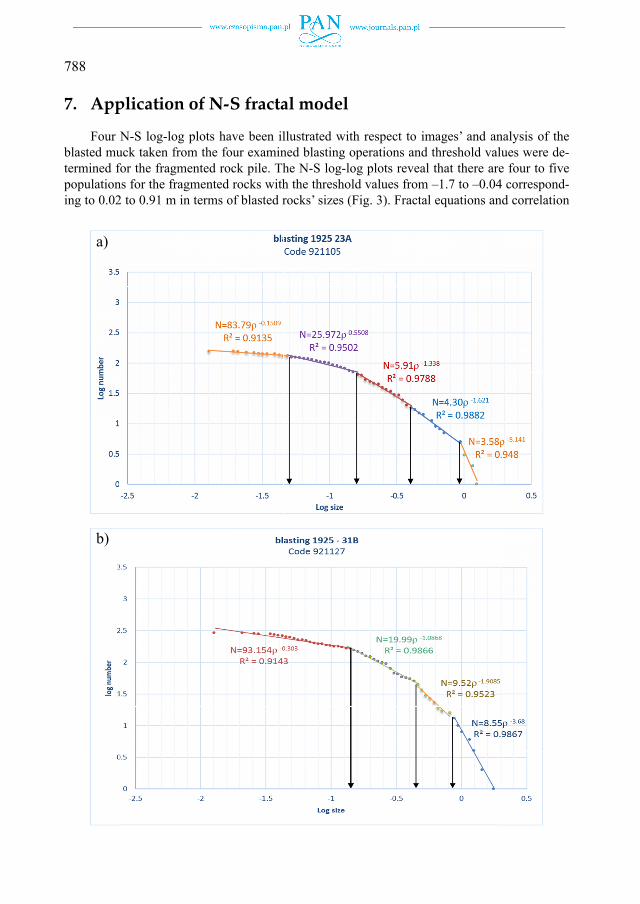
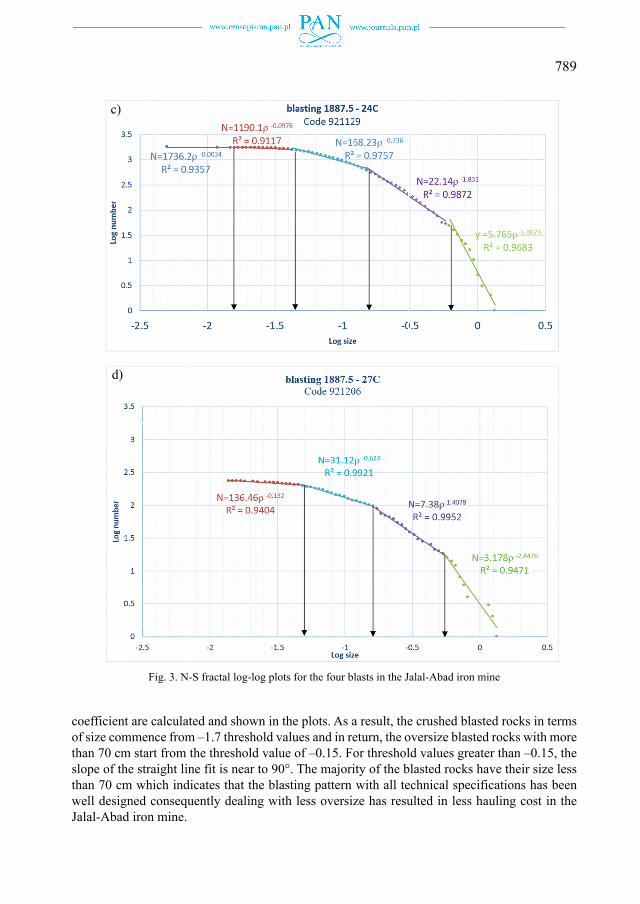
7. Application of N-S fractal model
Four N-S log-log plots have been illustrated with respect to images’ and analysis of the blasted muck taken from the four examined blasting operations and threshold values were de-termined for the fragmented rock pile. The N-S log-log plots reveal that there are four to five populations for the fragmented rocks with the threshold values from –1.7 to –0.04 correspond-ing to 0.02 to 0.91 m in terms of blasted rocks’ sizes (Fig. 3). Fractal equations and correlation
a)
b)
789
coefficient are calculated and shown in the plots. As a result, the crushed blasted rocks in terms of size commence from –1.7 threshold values and in return, the oversize blasted rocks with more than 70 cm start from the threshold value of –0.15. For threshold values greater than –0.15, the slope of the straight line fit is near to 90°. The majority of the blasted rocks have their size less than 70 cm which indicates that the blasting pattern with all technical specifications has been well designed consequently dealing with less oversize has resulted in less hauling cost in the Jalal-Abad iron mine.
c)
d)
Fig. 3. N-S fractal log-log plots for the four blasts in the Jalal-Abad iron mine
790
8. KUZ-RAM Model
The empirical prediction of expected fragmentation introduced by Kuznetsov is one the scenarios conducted by utilisation of the Kuz-Ram model which is applied via the Rosin-Rammler theory. This model was initially proposed by Kuznetsov (1973) which is an applicable description of the blasted rock fragmentation. Using this practice, one calculates a rock factor that explains the nature of the rock especially in terms of the fragmented rocks’ dimensions. As a result, this allows the size distribution to be calculated according to the Rosin-Rammler procedure. The empirical equation is as follows (Cunningham, 1983, 1987; Lathama et al., 2006):
190.8300.167 115VX Fr Q
Q E (1)
where X–, Fr, V, Q and E are mean particle size (cm), rock factors showed in Eq. (2), The rock
volume broken per blast hole [spacing × burden × bench height] (m3), mass of explosive in the hole (kg) and relative weight strength of explosive (ANFO = 100%, TNT = 115%) respec-tively.
Fr = 0.12BI (2)
Where BI is blasting index developed by Lily (1986) that is calculated by
BI = 0.5(RMD + JPS + JPO + SGI + HD) (3)
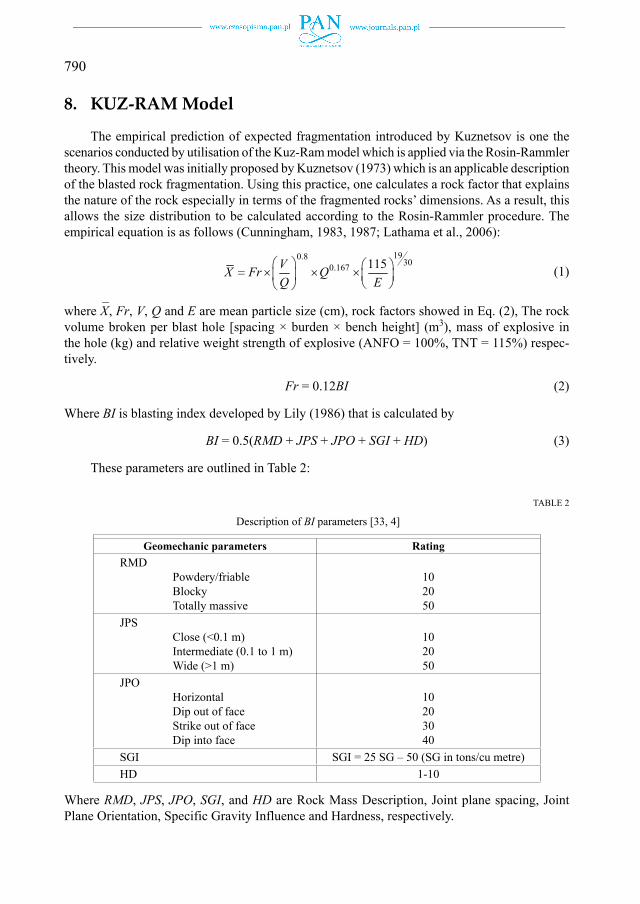
These parameters are outlined in Table 2:
TABLE 2
Description of BI parameters [33, 4]
Geomechanic parameters RatingRMD
Powdery/friableBlockyTotally massive
102050
JPSClose (<0.1 m)Intermediate (0.1 to 1 m)Wide (>1 m)
102050
JPOHorizontalDip out of faceStrike out of faceDip into face
10203040
SGI SGI = 25 SG – 50 (SG in tons/cu metre)HD 1-10
Where RMD, JPS, JPO, SGI, and HD are Rock Mass Description, Joint plane spacing, Joint Plane Orientation, Specific Gravity Influence and Hardness, respectively.
791
The Rosin-Rammler equation can be shown as follows (Rosin & Rammler, 1933):
( ) 1X nXcR X e (4)
Where R(X) is mass fraction retained on screen opening x; X and Xc are screen size and charac-teristic size, respectively and n is uniformity index, usually between 0.7 and 2 as follows:
0.112.2 14 1 0.1
2
S Lb LcB W LBn PD B L H
(5)
Where B, S, D, W, L, Lb, Lc and H are burden, spacing, hole’s diameter, standard deviation of drilling precision, charge length, bottom charge length, column charge length, bench height respectively. Moreover, P is 1 and 1.1 for square pattern and staggered pattern respectively (Cunningham, 1983). As the Kuznetsov equation calculates the average fragment size (Jimeno et al., 1995), R(x) is equal to 0.5 in equation (4) so Xc will be calculated as:
1
(0.693)c
n
XX (6)
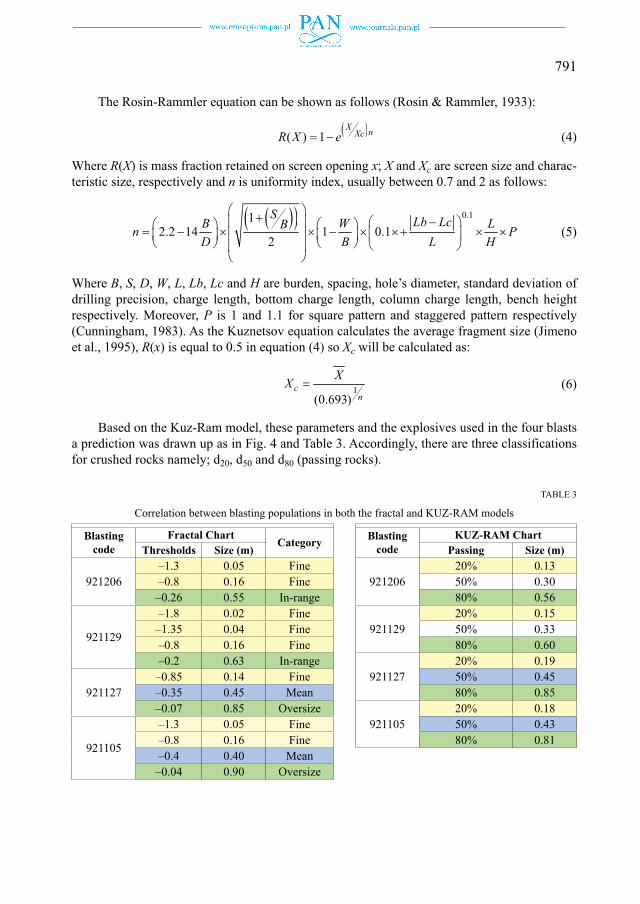
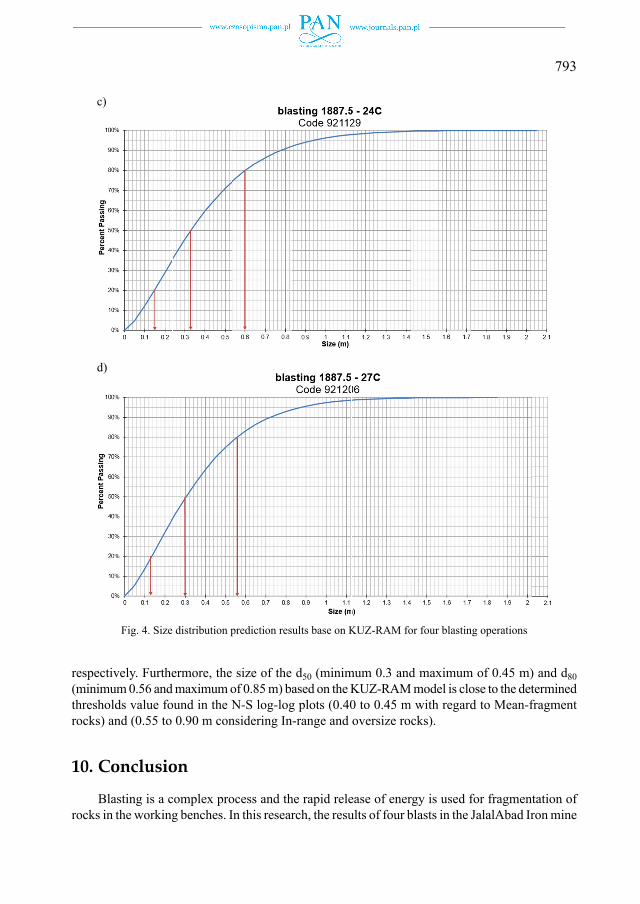
Based on the Kuz-Ram model, these parameters and the explosives used in the four blasts a prediction was drawn up as in Fig. 4 and Table 3. Accordingly, there are three classifications for crushed rocks namely; d20, d50 and d80 (passing rocks).
TABLE 3
Correlation between blasting populations in both the fractal and KUZ-RAM models
Blasting code
Fractal ChartCategory
Thresholds Size (m)
921206–1.3 0.05 Fine–0.8 0.16 Fine–0.26 0.55 In-range
921129
–1.8 0.02 Fine–1.35 0.04 Fine–0.8 0.16 Fine–0.2 0.63 In-range
921127–0.85 0.14 Fine–0.35 0.45 Mean –0.07 0.85 Oversize
921105
–1.3 0.05 Fine–0.8 0.16 Fine–0.4 0.40 Mean–0.04 0.90 Oversize
Blasting code
KUZ-RAM ChartPassing Size (m)
92120620% 0.1350% 0.3080% 0.56
92112920% 0.1550% 0.3380% 0.60
92112720% 0.1950% 0.4580% 0.85
92110520% 0.1850% 0.4380% 0.81
792
a)
b)
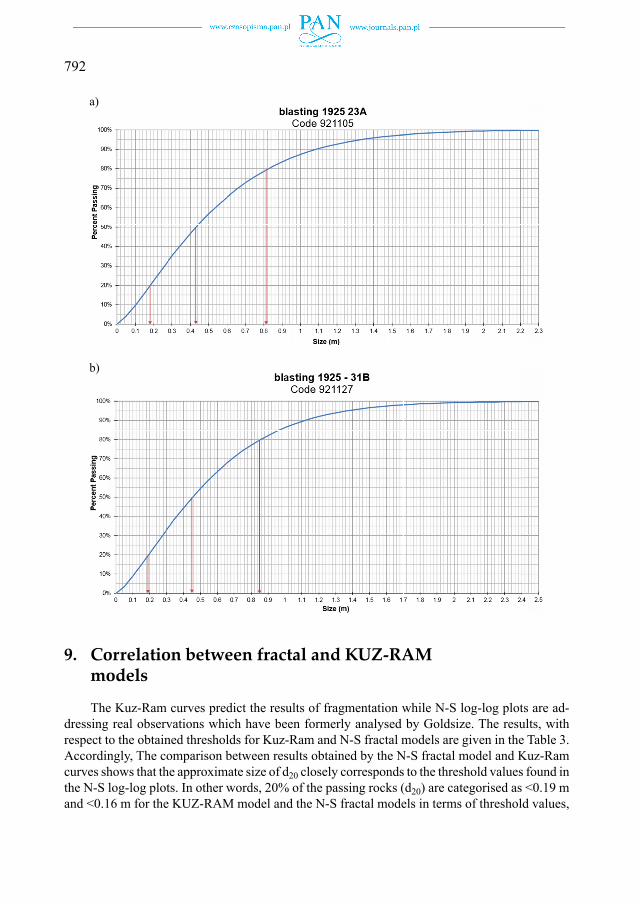
9. Correlation between fractal and KUZ-RAM models
The Kuz-Ram curves predict the results of fragmentation while N-S log-log plots are ad-dressing real observations which have been formerly analysed by Goldsize. The results, with respect to the obtained thresholds for Kuz-Ram and N-S fractal models are given in the Table 3. Accordingly, The comparison between results obtained by the N-S fractal model and Kuz-Ram curves shows that the approximate size of d20 closely corresponds to the threshold values found in the N-S log-log plots. In other words, 20% of the passing rocks (d20) are categorised as <0.19 m and <0.16 m for the KUZ-RAM model and the N-S fractal models in terms of threshold values,
793
respectively. Furthermore, the size of the d50 (minimum 0.3 and maximum of 0.45 m) and d80 (minimum 0.56 and maximum of 0.85 m) based on the KUZ-RAM model is close to the determined thresholds value found in the N-S log-log plots (0.40 to 0.45 m with regard to Mean-fragment rocks) and (0.55 to 0.90 m considering In-range and oversize rocks).
10. Conclusion
Blasting is a complex process and the rapid release of energy is used for fragmentation of rocks in the working benches. In this research, the results of four blasts in the JalalAbad Iron mine
c)
d)
Fig. 4. Size distribution prediction results base on KUZ-RAM for four blasting operations

794
were investigated. To achieve this, the GoldSize software was utilised to analyse the fragmented rocks followed by the N-S fractal model as a nonlinear mathematics which are recognised as effective tools mostly intended for use in geological and other mining related issues. The N-S log-log plots of the cumulative number and related sizes were constructed and subsequently the straight lines (segments) were fitted in order to delineate different populations based on the least-square regression showing that there is multifractal behaviour within the blasted fragmented rocks. The domains of various crushed rocks in terms of size are categorised into four popula-tions namely; fines, Mean-fragment, In-range and oversize in accordance with fractal models. Those plots were compared with predictive curves based on the Kuz-Ram formula and the results revealed that there is a good correlation of the d20, d50 and d80 with fines, Mean-fragment and In-range populations, respectively.
Acknowledgments
The authors would like to hugely acknowledge Mr. Mahdi Mahdizadeh from Hampa Behineh Con-sultant Engineers Company for their valuable comments and Mohammadreza Masoudian from the Jalal-Abad iron mine.
References
Afzal P., Fadakar Alghalandis Y., Khakzad A., Moarefvand P., Rashidnejad Omran N., 2011. Delineation of mineraliza-tion zones in porphyry Cu deposits by fractal concentration-volume modeling. Journal of Geochemical Exploration 108, 220-232.
Agterberg F.P., 1995. Multifractal modeling of the sizes and grades of giant and supergiant deposits. International Geol-ogy Review 37, 1-8.
Agterberg F.P., Cheng Q., Wright D.F., 1993. Fractal modelling of mineral deposits. In: Elbrond J., Tang X., (Eds.), 24Th APCOM symposium proceeding, Montreal, Canada, 43-53.
Badel M., Angorani S., Shariat Panahi M., 2011. The application of median indicator kriging and neural network in modeling mixed population in an iron ore deposit. Computers & Geosciences 37 (4), 530-540.
Bolviken B., Stokke P.R., Feder J., Jossang T., 1992. The fractal nature of geochemical landscapes. Journal of Geochemi-cal Exploration 43, 91-109.
Cunningham C.V.B., 1983. The Kuz-Ram model for prediction of fragmentation from blasting. In: Proc. 1st Int. Symposium on Rock Fragmentation by Blasting, Luleå, Sweden, 22-26 August. Luleå University of Technology, Luleå, 439-452.
Cunningham C.V.B., 1987. Fragmentation estimations and the Kuz-Ram model – four years on. In: Proc. 2nd Int. Symposium on Rock Fragmentation by Blasting, Keystone, Colorado, USA. Society for Experimental Mechanics, Bethel, CT, 475-487.
Cunningham C.V.B., 2005. The Kuz-Ram fragmentation model – 20 years on. In: R. Holmberg (Ed.), Third EFEE World Conference on Explosives and Blasting. European Federation of Explosives Engineers, UK, Brighton, p. 201-210.
Deng J., Wang Q., Yang L., Wang Y., Gong Q., Liu H., 2011. Delineation and explanation of geochemical anomalies using fractal models in the Heqing area, Yunnan Province, China. Journal of Geochemical Exploration 105, 95-105.
Enayatollahi I., Aghajani Bazzazi A., Asadi A., 2014. Comparison Between Neural Networks and Multiple Regression Analysis to Predict Rock Fragmentation in Open-Pit Mines. Rock Mechanics and Rock Engineering 47 (2), 799-807.
Faramarzi F., Mansouri H., Ebrahimi Farsangi M.A., 2013. A rock engineering systems based model to predict rock fragmentation by blasting. International Journal of Rock Mechanics and Mining Sciences 60, 82-94.
795
Girdner K.K., Kemeny J.M., Srikant A., 1996. The split system for analyzing the size distribution of fragmented rock. In: Franklin J., Katsabanis PD. Measurement of blast fragmentation. CRC Press, Balkema, Rotterdam, 101-108.
Jimeno C.L., Jimeno E.L., Carcedo F.J.A., 1995. Drilling and Blasting of Rocks. CRC Press, A.A. Balkema, Netherlands, Rotterdam.
Jiránková E., 2010. Assessment of rigid overlying strata failure in face mining. Central European Journal of Geosciences 2, 524-530.
Karamia A., Afiuni-Zadehb S., 2012. Sizing of rock fragmentation modeling due to bench blasting using adaptive neuro-fuzzy inference system and radial basis function. International Journal of Mining Science and Technology 22, 459-463
Kemeny J., Girdner K., Bobo T., Norton B., 1999. Improvements for fragmentation measurement by digital imaging: accurate estimation of fines. In: Holmberg R., (Ed.), 6th Int. Symposium on Rock Fragmentation by Blasting. CRC Press, Johannesburg, 103-109.
Kuznetsov V.M., 1973. Mean diameter of fragments formed by blasting rock. Soviet. Min. Sci. 9 (2), 144-148.Lathama J.P., Meulenb J.V., Duprayc S., 2006. Prediction of fragmentation and yield curves with reference to armourstone
production. Engineering Geology 87, 60-74.Lilly P.A., 1986., An empirical method of assessing rock mass blastability. In: Proceedings of the large open pit mining
conference, Melbourne, Australia, 89-92.Maerz N.H., Palangio T.C., Franklin J.A., 1996. WipFrag image based granulometry system. In: Franklin J.A., Katsabanis
T., (Eds.), Measurement of Blast Fragmentation, Rotterdam, Balkema, 91-99.Mandelbrot B.B., 1983. The fractal geometry of nature. W.H. Freeman, Updated and Augmented Edition, San Francisco,
CA.Meng X., Zhao P., 1991. Fractal method for statistical analysis of geological data. Chinese Journal of Geoscience 2,
207-211.Monecke T., Monecke J., Herzig P.M., Gemmell J.B., Monch W., 2005. Truncated fractal frequency distribution of
element abundance data: a dynamic model for the metasomatic enrichment of base and precious metals. Earth and Planetary Science Letters 232, 363-378.
Morin M.A., Ficarazzo F., 2006. Monte Carlo simulation as a tool to predict blasting fragmentation based on the Kuz-Ram model. Comput Geosci 32 (3), 352-9
Ozkahraman H.T., 2006. Fragmentation Assessment and Design of Blast Pattern at Goltas Limestone Quarry, Turkey (Technical Note). International Journal of Rock Mechanics & Mining Sciences 43, 628-633.
Perfect E., 1997. Fractal models for the fragmentation of rocks and soils: a review. Engineering Geology 48, 185-198.Rosin P., Rammler E., 1933. The laws governing the fineness of powdered coal. J. Inst. Fuel 7, 29-36.Sanchidrian J.A., Segarra .P, Lopez L.M., 2006. A practical procedure for the measurement of fragmentation by blasting
by image analysis. Rock Mech. Rock Eng. 39, 359-382.Sanchidrián J.A., Segarra P., Ouchterlony F., López .LM., 2009. On the accuracy of fragment size measurement by image
analysis in combination with some distribution functions. Rock Mechanics and Rock Engineering 42 (1), 95-116. Segarra P., Sanchidrian J.A., Moser P., Grasedieck A., Smooch B., Pascual J.A., 2005. Energy controlled blasting for
less fines production. In: Holmberg R (Ed), Third EFEE World Conference on Explosives and Blasting, European Federation of Explosives Engineers, UK, Brighton, 535-543
Tafazoli S., Ziraknejad N., 2009. An in-Shovel Camera-based Technology for Automatic Rock Size Sensing and Analysis in Open Pit Mining. In: Diederichs M., Grasselli g., (Eds.), The 3rd CANUS Rock Mechanics Symposium, ROCK-ENG09, Toronto, Canada, May 2009
Tosun A., Konak G., Toprak T., Karakus D., Hakan A.O., 2014. Development of the Kuz-Ram Model to Blasting in a Limestone Quarry. Arch. Min. Sci. 59, 2, 477-488.
Turcotte D.L., 1986. A fractal approach to the relationship between ore grade and tonnage. Econ Geol 18, 1525-1532.Turcotte D.L., 2002. Fractals in petrology. Lithos 65, 261-271.Wang Q.F., Deng J., Liu H., Yang L.Q., Wan L., Zhang R.Z., 1993. Fractal models for ore reserve estimation. Ore
Geology Reviews 37, 2-14Wang Q.F., Deng J., Liu H., Wang Y., Sun X., Wan L., 2011. Fractal models for estimating local reserves with different
mineralization qualities and spatial variations. Journal of Geochemical Exploration 108, 196-208

796
Xu Y., 2004. Calculation of unsaturated hydraulic conductivity using a fractal model for the pore-size distribution. Computers and Geotechnics 31, 549-557.
Yasrebi A.B., Afzal P., Wetherelt A., Foster P., Esfahanipour R., 2013. Correlation between geology and concentration-volume fractal models: significance for Cu and Mo mineralized zones separation in the Kahang porphyry deposit (Central Iran). Geologica Carpathica 64, 153-163.
Yasrebi A.B., Wetherelt A., Foster P., Coggan J., Afzal P., Agterberg F., Kaveh Ahangaran D., 2014. Application of a density-volume fractal model for rock characterisation of the Kahang porphyry deposit. International Journal of Rock Mechanics & Mining Sciences 66, 188-193.