Balanza de Pagos de Puerto Rico - jp.pr.gov
40
Transcript of Balanza de Pagos de Puerto Rico - jp.pr.gov


Balanza de Pagos de Puerto RicoBalance of Payments
2019María del C. Gordillo Pérez
Presidenta - [email protected]
Programa de Planificación Económica y SocialAlejandro Díaz Marrero
Gobierno de Puerto RicoJunta de Planificación
Government of Puerto RicoPlanning Board
Julio-July 2020
Solicitud de autorización presentada ante la CEE Núm. CEE-SA-177, Ley 75 de 1975 según enmendada.

i Junta de Planificación Planning Board
Balanza de Pagos y Posición de Inversión Internacional de Puerto Rico Puerto Rico Balance of Payments and International Investment Position
Año fiscal 2019Fiscal Year 2019
Resumen Ejecutivo
La publicación Balanza de Pagos de Puerto Rico realizada por la Junta de Planficación registra las transacciones entre los residentes de Puerto Rico y del exterior. Esta consta de dos componentes principales: cuenta corriente y de capital. La cuenta corriente se compone de las ventas netas al resto del mundo, que son las ventas y compras de mercancías y servicios relacionados directamente con la producción; de las transferencias unilaterales netas, que representan recibos y pagos con el exterior que no están relacionados con transacciones de mercancías y servicios y que no constituyen movimientos de capital por concepto de esas transferencias; y el interés neto del gobierno central y los municipios. La cuenta de capital registra los movimientos de fondos que han ocurrido como resultado de las transacciones de la cuenta corriente. Estas se subdividen en movimientos a largo y corto plazo. Esta publicación presenta datos para los años fiscales 2010 a 2019.
En nuestro continuo esfuerzo por modernizar el nivel de nuestras estadísticas de acuerdo con los modelos vigentes, continuamos el proceso de transición hacia el Sistema de Cuentas Nacionales del 2008 (SCN 2008), de acuerdo con los criterios metodológicos recomendados por los organismos pertinentes. Esto incluye la Organización de Naciones Unidas, el Fondo Monetario Internacional y el Negociado de Análisis Económico de los Estados Unidos. En lo que concierne a las transacciones entre Puerto Rico y el resto del mundo, la Balanza de Pagos y Posición de Inversión Internacional de Puerto Rico 2019, incorpora lo establecido en la sexta edición del Manual de Balanza de Pagos y Posición de Inversión Internacional (MBP6). Éste se actualizó de forma paralela con el SCN 2008. Además, proseguimos los estimados de inversión directa en las cifras de montantes y movimientos de capital entre Puerto Rico y el exterior. Este proceso se reanudó en la publicación del pasado año, luego que tales cifras habían permanecido sin estar disponibles desde la década de los ochenta.
Agradecemos a las entidades públicas y privadas que proveyeron los datos utilizados para preparar esta publicación.

ii Junta de Planificación Planning Board
Balanza de Pagos y Posición de Inversión Internacional de Puerto Rico Puerto Rico Balance of Payments and International Investment Position
Año fiscal 2019Fiscal Year 2019
Executive Summary
Puerto Rico’s Balance of Payments records the transactions between Puerto Rico residents and abroad. Its two main components are the current account and capital account. The current account contains net sales to the rest of the world, which are sales and purchases of merchandise and services directly related to production; net unilateral transfers, which are receipts and payments to and from abroad not related to the sales and purchases of merchandise and services and which do not constitute a capital movement because of these transfers; and the net interest of the central government and municipios. The capital account records the movement of funds, which have taken place as a result of the current account transactions. These are subdivided in long and short-term movements. The Balance of Payments of Puerto Rico 2016 presents data for fiscal years 2010 through 2019.
The information for exports and imports of not seasonally adjusted goods is revised by the U.S. Bureau of the Census to redistribute monthly data that arrived too late for inclusion in the month of transaction but were initially included in the month in which the data were received. Once the redistributions of data to the proper month of transaction and any corrections or adjustments are completed, data for prior years are recompiled and released by the Census.
In our continuous effort to modernize the level of our statistics according to the current models, we continue the transition process towards the System of National Accounts of 2008 (SNA 2008), in accordance with the methodological criteria recommended by the pertinent organizations. This includes the United Nations Organization, the International Monetary Fund and the Bureau of Economic Analysis of the United States. Concerning the transactions between Puerto Rico and the rest of the world, Puerto Rico’s Balance of Payments and International Investment Position 2019 incorporates the provisions established at the sixth edition of the Balance of Payments and International Investment Position Manual (BPM6), which is in harmony and updated in parallel with SNA 2008. In addition, we continue the estimates of direct investment in the amounts of amounts and capital movements between Puerto Rico and abroad. This process was resumed in last year's publication, after such figures had remained unavailable since the 1980s.
We are aware of the challenges involved in a process of reviewing a system as complex as the National Accounts. Therefore, we reiterate our willingness to maintain a real feedback between the PRPB and our users of information, for the benefit of the fidelity and confidence levels of the information presented in our publications. We thank the public and private entities that provided the data used to prepare this publication.

iii Junta de Planificación Planning Board
Balanza de Pagos y Posición de Inversión Internacional de Puerto Rico Puerto Rico Balance of Payments and International Investment Position
Año fiscal 2019Fiscal Year 2019
TABLA DE CONTENIDOTABLE OF CONTENTS
Página - Page
Resumen Ejecutivo - Executive Summary ............................................................i
Tablas - Tables
1 Balanza de pagos, presentación estándar (Balance of Payments, standard presentation) ................................... 3
2 Balanza de pagos, presentación analítica (Balance of payments, analytic presentation). ..................................... 5
3 Bienes (Goods) .................................................................................................7
4 Servicios (Services) ...................................................................................... 8
5 Ingreso primario (Primary Income) ........................................................10
6 Ingreso secundario (Secondary Income) ...............................................11
7 Posición de inversión internacional (International Investment Position) .................................................................................... 12
iv Junta de Planificación Planning Board
Balanza de Pagos y Posición de Inversión Internacional de Puerto Rico Puerto Rico Balance of Payments and International Investment Position
Año fiscal 2019Fiscal Year 2019
Suplemento – Supplement
S.1 Movimiento de pasajeros entre Puerto Rico y el exterior (Passenger traffic between Puerto Rico and abroad) ......................15
S.2 Número y gastos de visitantes en Puerto Rico (Number and expenditures of visitors in Puerto Rico) ..................... 16
S.3 Número y gastos de viaje de los residentes de Puerto Rico (Travel expenditures of Puerto Rico residents) .................................. 17
S.4 Gastos netos de funcionamiento de las agencias federales en Puerto Rico (Net operating expenditures of federal agencies in Puerto Rico) ...............................................................................................18 S.5 Transferencias entre Puerto Rico y el gobierno federal, gobiernos estatales y otros no residents (Transfers between Puerto Rico and the federal government, state governments, and other nonresidents) ...................................... 19
S.6 Aportaciones federales al gobierno del E.L.A. (Federal grants to the Commonwealth government) .......................21
S.7 Transferencias unilaterales, netas (Unilateral transfers, net) ..... 23
v Junta de Planificación Planning Board
Balanza de Pagos y Posición de Inversión Internacional de Puerto Rico Puerto Rico Balance of Payments and International Investment Position
Año fiscal 2019Fiscal Year 2019
Gráficas - Graphs
1 Bienes (Goods) .............................................................................................. 27
2 Servicios (Services) ....................................................................................28
3 Ingreso primario (Primary Income) ....................................................... 29
4 Posición de inversión internacional (International Investment Position) ..........................................................................................................30

TablasTables


Junta de Planificación Planning Board
Balanza de Pagos y Posición de Inversión Internacional de Puerto Rico Puerto Rico Balance of Payments and International Investment Position
3
Año fiscal 2019Fiscal Year 2019
TABLA 1 - BALANZA DE PAGOS, PRESENTACION ESTANDAR: AÑOS FISCALES TABLE 1 - BALANCE OF PAYMENTS, STANDARD PRESENTATION: FISCAL YEARS (En millones de dólares - In millions of dollars)
2010 2011 2012 2013 2014 2015 2016 2017r 2018r 2019p
Cuenta corriente 5,218.4 5,610.2 3,591.6 4,828.7 4,362.3 7,462.7 9,454.7 8,064.0 9,771.2 7,974.3 Current accountCrédito 96,322.2 99,638.6 96,994.7 97,780.5 96,639.3 99,724.0 102,611.9 103,258.4 107,718.7 109,270.8 CreditDébito 91,103.8 94,028.4 93,403.1 92,951.8 92,277.1 92,261.3 93,157.2 95,194.4 97,947.5 101,296.4 Debit
Bienes y servicios 22,244.1 21,938.2 19,638.9 19,898.7 20,576.6 23,962.3 26,537.3 24,135.7 12,477.5 12,090.8 Goods and services Crédito 72,254.2 74,747.9 72,947.8 72,957.2 72,870.5 76,226.0 79,128.6 78,370.8 70,440.1 72,413.9 Credit Débito 50,010.1 52,809.7 53,308.9 53,058.5 52,293.9 52,263.7 52,591.3 54,235.1 57,962.7 60,323.1 Debit
Bienes 21,013.0 20,981.8 18,593.9 18,820.9 19,285.0 22,144.1 24,565.4 22,244.6 11,283.6 10,723.8 Goods Crédito 67,213.2 69,891.8 67,993.9 68,001.0 67,758.1 70,666.1 73,336.9 72,611.4 65,372.1 66,919.1 Credit Débito 46,200.2 48,910.0 49,400.0 49,180.0 48,473.1 48,522.0 48,771.6 50,366.8 54,088.5 56,195.3 Debit Mercancías generales según la BP: Crédito 67,213.2 69,891.8 67,993.9 68,001.0 67,758.1 70,666.1 73,336.9 72,611.4 65,372.1 66,919.1 General merchandise on a BOP basis: Credit Mercancías generales: exportaciones 67,197.7 69,871.5 67,396.4 67,990.0 67,753.4 70,661.2 73,332.5 72,608.8 65,371.0 66,916.4 General merchandise: exports De las cuales: Reexportación (220.7) (265.2) (201.7) (227.7) (212.4) (235.7) (219.0) (131.6) (97.6) (166.6) Of which: Re-exports Oro no monetario 15.5 20.3 597.5 10.9 4.7 5.0 4.4 2.5 1.0 2.7 Nonmonetary gold Mercancías generales según la BP: Débito 46,200.2 48,910.0 49,400.0 49,180.0 48,473.1 48,522.0 48,771.6 50,366.8 54,088.5 56,195.3 General merchandise on a BOP basis: Debit Mercancías generales: importaciones 46,198.1 48,908.0 49,396.6 49,178.3 48,470.9 48,520.2 48,769.7 50,365.4 54,086.8 56,191.6 General merchandise: imports Oro no monetario 2.0 2.0 3.4 1.7 2.2 1.8 1.9 1.4 1.6 3.7 Nonmonetary gold
Servicios 1,231.1 956.4 1,045.0 1,077.7 1,291.6 1,818.2 1,972.0 1,891.1 1,193.8 1,367.0 Services Crédito 5,041.0 4,856.1 4,953.8 4,956.2 5,112.4 5,559.9 5,791.7 5,759.5 5,068.1 5,494.8 Credit Débito 3,809.9 3,899.7 3,908.9 3,878.5 3,820.8 3,741.7 3,819.7 3,868.4 3,874.2 4,127.8 Debit Servicios de manufactura sobre insumos físicos Manufacturing services on physical inputs pertenecientes a otros: Crédito 0.0 0.0 0.0 0.0 0.0 0.0 0.0 0.0 0.0 0.0 owned by others: Credit Servicios de manufactura sobre insumos físicos Manufacturing services on physical inputs pertenecientes a otros: Débito 0.0 0.0 0.0 0.0 0.0 0.0 0.0 0.0 0.0 0.0 owned by others: Debit Mantenimiento y reparaciones n.i.o.p.: Crédito 46.6 42.6 37.0 29.9 19.5 12.9 28.8 33.8 19.7 16.4 Maintenance and repair services n.i.e.: Credit Mantenimiento y reparaciones n.i.o.p.: Débito 19.5 5.6 5.0 5.0 4.3 5.4 10.5 21.3 19.8 12.4 Maintenance and repair services n.i.e.: Debit Transporte: Crédito 422.8 418.0 441.7 430.8 434.8 472.2 470.0 527.3 482.9 519.7 Transport: Credit Transporte: Débito 1,882.5 1,918.3 1,942.4 1,890.1 1,853.6 1,821.6 1,849.2 1,921.0 1,975.4 2,087.4 Transport: Debit Viajes: Crédito 3,210.7 3,142.8 3,192.9 3,310.6 3,438.6 3,825.0 3,973.5 3,846.8 3,287.8 3,589.8 Travel: Credit Viajes: Débito 808.9 815.8 787.0 781.9 763.2 665.7 719.9 709.5 613.0 714.5 Travel: Debit Construcción: Crédito 0.0 0.0 0.0 0.0 0.0 0.0 0.0 0.0 0.0 0.0 Construction: Credit Construcción: Débito 0.0 0.0 0.0 0.0 0.0 0.0 0.0 0.0 0.0 0.0 Construction: Debit Servicios de seguros y pensiones: Crédito 53.0 52.8 52.4 54.8 56.5 45.8 47.6 48.4 46.2 45.4 Insurance and pension services: Credit Servicios de seguros y pensiones: Débito 448.9 476.6 514.1 512.9 511.1 521.1 564.6 532.3 530.9 599.0 Insurance and pension services: Debit Servicios financieros: Crédito 539.2 496.2 384.7 284.4 330.2 336.3 390.2 346.8 224.7 239.2 Financial services: Credit Servicios financieros: Débito 3.9 6.3 10.4 8.4 8.3 6.0 5.1 5.1 3.5 4.6 Financial services: Debit Cargos por el uso de la propiedad intelectual Charges for the use of intellectual property n.i.o.p.: Crédito 0.0 0.0 0.0 0.0 0.0 0.0 0.0 0.0 0.0 0.0 n.i.e.: Credit Cargos por el uso de la propiedad intelectual Charges for the use of intellectual property n.i.o.p.: Débito 0.0 0.0 0.0 0.0 0.0 0.0 0.0 0.0 0.0 0.0 n.i.e.: Debit Servicios de telecomunicaciones, informática Telecommunications, computer, e información: Crédito 13.3 10.2 10.3 10.0 9.9 9.4 8.8 10.2 13.6 29.1 and information services: Credit Servicios de telecomunicaciones, informática Telecommunications, computer, e información: Débito 9.2 8.7 8.3 8.2 8.2 7.8 7.7 7.9 8.3 9.0 and information services: Debit Otros servicios empresariales: Crédito 92.6 89.4 85.3 84.4 92.0 93.3 94.5 130.6 186.7 201.0 Other business services: Credit Otros servicios empresariales: Débito 277.6 299.2 367.5 394.6 399.7 424.3 399.1 388.7 432.4 391.5 Other business services: Debit Servicios personales, culturales y recreativos: Crédito 0.0 0.0 0.0 0.0 0.0 0.0 0.0 0.0 0.0 0.0 Personal, cultural, and recreational services: Credit Servicios personales, culturales y recreativos: Débito 16.3 16.1 16.1 16.7 18.0 25.1 23.7 21.2 20.6 18.6 Personal, cultural, and recreational services: Debit Bienes y servicios del gobierno, n.i.o.p.: Crédito 662.7 604.1 749.5 751.3 730.7 765.0 778.4 815.6 806.4 854.1 Government goods and services n.i.e.: Credit Bienes y servicios del gobierno, n.i.o.p.: Débito 343.1 353.1 258.0 260.6 254.5 264.8 239.9 261.4 270.4 290.9 Government goods and services n.i.e.: Debit
(Continúa - Continue)

Junta de Planificación Planning Board
Balanza de Pagos y Posición de Inversión Internacional de Puerto Rico Puerto Rico Balance of Payments and International Investment Position
4
Año fiscal 2019Fiscal Year 2019
TABLA 1 - BALANZA DE PAGOS, PRESENTACION ESTANDAR: AÑOS FISCALES (CONT.TABLE 1 - BALANCE OF PAYMENTS, STANDARD PRESENTATION: FISCAL YEARS (CONT.(En millones de dólares - In millions of dollars)
2010 2011 2012 2013 2014 2015 2016 2017r 2018r 2019p
Ingreso primario (37,965.9) (38,167.1) (37,267.3) (36,987.6) (37,338.2) (37,454.0) (37,978.6) (38,267.5) (37,036.8) (38,043.1) Primary income Crédito 2,818.1 2,630.8 2,631.7 2,727.8 2,452.8 2,340.6 2,369.4 2,427.6 2,729.9 2,717.0 Credit Débito 40,784.0 40,797.9 39,898.9 39,715.5 39,791.0 39,794.6 40,348.0 40,695.1 39,766.8 40,760.1 Debit Remuneración de empleados: Crédito 1,310.2 1,300.5 1,336.9 1,339.0 1,272.5 1,307.4 1,327.8 1,402.8 1,572.8 1,217.0 Compensation of employees: Credit Remuneración de empleados: Débito 324.6 207.1 115.9 127.3 122.9 79.1 72.3 82.7 95.0 72.4 Compensation of employees: Debit Renta de la inversión: Crédito 1,125.2 920.1 870.0 977.5 806.3 655.9 644.6 665.5 794.1 959.4 Investment income: Credit Inversión directa 11.7 14.2 10.4 10.4 12.8 12.5 12.7 21.3 27.9 10.6 Direct investment Inversión de cartera 1,113.5 905.9 859.6 967.1 793.5 643.4 632.0 644.2 766.2 948.8 Portfolio investment Renta de la inversión: Débito 36,872.7 37,213.2 36,138.0 35,936.1 35,907.3 35,872.6 36,388.5 36,560.1 35,599.3 36,362.2 Investment income: Debit Inversión directa 32,216.7 32,897.3 31,917.2 32,013.8 32,380.9 32,774.9 33,392.0 34,793.5 34,066.9 35,014.1 Direct investment Inversión de cartera 4,656.0 4,315.9 4,220.8 3,922.4 3,526.4 3,097.7 2,996.5 1,766.5 1,532.4 1,348.1 Portfolio investment Otro ingreso primario: Crédito 382.6 410.2 424.7 411.3 374.0 377.4 397.0 359.3 363.0 540.6 Other primary income: Credit Otro ingreso primario: Débito 3,586.7 3,377.6 3,645.1 3,652.1 3,760.8 3,843.0 3,887.2 4,052.3 4,072.5 4,325.6 Other primary income: Debit
Ingreso secundario 20,940.2 21,839.1 21,220.0 21,917.7 21,123.8 20,954.4 20,896.0 22,195.7 34,330.5 33,926.7 Secondary income Crédito 21,249.9 22,259.9 21,415.3 22,095.6 21,316.0 21,157.3 21,113.9 22,459.9 34,548.6 34,139.9 Credit Débito 309.7 420.8 195.3 177.9 192.2 202.9 217.9 264.2 218.1 213.2 Debit Gobierno general: Crédito 5,404.4 6,056.3 4,763.9 4,926.8 4,150.6 3,850.9 3,746.0 3,690.0 8,865.4 10,253.4 General government: Credit Gobierno general: Débito 63.3 70.2 72.2 76.7 86.6 79.1 86.2 83.9 115.4 126.5 General government: Debit Sociedades financieras, sociedades no financieras, Financial corporations, nonfinancial corporations, hogares e ISFLSH: Crédito 15,845.5 16,203.6 16,651.4 17,168.8 17,165.4 17,306.4 17,367.9 18,769.9 25,683.2 23,886.4 households, and NPISHs: Credit Sociedades financieras, sociedades no financieras, Financial corporations, nonfinancial corporations, hogares e ISFLSH: Débito 246.4 350.6 123.1 101.2 105.6 123.8 131.6 180.3 102.7 86.7 households, and NPISHs: Debit
Cuenta de capital 0.0 0.0 0.0 0.0 0.0 0.0 0.0 0.0 0.0 0.0 Capital accountCrédito 0.0 0.0 0.0 0.0 0.0 0.0 0.0 0.0 0.0 0.0 CreditDébito 0.0 0.0 0.0 0.0 0.0 0.0 0.0 0.0 0.0 0.0 Debit
Cuenta financiera 227.8 (7,454.5) 7,215.4 12,597.6 5,758.3 2,379.1 1,171.7 19,028.0 (3,389.1) (11,537.2) Financial accountAdquisición neta de activos financieros 4,610.1 1,176.9 1,452.4 4,415.0 (1,040.4) 657.3 1,104.1 2,894.4 (3,298.6) (5,247.1) Net acquisition of financial assetsPasivos netos incurridos 4,382.3 8,631.4 (5,762.9) (8,182.6) (6,798.7) (1,721.8) (67.6) (16,133.7) 90.4 6,290.1 Net incurrence of liabilities Inversión directa (1,166.0) (4,596.7) 1,464.4 (956.6) (2,097.9) (3,306.2) (2.8) (2,487.9) (609.1) (10,982.6) Direct investment Adquisición neta de activos financieros 569.4 (1,307.1) (159.0) 201.3 (335.7) (400.6) 644.9 (1,118.6) (1,235.4) (2,454.1) Net acquisition of financial assets Pasivos netos incurridos 1,735.4 3,289.6 (1,623.4) 1,157.9 1,762.2 2,905.6 647.7 1,369.2 (626.3) 8,528.5 Net incurrence of liabilities Inversión de cartera 767.0 (2,226.9) 4,597.0 12,935.3 9,108.4 5,210.9 1,272.6 17,112.2 (1,157.9) 842.6 Portfolio investment Adquisición neta de activos financieros 3,219.3 3,103.2 478.7 4,278.2 698.3 1,254.4 592.7 1,277.5 (2,357.0) (2,736.7) Net acquisition of financial assets Pasivos netos incurridos 2,452.3 5,330.0 (4,118.3) (8,657.1) (8,410.1) (3,956.5) (679.9) (15,834.7) (1,199.1) (3,579.3) Net incurrence of liabilities Derivados financieros (distintos de reservas) y opciones Financial derivatives (other than reserves) de compra de acciones por parte de empleados 0.0 0.0 0.0 0.0 0.0 0.0 0.0 0.0 0.0 0.0 and employee stock options Adquisición neta de activos financieros 0.0 0.0 0.0 0.0 0.0 0.0 0.0 0.0 0.0 0.0 Net acquisition of financial assets Pasivos netos incurridos 0.0 0.0 0.0 0.0 0.0 0.0 0.0 0.0 0.0 0.0 Net incurrence of liabilities Otra inversión 626.8 (631.0) 1,154.0 618.9 (1,252.1) 474.4 (98.1) 4,403.7 (1,622.0) (1,397.2) Other investment Adquisición neta de activos financieros 821.3 (619.2) 1,132.7 (64.5) (1,402.9) (196.5) (133.5) 2,735.4 293.8 (56.3) Net acquisition of financial assets Pasivos netos incurridos 194.6 11.7 (21.3) (683.4) (150.8) (670.9) (35.4) (1,668.2) 1,915.8 1,340.9 Net incurrence of liabilities Activos de reserva 0.0 0.0 0.0 0.0 0.0 0.0 0.0 0.0 0.0 0.0 Reserve assets Adquisición neta de activos financieros 0.0 0.0 0.0 0.0 0.0 0.0 0.0 0.0 0.0 0.0 Net acquisition of financial assets
Errores y omisiones netos (4,990.7) (13,064.7) 3,623.8 7,768.9 1,396.1 (5,083.6) (8,283.0) 10,964.0 (13,160.2) (19,511.5) Net errors and omissions
Partida informativa: saldo de las transacciones en Memorandum Item: balance on goods artículos y servicios and services transactions (Ventas netas al resto del mundo) (12,343.3) (13,045.8) (14,102.1) (13,885.0) (13,294.4) (10,027.6) (8,023.5) (10,524.4) (20,944.9) (22,349.8) (Net sales to the rest of the world)
r- Cifras revisadas. r- Revised figures. p- Cifras preliminares. p- Preliminary figures. n.i.o.p - No incluidos en otra parte. n.i.e. - Not included elsewhere. ISFLSH - Instituciones sin fines de lucro que sirven a los hogares. NPISH - Nonprofit institutions serving households. Nota: Una cifra positiva indica la creación de un crédito o un ingreso neto percibido del exterior; Note: A positive figure indicates the creation of a credit or net inflow of funds; una cifra negativa indica la creación de un débito o un egreso neto remitido al exterior. a negative figure indicates the creation of a debit or a net outflow of funds.
Fuente: Junta de Planificación, Programa de Planificación Económica y Social, Source: Puerto Rico Planning Board, Program of Economic and Social Planning, Subprograma de Análisis Económico. Subprogram of Economic Analysis.

Junta de Planificación Planning Board
Balanza de Pagos y Posición de Inversión Internacional de Puerto Rico Puerto Rico Balance of Payments and International Investment Position
5
Año fiscal 2019Fiscal Year 2019
TABLA 2 - BALANZA DE PAGOS, PRESENTACION ANALITICA: AÑOS FISCALES TABLE 2 - BALANCE OF PAYMENTS, ANALYTIC PRESENTATION: FISCAL YEARS (En millones de dólares - In millions of dollars)
2010 2011 2012 2013 2014 2015 2016 2017r 2018r 2019p
Cuenta corriente 5,218.4 5,610.2 3,591.6 4,828.7 4,362.3 7,462.7 9,454.7 8,064.0 9,771.2 7,974.3 Current account
Bienes, crédito (exportaciones) 67,213.2 69,891.8 67,993.9 68,001.0 67,758.1 70,666.1 73,336.9 72,611.4 65,372.1 66,919.1 Goods, credit (exports) Bienes, débito (importaciones) 46,200.2 48,910.0 49,400.0 49,180.0 48,473.1 48,522.0 48,771.6 50,366.8 54,088.5 56,195.3 Goods, debit (imports) Balance de bienes 21,013.0 20,981.8 18,593.9 18,820.9 19,285.0 22,144.1 24,565.4 22,244.6 11,283.6 10,723.8 Balance on goods
Servicios, crédito (exportaciones) 5,041.0 4,856.1 4,953.8 4,956.2 5,112.4 5,559.9 5,791.7 5,759.5 5,068.1 5,494.8 Services, credit (exports) Servicios, débito (importaciones) 3,809.9 3,899.7 3,908.9 3,878.5 3,820.8 3,741.7 3,819.7 3,868.4 3,874.2 4,127.8 Services, debit (imports) Balance de servicios 1,231.1 956.4 1,045.0 1,077.7 1,291.6 1,818.2 1,972.0 1,891.1 1,193.8 1,367.0 Balance on services
Balance de bienes y servicios 22,244.1 21,938.2 19,638.9 19,898.7 20,576.6 23,962.3 26,537.3 24,135.7 12,477.5 12,090.8 Balance on goods and services
Ingreso primario, crédito 2,818.1 2,630.8 2,631.7 2,727.8 2,452.8 2,340.6 2,369.4 2,427.6 2,729.9 2,717.0 Primary income, credit Ingreso primario, débito 40,784.0 40,797.9 39,898.9 39,715.5 39,791.0 39,794.6 40,348.0 40,695.1 39,766.8 40,760.1 Primary income, debit Saldo de ingreso primario (37,965.9) (38,167.1) (37,267.3) (36,987.6) (37,338.2) (37,454.0) (37,978.6) (38,267.5) (37,036.8) (38,043.1) Balance on primary income
Saldo de bienes, servicios e ingreso primario (15,721.8) (16,228.9) (17,628.4) (17,089.0) (16,761.6) (13,491.7) (11,441.2) (14,131.7) (24,559.4) (25,952.3) Balance on goods, services, and primary income
Ingreso secundario, crédito 21,249.9 22,259.9 21,415.3 22,095.6 21,316.0 21,157.3 21,113.9 22,459.9 34,548.6 34,139.9 Secondary income, credit Ingreso secundario, débito 309.7 420.8 195.3 177.9 192.2 202.9 217.9 264.2 218.1 213.2 Secondary income, debit Saldo de ingreso secundario 20,940.2 21,839.1 21,220.0 21,917.7 21,123.8 20,954.4 20,896.0 22,195.7 34,330.5 33,926.7 Balance on secondary income
Cuenta de capital 0.0 0.0 0.0 0.0 0.0 0.0 0.0 0.0 0.0 0.0 Capital account Cuenta de capital, crédito 0.0 0.0 0.0 0.0 0.0 0.0 0.0 0.0 0.0 0.0 Capital account, credit Cuenta de capital, débito 0.0 0.0 0.0 0.0 0.0 0.0 0.0 0.0 0.0 0.0 Capital account, debit
Saldo en cuenta corriente y capital 5,218.4 5,610.2 3,591.6 4,828.7 4,362.3 7,462.7 9,454.7 8,064.0 9,771.2 7,974.3 Balance on current and capital account
(Continúa - Continue)
Junta de Planificación Planning Board
Balanza de Pagos y Posición de Inversión Internacional de Puerto Rico Puerto Rico Balance of Payments and International Investment Position
6
Año fiscal 2019Fiscal Year 2019
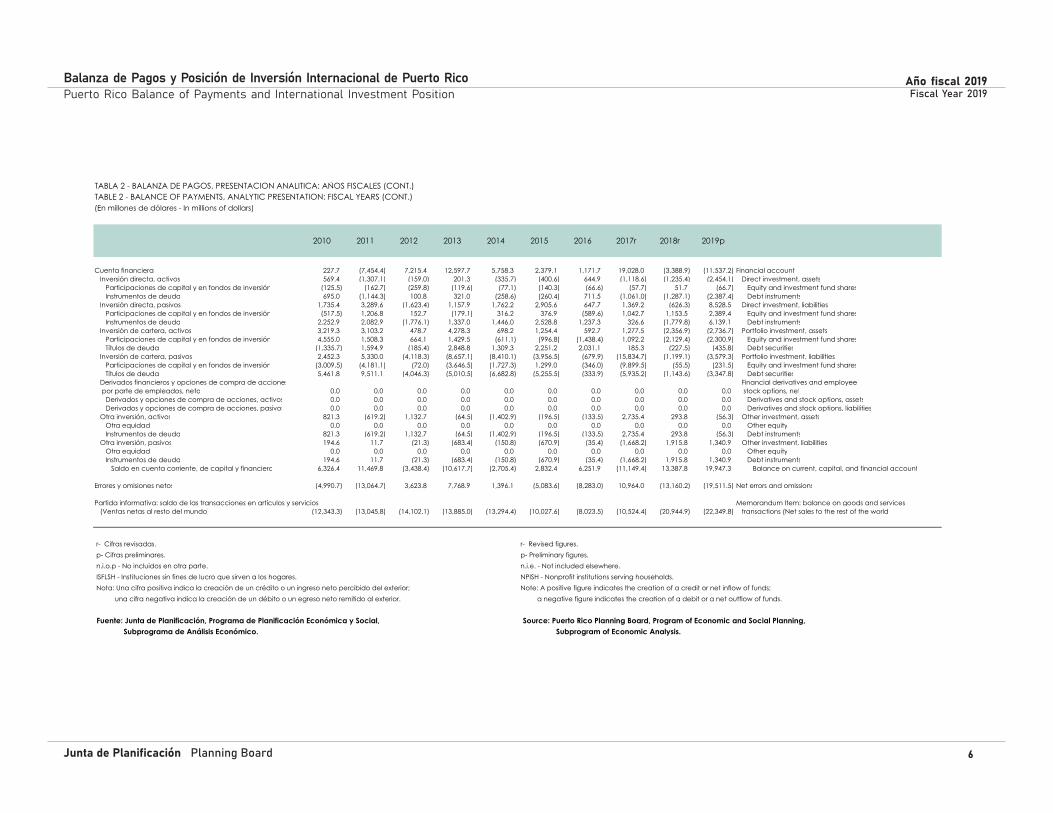
TABLA 2 - BALANZA DE PAGOS, PRESENTACION ANALITICA: AÑOS FISCALES (CONT.)TABLE 2 - BALANCE OF PAYMENTS, ANALYTIC PRESENTATION: FISCAL YEARS (CONT.)(En millones de dólares - In millions of dollars)
2010 2011 2012 2013 2014 2015 2016 2017r 2018r 2019p
Cuenta financiera 227.7 (7,454.4) 7,215.4 12,597.7 5,758.3 2,379.1 1,171.7 19,028.0 (3,388.9) (11,537.2) Financial account Inversión directa, activos 569.4 (1,307.1) (159.0) 201.3 (335.7) (400.6) 644.9 (1,118.6) (1,235.4) (2,454.1) Direct investment, assets Participaciones de capital y en fondos de inversión (125.5) (162.7) (259.8) (119.6) (77.1) (140.3) (66.6) (57.7) 51.7 (66.7) Equity and investment fund shares Instrumentos de deuda 695.0 (1,144.3) 100.8 321.0 (258.6) (260.4) 711.5 (1,061.0) (1,287.1) (2,387.4) Debt instruments Inversión directa, pasivos 1,735.4 3,289.6 (1,623.4) 1,157.9 1,762.2 2,905.6 647.7 1,369.2 (626.3) 8,528.5 Direct investment, liabilities Participaciones de capital y en fondos de inversión (517.5) 1,206.8 152.7 (179.1) 316.2 376.9 (589.6) 1,042.7 1,153.5 2,389.4 Equity and investment fund shares Instrumentos de deuda 2,252.9 2,082.9 (1,776.1) 1,337.0 1,446.0 2,528.8 1,237.3 326.6 (1,779.8) 6,139.1 Debt instruments Inversión de cartera, activos 3,219.3 3,103.2 478.7 4,278.3 698.2 1,254.4 592.7 1,277.5 (2,356.9) (2,736.7) Portfolio investment, assets Participaciones de capital y en fondos de inversión 4,555.0 1,508.3 664.1 1,429.5 (611.1) (996.8) (1,438.4) 1,092.2 (2,129.4) (2,300.9) Equity and investment fund shares Títulos de deuda (1,335.7) 1,594.9 (185.4) 2,848.8 1,309.3 2,251.2 2,031.1 185.3 (227.5) (435.8) Debt securities Inversión de cartera, pasivos 2,452.3 5,330.0 (4,118.3) (8,657.1) (8,410.1) (3,956.5) (679.9) (15,834.7) (1,199.1) (3,579.3) Portfolio investment, liabilities Participaciones de capital y en fondos de inversión (3,009.5) (4,181.1) (72.0) (3,646.5) (1,727.3) 1,299.0 (346.0) (9,899.5) (55.5) (231.5) Equity and investment fund shares Títulos de deuda 5,461.8 9,511.1 (4,046.3) (5,010.5) (6,682.8) (5,255.5) (333.9) (5,935.2) (1,143.6) (3,347.8) Debt securities Derivados financieros y opciones de compra de acciones Financial derivatives and employee por parte de empleados, neto 0.0 0.0 0.0 0.0 0.0 0.0 0.0 0.0 0.0 0.0 stock options, net Derivados y opciones de compra de acciones, activos 0.0 0.0 0.0 0.0 0.0 0.0 0.0 0.0 0.0 0.0 Derivatives and stock options, assets Derivados y opciones de compra de acciones, pasivos 0.0 0.0 0.0 0.0 0.0 0.0 0.0 0.0 0.0 0.0 Derivatives and stock options, liabilities Otra inversión, activos 821.3 (619.2) 1,132.7 (64.5) (1,402.9) (196.5) (133.5) 2,735.4 293.8 (56.3) Other investment, assets Otra equidad 0.0 0.0 0.0 0.0 0.0 0.0 0.0 0.0 0.0 0.0 Other equity Instrumentos de deuda 821.3 (619.2) 1,132.7 (64.5) (1,402.9) (196.5) (133.5) 2,735.4 293.8 (56.3) Debt instruments Otra inversión, pasivos 194.6 11.7 (21.3) (683.4) (150.8) (670.9) (35.4) (1,668.2) 1,915.8 1,340.9 Other investment, liabilities Otra equidad 0.0 0.0 0.0 0.0 0.0 0.0 0.0 0.0 0.0 0.0 Other equity Instrumentos de deuda 194.6 11.7 (21.3) (683.4) (150.8) (670.9) (35.4) (1,668.2) 1,915.8 1,340.9 Debt instruments Saldo en cuenta corriente, de capital y financiera 6,326.4 11,469.8 (3,438.4) (10,617.7) (2,705.4) 2,832.4 6,251.9 (11,149.4) 13,387.8 19,947.3 Balance on current, capital, and financial account
Errores y omisiones netos (4,990.7) (13,064.7) 3,623.8 7,768.9 1,396.1 (5,083.6) (8,283.0) 10,964.0 (13,160.2) (19,511.5) Net errors and omissions
Partida informativa: saldo de las transacciones en artículos y servicios Memorandum Item: balance on goods and services (Ventas netas al resto del mundo) (12,343.3) (13,045.8) (14,102.1) (13,885.0) (13,294.4) (10,027.6) (8,023.5) (10,524.4) (20,944.9) (22,349.8) transactions (Net sales to the rest of the world)
r- Cifras revisadas. r- Revised figures. p- Cifras preliminares. p- Preliminary figures. n.i.o.p - No incluidos en otra parte. n.i.e. - Not included elsewhere. ISFLSH - Instituciones sin fines de lucro que sirven a los hogares. NPISH - Nonprofit institutions serving households. Nota: Una cifra positiva indica la creación de un crédito o un ingreso neto percibido del exterior; Note: A positive figure indicates the creation of a credit or net inflow of funds; una cifra negativa indica la creación de un débito o un egreso neto remitido al exterior. a negative figure indicates the creation of a debit or a net outflow of funds.
Fuente: Junta de Planificación, Programa de Planificación Económica y Social, Source: Puerto Rico Planning Board, Program of Economic and Social Planning, Subprograma de Análisis Económico. Subprogram of Economic Analysis.

Junta de Planificación Planning Board
Balanza de Pagos y Posición de Inversión Internacional de Puerto Rico Puerto Rico Balance of Payments and International Investment Position
7
Año fiscal 2019Fiscal Year 2019
TABLA 3 - BIENES: AÑOS FISCALES TABLE 3 - GOODS: FISCAL YEARS (En millones de dólares - In millions of dollars)
2010 2011 2012 2013 2014 2015 2016 2017r 2018r 2019p
Crédito (Exportaciones ajustadas) 67,213.2 69,891.8 67,993.9 68,001.0 67,758.1 70,666.1 73,336.9 72,611.4 65,372.1 66,919.1 Credit (Adjusted exports)
Exportaciones registradas 61,657.2 64,228.0 58,351.6 62,361.3 62,309.2 69,463.1 71,742.2 71,090.9 60,573.8 63,684.5 Recorded exports Estados Unidos 41,989.1 45,872.7 41,798.0 44,665.8 44,853.1 51,433.1 54,592.5 55,257.1 48,479.9 48,236.2 United States Países extranjeros 19,526.0 18,174.7 16,390.7 17,462.7 17,162.3 17,749.6 16,805.9 15,538.8 11,879.2 15,172.8 Foreign countries Islas Vírgenes 142.1 180.6 162.9 232.8 293.8 280.5 343.8 295.0 214.7 275.5 Virgin Islands
Ajustes, total 5,556.0 5,663.8 9,642.3 5,639.7 5,448.9 1,203.0 1,594.7 1,520.4 4,798.3 3,234.6 Total adjustments Mercancía devuelta (179.0) (221.0) (362.0) (541.6) (859.9) (542.1) (379.8) (460.3) (331.9) (291.5) Returned merchandise Arbitrios sobre U.S. excises on embarques 354.8 436.3 341.9 332.8 331.2 286.7 381.3 345.2 246.6 308.0 off-shore shipments Otros ajustes 5,380.2 5,448.5 9,662.4 5,848.4 5,977.6 1,458.4 1,593.2 1,635.5 4,883.6 3,218.1 Other adjustments De los cuales: Oro no monetario 15.5 20.3 597.5 10.9 4.7 5.0 4.4 2.5 1.0 2.7 Of which: Nonmonetary gold
Débito (Importaciones ajustadas) 46,200.2 48,910.0 49,400.0 49,180.0 48,473.1 48,522.0 48,771.6 50,366.8 54,088.5 56,195.3 Debit (Adjusted imports)
Importaciones registradas 40,810.5 44,662.2 46,576.2 45,100.8 42,580.4 43,092.8 43,316.7 45,938.3 46,462.5 49,421.8 Recorded imports Estados Unidos 20,895.5 20,579.1 19,837.1 20,454.9 20,063.8 22,333.7 24,076.1 24,589.0 25,104.3 24,661.1 United States Países extranjeros 18,341.6 22,068.1 24,964.0 24,637.1 22,506.0 20,744.0 19,239.3 21,113.3 21,186.9 24,645.4 Foreign countries Islas Vírgenes 1,573.4 2,015.0 1,775.1 8.8 10.6 15.1 1.3 236.0 171.3 115.3 Virgin Islands
Ajustes, total 5,389.7 4,247.8 2,823.8 4,079.2 5,892.7 5,429.2 5,454.9 4,428.5 7,626.0 6,773.5 Total adjustments Mercancía devuelta (179.0) (221.0) (362.0) (541.6) (859.9) (542.1) (379.8) (460.3) (331.9) (291.5) Returned merchandise Otros ajustes 5,568.6 4,468.8 3,185.8 4,620.8 6,752.6 5,971.3 5,834.7 4,888.8 7,957.9 7,065.0 Other adjustments De los cuales: Oro no monetario 2.0 2.0 3.4 1.7 2.2 1.8 1.9 1.4 1.6 3.7 Of which: Nonmonetary gold
Balance neto 21,013.0 20,981.8 18,593.9 18,820.9 19,285.0 22,144.1 24,565.3 22,244.6 11,283.6 10,723.8 Net balance
r- Cifras revisadas. r- Revised figures. p- Cifras preliminares. p- Preliminary figures.
Fuente: Junta de Planificación, Programa de Planificación Económica y Social, Source: Puerto Rico Planning Board, Program of Economic and Social Planning, Subprograma de Análisis Económico. Subprogram of Economic Analysis.
Junta de Planificación Planning Board
Balanza de Pagos y Posición de Inversión Internacional de Puerto Rico Puerto Rico Balance of Payments and International Investment Position
8
Año fiscal 2019Fiscal Year 2019
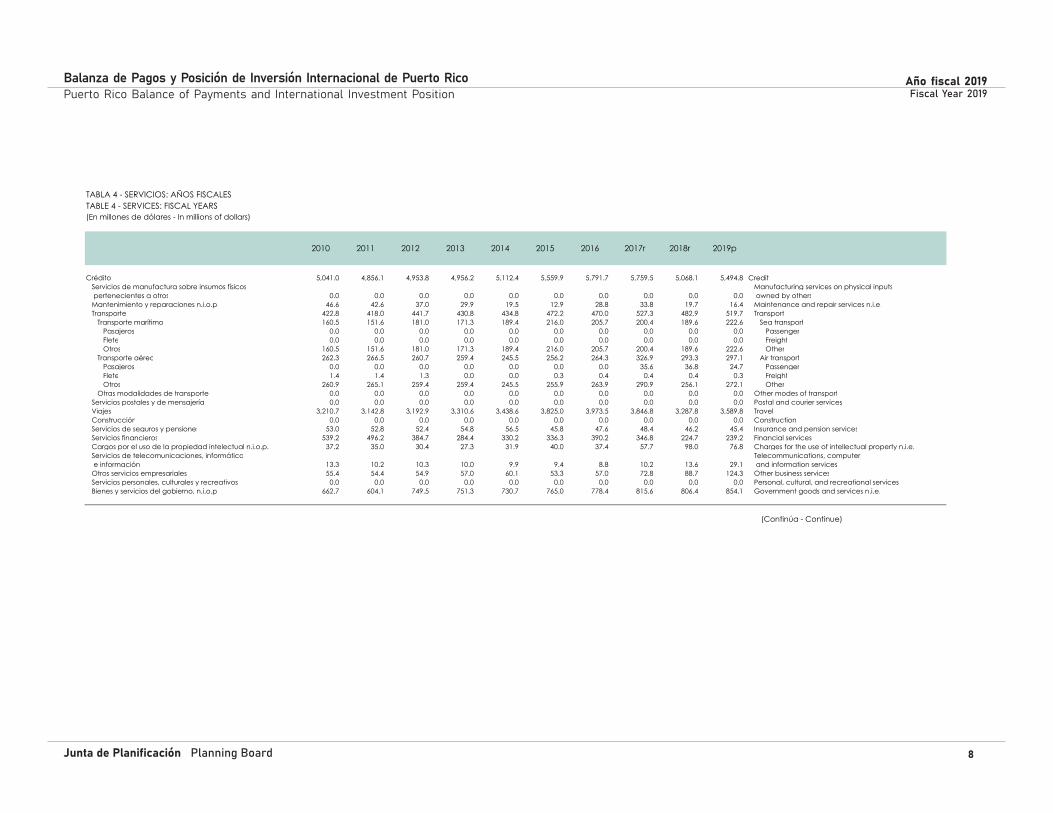
TABLA 4 - SERVICIOS: AÑOS FISCALESTABLE 4 - SERVICES: FISCAL YEARS(En millones de dólares - In millions of dollars)
2010 2011 2012 2013 2014 2015 2016 2017r 2018r 2019p
Crédito 5,041.0 4,856.1 4,953.8 4,956.2 5,112.4 5,559.9 5,791.7 5,759.5 5,068.1 5,494.8 Credit Servicios de manufactura sobre insumos físicos Manufacturing services on physical inputs pertenecientes a otros 0.0 0.0 0.0 0.0 0.0 0.0 0.0 0.0 0.0 0.0 owned by others Mantenimiento y reparaciones n.i.o.p. 46.6 42.6 37.0 29.9 19.5 12.9 28.8 33.8 19.7 16.4 Maintenance and repair services n.i.e. Transporte 422.8 418.0 441.7 430.8 434.8 472.2 470.0 527.3 482.9 519.7 Transport Transporte marítimo 160.5 151.6 181.0 171.3 189.4 216.0 205.7 200.4 189.6 222.6 Sea transport Pasajeros 0.0 0.0 0.0 0.0 0.0 0.0 0.0 0.0 0.0 0.0 Passenger Flete 0.0 0.0 0.0 0.0 0.0 0.0 0.0 0.0 0.0 0.0 Freight Otros 160.5 151.6 181.0 171.3 189.4 216.0 205.7 200.4 189.6 222.6 Other Transporte aéreo 262.3 266.5 260.7 259.4 245.5 256.2 264.3 326.9 293.3 297.1 Air transport Pasajeros 0.0 0.0 0.0 0.0 0.0 0.0 0.0 35.6 36.8 24.7 Passenger Flete 1.4 1.4 1.3 0.0 0.0 0.3 0.4 0.4 0.4 0.3 Freight Otros 260.9 265.1 259.4 259.4 245.5 255.9 263.9 290.9 256.1 272.1 Other Otras modalidades de transporte 0.0 0.0 0.0 0.0 0.0 0.0 0.0 0.0 0.0 0.0 Other modes of transport Servicios postales y de mensajería 0.0 0.0 0.0 0.0 0.0 0.0 0.0 0.0 0.0 0.0 Postal and courier services Viajes 3,210.7 3,142.8 3,192.9 3,310.6 3,438.6 3,825.0 3,973.5 3,846.8 3,287.8 3,589.8 Travel Construcción 0.0 0.0 0.0 0.0 0.0 0.0 0.0 0.0 0.0 0.0 Construction Servicios de seguros y pensiones 53.0 52.8 52.4 54.8 56.5 45.8 47.6 48.4 46.2 45.4 Insurance and pension services Servicios financieros 539.2 496.2 384.7 284.4 330.2 336.3 390.2 346.8 224.7 239.2 Financial services Cargos por el uso de la propiedad intelectual n.i.o.p. 37.2 35.0 30.4 27.3 31.9 40.0 37.4 57.7 98.0 76.8 Charges for the use of intellectual property n.i.e. Servicios de telecomunicaciones, informática Telecommunications, computer, e información 13.3 10.2 10.3 10.0 9.9 9.4 8.8 10.2 13.6 29.1 and information services Otros servicios empresariales 55.4 54.4 54.9 57.0 60.1 53.3 57.0 72.8 88.7 124.3 Other business services Servicios personales, culturales y recreativos 0.0 0.0 0.0 0.0 0.0 0.0 0.0 0.0 0.0 0.0 Personal, cultural, and recreational services Bienes y servicios del gobierno, n.i.o.p 662.7 604.1 749.5 751.3 730.7 765.0 778.4 815.6 806.4 854.1 Government goods and services n.i.e.
(Continúa - Continue)

Junta de Planificación Planning Board
Balanza de Pagos y Posición de Inversión Internacional de Puerto Rico Puerto Rico Balance of Payments and International Investment Position
9
Año fiscal 2019Fiscal Year 2019
TABLA 4 - SERVICIOS: AÑOS FISCALES (CONT.)TABLE 4 - SERVICES: FISCAL YEARS (CONT.)(En millones de dólares - In millions of dollars)
2010 2011 2012 2013 2014 2015 2016 2017r 2018r 2019p
Débito 3,809.9 3,899.7 3,908.9 3,878.5 3,820.8 3,741.7 3,819.7 3,868.4 3,874.2 4,127.8 Debit Servicios de manufactura sobre insumos físicos Manufacturing services on physical inputs pertenecientes a otros 0.0 0.0 0.0 0.0 0.0 0.0 0.0 0.0 0.0 0.0 owned by others Mantenimiento y reparaciones n.i.o.p. 19.5 5.6 5.0 5.0 4.3 5.4 10.5 21.3 19.8 12.4 Maintenance and repair services n.i.e. Transporte 1,882.5 1,918.3 1,942.4 1,890.1 1,853.6 1,821.6 1,849.2 1,921.0 1,975.4 2,087.4 Transport Transporte marítimo 1,307.5 1,324.3 1,353.0 1,305.8 1,278.6 1,240.6 1,246.2 1,313.0 1,361.2 1,474.9 Sea transport Pasajeros 0.0 0.0 0.0 0.0 0.0 0.0 0.0 0.0 0.0 0.0 Passenger Flete 1,307.5 1,324.3 1,353.0 1,305.8 1,278.6 1,240.6 1,246.2 1,313.0 1,361.2 1,474.9 Freight Otros 0.0 0.0 0.0 0.0 0.0 0.0 0.0 0.0 0.0 0.0 Other Transporte aéreo 575.1 594.0 589.4 584.3 575.0 581.0 603.0 608.0 614.2 612.5 Air transport Pasajeros 373.0 386.1 375.2 359.9 331.1 316.7 338.7 334.2 336.5 323.5 Passenger Flete 201.6 206.8 214.1 224.4 243.9 264.1 264.1 273.7 277.5 288.9 Freight Otros 0.5 1.1 0.2 0.0 0.0 0.1 0.1 0.1 0.2 0.1 Other Otras modalidades de transporte 0.0 0.0 0.0 0.0 0.0 0.0 0.0 0.0 0.0 0.0 Other modes of transport Servicios postales y de mensajería 0.0 0.0 0.0 0.0 0.0 0.0 0.0 0.0 0.0 0.0 Postal and courier services Viajes 808.9 815.8 787.0 781.9 763.2 665.7 719.9 709.5 613.0 714.5 Travel Construcción 0.0 0.0 0.0 0.0 0.0 0.0 0.0 0.0 0.0 0.0 Construction Servicios de seguros y pensiones 448.9 476.6 514.1 512.9 511.1 521.1 564.6 532.3 530.9 599.0 Insurance and pension services Servicios financieros 3.9 6.3 10.4 8.4 8.3 6.0 5.1 5.1 3.5 4.6 Financial services Cargos por el uso de la propiedad intelectual n.i.o.p. 60.7 67.2 76.7 89.5 91.8 94.7 98.2 111.0 149.8 158.9 Charges for the use of intellectual property n.i.e. Servicios de telecomunicaciones, informática Telecommunications, computer, e información 9.2 8.7 8.3 8.2 8.2 7.8 7.7 7.9 8.3 9.0 and information services Otros servicios empresariales 216.9 232.0 290.8 305.1 307.9 329.7 300.9 277.7 282.6 232.6 Other business services Servicios personales, culturales y recreativos 16.3 16.1 16.1 16.7 18.0 25.1 23.7 21.2 20.6 18.6 Personal, cultural, and recreational services Bienes y servicios del gobierno, n.i.o.p 343.1 353.1 258.0 260.6 254.5 264.8 239.9 261.4 270.4 290.9 Government goods and services n.i.e.
r- Cifras revisadas. r- Revised figures. p- Cifras preliminares. p- Preliminary figures.
Fuente: Junta de Planificación, Programa de Planificación Económica y Social, Source: Puerto Rico Planning Board, Program of Economic and Social Planning, Subprograma de Análisis Económico. Subprogram of Economic Analysis.

Junta de Planificación Planning Board
Balanza de Pagos y Posición de Inversión Internacional de Puerto Rico Puerto Rico Balance of Payments and International Investment Position
10
Año fiscal 2019Fiscal Year 2019
TABLA 5 - INGRESO PRIMARIO: AÑOS FISCALES TABLE 5 - PRIMARY INCOME: FISCAL YEARS(En millones de dólares - In millions of dollars)
2010 2011 2012 2013 2014 2015 2016 2017r 2018r 2019p
Crédito 2,818.1 2,630.8 2,631.7 2,727.8 2,452.8 2,340.6 2,369.4 2,427.6 2,729.9 2,717.0 Credit Remuneración de empleados 1,310.2 1,300.5 1,336.9 1,339.0 1,272.5 1,307.4 1,327.8 1,402.8 1,572.8 1,217.0 Compensation of employees Renta de la inversión 1,125.2 920.1 870.0 977.5 806.3 655.9 644.6 665.5 794.1 959.4 Investment income Inversión directa 11.7 14.2 10.4 10.4 12.8 12.5 12.7 21.3 27.9 10.6 Direct investment Renta procedente de participaciones de capital Income on equity y participaciones en fondos de inversión 11.7 14.2 10.4 10.4 12.8 12.5 12.7 21.3 27.9 10.6 and investment fund shares Intereses 0.0 0.0 0.0 0.0 0.0 0.0 0.0 0.0 0.0 0.0 Interest Inversión de cartera 1,113.5 905.9 859.6 967.1 793.5 643.4 632.0 644.2 766.2 948.8 Portfolio investment Renta de la inversión procedente de participaciones Investment income on equity de capital y participaciones en fondos de inversión 3.9 4.7 3.5 3.5 4.3 4.1 4.2 5.8 7.6 3.9 and investment fund shares Intereses 1,107.4 898.6 853.9 961.4 786.5 636.5 624.6 634.9 755.9 941.4 Interest Otra inversión 2.2 2.6 2.3 2.3 2.8 2.9 3.2 3.5 2.8 3.5 Other investment Otro ingreso primario 382.6 410.2 424.7 411.3 374.0 377.4 397.0 359.3 363.0 540.6 Other primary income Otros impuestos a la producción 158.3 177.3 180.4 195.3 160.3 149.3 156.3 120.1 111.8 255.2 Taxes on production and on imports Otros subsidios a la producción 224.3 232.9 244.3 216.0 213.7 228.1 240.7 239.2 251.2 285.4 Subsidies Arriendo 0.0 0.0 0.0 0.0 0.0 0.0 0.0 0.0 0.0 0.0 Rent
Débito 40,784.0 40,797.9 39,898.9 39,715.5 39,791.0 39,794.6 40,348.0 40,695.1 39,766.8 40,760.1 Debit Remuneración de empleados 324.6 207.1 115.9 127.3 122.9 79.1 72.3 82.7 95.0 72.4 Compensation of employees Renta de la inversión 36,872.7 37,213.2 36,138.0 35,936.1 35,907.3 35,872.6 36,388.5 36,560.1 35,599.3 36,362.2 Investment income Inversión directa 32,216.7 32,897.3 31,917.2 32,013.8 32,380.9 32,774.9 33,392.0 34,793.5 34,066.9 35,014.1 Direct investment Renta procedente de participaciones de capital Income on equity y participaciones en fondos de inversión 31,969.1 32,518.4 31,444.5 31,585.9 31,973.1 32,395.6 33,011.5 34,448.3 33,666.4 34,693.2 and investment fund shares Intereses 247.6 379.0 472.7 427.9 407.8 379.3 380.4 345.2 400.5 320.9 Interest Inversión de cartera 4,656.0 4,315.9 4,220.8 3,922.4 3,526.4 3,097.7 2,996.5 1,766.5 1,532.4 1,348.1 Portfolio investment Renta de la inversión procedente de participaciones Investment income on equity de capital y participaciones en fondos de inversión 0.0 0.0 0.0 0.0 0.0 0.0 0.0 0.0 0.0 0.0 and investment fund shares Intereses 4,656.0 4,315.9 4,220.8 3,922.4 3,526.4 3,097.7 2,996.5 1,766.5 1,532.4 1,348.1 Interest Otra inversión 0.0 0.0 0.0 0.0 0.0 0.0 0.0 0.0 0.0 0.0 Other investment Otro ingreso primario 3,586.7 3,377.6 3,645.1 3,652.1 3,760.8 3,843.0 3,887.2 4,052.3 4,072.5 4,325.6 Other primary income Otros impuestos a la producción 92.5 105.1 104.8 104.1 127.3 133.2 137.2 142.7 113.7 216.3 Taxes on production and on imports Otros subsidios a la producción 3,494.3 3,272.5 3,540.3 3,548.0 3,633.5 3,709.7 3,750.0 3,909.6 3,958.8 4,109.3 Subsidies Arriendo 0.0 0.0 0.0 0.0 0.0 0.0 0.0 0.0 0.0 0.0 Rent
r- Cifras revisadas. r- Revised figures. p- Cifras preliminares. p- Preliminary figures.
Fuente: Junta de Planificación, Programa de Planificación Económica y Social, Source: Puerto Rico Planning Board, Program of Economic and Social Planning, Subprograma de Análisis Económico. Subprogram of Economic Analysis.

Junta de Planificación Planning Board
Balanza de Pagos y Posición de Inversión Internacional de Puerto Rico Puerto Rico Balance of Payments and International Investment Position
11
Año fiscal 2019Fiscal Year 2019
TABLA 6 - INGRESO SECUNDARIO: AÑOS FISCALES TABLE 6 - SECONDARY INCOME: FISCAL YEARS(En millones de dólares - In millions of dollars)
2010 2011 2012 2013 2014 2015 2016 2017r 2018r 2019p
Crédito 21,249.9 22,259.9 21,415.3 22,095.6 21,316.0 21,157.3 21,113.9 22,459.9 34,548.6 34,139.9 Credit Gobierno general 5,404.4 6,056.3 4,763.9 4,926.8 4,150.6 3,850.9 3,746.0 3,690.0 8,865.4 10,253.4 General government Impuestos corrientes sobre la renta, el patrimonio, etc. 670.3 791.4 758.1 898.4 822.3 727.3 722.5 617.9 511.2 818.6 Current taxes on income, wealth, etc. Contribuciones sociales 29.4 24.1 20.2 29.9 30.3 33.5 33.9 30.4 30.0 22.3 Social contributions Cooperación externa corriente 4,704.7 5,240.8 3,985.6 3,998.4 3,298.0 3,090.2 2,989.6 3,041.8 8,324.2 9,412.5 Current external cooperation Transferencias corrientes diversas del gobierno general 0.0 0.0 0.0 0.0 0.0 0.0 0.0 0.0 0.0 0.0 Miscellaneous current transfers of general government Sociedades financieras, sociedades no financieras, Financial corporations, nonfinancial corporations, hogares e ISFLSH 15,845.5 16,203.6 16,651.4 17,168.8 17,165.4 17,306.4 17,367.9 18,769.9 25,683.2 23,886.4 households, and NPISHs Transferencias personales (transferencias corrientes Personal transfers (Current transfers between entre hogares residentes y no residentes) 432.3 379.1 390.8 402.4 411.5 427.6 444.3 455.9 467.7 488.4 resident and nonresident households) Otras transferencias corrientes 15,413.2 15,824.5 16,260.6 16,766.4 16,754.0 16,878.8 16,923.5 18,314.0 25,215.5 23,398.0 Other current transfers Ajuste por cambio de los derechos jubilatorios 0.0 0.0 0.0 0.0 0.0 0.0 0.0 0.0 0.0 0.0 Adjustment for change in pension entitlements
Débito 309.7 420.8 195.3 177.9 192.2 202.9 217.9 264.2 218.1 213.2 Debit Gobierno general 63.3 70.2 72.2 76.7 86.6 79.1 86.2 83.9 115.4 126.5 General government Prestaciones sociales 0.0 0.0 0.0 0.0 0.0 0.0 0.0 0.0 0.0 0.0 Social benefits Cooperación externa corriente 0.0 0.0 0.0 0.0 0.0 0.0 0.0 0.0 0.0 0.0 Current external cooperation Transferencias corrientes diversas del gobierno general 63.3 70.2 72.2 76.7 86.6 79.1 86.2 83.9 115.4 126.5 Miscellaneous current transfers of general government Sociedades financieras, sociedades no financieras, Financial corporations, nonfinancial corporations, hogares e ISFLSH 246.4 350.6 123.1 101.2 105.6 123.8 131.6 180.3 102.7 86.7 households, and NPISHs Transferencias personales (transferencias corrientes Personal transfers (Current transfers between entre hogares residentes y no residentes) 94.9 91.6 90.5 89.4 87.7 88.6 90.0 89.6 83.2 84.8 resident and nonresident households) Otras transferencias corrientes 151.5 259.0 32.6 11.9 17.9 35.2 41.6 90.7 19.5 1.9 Other current transfers Ajuste por cambio de los derechos jubilatorios 0.0 0.0 0.0 0.0 0.0 0.0 0.0 0.0 0.0 0.0 Adjustment for change in pension entitlements
r- Cifras revisadas. r- Revised figures. p- Cifras preliminares. p- Preliminary figures. ISFLSH - Instituciones sin fines de lucro que sirven a los hogares. NPISH - Nonprofit institutions serving households.
Fuente: Junta de Planificación, Programa de Planificación Económica y Social, Source: Puerto Rico Planning Board, Program of Economic and Social Planning, Subprograma de Análisis Económico. Subprogram of Economic Analysis.

Junta de Planificación Planning Board
Balanza de Pagos y Posición de Inversión Internacional de Puerto Rico Puerto Rico Balance of Payments and International Investment Position
12
Año fiscal 2019Fiscal Year 2019
TABLA 7 - POSICION DE INVERSION INTERNACIONAL: AÑOS FISCALESTABLE 7 - INTERNATIONAL INVESTMENT POSITION: FISCAL YEARS(En millones de dólares - In millions of dollars)
2010 2011 2012 2013 2014 2015 2016 2017r 2018r 2019p
Adquisición neta de activos financieros 36,874.1 35,697.2 34,244.8 29,829.7 30,870.1 30,212.8 29,108.7 26,214.3 29,512.9 34,760.0 Net acquisition of financial assets Inversión directa 4,258.6 5,565.7 5,724.7 5,523.3 5,859.1 6,259.7 5,614.8 6,733.5 7,968.9 10,423.0 Direct investment Participaciones de capital y participaciones Equity and investment en fondos de inversión 2,233.3 2,396.1 2,655.8 2,775.5 2,852.6 2,992.9 3,059.5 3,117.1 3,065.5 3,132.2 fund shares Instrumentos de deuda 2,025.3 3,169.6 3,068.8 2,747.9 3,006.5 3,266.8 2,555.4 3,616.3 4,903.4 7,290.8 Debt instruments Inversión de cartera 29,507.4 26,404.2 25,925.5 21,647.2 20,949.0 19,694.6 19,101.9 17,824.3 20,181.4 22,918.0 Portfolio investment Participaciones de capital y participaciones Equity and investment en fondos de inversión 16,661.4 15,153.1 14,489.0 13,059.5 13,670.6 14,667.4 16,105.8 15,013.6 17,143.0 19,443.9 fund shares Títulos de deuda 12,846.0 11,251.1 11,436.5 8,587.7 7,278.4 5,027.2 2,996.1 2,810.8 3,038.3 3,474.1 Debt securities Derivados financieros (distintos de reservas) y opciones Financial derivatives (other than reserves) and de compra de acciones por parte de empleados 0.0 0.0 0.0 0.0 0.0 0.0 0.0 0.0 0.0 0.0 employee stock options Otra inversión 3,108.1 3,727.3 2,594.6 2,659.1 4,062.0 4,258.5 4,392.0 1,656.5 1,362.7 1,419.0 Other investment Otra equidad 0.0 0.0 0.0 0.0 0.0 0.0 0.0 0.0 0.0 0.0 Other equity Instrumentos de deuda 3,108.1 3,727.3 2,594.6 2,659.1 4,062.0 4,258.5 4,392.0 1,656.5 1,362.7 1,419.0 Debt instruments Activos de reserva 0.0 0.0 0.0 0.0 0.0 0.0 0.0 0.0 0.0 0.0 Reserve assets
Pasivos netos incurridos 173,566.7 182,198.0 176,435.1 168,252.5 161,453.8 159,732.1 159,664.5 143,530.8 143,621.3 149,911.4 Net incurrence of liabilities Inversión directa 77,007.8 80,297.4 78,674.0 79,831.9 81,594.1 84,499.7 85,147.5 86,516.7 85,890.4 94,418.9 Direct investment Participaciones de capital y participaciones Equity and investment en fondos de inversión 3,911.3 5,118.0 5,270.7 5,091.6 5,407.8 5,784.6 5,195.1 6,237.7 7,391.2 9,780.7 fund shares Instrumentos de deuda 73,096.6 75,179.4 73,403.3 74,740.3 76,186.3 78,715.1 79,952.4 80,279.0 78,499.2 84,638.3 Debt instruments Inversión de cartera 93,320.8 98,650.8 94,532.6 85,875.5 77,465.4 73,508.9 72,829.0 56,994.3 55,795.2 52,215.9 Portfolio investment Participaciones de capital y participaciones Equity and investment en fondos de inversión 19,650.1 15,468.9 15,397.0 11,750.4 10,023.1 11,322.1 10,976.2 1,076.7 1,021.1 789.6 fund shares Títulos de deuda 73,670.8 83,181.9 79,135.6 74,125.1 67,442.3 62,186.8 61,852.8 55,917.6 54,774.1 51,426.3 Debt securities Derivados financieros (distintos de reservas) y opciones Financial derivatives (other than reserves) and de compra de acciones por parte de empleados 0.0 0.0 0.0 0.0 0.0 0.0 0.0 0.0 0.0 0.0 employee stock options Otra inversión 3,238.0 3,249.8 3,228.5 2,545.1 2,394.3 1,723.4 1,688.0 19.8 1,935.6 3,276.5 Other investment Otra equidad 0.0 0.0 0.0 0.0 0.0 0.0 0.0 0.0 0.0 0.0 Other equity Instrumentos de deuda 3,238.0 3,249.8 3,228.5 2,545.1 2,394.3 1,723.4 1,688.0 19.8 1,935.6 3,276.5 Debt instruments
r- Cifras revisadas. r- Revised figures. p- Cifras preliminares. p- Preliminary figures.
Fuente: Junta de Planificación, Programa de Planificación Económica y Social, Source: Puerto Rico Planning Board, Program of Economic and Social Planning, Subprograma de Análisis Económico. Subprogram of Economic Analysis.

SuplementoSupplement


Junta de Planificación Planning Board
Balanza de Pagos y Posición de Inversión Internacional de Puerto Rico Puerto Rico Balance of Payments and International Investment Position
15
Año fiscal 2019Fiscal Year 2019
TABLA S.1 - MOVIMIENTO DE PASAJEROS ENTRE PUERTO RICO Y EL EXTERIOR*: AÑOS FISCALESTABLE S.1 - PASSENGER TRAFFIC TO AND FROM OVERSEAS COUNTRIES*: FISCAL YEARS(En miles de personas - In thousands of persons)
2010 2011 2012 2013 2014 2015 2016 2017r 2018r 2019p
Llegadas 4,563.4 4,375.7 4,274.5 4,401.9 4,437.4 4,366.7 5,027.4 4,673.3 4,034.5 4,363.8 Arrivals
Estados Unidos 3,691.4 3,591.9 3,503.2 3,675.7 3,752.6 3,697.3 4,311.6 3,983.1 3,483.4 3,701.4 United States Países extranjeros 658.7 586.5 583.3 530.3 513.7 518.0 545.5 509.0 408.6 504.3 Foreign countries Islas Vírgenes 213.2 197.3 188.0 195.9 171.1 151.4 170.2 181.2 142.5 158.1 Virgin Islands
Salidas 4,605.0 4,410.6 4,331.5 4,440.7 4,448.0 4,755.3 4,958.1 4,738.1 4,196.4 4,364.0 Departures
Estados Unidos 3,750.3 3,652.4 3,576.4 3,728.5 3,748.7 4,079.7 4,251.5 4,066.5 3,640.1 3,722.3 United States Países extranjeros 654.7 581.9 585.0 522.7 520.3 527.6 545.6 513.1 412.6 501.2 Foreign countries Islas Vírgenes 200.0 176.3 170.1 189.5 179.1 147.9 161.0 158.5 143.7 140.5 Virgin Islands
Balance neto, total (41.6) (34.8) (57.0) (38.8) (10.7) (388.6) 69.3 (64.8) (161.9) (0.2) Net balance, total
Estados Unidos (58.9) (60.5) (73.2) (52.8) 4.0 (382.4) 60.1 (83.4) (156.7) (20.9) United States Países extranjeros 4.1 4.7 (1.7) 7.6 (6.6) (9.7) 0.0 (4.1) (4.0) 3.0 Foreign countries Islas Vírgenes 13.2 21.0 17.9 6.4 (8.1) 3.4 9.3 22.7 (1.2) 17.7 Virgin Islands
r- Cifras revisadas. r- Revised figures. p- Cifras preliminares. p- Preliminary figures. * Excluye los viajeros en barcos cruceros y militares en licencia. * Excludes cruise ship travelers and transient military personnel. Nota: El balance neto total no equivale necesariamente Note: The total net balance does not necessarily equals al balance neto migratorio de Puerto Rico. Puerto Rico's net migratory net balance.
Fuente: Junta de Planificación, Programa de Planificación Económica y Social, Source: Puerto Rico Planning Board, Program of Economic and Social Planning, Subprograma de Análisis Económico. Subprogram of Economic Analysis.
Junta de Planificación Planning Board
Balanza de Pagos y Posición de Inversión Internacional de Puerto Rico Puerto Rico Balance of Payments and International Investment Position
16
Año fiscal 2019Fiscal Year 2019
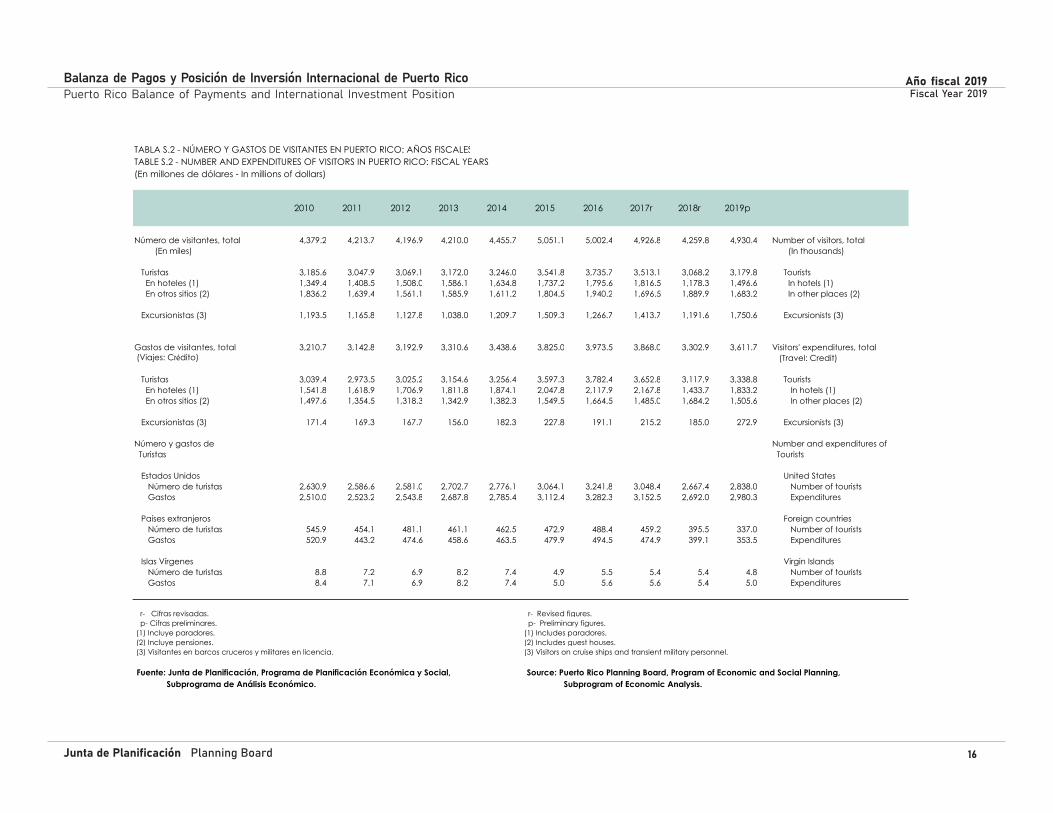
TABLA S.2 - NÚMERO Y GASTOS DE VISITANTES EN PUERTO RICO: AÑOS FISCALESTABLE S.2 - NUMBER AND EXPENDITURES OF VISITORS IN PUERTO RICO: FISCAL YEARS(En millones de dólares - In millions of dollars)
2010 2011 2012 2013 2014 2015 2016 2017r 2018r 2019p
Número de visitantes, total 4,379.2 4,213.7 4,196.9 4,210.0 4,455.7 5,051.1 5,002.4 4,926.8 4,259.8 4,930.4 Number of visitors, total (En miles) (In thousands)
Turistas 3,185.6 3,047.9 3,069.1 3,172.0 3,246.0 3,541.8 3,735.7 3,513.1 3,068.2 3,179.8 Tourists En hoteles (1) 1,349.4 1,408.5 1,508.0 1,586.1 1,634.8 1,737.2 1,795.6 1,816.5 1,178.3 1,496.6 In hotels (1) En otros sitios (2) 1,836.2 1,639.4 1,561.1 1,585.9 1,611.2 1,804.5 1,940.2 1,696.5 1,889.9 1,683.2 In other places (2)
Excursionistas (3) 1,193.5 1,165.8 1,127.8 1,038.0 1,209.7 1,509.3 1,266.7 1,413.7 1,191.6 1,750.6 Excursionists (3)
Gastos de visitantes, total 3,210.7 3,142.8 3,192.9 3,310.6 3,438.6 3,825.0 3,973.5 3,868.0 3,302.9 3,611.7 Visitors' expenditures, total (Viajes: Crédito) (Travel: Credit)
Turistas 3,039.4 2,973.5 3,025.2 3,154.6 3,256.4 3,597.3 3,782.4 3,652.8 3,117.9 3,338.8 Tourists En hoteles (1) 1,541.8 1,618.9 1,706.9 1,811.8 1,874.1 2,047.8 2,117.9 2,167.8 1,433.7 1,833.2 In hotels (1) En otros sitios (2) 1,497.6 1,354.5 1,318.3 1,342.9 1,382.3 1,549.5 1,664.5 1,485.0 1,684.2 1,505.6 In other places (2)
Excursionistas (3) 171.4 169.3 167.7 156.0 182.3 227.8 191.1 215.2 185.0 272.9 Excursionists (3)
Número y gastos de Number and expenditures of Turistas Tourists
Estados Unidos United States Número de turistas 2,630.9 2,586.6 2,581.0 2,702.7 2,776.1 3,064.1 3,241.8 3,048.4 2,667.4 2,838.0 Number of tourists Gastos 2,510.0 2,523.2 2,543.8 2,687.8 2,785.4 3,112.4 3,282.3 3,152.5 2,692.0 2,980.3 Expenditures
Países extranjeros Foreign countries Número de turistas 545.9 454.1 481.1 461.1 462.5 472.9 488.4 459.2 395.5 337.0 Number of tourists Gastos 520.9 443.2 474.6 458.6 463.5 479.9 494.5 474.9 399.1 353.5 Expenditures
Islas Vírgenes Virgin Islands Número de turistas 8.8 7.2 6.9 8.2 7.4 4.9 5.5 5.4 5.4 4.8 Number of tourists Gastos 8.4 7.1 6.9 8.2 7.4 5.0 5.6 5.6 5.4 5.0 Expenditures
r- Cifras revisadas. r- Revised figures. p- Cifras preliminares. p- Preliminary figures. (1) Incluye paradores. (1) Includes paradores. (2) Incluye pensiones. (2) Includes guest houses. (3) Visitantes en barcos cruceros y militares en licencia. (3) Visitors on cruise ships and transient military personnel.
Fuente: Junta de Planificación, Programa de Planificación Económica y Social, Source: Puerto Rico Planning Board, Program of Economic and Social Planning, Subprograma de Análisis Económico. Subprogram of Economic Analysis.

Junta de Planificación Planning Board
Balanza de Pagos y Posición de Inversión Internacional de Puerto Rico Puerto Rico Balance of Payments and International Investment Position
17
Año fiscal 2019Fiscal Year 2019
TABLA S.3 - NÚMERO Y GASTOS DE VIAJE DE LOS RESIDENTES DE PUERTO RICO: AÑOS FISCALESTABLE S.3 - NUMBER AND TRAVEL EXPENDITURES OF PUERTO RICO RESIDENTS: FISCAL YEARS (En millones de dólares - In millions of dollars)
2010 2011 2012 2013 2014 2015 2016 2017r 2018r 2019p
Número de viajeros (en miles) 979.7 923.7 875.9 838.5 792.6 745.8 849.8 783.6 677.3 765.5 Number of travelers (In thousands) Pasajes (1) 370.6 380.1 369.2 357.4 324.6 310.9 332.4 329.7 332.4 315.4 Passenger fares (1) Gastos (Viajes: Débito) 808.9 815.8 787.0 781.9 763.2 665.7 719.9 730.2 681.1 714.5 Expenditures (Travel: Debit)
Estados Unidos United States Número de viajeros 678.4 626.2 608.5 589.9 562.9 547.2 577.8 572.3 509.6 501.7 Number of travelers Pasajes 289.4 280.1 283.3 283.8 257.0 251.3 266.7 262.4 266.7 228.5 Passenger fares Gastos 622.0 627.6 618.7 625.7 619.2 540.0 546.0 552.4 546.0 499.5 Expenditures
Países extranjeros Foreign countries Número de viajeros 108.8 127.8 101.5 66.1 57.8 54.8 68.5 56.1 51.0 173.6 Number of travelers Pasajes 36.5 61.8 49.7 33.8 28.9 27.3 30.1 32.5 30.1 74.4 Passenger fares Gastos 71.1 86.7 68.9 46.2 39.6 37.8 48.8 53.9 37.9 159.3 Expenditures
Islas Vírgenes Virgin Islands Número de viajeros 192.5 169.7 165.9 182.6 172.0 143.8 203.5 155.2 116.7 90.2 Number of travelers Pasajes 44.7 38.2 36.2 39.8 38.7 32.3 35.6 34.9 35.6 12.5 Passenger fares Gastos 115.8 101.5 99.4 110.0 104.4 87.9 125.1 123.8 97.2 55.7 Expenditures
r- Cifras revisadas. r- Revised figures. p- Cifras preliminares. p- Preliminary figures. (1) Incluídos en la cuenta de transportación. (1) Included in transportation account.
Fuente: Junta de Planificación, Programa de Planificación Económica y Social, Source: Puerto Rico Planning Board, Program of Economic and Social Planning, Subprograma de Análisis Económico. Subprogram of Economic Analysis.

Junta de Planificación Planning Board
Balanza de Pagos y Posición de Inversión Internacional de Puerto Rico Puerto Rico Balance of Payments and International Investment Position
18
Año fiscal 2019Fiscal Year 2019
TABLA S.4 - GASTOS NETOS DE FUNCIONAMIENTO DE LAS AGENCIAS FEDERALES EN PUERTO RICO: AÑOS FISCALES TABLE S.4 - NET OPERATING EXPENDITURES OF FEDERAL AGENCIES IN PUERTO RICO: FISCAL YEARS (En millones de dólares - In millions of dollars)
2010 2011 2012 2013 2014 2015 2016 2017r 2018r 2019p
Total 1,480.9 1,408.0 1,694.6 1,697.4 1,629.3 1,704.6 1,764.4 1,838.0 1,952.6 1,615.7 Total
Agencias para la defensa nacional 767.1 743.0 893.6 895.7 859.8 899.5 928.0 971.6 848.7 852.9 National defense agencies
Departamento de Asuntos del Veterano 513.7 414.5 498.5 499.7 479.6 501.8 517.7 542.0 393.1 475.8 Department of Veterans' Affairs Departamento de la Defensa 253.4 328.5 395.1 396.0 380.2 397.7 410.3 429.6 455.6 377.1 Department of Defense
Otras agencias 713.8 665.0 801.0 801.7 769.5 805.1 836.4 866.4 1,103.9 762.8 Other agencies
Administración de Pequeños Negocios 2.6 2.4 2.8 2.8 2.7 2.9 2.9 3.0 3.3 2.7 Small Business Administration Administración de Servicios Generales 42.8 35.5 42.7 42.8 41.1 43.0 46.5 46.4 49.2 40.7 General Services Administration Departamento de Agricultura 47.4 41.4 49.7 49.9 47.9 50.1 51.7 54.1 57.4 47.5 Department of Agriculture Departamento de Comercio 16.2 13.4 16.1 16.1 15.5 16.2 16.7 17.5 18.6 15.3 Department of Commerce Departamento de Justicia 105.1 87.1 104.8 105.0 100.8 105.5 108.8 113.9 120.8 99.9 Department of Justice Departamento de lo Interior 12.0 9.9 11.9 12.0 11.5 12.0 12.4 13.0 13.8 11.4 Department of the Interior Departamento de Salud Department of Health y Servicios Humanos 72.4 60.0 72.2 72.3 69.4 72.6 78.5 78.4 83.2 68.9 and Human Services Departamento de Seguridad Nacional 126.9 183.0 220.1 220.6 211.7 221.5 228.5 239.2 253.8 210.1 Departament of Homeland Security Departamento del Tesoro (1) 48.6 40.8 49.1 49.2 47.3 49.5 51.0 53.4 38.8 46.9 Department of the Treasury (1) Departamento del Trabajo (2.5) (2.1) (2.5) (2.5) (2.4) (2.5) (2.6) (2.7) (1.0) (2.3) Department of Labor Departamento de Transportación (1) 35.3 29.3 35.2 35.3 33.9 35.4 36.6 38.3 40.6 33.6 Department of Transportation (1) Departamento de Vivienda y Desarrollo Department of Housing and Urban Urbano 8.7 7.2 8.7 8.7 8.4 8.8 9.0 9.5 10.0 8.4 Development Servicio Postal 119.0 88.3 106.2 106.5 102.2 106.9 110.3 115.5 103.1 101.4 Postal Service Otras agencias 79.2 68.8 84.0 82.9 79.6 83.2 86.0 86.9 312.3 78.3 Other agencies
r- Cifras revisadas. r- Revised figures. p- Cifras preliminares. p- Preliminary figures.(1) A partir del año fiscal 2004, ciertos programas incluidos previamente en esta agencia (1) From fiscal year 2004 on, certain programs included previously in this agency han sido transferidos al Departamento de Seguridad Nacional. have been transferred to the Departament of Homeland Security. Nota: La contribución del gobierno federal a sistemas de seguridad social Note: Federal government contribution to social insurance systems está incluida dentro de los gastos de cada una de las agencias. is included within the expenditures of each of the agencies.
Fuente: Junta de Planificación, Programa de Planificación Económica y Social, Source: Puerto Rico Planning Board, Program of Economic and Social Planning, Subprograma de Análisis Económico. Subprogram of Economic Analysis.

Junta de Planificación Planning Board
Balanza de Pagos y Posición de Inversión Internacional de Puerto Rico Puerto Rico Balance of Payments and International Investment Position
19
Año fiscal 2019Fiscal Year 2019
TABLA S.5 - TRANSFERENCIAS ENTRE PUERTO RICO Y EL GOBIERNO FEDERAL, GOBIERNOS ESTATALES Y OTROS NO RESIDENTES: AÑOS FISCALESTABLE S.5 - TRANSFERS BETWEEN PUERTO RICO AND THE FEDERAL GOVERNMENT, STATE GOVERNMENTS, AND OTHER NONRESIDENTS: FISCAL YEARS(En millones de dólares - In millions of dollars)
2010 2011 2012 2013 2014 2015 2016 2017r 2018r 2019p
Total de recibos 16,504.1 17,050.2 17,463.5 18,106.0 17,980.5 18,017.0 18,077.0 19,321.5 26,119.7 24,779.4 Total receipts
Gobierno federal, total 15,584.8 15,986.6 16,482.5 16,966.8 16,952.6 17,091.2 17,147.5 18,533.7 25,358.4 23,661.9 Federal government, total Transferencias a individuos 15,351.9 15,753.7 16,238.2 16,750.8 16,738.9 16,863.1 16,906.8 18,294.5 25,107.2 23,376.5 Transfers to individuals Beneficios a veteranos 732.9 836.9 898.8 806.5 869.2 1,416.3 1,229.5 1,762.0 1,169.8 1,221.5 Veteran benefits Beneficios de Medicare 2,528.7 2,603.3 3,187.6 4,147.9 4,481.0 4,466.6 4,511.4 5,429.6 6,526.2 5,220.6 Medicare benefits Beneficios de Seguro Social 7,073.9 7,319.9 7,549.2 7,928.6 7,354.2 7,718.3 7,820.2 7,875.0 7,201.6 6,783.7 Social Security benefits Becas 862.9 918.7 1,011.5 894.7 908.8 788.7 780.3 666.2 861.6 833.5 Scholarships Subsidio de intereses sobre Student loan préstamos a estudiantes 14.2 18.1 28.3 14.1 18.0 19.6 21.4 21.5 22.2 22.7 interest subsidies Pensiones del sistema federal United States civil service de retiro 286.8 309.8 314.4 134.3 138.2 141.4 142.8 147.6 152.4 148.5 retirement pensions Ayuda para la vivienda 557.0 569.8 587.3 630.0 791.3 216.3 208.4 276.6 568.3 1,023.7 Housing assistance Asistencia Nutricional 1,605.2 1,766.8 1,897.4 1,868.4 1,868.7 1,846.2 1,907.5 1,893.8 2,282.1 2,728.2 Nutritional Assistance Ayuda para familias en Assistance to families áreas de desastre 6.6 10.3 41.1 29.0 10.5 9.1 4.0 2.0 0.0 0.0 in disaster areas Transferencias a instituciones Transfers to private non privadas sin fines de lucro (1) 52.6 41.6 71.2 88.0 60.4 36.1 31.5 43.5 46.4 190.3 profit institutions (1) Cancelaciones de préstamos 2.2 2.2 2.3 10.3 10.5 11.0 11.1 11.7 11.7 12.9 Cancellation of loans Indemnización por muerte e incapacidad 11.0 5.6 10.9 5.4 5.6 5.7 1.0 -24.7 0.6 b/ Death and disability indemnization Otros (2) 1,618.0 1,350.8 638.1 193.5 222.4 188.0 237.7 189.7 6,264.3 5,190.8 Others (2)
Subsidios a industrias 232.9 232.9 244.3 216.0 213.7 228.1 240.7 239.2 251.2 285.4 Subsidies to industries Sector gubernamental 232.4 232.4 243.8 215.5 213.2 227.6 240.2 238.8 251.2 285.4 Government sector Sector privado, Workforce Private sector, Workforce Investment Act 0.5 0.5 0.5 0.5 0.5 0.5 0.5 0.5 0.0 0.0 Investment Act
Gobiernos estatales de E.E.U.U. 29.4 24.1 20.2 29.9 30.3 33.5 33.9 30.4 30.0 22.3 U.S. state governments
Otros no residentes 889.9 1,039.5 960.8 1,109.3 997.6 892.3 895.6 757.4 731.3 1,095.2 Other nonresidents
(Continúa - Continue)
Junta de Planificación Planning Board
Balanza de Pagos y Posición de Inversión Internacional de Puerto Rico Puerto Rico Balance of Payments and International Investment Position
20
Año fiscal 2019Fiscal Year 2019
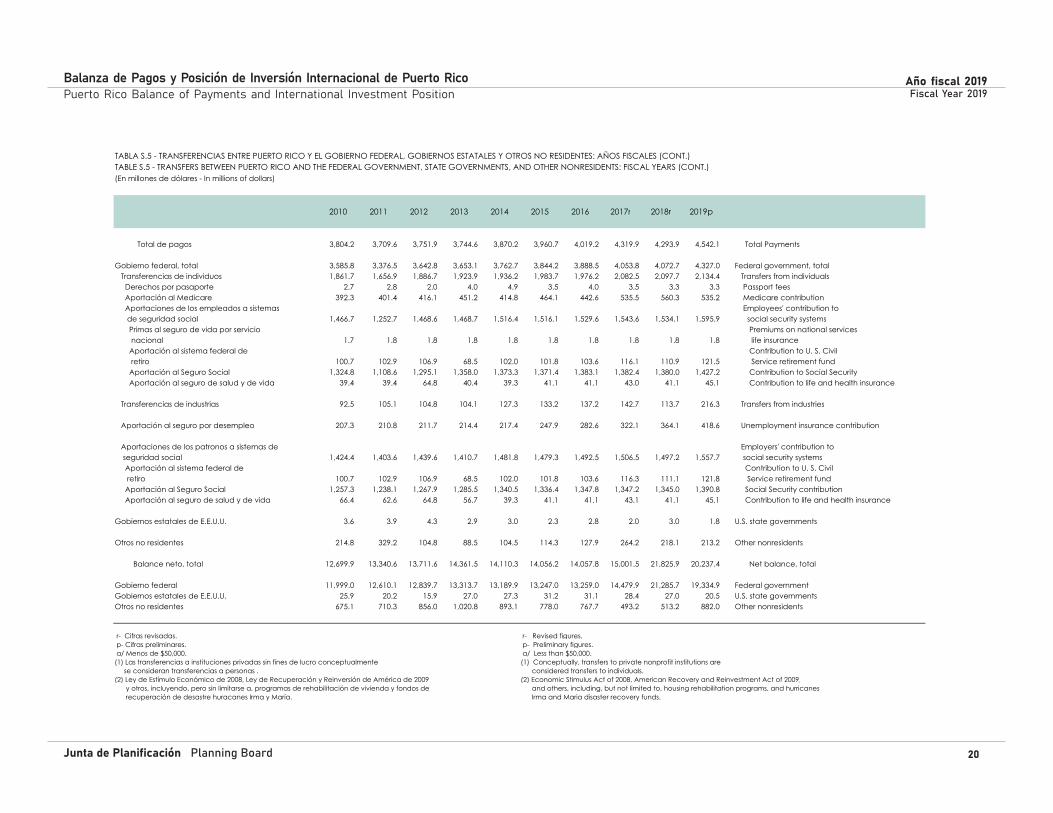
TABLA S.5 - TRANSFERENCIAS ENTRE PUERTO RICO Y EL GOBIERNO FEDERAL, GOBIERNOS ESTATALES Y OTROS NO RESIDENTES: AÑOS FISCALES (CONT.)TABLE S.5 - TRANSFERS BETWEEN PUERTO RICO AND THE FEDERAL GOVERNMENT, STATE GOVERNMENTS, AND OTHER NONRESIDENTS: FISCAL YEARS (CONT.)(En millones de dólares - In millions of dollars)
2010 2011 2012 2013 2014 2015 2016 2017r 2018r 2019p
Total de pagos 3,804.2 3,709.6 3,751.9 3,744.6 3,870.2 3,960.7 4,019.2 4,319.9 4,293.9 4,542.1 Total Payments
Gobierno federal, total 3,585.8 3,376.5 3,642.8 3,653.1 3,762.7 3,844.2 3,888.5 4,053.8 4,072.7 4,327.0 Federal government, total Transferencias de individuos 1,861.7 1,656.9 1,886.7 1,923.9 1,936.2 1,983.7 1,976.2 2,082.5 2,097.7 2,134.4 Transfers from individuals Derechos por pasaporte 2.7 2.8 2.0 4.0 4.9 3.5 4.0 3.5 3.3 3.3 Passport fees Aportación al Medicare 392.3 401.4 416.1 451.2 414.8 464.1 442.6 535.5 560.3 535.2 Medicare contribution Aportaciones de los empleados a sistemas Employees' contribution to de seguridad social 1,466.7 1,252.7 1,468.6 1,468.7 1,516.4 1,516.1 1,529.6 1,543.6 1,534.1 1,595.9 social security systems Primas al seguro de vida por servicio Premiums on national services nacional 1.7 1.8 1.8 1.8 1.8 1.8 1.8 1.8 1.8 1.8 life insurance Aportación al sistema federal de Contribution to U. S. Civil retiro 100.7 102.9 106.9 68.5 102.0 101.8 103.6 116.1 110.9 121.5 Service retirement fund Aportación al Seguro Social 1,324.8 1,108.6 1,295.1 1,358.0 1,373.3 1,371.4 1,383.1 1,382.4 1,380.0 1,427.2 Contribution to Social Security Aportación al seguro de salud y de vida 39.4 39.4 64.8 40.4 39.3 41.1 41.1 43.0 41.1 45.1 Contribution to life and health insurance
Transferencias de industrias 92.5 105.1 104.8 104.1 127.3 133.2 137.2 142.7 113.7 216.3 Transfers from industries
Aportación al seguro por desempleo 207.3 210.8 211.7 214.4 217.4 247.9 282.6 322.1 364.1 418.6 Unemployment insurance contribution
Aportaciones de los patronos a sistemas de Employers' contribution to seguridad social 1,424.4 1,403.6 1,439.6 1,410.7 1,481.8 1,479.3 1,492.5 1,506.5 1,497.2 1,557.7 social security systems Aportación al sistema federal de Contribution to U. S. Civil retiro 100.7 102.9 106.9 68.5 102.0 101.8 103.6 116.3 111.1 121.8 Service retirement fund Aportación al Seguro Social 1,257.3 1,238.1 1,267.9 1,285.5 1,340.5 1,336.4 1,347.8 1,347.2 1,345.0 1,390.8 Social Security contribution Aportación al seguro de salud y de vida 66.4 62.6 64.8 56.7 39.3 41.1 41.1 43.1 41.1 45.1 Contribution to life and health insurance
Gobiernos estatales de E.E.U.U. 3.6 3.9 4.3 2.9 3.0 2.3 2.8 2.0 3.0 1.8 U.S. state governments
Otros no residentes 214.8 329.2 104.8 88.5 104.5 114.3 127.9 264.2 218.1 213.2 Other nonresidents
Balance neto, total 12,699.9 13,340.6 13,711.6 14,361.5 14,110.3 14,056.2 14,057.8 15,001.5 21,825.9 20,237.4 Net balance, total
Gobierno federal 11,999.0 12,610.1 12,839.7 13,313.7 13,189.9 13,247.0 13,259.0 14,479.9 21,285.7 19,334.9 Federal governmentGobiernos estatales de E.E.U.U. 25.9 20.2 15.9 27.0 27.3 31.2 31.1 28.4 27.0 20.5 U.S. state governmentsOtros no residentes 675.1 710.3 856.0 1,020.8 893.1 778.0 767.7 493.2 513.2 882.0 Other nonresidents
r- Cifras revisadas. r- Revised figures. p- Cifras preliminares. p- Preliminary figures. a/ Menos de $50,000. a/ Less than $50,000.(1) Las transferencias a instituciones privadas sin fines de lucro conceptualmente (1) Conceptually, transfers to private nonprofit institutions are se consideran transferencias a personas . considered transfers to individuals.(2) Ley de Estímulo Económico de 2008, Ley de Recuperación y Reinversión de América de 2009 (2) Economic Stimulus Act of 2008, American Recovery and Reinvestment Act of 2009, y otros, incluyendo, pero sin limitarse a, programas de rehabilitación de vivienda y fondos de and others, including, but not limited to, housing rehabilitation programs, and hurricanes recuperación de desastre huracanes Irma y María. Irma and Maria disaster recovery funds.
Fuente: Junta de Planificación, Programa de Planificación Económica y Social, Source: Puerto Rico Planning Board, Program of Economic and Social Planning, Subprograma de Análisis Económico. Subprogram of Economic Analysis.

Junta de Planificación Planning Board
Balanza de Pagos y Posición de Inversión Internacional de Puerto Rico Puerto Rico Balance of Payments and International Investment Position
21
Año fiscal 2019Fiscal Year 2019
TABLA S.6 - APORTACIONES FEDERALES AL GOBIERNO DEL E.L.A.: AÑOS FISCALESTABLE S.6 - FEDERAL GRANTS TO THE COMMONWEALTH GOVERNMENT: FISCAL YEARS(En millones de dólares - In millions of dollars)
2010 2011 2012 2013 2014 2015 2016 2017r 2018r 2019p
Total 4,704.7 5,240.8 3,985.3 3,998.4 3,298.0 3,090.2 2,989.6 3,041.8 8,324.2 9,412.5 Total
Gobierno central del E.L.A. 2,496.9 2,619.0 2,470.1 2,530.0 2,424.3 2,452.8 2,372.6 2,368.7 2,615.1 4,160.1 Commonwealth central government Autoridad de Carreteras Highway and Transportation y Transportación (1) 142.8 146.2 123.2 183.6 176.9 124.8 127.0 130.0 197.2 132.6 Authority (1) Comisión para la Seguridad en el Tránsito 2.9 0.0 0.0 10.5 8.2 1.7 1.9 8.3 12.0 13.7 Traffic Safety Commission Compañía de Parques Nacionales 0.1 0.0 0.0 b/ b/ b/ 0.0 0.0 0.0 0.0 National Parks Company Departamento de Agricultura 1.5 0.0 0.2 0.8 4.6 0.5 1.1 1.1 0.0 0.6 Department of Agriculture Departamento de Educación 967.3 1,153.9 1,007.7 879.5 876.6 996.6 820.1 722.2 613.0 789.6 Department of Education Departamento de Justicia 3.7 0.0 27.4 6.7 6.4 7.2 5.4 1.7 13.3 16.0 Department of Justice Departamento de la Familia 228.5 252.4 153.7 122.9 117.3 130.9 158.5 126.8 171.1 176.7 Department of the Family Departamento de la Vivienda 2.7 1.2 1.3 b/ 0.2 0.7 0.4 0.9 0.3 0.1 Department of Housing Departamento de Recreación y Deportes 0.5 0.4 6.7 2.0 6.4 2.7 2.7 2.7 3.7 0.0 Department of Recreation and Sports Departamento de Recursos Naturales Department of Natural y Ambientales 8.7 11.4 11.9 9.3 7.7 8.0 5.9 6.6 4.1 7.7 and Environmental Resources Departamento de Salud 674.4 905.8 838.8 814.3 934.9 829.5 827.8 1,164.5 1,378.5 2,728.5 Department of Health Departamento de Transportación Department of Transportation y Obras Públicas 0.2 1.1 1.1 0.6 b/ 0.6 0.3 0.2 b/ 0.2 and Public Works Departamento del Trabajo y Department of Labor and Recursos Humanos 29.8 25.4 54.6 37.9 40.1 21.1 28.1 27.2 17.2 33.9 Human Resources Guardia Nacional de Puerto Rico 15.3 11.3 4.1 3.0 24.9 19.8 33.3 29.8 94.1 31.0 Puerto Rico National Guard Instituto de Cultura Puertorriqueña 1.0 0.0 0.7 0.0 0.0 0.0 0.0 0.0 0.0 b/ Institute of Puerto Rican Culture Junta de Calidad Ambiental 6.6 0.2 8.4 5.2 7.5 14.9 10.5 8.6 5.6 4.3 Environmental Quality Board Junta de Planificación 0.8 4.0 1.4 5.0 1.2 0.7 1.4 2.7 0.4 0.2 Planning Board Oficina de Asuntos de la Juventud 0.0 0.0 0.0 0.0 b/ 0.0 0.0 0.0 0.0 0.0 Office of Youth Affairs Oficina del Comisionado de Asuntos Office of the Commisioner of Municipal Municipales 1.1 1.1 5.6 0.8 21.9 5.3 3.7 1.3 7.9 0.0 Affairs Oficina de la Defensa Civil b/ b/ b/ b/ b/ b/ b/ b/ 0.1 1.4 Office of Civil Defense Policía de Puerto Rico 13.0 7.6 7.9 2.4 7.1 6.4 7.5 5.9 2.6 1.8 Puerto Rico Police Universidad de Puerto Rico (1) 14.7 16.9 60.2 38.4 39.2 29.7 86.4 65.6 51.5 97.7 University of Puerto Rico (1) Otras agencias (2) 381.1 79.9 155.0 407.2 142.9 251.8 250.6 62.8 42.5 124.0 Other agencies (2)
(Continúa - Continue)

Junta de Planificación Planning Board
Balanza de Pagos y Posición de Inversión Internacional de Puerto Rico Puerto Rico Balance of Payments and International Investment Position
22
Año fiscal 2019Fiscal Year 2019
TABLA S.6 - APORTACIONES FEDERALES AL GOBIERNO DEL E.L.A.: AÑOS FISCALES (CONT.TABLE S.6 - FEDERAL GRANTS TO THE COMMONWEALTH GOVERNMENT: FISCAL YEARS (CONT.)(En millones de dólares - In millions of dollars)
2010 2011 2012 2013 2014 2015 2016 2017r 2018r 2019p
Empresas públicas 272.8 124.4 142.9 113.8 179.4 139.2 171.3 229.5 211.2 156.2 Public enterprises Administración de Derecho al Trabajo 0.0 0.0 0.0 0.0 0.0 0.0 0.0 0.0 0.0 0.0 Right to Employment Administration Autoridad de Acueductos Water and Sewer Authority y Alcantarillados 95.0 69.1 82.9 46.6 35.1 89.1 60.0 0.4 20.6 0.3 Autoridad de Energía Eléctrica b/ a/ 0.0 1.4 54.7 1.0 0.0 0.0 0.4 0.0 Electric Power Authority Autoridad Metropolitana de Autobuses 14.5 38.9 39.7 40.5 41.3 7.0 6.3 10.8 5.1 9.2 Metropolitan Bus Authority Autoridad de los Puertos 156.8 12.1 14.9 24.0 46.7 40.6 98.9 190.9 165.4 138.6 Ports Authority Compañía de Fomento Industrial 0.0 0.0 b/ 0.0 0.3 0.2 0.3 0.5 0.3 b/ Industrial Development Company Estación Experimental Agrícola 4.2 3.6 4.6 0.6 0.6 0.6 0.1 18.2 16.8 5.0 Agricultural Experimental Station Servicio de Extensión Agrícola 2.2 0.7 0.8 0.8 0.7 0.7 0.7 8.8 2.8 3.1 Agricultural Extension Service Otras empresas 0.2 0.0 0.0 0.0 0.0 b/ 5.0 0.0 0.0 0.0 Other enterprises
Municipios 339.1 366.5 394.6 380.2 374.8 243.5 268.7 294.6 351.0 463.3 Municipios Acción Comunal 19.2 20.2 32.2 19.3 23.4 27.5 17.6 26.5 14.8 27.0 Community Action Desarrollo Comunal 120.0 112.4 113.2 126.6 114.4 94.7 118.0 100.9 79.8 148.3 Community Development Head Start 122.4 153.7 194.4 195.0 195.4 111.5 113.3 141.6 138.1 41.6 Head Start Recursos Humanos, Workforce Human Resources, Workforce Investment Act 76.6 79.1 46.8 37.9 39.2 9.6 11.7 22.9 18.7 20.4 Investment Act Otros programas (2) 1.0 1.2 7.9 1.4 2.4 0.3 7.7 2.5 b/ 0.1 Other programs (2)
Fondo en Fideicomiso del Seguro Unemployment Insurance por Desempleo 664.0 612.5 486.6 394.7 282.1 166.4 146.3 127.3 149.8 80.8 Trust Fund
Programa de Comedores Escolares 11.6 14.3 11.2 11.9 12.3 19.4 14.5 11.5 13.2 13.4 School Lunch Program
Fondos de la Agencia Federal para el manejo Federal Emergency Management de Emergencias (FEMA) 20.0 16.1 43.0 18.3 8.7 11.9 6.1 9.8 4,983.8 4,538.8 Agency (FEMA) funds
Ley Americana de Recuperación American Recovery and y Reinversión de 2009 900.3 1,488.0 436.8 549.5 16.4 56.9 10.1 0.4 b/ 0.0 Reinvestment Act of 2009
r- Cifras revisadas. r- Revised figures. p- Cifras preliminares. p- Preliminary figures. a/ Hasta el 2006 se incluyó en otras agencias. a/ Up to 2006, it was included in other agencies. b/ Menos de $50,000. b/ Less than $50,000.
(1) Se considera parte del Gobierno central para efecto de las cuentas nacionales. (1) Considered as part of the Central government for national accounts purposes.(2) Incluye aportaciones adicionales no especificadas o incluidas en las respectivas Agencias. (2) Includes additional grants not elsewhere specified or included in the respective Agencies.
Fuente: Junta de Planificación, Programa de Planificación Económica y Social, Source: Puerto Rico Planning Board, Program of Economic and Social Planning, Subprograma de Análisis Económico. Subprogram of Economic Analysis.
Junta de Planificación Planning Board
Balanza de Pagos y Posición de Inversión Internacional de Puerto Rico Puerto Rico Balance of Payments and International Investment Position
23
Año fiscal 2019Fiscal Year 2019
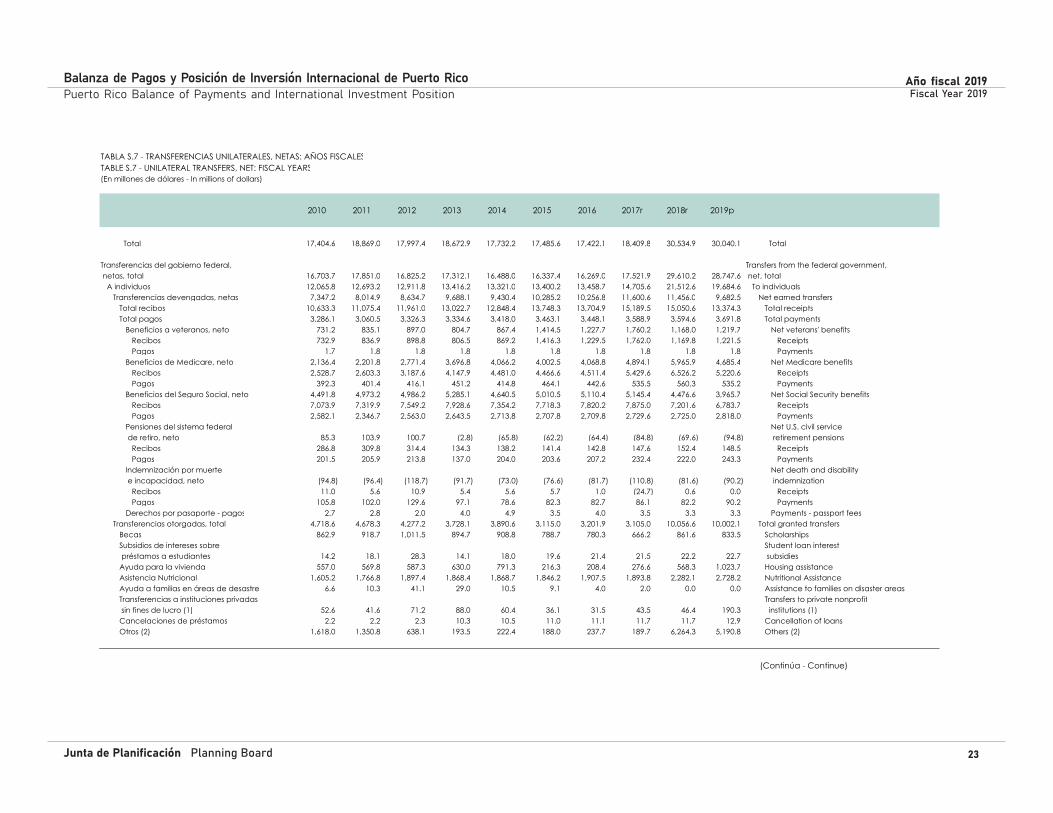
TABLA S.7 - TRANSFERENCIAS UNILATERALES, NETAS: AÑOS FISCALESTABLE S.7 - UNILATERAL TRANSFERS, NET: FISCAL YEARS(En millones de dólares - In millions of dollars)
2010 2011 2012 2013 2014 2015 2016 2017r 2018r 2019p
Total 17,404.6 18,869.0 17,997.4 18,672.9 17,732.2 17,485.6 17,422.1 18,409.8 30,534.9 30,040.1 Total
Transferencias del gobierno federal, Transfers from the federal government, netas, total 16,703.7 17,851.0 16,825.2 17,312.1 16,488.0 16,337.4 16,269.0 17,521.9 29,610.2 28,747.6 net, total A individuos 12,065.8 12,693.2 12,911.8 13,416.2 13,321.0 13,400.2 13,458.7 14,705.6 21,512.6 19,684.6 To individuals Transferencias devengadas, netas 7,347.2 8,014.9 8,634.7 9,688.1 9,430.4 10,285.2 10,256.8 11,600.6 11,456.0 9,682.5 Net earned transfers Total recibos 10,633.3 11,075.4 11,961.0 13,022.7 12,848.4 13,748.3 13,704.9 15,189.5 15,050.6 13,374.3 Total receipts Total pagos 3,286.1 3,060.5 3,326.3 3,334.6 3,418.0 3,463.1 3,448.1 3,588.9 3,594.6 3,691.8 Total payments Beneficios a veteranos, neto 731.2 835.1 897.0 804.7 867.4 1,414.5 1,227.7 1,760.2 1,168.0 1,219.7 Net veterans' benefits Recibos 732.9 836.9 898.8 806.5 869.2 1,416.3 1,229.5 1,762.0 1,169.8 1,221.5 Receipts Pagos 1.7 1.8 1.8 1.8 1.8 1.8 1.8 1.8 1.8 1.8 Payments Beneficios de Medicare, neto 2,136.4 2,201.8 2,771.4 3,696.8 4,066.2 4,002.5 4,068.8 4,894.1 5,965.9 4,685.4 Net Medicare benefits Recibos 2,528.7 2,603.3 3,187.6 4,147.9 4,481.0 4,466.6 4,511.4 5,429.6 6,526.2 5,220.6 Receipts Pagos 392.3 401.4 416.1 451.2 414.8 464.1 442.6 535.5 560.3 535.2 Payments Beneficios del Seguro Social, neto 4,491.8 4,973.2 4,986.2 5,285.1 4,640.5 5,010.5 5,110.4 5,145.4 4,476.6 3,965.7 Net Social Security benefits Recibos 7,073.9 7,319.9 7,549.2 7,928.6 7,354.2 7,718.3 7,820.2 7,875.0 7,201.6 6,783.7 Receipts Pagos 2,582.1 2,346.7 2,563.0 2,643.5 2,713.8 2,707.8 2,709.8 2,729.6 2,725.0 2,818.0 Payments Pensiones del sistema federal Net U.S. civil service de retiro, neto 85.3 103.9 100.7 (2.8) (65.8) (62.2) (64.4) (84.8) (69.6) (94.8) retirement pensions Recibos 286.8 309.8 314.4 134.3 138.2 141.4 142.8 147.6 152.4 148.5 Receipts Pagos 201.5 205.9 213.8 137.0 204.0 203.6 207.2 232.4 222.0 243.3 Payments Indemnización por muerte Net death and disability e incapacidad, neto (94.8) (96.4) (118.7) (91.7) (73.0) (76.6) (81.7) (110.8) (81.6) (90.2) indemnization Recibos 11.0 5.6 10.9 5.4 5.6 5.7 1.0 (24.7) 0.6 0.0 Receipts Pagos 105.8 102.0 129.6 97.1 78.6 82.3 82.7 86.1 82.2 90.2 Payments Derechos por pasaporte - pagos 2.7 2.8 2.0 4.0 4.9 3.5 4.0 3.5 3.3 3.3 Payments - passport fees Transferencias otorgadas, total 4,718.6 4,678.3 4,277.2 3,728.1 3,890.6 3,115.0 3,201.9 3,105.0 10,056.6 10,002.1 Total granted transfers Becas 862.9 918.7 1,011.5 894.7 908.8 788.7 780.3 666.2 861.6 833.5 Scholarships Subsidios de intereses sobre Student loan interest préstamos a estudiantes 14.2 18.1 28.3 14.1 18.0 19.6 21.4 21.5 22.2 22.7 subsidies Ayuda para la vivienda 557.0 569.8 587.3 630.0 791.3 216.3 208.4 276.6 568.3 1,023.7 Housing assistance Asistencia Nutricional 1,605.2 1,766.8 1,897.4 1,868.4 1,868.7 1,846.2 1,907.5 1,893.8 2,282.1 2,728.2 Nutritional Assistance Ayuda a familias en áreas de desastre 6.6 10.3 41.1 29.0 10.5 9.1 4.0 2.0 0.0 0.0 Assistance to families on disaster areas Transferencias a instituciones privadas Transfers to private nonprofit sin fines de lucro (1) 52.6 41.6 71.2 88.0 60.4 36.1 31.5 43.5 46.4 190.3 institutions (1) Cancelaciones de préstamos 2.2 2.2 2.3 10.3 10.5 11.0 11.1 11.7 11.7 12.9 Cancellation of loans Otros (2) 1,618.0 1,350.8 638.1 193.5 222.4 188.0 237.7 189.7 6,264.3 5,190.8 Others (2)
(Continúa - Continue)

Junta de Planificación Planning Board
Balanza de Pagos y Posición de Inversión Internacional de Puerto Rico Puerto Rico Balance of Payments and International Investment Position
24
Año fiscal 2019Fiscal Year 2019
TABLA S.7 - TRANSFERENCIAS UNILATERALES, NETAS: AÑOS FISCALES (CONT.)TABLE S.7 - UNILATERAL TRANSFERS, NET: FISCAL YEARS (CONT.)(En millones de dólares - In millions of dollars)
2010 2011 2012 2013 2014 2015 2016 2017r 2018r 2019p
Subsidios a industrias sector privado (92.0) (104.6) (104.3) (103.6) (126.8) (132.7) (136.7) (142.2) (113.7) (216.3) Subsidies to private sector industries Transferencias devengadas, netas (92.0) (104.6) (104.3) (103.6) (126.8) (132.7) (136.7) (142.2) (113.7) (216.3) Net earned transfers Total recibos 0.5 0.5 0.5 0.5 0.5 0.5 0.5 0.5 0.0 0.0 Total receipts Total pagos 92.5 105.1 104.8 104.1 127.3 133.2 137.2 142.7 113.7 216.3 Total payments Transferencias otorgadas, total 0.0 0.0 0.0 0.0 0.0 0.0 0.0 0.0 0.0 0.0 Total granted transfers Gobierno del E.L.A. 4,729.8 5,262.4 4,017.7 3,999.5 3,293.8 3,069.9 2,947.0 2,958.5 8,211.3 9,279.3 Commonwealth government Transferencias devengadas, netas 4,497.4 5,030.0 3,773.9 3,784.0 3,080.6 2,842.3 2,707.0 2,719.7 7,960.1 8,993.9 Net earned transfers Total recibos 4,704.7 5,240.8 3,985.6 3,998.4 3,298.0 3,090.2 2,989.6 3,041.8 8,324.2 9,412.5 Total receipts Pagos - Fondo en Fideicomiso del Total payments - Unemployment Insurance Seguro por Desempleo 207.3 210.8 211.7 214.4 217.4 247.9 282.6 322.1 364.1 418.6 Trust Fund Transferencias otorgadas, total 232.4 232.4 243.8 215.5 213.2 227.6 240.0 238.8 251.2 285.4 Total granted transfers Subsidios a industrias sector Subsidies to governmental sector gubernamental 232.4 232.4 243.8 215.5 213.2 227.6 240.0 238.8 251.2 285.4 industries
Transferencias de los gobiernos Transfers from U.S. state estatales de EE.UU., netas, total 25.9 20.2 15.9 27.0 27.3 31.2 31.1 28.4 27.0 20.5 governments, net, total Total recibos 29.4 24.1 20.2 29.9 30.3 33.5 33.9 30.4 30.0 22.3 Total receipts Total pagos 3.6 3.9 4.3 2.9 3.0 2.3 2.8 2.0 3.0 1.8 Total payments
Transferencias de otros no residentes, netas, total 675.1 710.3 856.0 1,020.8 893.1 778.0 767.7 493.2 513.2 882.0 Transfers from other nonresidents, net, total Total recibos 889.9 1,039.5 960.8 1,109.3 997.6 892.3 895.6 757.4 731.3 1,095.2 Total receipts Total pagos 214.8 329.2 104.8 88.5 104.5 114.3 127.9 264.2 218.1 213.2 Total payments
Remesas privadas, netas, total 337.4 287.5 300.3 313.0 323.8 339.0 354.3 366.3 384.5 390.0 Private remittances, net, total Total recibos 432.3 379.1 390.8 402.4 411.5 427.6 444.3 455.9 467.7 475.0 Total receipts Total pagos 94.9 91.6 90.5 89.4 87.7 88.6 90.0 89.6 83.2 85.0 Total payments
r- Cifras revisadas. r- Revised figures. p- Cifras preliminares. p- Preliminary figures. a/ Menos de $50,000. a/ Less than $50,000.(1) Las transferencias a instituciones privadas sin fines de lucro conceptualmente (1) Conceptually, transfers to private nonprofit institutions are se consideran transferencias a personas . considered transfers to individuals.
Fuente: Junta de Planificación, Programa de Planificación Económica y Social, Source: Puerto Rico Planning Board, Program of Economic and Social Planning, Subprograma de Análisis Económico. Subprogram of Economic Analysis.

GráficasGraphs


Junta de Planificación Planning Board
Balanza de Pagos y Posición de Inversión Internacional de Puerto Rico Puerto Rico Balance of Payments and International Investment Position
27
Año fiscal 2019Fiscal Year 2019
GRÁFICA 1 - BIENES: AÑOS FISCALESGRAPH 1 - GOODS: FISCAL YEARS
(EN MILLONES DE DÓLARES - IN MILLIONS OF DOLLARS)
0
10,000
20,000
30,000
40,000
50,000
60,000
70,000
80,000
2010 2011 2012 2013 2014 2015 2016 2017 2018 2019
Crédito - Credit Débito - Debit Balance

Junta de Planificación Planning Board
Balanza de Pagos y Posición de Inversión Internacional de Puerto Rico Puerto Rico Balance of Payments and International Investment Position
28
Año fiscal 2019Fiscal Year 2019
GRÁFICA 2 - SERVICIOS: AÑOS FISCALESGRAPH 2 - SERVICES: FISCAL YEARS
(EN MILLONES DE DÓLARES - IN MILLIONS OF DOLLARS)
0
1,000
2,000
3,000
4,000
5,000
6,000
2010 2011 2012 2013 2014 2015 2016 2017 2018 2019
Crédito - Credit Débito - Debit Balance
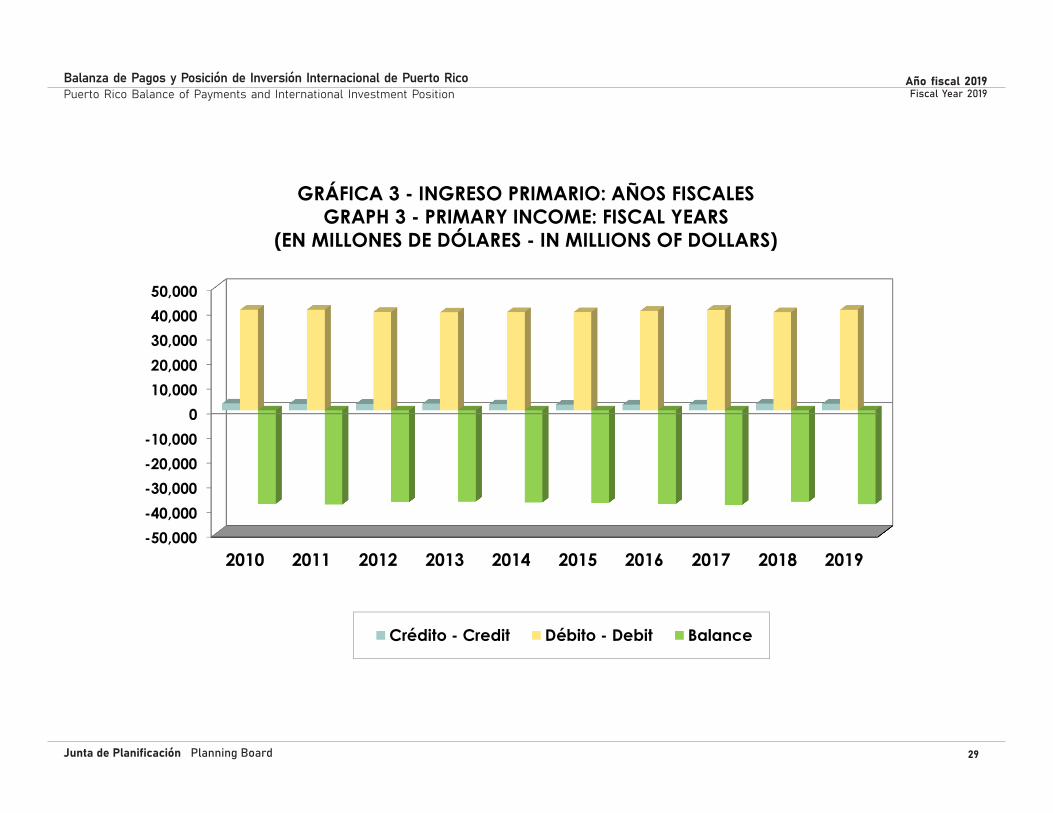
Junta de Planificación Planning Board
Balanza de Pagos y Posición de Inversión Internacional de Puerto Rico Puerto Rico Balance of Payments and International Investment Position
29
Año fiscal 2019Fiscal Year 2019
GRÁFICA 3 - INGRESO PRIMARIO: AÑOS FISCALESGRAPH 3 - PRIMARY INCOME: FISCAL YEARS
(EN MILLONES DE DÓLARES - IN MILLIONS OF DOLLARS)
-50,000-40,000-30,000-20,000-10,000
010,00020,00030,00040,00050,000
2010 2011 2012 2013 2014 2015 2016 2017 2018 2019
Crédito - Credit Débito - Debit Balance

Junta de Planificación Planning Board
Balanza de Pagos y Posición de Inversión Internacional de Puerto Rico Puerto Rico Balance of Payments and International Investment Position
30
Año fiscal 2019Fiscal Year 2019
GRÁFICA 4 - POSICIÓN DE INVERSIÓN INTERNACIONAL: AÑOS FISCALESGRAPH 4 - INTERNATIONAL INVESTMENT POSITION: FISCAL YEARS
(EN MILLONES DE DÓLARES - IN MILLIONS OF DOLLARS)
-200,000
-150,000
-100,000
-50,000
0
50,000
100,000
150,000
200,000
2010 2011 2012 2013 2014 2015 2016 2017 2018 2019
Adquisición neta de activos financieros - Net acquisition of financialassetsPasivos netos incurridos - Net incurrence of liabilities