
CATM Presentation
25
CONFIDENTIAL INVESTOR PRESENTATION Short: Cardtronics, Inc. (CATM) May 2014 Kerrisdale Capital Management, LLC 1212 Avenue of the Americas, 3rd Floor New York, NY 10036 Tel: 212.792.7999 Fax: 212.531.6153 Email: [email protected]
Transcript of CATM Presentation
CONFIDENTIAL INVESTOR PRESENTATION
Short: Cardtronics, Inc. (CATM) May 2014
Kerrisdale Capital Management, LLC 1212 Avenue of the Americas, 3rd Floor
New York, NY 10036 Tel: 212.792.7999 Fax: 212.531.6153
Email: [email protected]
Page 1
We Are Short Shares of Cardtronics, Inc. (CATM)
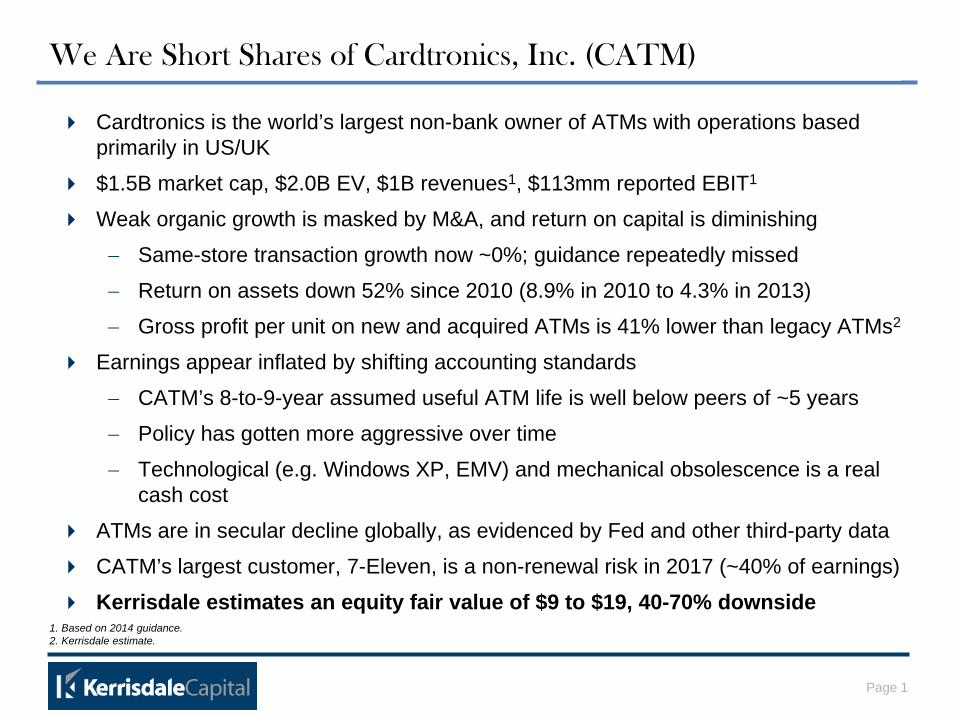
Cardtronics is the world’s largest non-bank owner of ATMs with operations based primarily in US/UK
$1.5B market cap, $2.0B EV, $1B revenues1, $113mm reported EBIT1
Weak organic growth is masked by M&A, and return on capital is diminishing
− Same-store transaction growth now ~0%; guidance repeatedly missed
− Return on assets down 52% since 2010 (8.9% in 2010 to 4.3% in 2013)
− Gross profit per unit on new and acquired ATMs is 41% lower than legacy ATMs2
Earnings appear inflated by shifting accounting standards
− CATM’s 8-to-9-year assumed useful ATM life is well below peers of ~5 years
− Policy has gotten more aggressive over time
− Technological (e.g. Windows XP, EMV) and mechanical obsolescence is a real cash cost
ATMs are in secular decline globally, as evidenced by Fed and other third-party data
CATM’s largest customer, 7-Eleven, is a non-renewal risk in 2017 (~40% of earnings)
Kerrisdale estimates an equity fair value of $9 to $19, 40-70% downside
1. Based on 2014 guidance. 2. Kerrisdale estimate.
Page 2
A Rich Valuation for a Secularly Declining Business
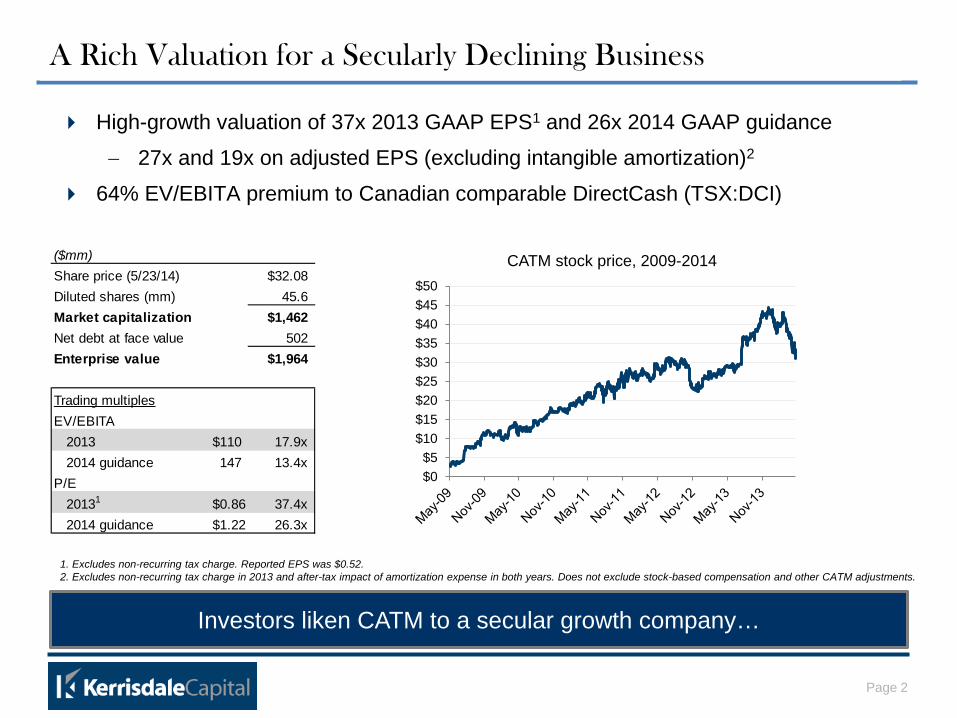
High-growth valuation of 37x 2013 GAAP EPS1 and 26x 2014 GAAP guidance
− 27x and 19x on adjusted EPS (excluding intangible amortization)2
64% EV/EBITA premium to Canadian comparable DirectCash (TSX:DCI)
Investors liken CATM to a secular growth company…
$0$5
$10$15$20$25$30$35$40$45$50
CATM stock price, 2009-2014
1. Excludes non-recurring tax charge. Reported EPS was $0.52. 2. Excludes non-recurring tax charge in 2013 and after-tax impact of amortization expense in both years. Does not exclude stock-based compensation and other CATM adjustments.
($mm)Share price (5/23/14) $32.08Diluted shares (mm) 45.6Market capitalization $1,462Net debt at face value 502Enterprise value $1,964
Trading multiplesEV/EBITA
2013 $110 17.9x2014 guidance 147 13.4x
P/E20131 $0.86 37.4x2014 guidance $1.22 26.3x

Page 3
Business Model at a Glance
Owns 45k machines, operates 22k on behalf of merchants, and performs smaller subset of services for another 14k
− CATM services 80,600 ATM machines in total
ATMs are typically located inside large retailers like 7-Eleven, CVS, and Walgreens
− Revenue shared with merchants with terms defined in multi-year contracts
Main revenue sources: surcharge (46%, paid by user), interchange (34%, paid by user’s bank), branding and surcharge-free access fees (16%, paid by banks)1
− Average revenue per withdrawal: $1.66 (many transactions surcharge-free)
− CATM reports average withdrawals/ATM/month of ~724, while the typical domestic ATM generates 30-70% less volume2
We believe there are a finite number of high-traffic locations, and CATM already owns many of them
As CATM moves further away from prime locations to achieve growth, returns on capital have fallen
1. Based on 1Q14 ATM operating revenue. 2. Source: FreeATM.
…but CATM is a levered bet on paper currency and retail foot traffic
Page 4
Despite its Secular Challenges, CATM Trades at a Premium
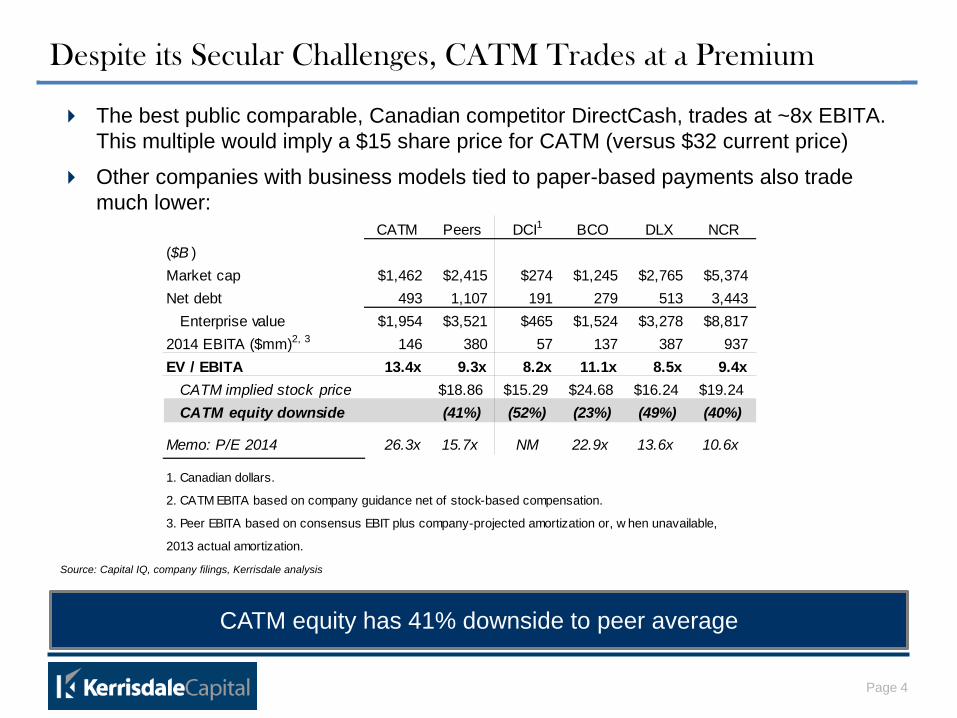
CATM equity has 41% downside to peer average
The best public comparable, Canadian competitor DirectCash, trades at ~8x EBITA. This multiple would imply a $15 share price for CATM (versus $32 current price)
Other companies with business models tied to paper-based payments also trade much lower:
Source: Capital IQ, company filings, Kerrisdale analysis
CATM Peers DCI1 BCO DLX NCR($B )Market cap $1,462 $2,415 $274 $1,245 $2,765 $5,374Net debt 493 1,107 191 279 513 3,443
Enterprise value $1,954 $3,521 $465 $1,524 $3,278 $8,8172014 EBITA ($mm)2, 3 146 380 57 137 387 937EV / EBITA 13.4x 9.3x 8.2x 11.1x 8.5x 9.4x
CATM implied stock price $18.86 $15.29 $24.68 $16.24 $19.24CATM equity downside (41%) (52%) (23%) (49%) (40%)
Memo: P/E 2014 26.3x 15.7x NM 22.9x 13.6x 10.6x
1. Canadian dollars.
2. CATM EBITA based on company guidance net of stock-based compensation.
3. Peer EBITA based on consensus EBIT plus company-projected amortization or, w hen unavailable,
2013 actual amortization.
Page 5
-2%
0%
2%
4%
6%
8%
10%
12%
Mar
-11
Jun-
11
Sep-
11
Dec
-11
Mar
-12
Jun-
12
Sep-
12
Dec
-12
Mar
-13
Jun-
13
Sep-
13
Dec
-13
Mar
-14
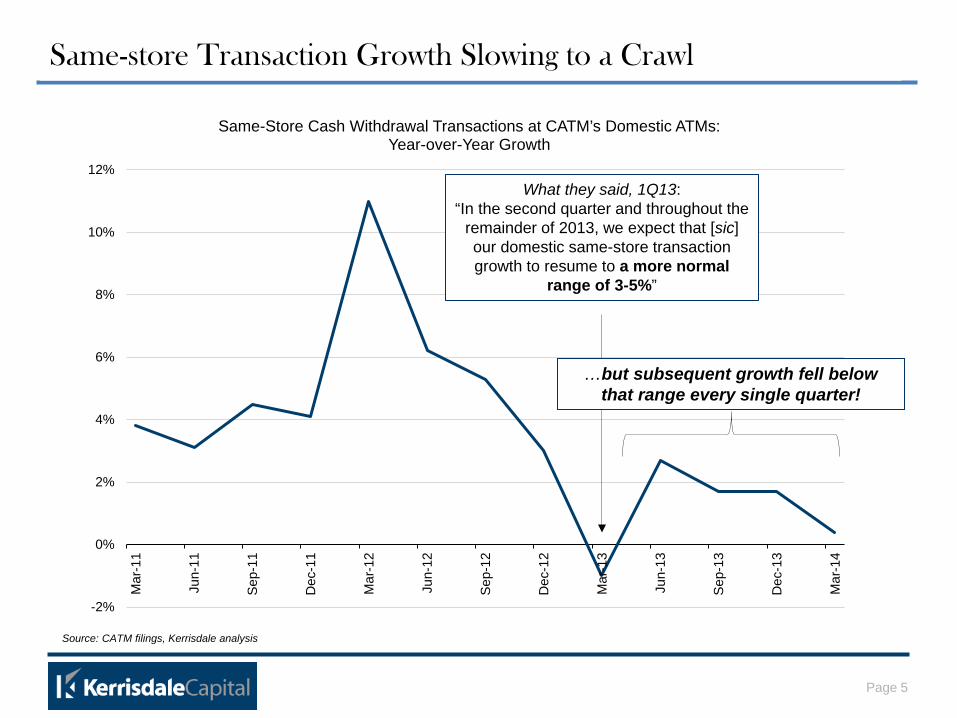
Same-Store Cash Withdrawal Transactions at CATM’s Domestic ATMs: Year-over-Year Growth
Same-store Transaction Growth Slowing to a Crawl
What they said, 1Q13: “In the second quarter and throughout the
remainder of 2013, we expect that [sic] our domestic same-store transaction growth to resume to a more normal
range of 3-5%”
…but subsequent growth fell below that range every single quarter!
Source: CATM filings, Kerrisdale analysis
Page 6
Illustrative DCF Shows Devastating Impact of Secular Decline
Even very mild assumptions about long-term ATM usage point to a far lower stock price
We’ve modeled same-store transactions declining at a modest 1%/year
− Likely very optimistic long-term, as Swedish precedent demonstrates1
Other assumptions:
− Depreciation/maintenance capex based on 5.5-year average ATM life
− Continued growth in organic ATM counts (3%/year)
− Modest operating leverage (fixed ATM-level costs) drives slight margin compression
− 8% WACC (note: high-yield debt issuer)
Results?
− Fair value of ~$9 per share – 72% below the current stock price
1. See e.g. Sveriges Riksbank, “The Swedish Retail-Payment Market,” June 2013.
Page 7
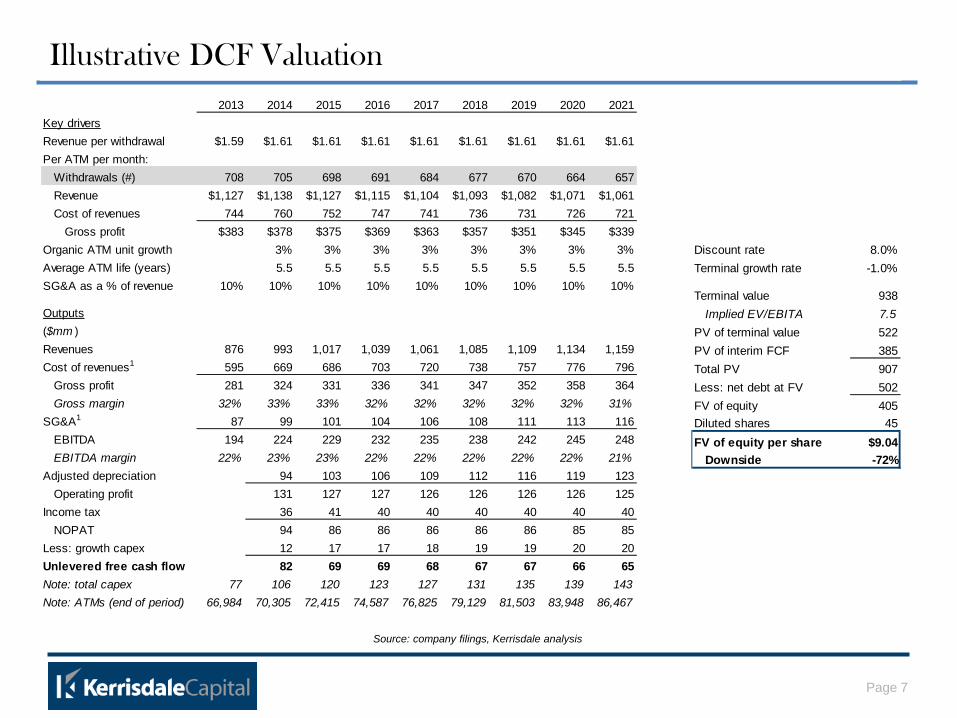
Illustrative DCF Valuation
Source: company filings, Kerrisdale analysis
2013 2014 2015 2016 2017 2018 2019 2020 2021Key driversRevenue per withdrawal $1.59 $1.61 $1.61 $1.61 $1.61 $1.61 $1.61 $1.61 $1.61Per ATM per month:
Withdrawals (#) 708 705 698 691 684 677 670 664 657Revenue $1,127 $1,138 $1,127 $1,115 $1,104 $1,093 $1,082 $1,071 $1,061Cost of revenues 744 760 752 747 741 736 731 726 721
Gross profit $383 $378 $375 $369 $363 $357 $351 $345 $339Organic ATM unit growth 3% 3% 3% 3% 3% 3% 3% 3%Average ATM life (years) 5.5 5.5 5.5 5.5 5.5 5.5 5.5 5.5SG&A as a % of revenue 10% 10% 10% 10% 10% 10% 10% 10% 10%
Outputs($mm )Revenues 876 993 1,017 1,039 1,061 1,085 1,109 1,134 1,159Cost of revenues1 595 669 686 703 720 738 757 776 796
Gross profit 281 324 331 336 341 347 352 358 364Gross margin 32% 33% 33% 32% 32% 32% 32% 32% 31%
SG&A1 87 99 101 104 106 108 111 113 116EBITDA 194 224 229 232 235 238 242 245 248EBITDA margin 22% 23% 23% 22% 22% 22% 22% 22% 21%
Adjusted depreciation 94 103 106 109 112 116 119 123Operating profit 131 127 127 126 126 126 126 125
Income tax 36 41 40 40 40 40 40 40NOPAT 94 86 86 86 86 86 85 85
Less: growth capex 12 17 17 18 19 19 20 20Unlevered free cash flow 82 69 69 68 67 67 66 65Note: total capex 77 106 120 123 127 131 135 139 143Note: ATMs (end of period) 66,984 70,305 72,415 74,587 76,825 79,129 81,503 83,948 86,467
Discount rate 8.0%Terminal growth rate -1.0%
Terminal value 938Implied EV/EBITA 7.5
PV of terminal value 522PV of interim FCF 385Total PV 907Less: net debt at FV 502FV of equity 405Diluted shares 45FV of equity per share $9.04
Downside -72%
Page 8
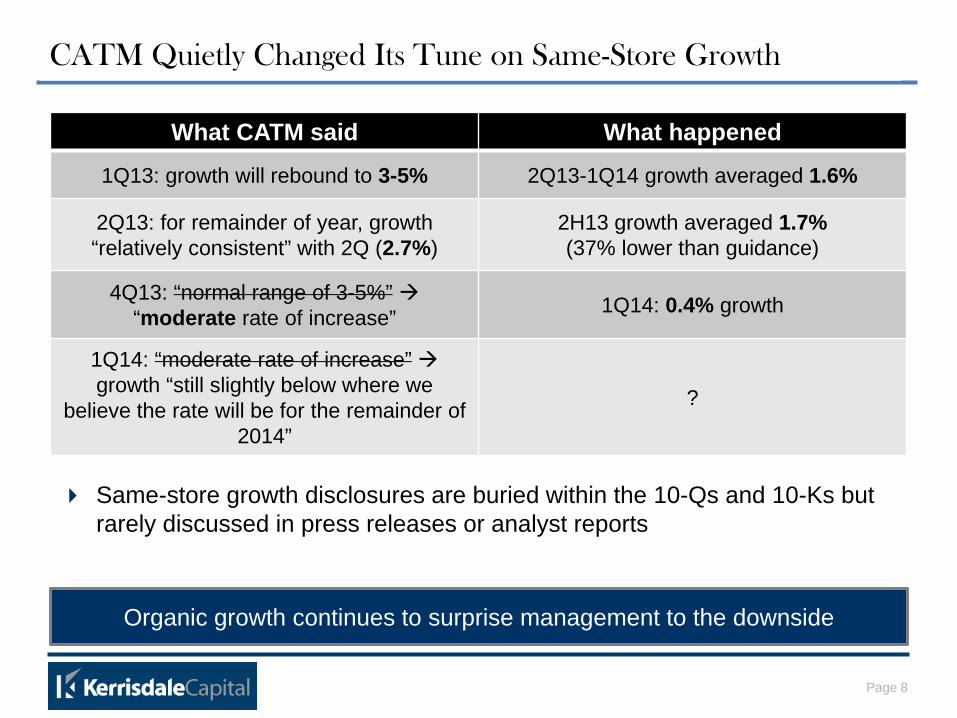
CATM Quietly Changed Its Tune on Same-Store Growth
What CATM said What happened
1Q13: growth will rebound to 3-5% 2Q13-1Q14 growth averaged 1.6%
2Q13: for remainder of year, growth “relatively consistent” with 2Q (2.7%)
2H13 growth averaged 1.7% (37% lower than guidance)
4Q13: “normal range of 3-5%” “moderate rate of increase” 1Q14: 0.4% growth
1Q14: “moderate rate of increase” growth “still slightly below where we
believe the rate will be for the remainder of 2014”
?
Organic growth continues to surprise management to the downside
Same-store growth disclosures are buried within the 10-Qs and 10-Ks but rarely discussed in press releases or analyst reports
Page 9
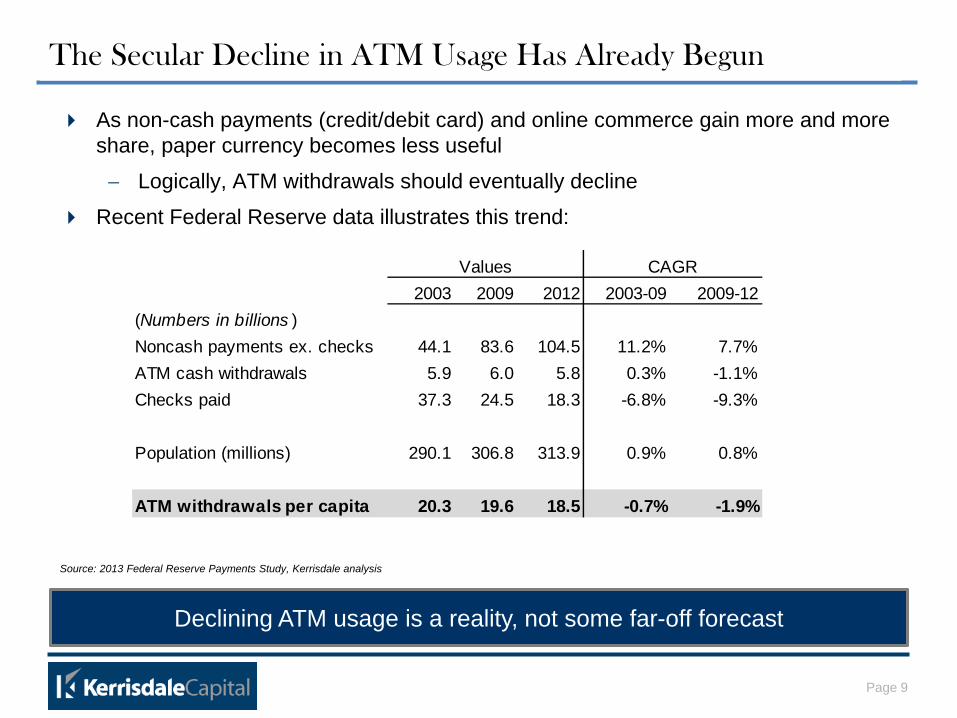
The Secular Decline in ATM Usage Has Already Begun
As non-cash payments (credit/debit card) and online commerce gain more and more share, paper currency becomes less useful
− Logically, ATM withdrawals should eventually decline
Recent Federal Reserve data illustrates this trend:
Source: 2013 Federal Reserve Payments Study, Kerrisdale analysis
Declining ATM usage is a reality, not some far-off forecast
Values CAGR2003 2009 2012 2003-09 2009-12
(Numbers in billions )Noncash payments ex. checks 44.1 83.6 104.5 11.2% 7.7%ATM cash withdrawals 5.9 6.0 5.8 0.3% -1.1%Checks paid 37.3 24.5 18.3 -6.8% -9.3%
Population (millions) 290.1 306.8 313.9 0.9% 0.8%
ATM withdrawals per capita 20.3 19.6 18.5 -0.7% -1.9%
Page 10
Long-term Viability Is a Major Concern for the Industry
2013 GAO survey of ATM operators: revenues falling primarily because of “declining transaction volumes”
− 70% of respondents expect further revenue declines for same reason
2014 U.S. Independent ATM Deployer Survey (conducted by industry association and consultancy): biggest fear/worry/concern regarding health of industry?
− #1 answer: “Declining Transactions”
45% of respondents, up from 36% in 2013
− #2 answer: “ATM Saturation”
40% of respondents, up from 34% in 2013
CATM’s spin claims that “cash remains as relevant today as it was half a century ago” – but competitors’ attitudes tell a different story
Other industry players are pessimistic about the future
Page 11
ATMs Are Losing Value across the World
Piecing together the available international data:
− Canada: withdrawals down since 2005, -3% CAGR
− United Kingdom: withdrawals down 0.5% in 2013
− Australia: withdrawals down 5% in 2013
− Eurozone: withdrawals down since 2010, -0.4% CAGR
− Sweden: approaching cashlessness
Cash in circulation has fallen every year since 2007
Withdrawals down 30% from 2004 to 2011
Withdrawals expected to decline an additional 6-8%/yr going forward
Will the United States and other developed countries really have less sophisticated payment systems than Sweden forever?
The ATM decline is global – and just getting started
Page 12
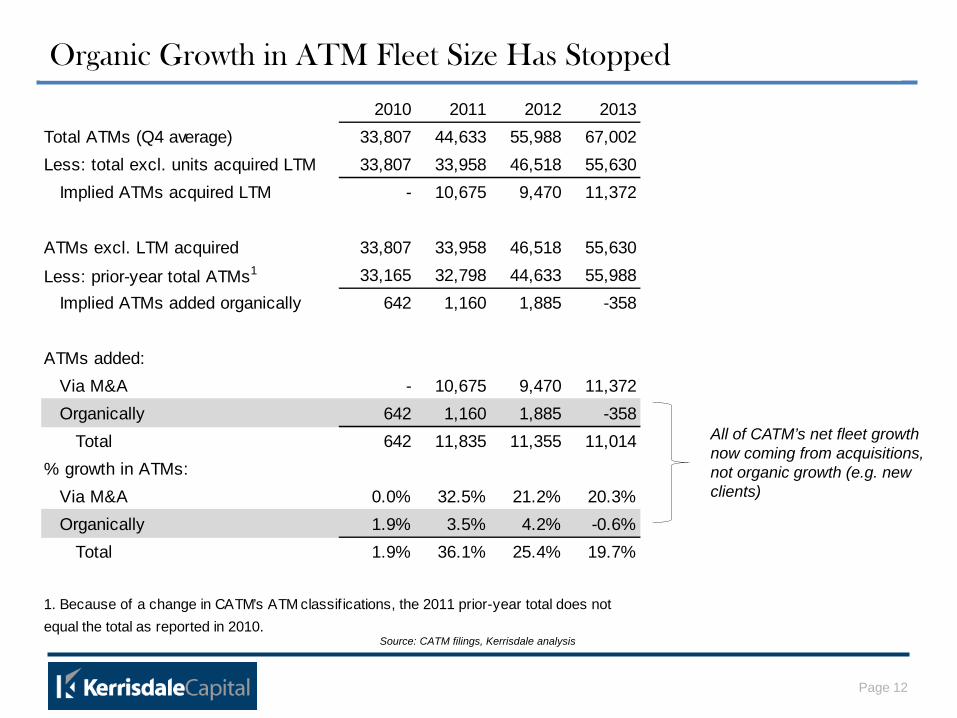
Organic Growth in ATM Fleet Size Has Stopped
Source: CATM filings, Kerrisdale analysis
2010 2011 2012 2013Total ATMs (Q4 average) 33,807 44,633 55,988 67,002Less: total excl. units acquired LTM 33,807 33,958 46,518 55,630
Implied ATMs acquired LTM - 10,675 9,470 11,372
ATMs excl. LTM acquired 33,807 33,958 46,518 55,630
Less: prior-year total ATMs1 33,165 32,798 44,633 55,988Implied ATMs added organically 642 1,160 1,885 -358
ATMs added:Via M&A - 10,675 9,470 11,372Organically 642 1,160 1,885 -358
Total 642 11,835 11,355 11,014% growth in ATMs:
Via M&A 0.0% 32.5% 21.2% 20.3%Organically 1.9% 3.5% 4.2% -0.6%
Total 1.9% 36.1% 25.4% 19.7%
1. Because of a change in CATM’s ATM classif ications, the 2011 prior-year total does notequal the total as reported in 2010.
All of CATM’s net fleet growth now coming from acquisitions, not organic growth (e.g. new clients)
Page 13
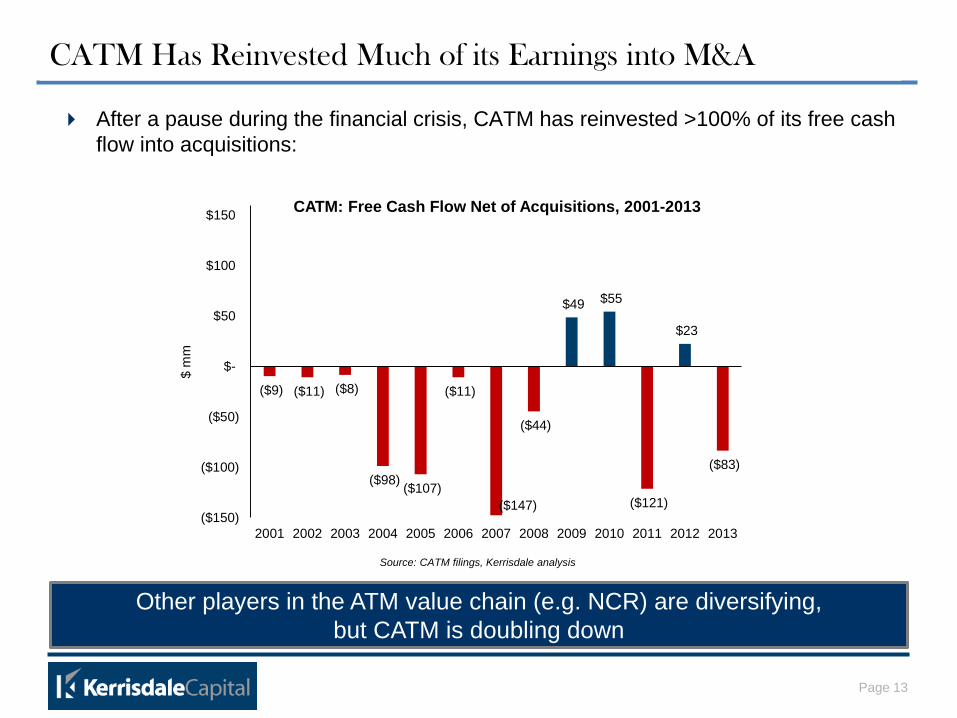
CATM Has Reinvested Much of its Earnings into M&A
After a pause during the financial crisis, CATM has reinvested >100% of its free cash flow into acquisitions:
Other players in the ATM value chain (e.g. NCR) are diversifying, but CATM is doubling down
Source: CATM filings, Kerrisdale analysis
($9) ($11) ($8)
($98) ($107)
($11)
($147)
($44)
$49 $55
($121)
$23
($83)
($150)
($100)
($50)
$-
$50
$100
$150
2001 2002 2003 2004 2005 2006 2007 2008 2009 2010 2011 2012 2013
$ m
mCATM: Free Cash Flow Net of Acquisitions, 2001-2013

Page 14
As CATM has resumed its acquisitions spree, its return on capital has declined by any measure:
Based on company disclosures, we estimate that ATMs added after 2010 are 41% less profitable than legacy ATMs
− Legacy ATMs: $376 gross profit per month
− New/acquired ATMs: $280
− Overall average dragged down with each new deal
The Returns on M&A are Diminishing
M&A is diluting CATM’s profitability as it reaches for lower-quality, less lucrative merchants and locations
2010 2011 2012 2013 ’10-13 ΔReturn on assets 9.0% 12.0% 5.8% 2.3% -75%Return on assets, adj. for UK tax items 8.9% 5.7% 5.9% 4.3% -52%EBIT to average assets 14.5% 13.2% 12.2% 9.1% -37%EBITDA to average gross assets 17.2% 15.9% 15.5% 12.6% -27%“Adjusted” EBITDA to average gross assets 18.0% 17.4% 16.9% 15.5% -14%
Page 15
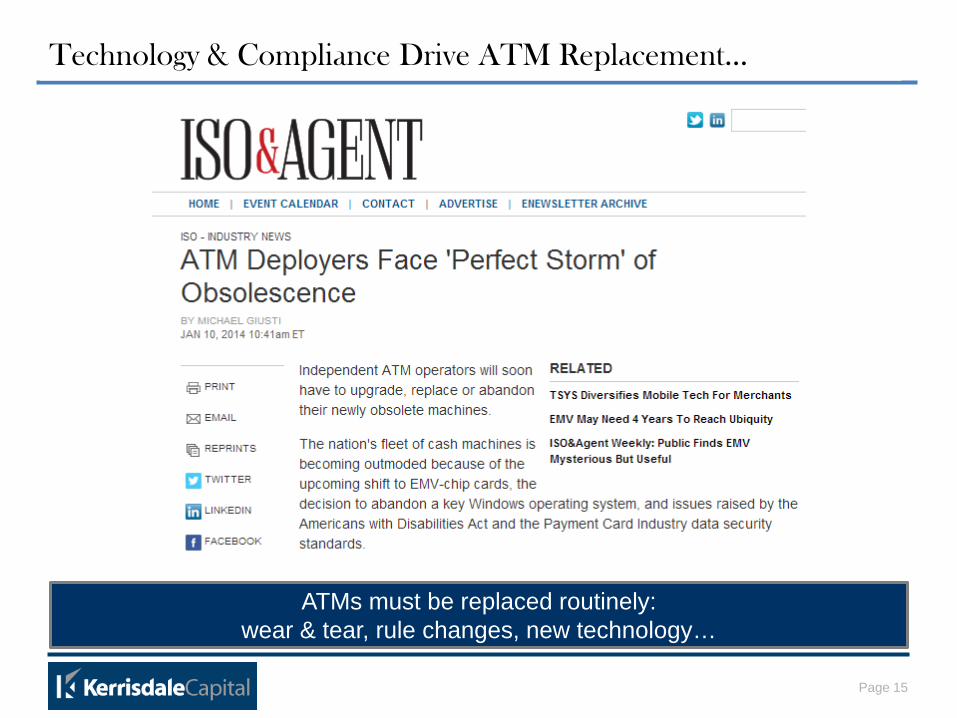
Technology & Compliance Drive ATM Replacement…
ATMs must be replaced routinely: wear & tear, rule changes, new technology…
Page 16
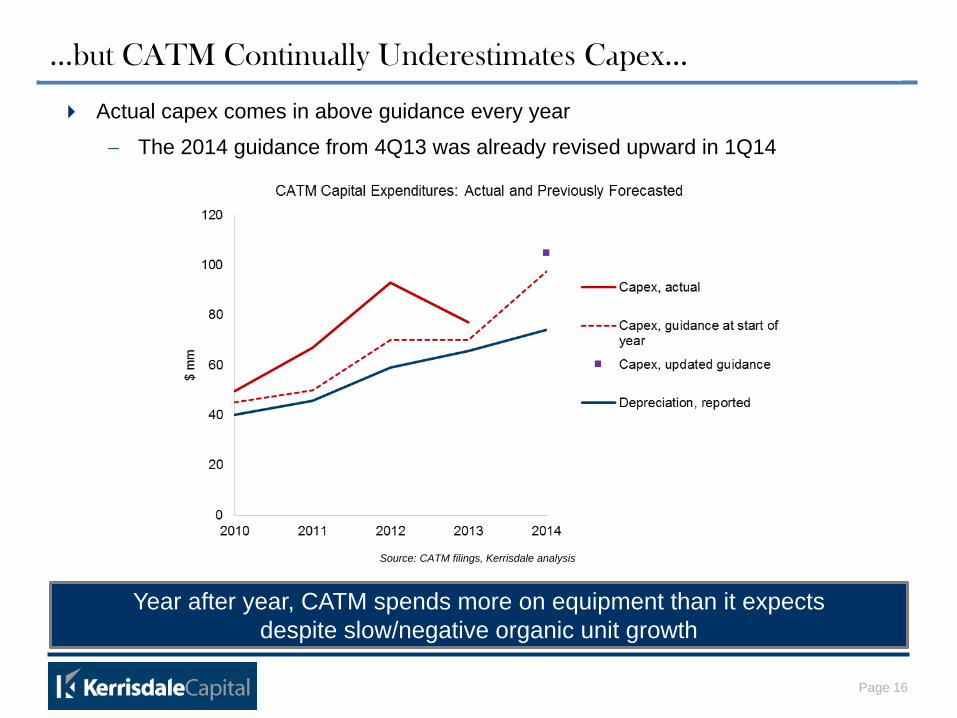
…but CATM Continually Underestimates Capex…
Year after year, CATM spends more on equipment than it expects despite slow/negative organic unit growth
Actual capex comes in above guidance every year
− The 2014 guidance from 4Q13 was already revised upward in 1Q14
Source: CATM filings, Kerrisdale analysis
Page 17
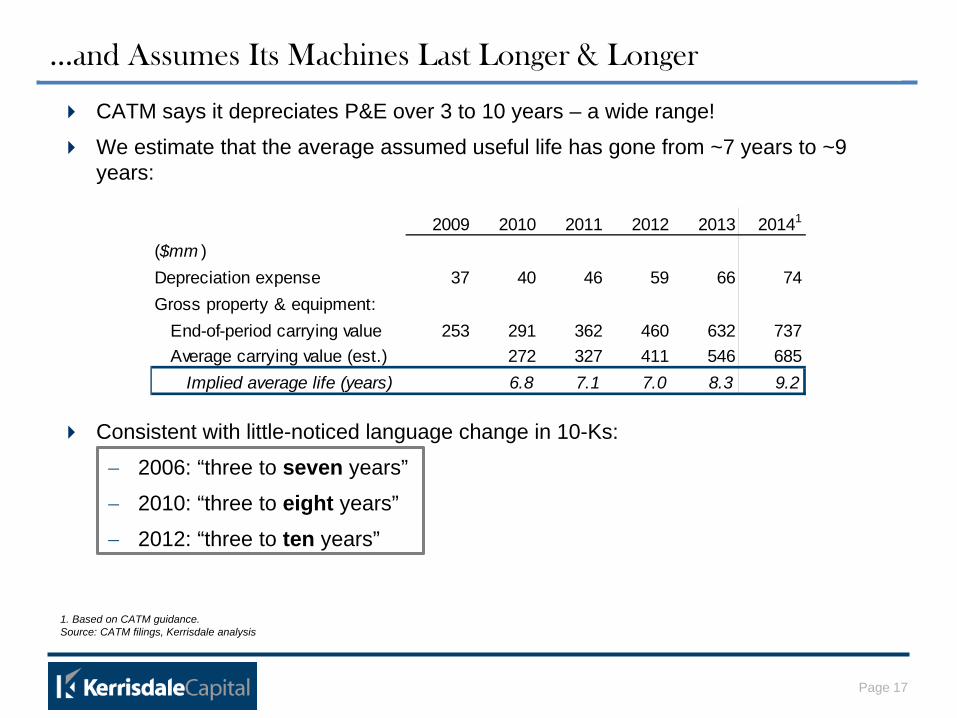
…and Assumes Its Machines Last Longer & Longer
CATM says it depreciates P&E over 3 to 10 years – a wide range!
We estimate that the average assumed useful life has gone from ~7 years to ~9 years:
Consistent with little-noticed language change in 10-Ks:
− 2006: “three to seven years”
− 2010: “three to eight years”
− 2012: “three to ten years”
1. Based on CATM guidance. Source: CATM filings, Kerrisdale analysis
2009 2010 2011 2012 2013 20141
($mm )Depreciation expense 37 40 46 59 66 74Gross property & equipment:
End-of-period carrying value 253 291 362 460 632 737Average carrying value (est.) 272 327 411 546 685
Implied average life (years) 6.8 7.1 7.0 8.3 9.2
Page 18
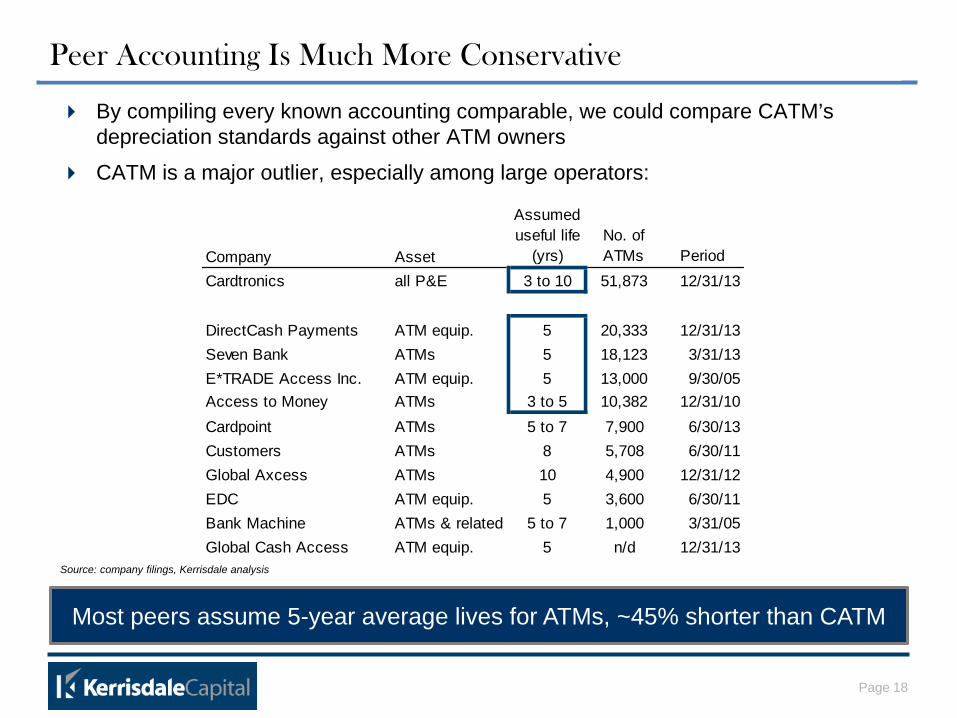
Peer Accounting Is Much More Conservative
Most peers assume 5-year average lives for ATMs, ~45% shorter than CATM
By compiling every known accounting comparable, we could compare CATM’s depreciation standards against other ATM owners
CATM is a major outlier, especially among large operators:
Source: company filings, Kerrisdale analysis
Company Asset
Assumed useful life
(yrs)No. of ATMs Period
Cardtronics all P&E 3 to 10 51,873 12/31/13
DirectCash Payments ATM equip. 5 20,333 12/31/13Seven Bank ATMs 5 18,123 3/31/13E*TRADE Access Inc. ATM equip. 5 13,000 9/30/05Access to Money ATMs 3 to 5 10,382 12/31/10Cardpoint ATMs 5 to 7 7,900 6/30/13Customers ATMs 8 5,708 6/30/11Global Axcess ATMs 10 4,900 12/31/12EDC ATM equip. 5 3,600 6/30/11Bank Machine ATMs & related 5 to 7 1,000 3/31/05Global Cash Access ATM equip. 5 n/d 12/31/13
Page 19
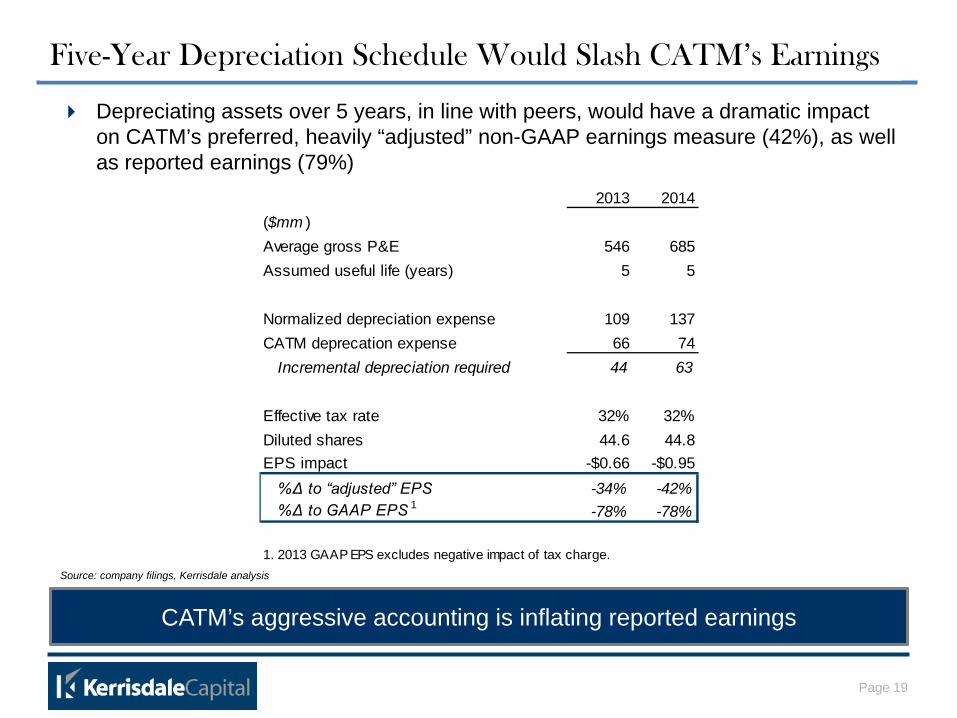
Five-Year Depreciation Schedule Would Slash CATM’s Earnings
CATM’s aggressive accounting is inflating reported earnings
Depreciating assets over 5 years, in line with peers, would have a dramatic impact on CATM’s preferred, heavily “adjusted” non-GAAP earnings measure (42%), as well as reported earnings (79%)
Source: company filings, Kerrisdale analysis
2013 2014($mm )Average gross P&E 546 685Assumed useful life (years) 5 5
Normalized depreciation expense 109 137CATM deprecation expense 66 74
Incremental depreciation required 44 63
Effective tax rate 32% 32%Diluted shares 44.6 44.8EPS impact -$0.66 -$0.95
%Δ to “adjusted” EPS -34% -42%%Δ to GAAP EPS 1 -78% -78%
1. 2013 GAAP EPS excludes negative impact of tax charge.
Page 20
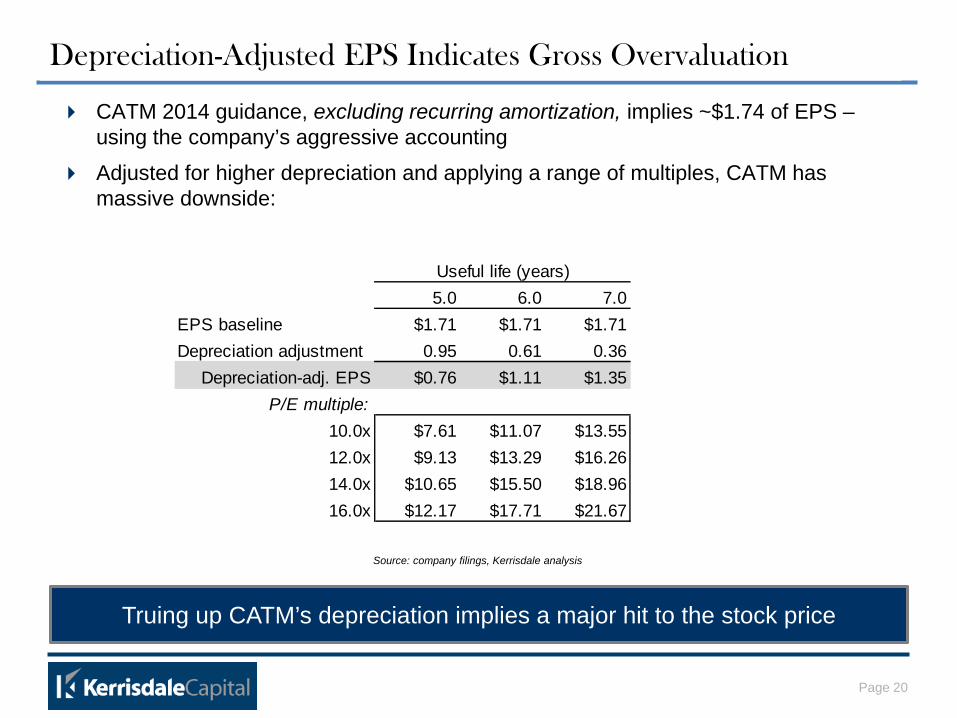
Depreciation-Adjusted EPS Indicates Gross Overvaluation
Truing up CATM’s depreciation implies a major hit to the stock price
Source: company filings, Kerrisdale analysis
CATM 2014 guidance, excluding recurring amortization, implies ~$1.74 of EPS – using the company’s aggressive accounting
Adjusted for higher depreciation and applying a range of multiples, CATM has massive downside:
Useful life (years)5.0 6.0 7.0
EPS baseline $1.71 $1.71 $1.71Depreciation adjustment 0.95 0.61 0.36
Depreciation-adj. EPS $0.76 $1.11 $1.35P/E multiple:
10.0x $7.61 $11.07 $13.5512.0x $9.13 $13.29 $16.2614.0x $10.65 $15.50 $18.9616.0x $12.17 $17.71 $21.67
Page 21
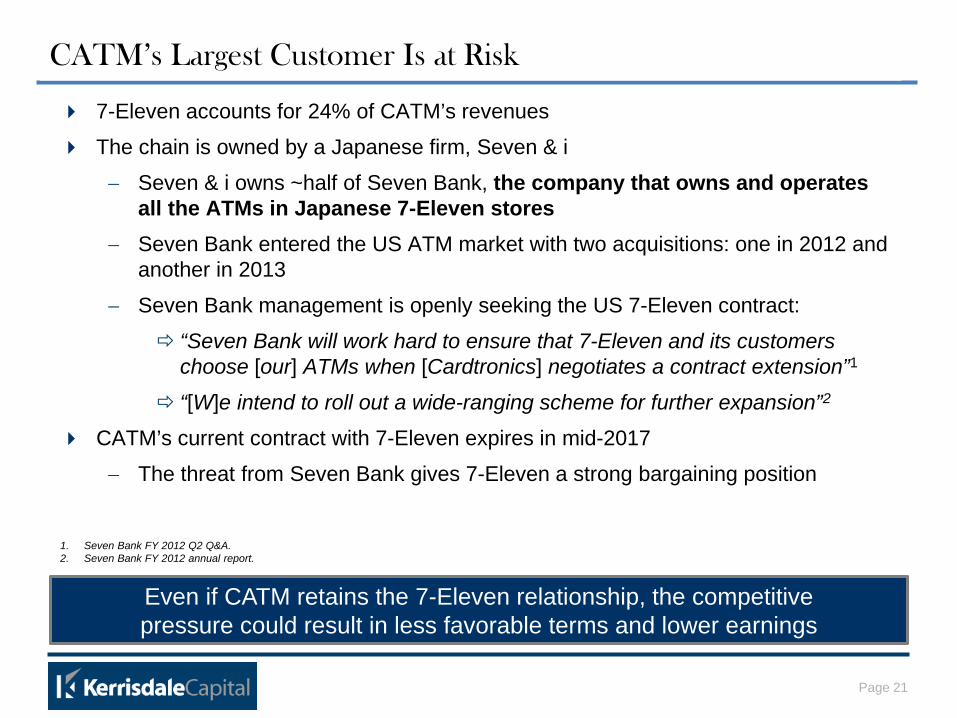
CATM’s Largest Customer Is at Risk
Even if CATM retains the 7-Eleven relationship, the competitive pressure could result in less favorable terms and lower earnings
7-Eleven accounts for 24% of CATM’s revenues
The chain is owned by a Japanese firm, Seven & i
− Seven & i owns ~half of Seven Bank, the company that owns and operates all the ATMs in Japanese 7-Eleven stores
− Seven Bank entered the US ATM market with two acquisitions: one in 2012 and another in 2013
− Seven Bank management is openly seeking the US 7-Eleven contract:
“Seven Bank will work hard to ensure that 7-Eleven and its customers choose [our] ATMs when [Cardtronics] negotiates a contract extension”1
“[W]e intend to roll out a wide-ranging scheme for further expansion”2
CATM’s current contract with 7-Eleven expires in mid-2017
− The threat from Seven Bank gives 7-Eleven a strong bargaining position
1. Seven Bank FY 2012 Q2 Q&A. 2. Seven Bank FY 2012 annual report.
Page 22
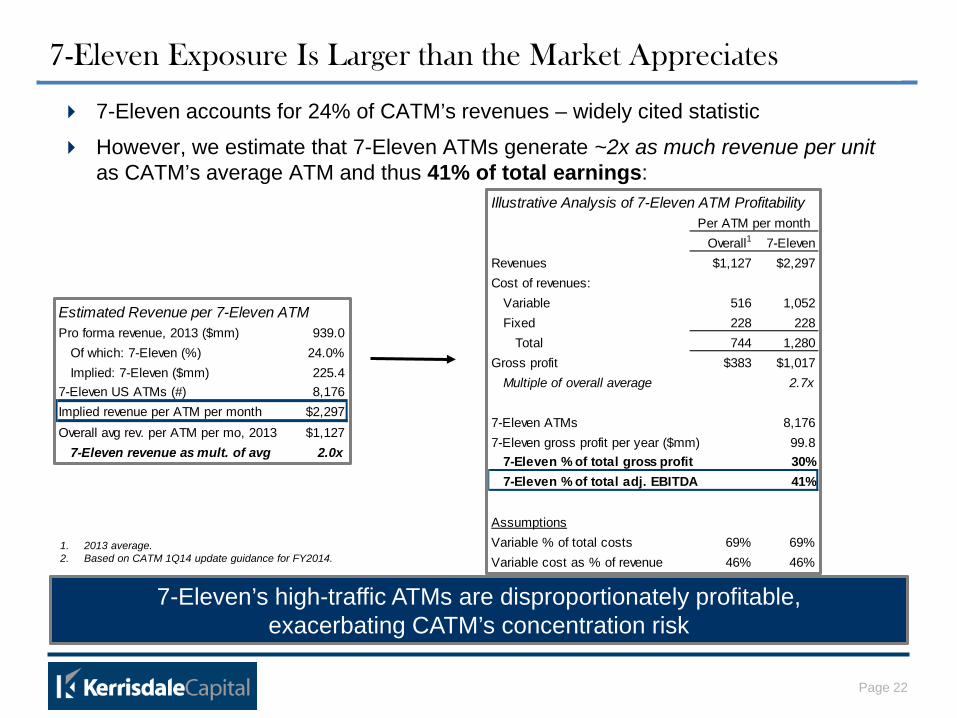
7-Eleven Exposure Is Larger than the Market Appreciates
7-Eleven’s high-traffic ATMs are disproportionately profitable, exacerbating CATM’s concentration risk
7-Eleven accounts for 24% of CATM’s revenues – widely cited statistic
However, we estimate that 7-Eleven ATMs generate ~2x as much revenue per unit as CATM’s average ATM and thus 41% of total earnings:
Illustrative Analysis of 7-Eleven ATM ProfitabilityPer ATM per month
Overall1 7-ElevenRevenues $1,127 $2,297Cost of revenues:
Variable 516 1,052Fixed 228 228
Total 744 1,280Gross profit $383 $1,017
Multiple of overall average 2.7x
7-Eleven ATMs 8,1767-Eleven gross profit per year ($mm) 99.8
7-Eleven % of total gross profit 30%7-Eleven % of total adj. EBITDA 41%
AssumptionsVariable % of total costs 69% 69%Variable cost as % of revenue 46% 46%
Estimated Revenue per 7-Eleven ATMPro forma revenue, 2013 ($mm) 939.0
Of which: 7-Eleven (%) 24.0%Implied: 7-Eleven ($mm) 225.4
7-Eleven US ATMs (#) 8,176Implied revenue per ATM per month $2,297Overall avg rev. per ATM per mo, 2013 $1,127
7-Eleven revenue as mult. of avg 2.0x
1. 2013 average. 2. Based on CATM 1Q14 update guidance for FY2014.
Page 23
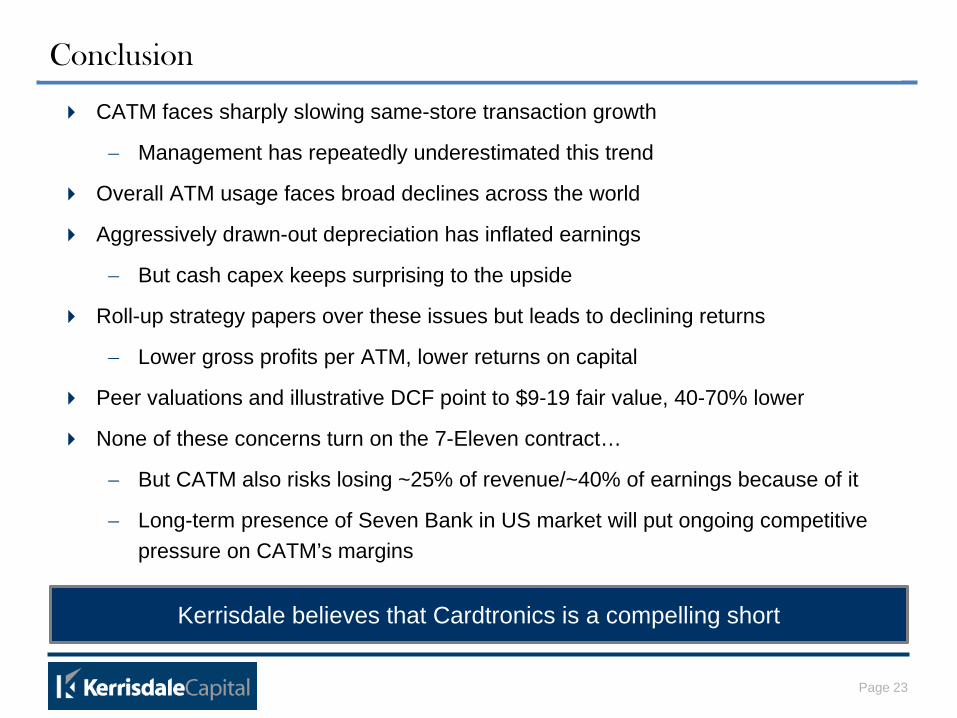
Conclusion
CATM faces sharply slowing same-store transaction growth
− Management has repeatedly underestimated this trend
Overall ATM usage faces broad declines across the world
Aggressively drawn-out depreciation has inflated earnings
− But cash capex keeps surprising to the upside
Roll-up strategy papers over these issues but leads to declining returns
− Lower gross profits per ATM, lower returns on capital
Peer valuations and illustrative DCF point to $9-19 fair value, 40-70% lower
None of these concerns turn on the 7-Eleven contract…
− But CATM also risks losing ~25% of revenue/~40% of earnings because of it
− Long-term presence of Seven Bank in US market will put ongoing competitive pressure on CATM’s margins
Kerrisdale believes that Cardtronics is a compelling short
Page 24
As of the publication date of this report, Kerrisdale Capital Management LLC and its affiliates (collectively "Kerrisdale"), others that contributed research to this report and others that we have shared our research with (collectively, the “Authors”) have short positions in and may own options on the stock of the company covered herein (Cardtronics, Inc.) and stand to realize gains in the event that the price of the stock decreases. Following publication of the report, the Authors may transact in the securities of the company covered herein. All content in this report represent the opinions of Kerrisdale. The Authors have obtained all information herein from sources they believe to be accurate and reliable. However, such information is presented “as is”, without warranty of any kind – whether express or implied. The Authors make no representation, express or implied, as to the accuracy, timeliness, or completeness of any such information or with regard to the results obtained from its use. All expressions of opinion are subject to change without notice, and the Authors do not undertake to update or supplement this report or any information contained herein. This document is for informational purposes only and it is not intended as an official confirmation of any transaction. All market prices, data and other information are not warranted as to completeness or accuracy and are subject to change without notice. The information included in this document is based upon selected public market data and reflects prevailing conditions and the Authors’ views as of this date, all of which are accordingly subject to change. The Authors’ opinions and estimates constitute a best efforts judgment and should be regarded as indicative, preliminary and for illustrative purposes only. Any investment involves substantial risks, including, but not limited to, pricing volatility, inadequate liquidity, and the potential complete loss of principal. This report’s estimated fundamental value only represents a best efforts estimate of the potential fundamental valuation of a specific security, and is not expressed as, or implied as, assessments of the quality of a security, a summary of past performance, or an actionable investment strategy for an investor. This document does not in any way constitute an offer or solicitation of an offer to buy or sell any investment, security, or commodity discussed herein or of any of the affiliates of the Authors. Also, this document does not in any way constitute an offer or solicitation of an offer to buy or sell any security in any jurisdiction in which such an offer would be unlawful under the securities laws of such jurisdiction. To the best of the Authors’ abilities and beliefs, all information contained herein is accurate and reliable. The Authors reserve the rights for their affiliates, officers, and employees to hold cash or derivative positions in any company discussed in this document at any time. As of the original publication date of this document, investors should assume that the Authors have positions in financial derivatives that reference this security and stand to potentially realize gains in the event that the market valuation of the company’s common equity is lower than prior to the original publication date. These affiliates, officers, and individuals shall have no obligation to inform any investor about their historical, current, and future trading activities. In addition, the Authors may benefit from any change in the valuation of any other companies, securities, or commodities discussed in this document. Analysts who prepared this report are compensated based upon (among other factors) the overall profitability of the Authors’ operations and their affiliates. The compensation structure for the Authors’ analysts is generally a derivative of their effectiveness in generating and communicating new investment ideas and the performance of recommended strategies for the Authors. This could represent a potential conflict of interest in the statements and opinions in the Authors’ documents. The information contained in this document may include, or incorporate by reference, forward-looking statements, which would include any statements that are not statements of historical fact. Any or all of the Authors’ forward-looking assumptions, expectations, projections, intentions or beliefs about future events may turn out to be wrong. These forward-looking statements can be affected by inaccurate assumptions or by known or unknown risks, uncertainties and other factors, most of which are beyond the Authors’ control. Investors should conduct independent due diligence, with assistance from professional financial, legal and tax experts, on all securities, companies, and commodities discussed in this document and develop a stand-alone judgment of the relevant markets prior to making any investment decision.
Disclaimer


![Presentation Guideline and Slide Gallery 16:9 · Presentation Guideline and Slide Gallery 16:9 Author [GfK Employee] Subject [Subtitle of presentation] Keywords: examples; presentation;](https://static.fdocuments.co/doc/165x107/5ffa01e2a5ee5b09787fbf25/presentation-guideline-and-slide-gallery-169-presentation-guideline-and-slide-gallery.jpg)