En colaboración con - 148.206.53.84148.206.53.84/tesiuami/UAMI17454.pdf · de disbiosis entre los...
95
Transcript of En colaboración con - 148.206.53.84148.206.53.84/tesiuami/UAMI17454.pdf · de disbiosis entre los...


1
En colaboración con:
Centro de Investigación y Estudios Superiores (CINVESTAV-IPN), México y la Universidad Noruega de Ciencias de la Vida (NMBU), Noruega.
Aplicación de algoritmos bioinformáticos para el
procesamiento de datos provenientes de la secuenciación masiva del genoma microbiano:
Caracterización de la microbiota intestinal en modelos experimentales de enfermedades del neurodesarrollo.
Tesis que presenta: Ing. Biomed. Seicy Adriana Velázquez Villegas
Para obtener el grado de
Maestra en Ciencias, Posgrado de Ingeniería Biomédica
Asesor de tesis:
Dr. Gustavo Pacheco López
Co- asesor:
Dr. Jaime García Mena
Jurado Calificador:
Dr. Gustavo Pacheco López
Dr. Selvasankar Murugesan
Dr. Félix Aguirre Garrido
Ciudad de México, México Septiembre 2016

2
Índice Resumen 5 1. Antecedentes 7
1.1 Microbiota 1.1.1 Microbiota intestinal 7 1.1.2 Eje Microbiota-intestino-cerebro 8
1.2 Neurodesarrollo 1.2.1 Desórdenes del Neurodesarrollo y la microbiota intestinal. 10 1.2.2 Infección prenatal 11
1.2.2.1Modelo de infección prenatal 14 1.2.2.1.1Poly(I:C) 14 1.2.2.2.2 Fenotipos de comportamiento en la primer y segunda generación de crías de madres inmunemente desafiadas 15
1.3 Estudio de poblaciones microbianas 1.3.1Taxonomía 19 1.3.2Metagenómica 19 1.3.3 Identificación bacteriana por secuenciación de genes ribosomales (16SrRNA) 20 1.3.4 Secuenciación de nueva generación 22 1.3.5 Secuenciadores de nueva generación 23
1.3.5.1Ion Torrent PGM 23 1.3.5.2Illumina Miseq 25
1.3.6Biodiversidad 27 1.3.6.1 Medición de diversidad Alfa 27 1.3.6.2 Medición de diversidad Beta 29
1.4 Procesamiento masivo de datos 1.4.1 Análsis bioinformático 29 1.4.2 Herramientas bioinformáticas 30
2. Justificación 34 3. Hipótesis 36 4. Objetivo principal 37
4.1 Objetivos específicos 37 5. Materiales y métodos 38
5.1Poly(I:C) modelo de infección prenatal 38 5.2 Pruebas de comportamiento 39 5.3 Recolección de muestras de microbiota 40 5.4 Extracción de ADN 41 5.5 16S preparación de librerías y secuenciación masiva 42 5.6 Análisis y procesamiento de los datos 42
5.6.1 Pre-procesamiento (Script1 ‘Filtering’) 43 5.6.1.1Pre-procesamiento con Illumina Miseq 44 5.6.1.1Pre-procesamiento con Ion Torrent PGM 45
5.6.2 OTU picking (Script2 ‘OTU picking’) 46 5.6.2.1 Proceso de filtrado 47 5.6.2.2 Proceso de OTUs 48

3
5.6.2.3 Proceso de Taxonomía 49 5.6.3 Core diversity análisis (Script3 ‘Core_diversity’) 50
6. Resultados y Discusión 53 6.1 Primera generación secuenciada con Ion Torrent PGM e Illumina Miseq 53
6.1.1 Clasificación taxonómica 53 6.1.2 Análisis de diversidad alfa 56
6.1.2.1 Curvas de rarefacción 57 6.1.2.2 Análisis estadístico de diversidad alfa 59
6.1.3 Recolección de OTUs significativos 59 6.1.3.1 OTUs significativos con diferentes valores de normalización 61
6.1.4 Análisis filogenético 64 6.2 Posible transmisión de comunidades bacterianas entre la primer (F1) generación y la segunda (F2) generación 67
6.2.1 Clasificación taxonómica 67 6.2.2 Análisis de diversidad alfa 69 6.2.3 Recolección de OTUs significativos 69
6.2.3.1 Recolección de OTUs significativos F1 69 6.2.3.2 Recolección de OTUs significativos F2 72
6.2.4 Análisis filogenético 74 6.3 Segunda generación (F2) dividida por linajes (POL-M, POL-P), 77
6.3.1 Clasificación taxonómica 77 6.3.2 Recolección de OTUs significativos 78
6.3.2.1 linaje POL-P 78 6.3.2.2 linaje POL-M 80
6.3.4 Análisis filogenético 82 7. Conclusión 85 Agradecimientos 88 Colaboraciones 89 Referencias 90 Anexos y SOPs 95

4
Agradecimientos Gracias a Dios por darme la fuerza y fe para creer en mi, por ayudarme a ver siempre las cosas con optimismo y alegría y sobretodo gracias por la vida. Gracias a la Universidad Autónoma Metropolitana y al Consejo de Ciencia y Tecnología CONACYT por el financiamiento y la oportunidad de llevar a cabo mis estudios de maestría. Gracias a mis asesor el Dr. Gustavo Pacheco por su paciencia, dedicación, motivación y por haberme guiado durante todo este tiempo. Gracias a mi co-asesor el Dr. Jaime García y toda la gente del laboratorio en CINVESTAV por sus enseñanzas y acogimiento, especialmente a Otoniel Maya por ser el mejor maestro y apoyo. Gracias al Dr. Knut Rudi por creer en mi y darme la oportunidad de ir a crecer y aprender nuevas cosas, así como a toda la gente maravillosa que conocí en mi estancia en la Universidad Noruega de Ciencias de la Vida con quienes compartí tantas hermosas experiencias. Gracias al Dr. Félix Aguirre por todo su tiempo, paciencia y enseñanzas. Gracias al Dr. Juan Carlos Echeverría quien fungió como mi tutor los primeros trimestres, por todo su apoyo y alegría, pero sobretodo por enseñarme esa pasión y dedicación con que se deben hacer las cosas. Gracias a mi familia y amigos por todas las experiencias que hemos vivido juntos las enseñanzas y por motivarme siempre a seguir adelante. Gracias a Yeta por todas las locuras y destrozos y por enseñarme la importancia de la responsabilidad. Gracias a Fer por llenar mi vida de alegría y hermosos momentos y por enseñarme un nuevo significado de amor. Gracias a Kike por su amor, apoyo, alegría, confianza y por crecer a mi lado día con día. Gracias a mis hermanas Clau y Lau por todas las risas y peleas, por su amor y apoyo incondicional y sobretodo por ser siempre mi ejemplo a seguir. Y por encima de todo gracias a mis padres Lupita y Fernando por ser siempre mis guías y mejores consejeros, por enseñarme a seguir mis sueños, a nunca rendirme y sobretodo a tener una vida llena de amor.

5
Resumen
La esquizofrenia es un trastorno mental que se caracteriza por la desintegración del
proceso del pensamiento y de la capacidad de respuesta emocional. Se manifiesta más
comúnmente como alucinaciones auditivas, delirios paranoides o extravagantes, o
lenguaje y pensamiento desorganizado, y se acompaña por una significativa disfunción
social. Se generó una infección materna utilizando un modelo de ratón por medio de la
activación inmune prenatal durante el embarazo por el mimético viral poly(I:C) que
redujo la sociabilidad y aumento la expresión de miedo en las crías descendencia para
demostrar una posible disbiosis en la microbiota intestinal entre los ratones
descendientes inmunemente activados (poly(I:C)) y los ratones descendentes control o
vehículo (estériles libres de pirógenos). Se crearon dos generaciones descendencia F1
y F2. La secuenciación masiva del genoma microbiano se llevo a cabo utilizando dos
tecnologías de secuenciación diferentes (Ion Torrent PGM e Illumina Miseq) y el
análisis bioinformático se basó en el uso de herramientas tales como Qiime,
USEARCH, UCHIME y UPARSE entre otras. La investigación se dividió en tres
objetivos principales. En el primero se demostró el desarrollo de una disbiosis en la
primer generación (F1) entre las crías de ratones inmunemente desafiadas (poly(I:C)) y
las crías de ratones control o vehículo, con ambas plataformas de secuenciación y el
mismo análisis bioinformático, evaluando así las posibles similitudes y diferencias que
pudieran existir en los resultados entre plataformas. Se encontraron diversos OTUs
significativos entre los dos grupos tratamiento de ambos análisis, en especial ordenes
de los fila Bacteroidetes y Firmicutes (g_Prevotella, s_Barnesiella), algunas de estas
comunidades bacterianas se mantienen presentes, independientemente del tipo de

6
secuenciador a utilizar. En el segundo objetivo se evaluó la existencia de una posible
transmisión de las comunidades bacterianas que están causando disbiosis en el grupo
poly(I:C) de la F1 a la F2. El orden Clostridiales, específicamente algunas especies
Gracillibacter que causan disbiosis en la F1 están siendo transmitidas a la F2
manteniendo la disbiosis entre los grupos tratamiento con una menor abundancia en el
grupo poly(I:C) en ambas generaciones. El orden de Bacteroidales también presenta
una posible transmisión de F1 a F2 con especies Barnesiella que muestran diferentes
patrones de abundancia, ya que no se muestra claramente una relación entre la
transmisión de estos OTUs significativos y su presencia o ausencia en el grupo
poly(I:C), pero es evidente que juegan un papel importante en la disbiosis de ambas
generaciones. Sin embargo, en el tercer objetivo donde se buscó un linaje (POL-M o
POL-P) que fuera determinante en la transmisión de las comunidades bacterianas de la
F1 a la F2, en el mismo cluster de Bacteroidales al separarse por linajes muestra una
asociación de los OTUs siguiendo una dirección, se muestra una presencia o
abundancia menor en los grupos poly(I:C) con respecto a los control, por parte de la F2
la mayoría de ellos en POL-P y uno de ellos en POL-M, mostrando que el linaje paterno
(POL-P) es relevante en el transmisión de comunidades bacterianas (Bacteroidales) de
la primera a la segunda generación. Estos hallazgos apoyan la idea de una diferencia
en la composición de la microbiota intestinal entre una descendencia control y una
descendencia que presenta síntomas de un trastorno del neurodesarrollo
(esquizofrenia), reafirmando la conexión existente entre la microbiota intestinal y el
cerebro. Así como también demuestran la transmisión de grupos bacterianos causantes
de disbiosis entre los grupos tratamiento de una generación F1 a otra F2.

7
1. Background
1.1 Microbiota
1.1.1 Gut Microbiota
Humans are considered host to an amount of microorganisms that are grouped in
complex and usually beneficial communities, which exceed the number of human cells
by, tenfold33. The microbiota is a complex ecosystem, which is composed of trillions of
bacterial cells in the body, collectively encoding more than 3.3 million non-redundant
genes; exceeding by 150 times the genome encoded by the human host9. These
bacterial communities occupy several different but distinct microbial ecosystems on-,
and within the human body, including: nasal, oral, and otic cavities, the surface of the
skin, the urogenital, and the gastrointestinal (GI) tracts45. It is important to mention that
is within the GI tract where the principal reservoir of microbes in humans is contained, of
at least 1,000 different microbial species. The two most predominant bacterial
communities in the GI tract are the Bacteroidetes (~ 48%) and Firmicutes (~ 51%). The
remaining 1% is composed of other bacterial groups, such as Proteobacteria,
Verrucomicrobias, Fusobacteria, Cyanobacteria, Actinobacteria, and Spirochetes, plus
several species of fungi, protozoa, viruses, and other microorganisms45. Microbial
colonization of the GI tract and its composition along the life of the host will depend on
various factors38. After birth, different kinds of environmental microbes colonize the GI
tract of the newborn, forming the intestinal microbiome. Infant gestational age, type of
delivery, type of nutrition, and early use of antibiotics alter the composition of the
microbiota and can have significant and long lasting effects49.

8
The gut microbiota has several functions in the human host. For instance, it is directly
involved in the synthesis of vitamins and cofactors, the breaking of complex lipids and
polysaccharides, as well as on the detoxification of waste particles / toxins40. Through
fermentation, gut microbiota produces short-chain fatty acids that play important roles
working as fuel sources and maintaining the integrity of the gut epithelial attachment. At
the same time, this could be related to disorders for which a "permeable gut " precedes
the development of important diseases such as type1 diabetes57.
1.1.2 Microbiota – Gut – Brain axis
The microbiota-gut-brain axis, a strong and constant interaction between the gut
microbiota and the central nervous system (CNS), is a set of communication channels
established between the brain and the GI tract that provides to the intestinal microbiota
and its metabolites a way by which interact with the brain, and vice versa. This axis
includes the CNS, the neuroimmune and neuroendocrine systems, the sympathetic and
parasympathetic arms of the autonomic nervous system (ANS), the enteric nervous
system (ENS) and of course the intestinal microbiota13. These components interact to
form a complex network with afferent fibers projecting to integrative structures of the
CNS and efferent projections to the smooth muscle. This bidirectional communication
network enables brain signals to influence the sensory, motor and secretory GI tract
modalities as well as immune functions, including modulation of cytokine production by
cells of the mucosal immune system, and conversely visceral messages from the gut
may influence brain function, particularly brain areas involved in the regulation of
stress21.

9
In the case of the ENS the effector arm integrates the responses and modulates the
immune activity. By the other way, the afferent limb comprises sensory nerves that
contribute to intestinal reflexes and transmit information to the brain about harmful
stimuli such as bowel distension and potentially dangerous signs, including the
presence of bacterial endotoxins or pro-inflammatory cytokines13.
The ANS connects the intestine with the brain. The vagus nerve is a major pathway for
signals originating from the foregut and proximal colon, whereas the sacral
parasympathetic nerves innervate the distal colon. The sympathetic system mainly
exerts an inhibiting influence on the intestine, decreased intestinal motor function and
secretion through the release of neurotransmitters such as noradrenaline13, 21.
The humoral components of the microbiota-gut-brain axis consist of the hypothalamic-
pituitary-adrenal axis, the enteroendocrine system and the immune system of the
mucosa. Enteroendocrine cells from the gut epithelium produce hormones such as
cholecystokinin and ghrelin, which regulate appetite, and the 5-hydroxytryptamine,
which has a wide range of effects on intestinal and brain functions13, 8.
It is known that emotional factors, stress or depression influence in the natural history of
chronic GI diseases such as inflammatory bowel disease (Crohn's disease and
ulcerative colitis) and inflammatory bowel syndrome (IBD) through the gut-brain axis47,
13. These conditions are also associated with the development of a microbiota dysbiosis.
(an irregularity in the microbiota within the body that can be triggered by various causes
such as the effect of certain antibiotics, stress and excess of proteins and simple sugars
in the diet47, a disruption of tissue homeostasis and normal immune responses64).

10
1.2. Neurodevelopmental disorders
1.2.1 Neurodevelopmental disorders and its relationship with the gut microbiota
The combination of new technologies of microbial genomics with metabolic and
immunological analyzes are revealing important synergies between the microbiota and
the host. It is now possible to understand this interaction and develop new treatment
strategies for major diseases such as gastrointestinal as well as neurodegenerative,
which have recently show to have an important relationship with the intestinal
microbiota49.
Neurodevelopmental disorders are characterized by an alteration in the brain,
behavioral and cognitive development, and sometimes as well on physical
abnormalities. Some of them share abnormal behavior in socialization, communication
or compulsive activity35.
The most recognized neurodevelopmental disorder is the Autism Spectrum Disorder
(ASD)35, considered as a severe neurodevelopmental condition; it is diagnosed based
on the presence and severity of stereotypic behaviors and deficit in language and social
interaction39. The most characteristic features of the autism behavior include qualitative
impairments in social interaction and communication, repetitive and stereotyped
behavior patterns and a restricted repertoire of interests and activities.
Schizophrenia, considered part of the Autism Spectrum Disorder, is a chronic and
severe mental disorder that affects the way a person thinks, feels and behaves59, 61.
People with schizophrenia may seem like they have lost touch with reality. Symptoms of

11
schizophrenia usually begin between 16 and 30 years. In rare cases could also occur in
children. The symptoms are divided into 3 categories: positive, negative and cognitive59
(Table 1).
Table 1. Schizophrenia symptoms in patients: positive, negative and cognitive
Positive symptoms Negative symptoms Cognitive symptoms Hallucinations Delusions Thought disorders Movement disorders
Flat affect Reduced feelings of pleasure in daily life Difficulty beginning and sustaining activities Reduced speaking
Poor ‘executive function’ Trouble focusing or paying attention Problems with working memory
While the standardized GI tract symptoms diagnosis in ASD and Schizophrenia has not
yet been clearly defined, clinical and epidemiological studies have report abnormalities
such as impaired GI motility and increased intestinal permeability. It has also been
found that commensal bacteria affect a variety of complex behaviors including social,
emotional and anxiety-related behaviors, and contribute to the development and brain
function in mice and humans8, 20, 25.
1.2.2 Prenatal infection
Prenatal exposure to infectious pathogens or inflammatory stimuli is increasingly
recognized to play an important etiological role in neuropsychiatric and neurological
disorders with neurodevelopmental components60. Significant associations between
infection during pregnancy and increased disease risk in later life have been revealed
for various brain disorders32. The British epidemiologist David Barker initially proposed
this theory as the “fetal origins of adult disease” or “prenatal programing hypothesis” in
the 1990`s34. Remote disorders, such as schizophrenia, autism, attention-
deficit/hyperactivity disorder, and major depression share considerable amounts of risk
12
factors and brain dysfunctions, but they might lie along a continuum of genetically and
environmentally induced neurodevelopmental causalities, wherein prenatal infection
may be one of these factors. The nature and severity of changes at the maternal-fetal
interface (Figure 1), including the placenta, amniotic fluid and fetal organism are
influenced by various factors, most notably the identity or intensity of the pathogen, the
gestational timing of exposure, and the genetic background of the infected host23. These
overlapping effects are mostly characterized by increased fetal expression of
inflammatory factors, such as pro-inflammatory cytokines and chemokines27. It is
believed that abnormal expression of inflammatory factors in the fetal brain contribute
to, or even mediate, abnormal brain and behavioral development following prenatal
exposure to infection7. Indeed, as reviewed extensively elsewhere53, acute inflammation
during early fetal brain development may negatively affect ongoing neurodevelopmental
processes, such as neuronal/glial cell differentiation, proliferation, migration, and
survival, and thus, predispose the developing offspring to long-term brain and
behavioral dysfunctions. The pathological symptoms traditionally attributed to CNS
dysfunctions, neurodevelopmental psychiatric illnesses, such as autism and
schizophrenia, are also associated with a number of GI dysfunctions. Such
abnormalities include chronic intestinal low-grade inflammation, increased intestinal
permeability “leaky gut”, allergic reactions to dietary proteins, diarrhea, gastric
dysmobility, and alterations in gut microbiota50.

13
Figure 1. Possible mechanisms mediating the pathological effects of maternal infection (Adapted from 50) Common immunological factors are key mediating factors changing developmental trajectories in the offspring. Inflammatory cytokines are typically induced during the acute phase response to infection and may represent a major developmental stressor for the organism. An increase in fetal cytokine levels may be caused by transplacental transfer of maternally produced cytokines, by placental production of cytokines, or by increased fetal cytokine synthesis. In addition, there is a strongly association with numerous other pathophysiological effects, including oxidative stress, referred to as an imbalance between the production and elimination of reactive oxygen species (ROS), some of which are highly cytotoxic and promote tissue injury. Upon activation, innate immune cells secrete ROS and reactive nitrogen species (RNS) as a central part of killing invading pathogens. Production of ROS and RNS is, thus, an important downstream mechanism of inflammation-mediated immune responses. Activation of the innate immune system (in response to infection) also changes the maternal and fetal availability of several micronutrients, including iron and zinc, both of which are highly important for the normal development of peripheral and central organs. In the case of iron, it is well established that infection leads to a temporary depletion of iron in the infected host. This process is mediated to a great extent by the pro-inflammatory cytokines IL-1β and IL-6 and serves to reduce the availability of this essential nutrient to the invading pathogens as part of the host’s inherent defense system. As part of the acute-phase response to infection, pro-inflammatory cytokines also trigger the induction of the zinc-binding protein metallothionein. During the course of pregnancy, this process leads to maternal and fetal zinc deficiency, which has further been associated with teratogenicity and abnormal developmental processes in utero. In addition may also impair the fetal supply for macronutrients. Indeed, it is well established that peripheral cytokine elevation in response to infection induces a set of behavioral and physiological changes collectively referred to as sickness behavior. Sickness behavior typically includes fever, malaise, and reduced exploratory, and social investigation, as well as decreased food and water intake, usually accompanied by weight loss. It should also be noted that at least part of the changes to the microbiome that emerge following prenatal infection might have an early prenatal origin. The conventional view is that microbial colonization begins at birth when the neonate is first exposed

14
to the microbiome of the mother and the surrounding environment, implying furthermore that the fetal environment is sterile and, therefore, lacks a microbiome before birth. Recently findings show that the human placenta is not sterile but, in fact, is colonized with nonpathogenic commensal microbiota. Perhaps even more important are the findings suggesting that the microbial composition of the human placenta can be modified by maternal infection during pregnancy, even if the infectious process takes place during the time of conception or in early gestation. Modifications of the placental microbiome, be it as a result of maternal infection or by other environmental factors, can critically shape the development of the offspring’s microbiome and, thus, predispose the developing organism to dysbiosis and other microbiome-associated abnormalities.
1.2.2.1 Prenatal infection animal models
With the knowledge that the alteration of neuroimmune mechanisms may play a role in
the development of schizophrenia and other related psychotic illnesses, a number of
mouse models have been established to explore the consequences of prenatal immune
activation on the brain and the behavioral development. Existing models are normally
based on a gestational maternal exposure to a specific infectious disease agent or an
inflammatory marker as, for instance: the human influenza virus, the mimetic viral
mimetic polyriboinosinic-polyribocytidilic acid [poly(I:C)], the lipopolysaccharide bacterial
endotoxin or selected inflammatory cytokines52. Several of these mouse models show
that the maternal exposure to infectious agents or immune system activation lead to
post-acute robust immunological changes in the maternal-fetal interface, including
placenta, amniotic fluid and the fetus organism itself.
1.2.2.1.1The poly(I:C) model. One of the most robust and widely used method that uses
immune activation agents, which evoke associated cytokines to the mother immune
response without using live viral or bacterial pathogens, is the maternal administration
of the poly(I:C)51. This prenatal poly(I:C) model has had a significant impact on
researchers who focus on the basis of neurological and neuroimmune development of
complex brain disorders such as schizophrenia52. In poly(I:C) model, pregnant mouse

15
dams are exposed to the immunological manipulation at a specific gestational stage,
and the brain and behavioral consequences of the prenatal immunological manipulation
are then compared in the resulting offspring relative to offspring born to vehicle-treated
control mothers. Poly(I:C) is a commercially available synthetic analog of double-
stranded RNA52. Double-stranded RNA is generated during viral infection as a
replication intermediate for single-stranded RNA or as a by-product of symmetrical
transcription in DNA viruses26. It is recognized as foreign molecule by the mammalian
immune system primarily through the transmembrane protein toll-like receptor 3
(TLR3)5. Administration of poly(I:C) can therefore efficiently mimic the acute phase
response to viral infection and leads to significant inflammatory processes in the fetus
when given systemically to pregnant mouse dams52. An interesting feature of this
prenatal poly(I:C) mouse model, is that the spectrum of behavioral, cognitive, and
pharmacological disorders emerge only after the offspring has reached late
adolescence or early adulthood50, 63. This ripening delay is indicative of a progression of
pathological symptoms from puberty to adulthood, which is consistent with post-pubertal
apparition of psychotic behavior in schizophrenia and other ASD related disorders52.
1.2.2.1.2 Behavioral phenotypes in first- and second-generation offspring of
immune-challenged mothers
A previous research17 evaluated the transgenerational transmission and modification of
pathological traits induced by prenatal immune activation, using an established mouse
model of prenatal immune activation by the viral mimetic poly(I:C), behavioral
phenotypes emerging in F1 and F2 offspring of poly(I:C)-exposed mothers relative to
corresponding control offspring were compared. For each generation, behavioral testing

16
started when the offspring reached postnatal day (PND) 70 and included tests
assessing social interaction, cued Pavlovian fear conditioning, prepulse inhibition (PPI)
of the acoustic startle reflex, and behavioral despair in the forced swim test. They found
that reduced sociability (Figure 2) and increased cued fear expression (Figure 3) are
similarly present in the first (F1) and second (F2) generation offspring of immune-
challenged ancestors, that the sensorimotor gating impairments (Figure 4) are confined
to the direct descendants of infected mothers, whereas increased behavioral despair
(Figure 5) emerges as a novel phenotype in the F2 generation. These transgenerational
effects are mediated via the paternal lineage (Figure 6), demonstrating
transgenerational non-genetic inheritance of pathological traits following in-utero
immune activation.
Figure 2. F1 poly(I:C)-exposed offspring displayed impaired sociability in a social interaction test, in which they were allowed to concomitantly explore an inanimate dummy object and an unfamiliar live mouse. Whereas F1 control offspring showed a strong preference for the live mouse versus the inanimate dummy object, F1 poly(I:C) offspring did not display such a preference. Moreover, F1 control and poly(I:C) offspring explored the dummy object to a similar extent, whereas the exploration times for the live mouse markedly differed between the two groups. F2 offspring of poly(I:C)-exposed ancestors showed a similar deficit in sociability without concomitant changes in general locomotor activity or dummy object exploration.

17
Figure 3. F1 poly(I:C) offspring displayed increased fear expression in a cued Pavlovian fear conditioning test. Whereas they did not differ from F1 controls during the initial acquisition of the conditioned fear response to successive CS(tone)-US(foot shock) presentations, F1 poly(I:C) offspring showed increased conditioned fear when the CS was no longer followed by the US. Similar fear-related abnormalities were also present F2 offspring of poly(I:C)-exposed ancestors: Whilst the acquisition of the fear response during initial tone-shock conditioning was not different between F2 control and F2 poly(I:C) offspring, the latter displayed increased cued fear expression in the subsequent test phase.
Figure 4. F1 poly(I:C) offspring displayed a robust reduction in PPI scores when 110 and 120 dB stimuli served as pulses. These effects were not associated with changes in the responses to prepulse-alone or pulse-alone trials (data not shown), suggesting that prepulse detection and startle reactivity per se were not affected by prenatal immune activation. F2 offspring derived from poly(I:C)-exposed or control ancestors showed comparable PPI and responses to prepulse- and pulse-alone trials (data not shown). Hence, despite the robust PPI deficits in the F1 generation of immune-challenged mothers, the F2 generation did not inherit the sensorimotor gating deficit.

18
Figure 5. To examine affective behaviors in F1- and F2-generation offspring of immune-challenged mothers, the forced swim test was used. F1 poly(I:C) offspring did not differ from F1 control offspring with regards to the time spent floating. Despite the absence of behavioral despair in the F1 generation, however, F2 offspring of poly(I:C)-exposed ancestors spent significantly more time floating than F2 control offspring. Hence, F2 but not F1 offspring derived from immune-challenged mothers develop signs of behavioral despair.
Figure 6. Paternal lineage (PL)-derived F2 poly(I:C) offspring showed deficits in social interaction, increased fear expression and behavioral despair, but not sensorimotor gating. The former behavioral abnormalities were not associated with changes in basal locomotor activity or altered acquisition of the fear response during initial tone-shock conditioning. Interestingly, F2 poly(I:C) offspring did not display overt behavioral impairments when they were derived from the maternal lineage (ML) ancestor lineage. Demonstrating that the transgenerational transmission of behavioral deficits following prenatal immune activation is mediated via the PL but not ML.

19
1.3. Study of microbial communities
1.3.1 Taxonomy
The taxonomy is a division of the systematic field in biology; related with the
classification of organisms according specialization31. It provides the methods,
principles and rules for the classification of living organisms into taxa (categories)1.
The categories consist of levels within groups in which the largest group covers the
small one. Grouping organisms is based on similarities and differences, both natural
(structural) and phylogenetic (family relationships or affinities with other missing
organisms). The taxonomy provides direct and inferential information on the body
structure and evolutionary history of organisms respectively. The most general
taxonomic level is the Kingdom, which is divided then in other categories such as
Phylum, Class, Order, Family, Genus, and Specie31.
1.3.2 Metagenomics.
Phylogenetic relationships (evolutionary) among microorganisms using “molecular
characters” can be determined. For establishing these relationships, a series of
methods based on the comparison of nucleic acid sequence, particularly the sequence
of ribosomal RNA (rRNA, structural RNA ribosome, involved in RNA translation) are
used31. One of the most important recent discoveries in biology is that the changes in
the nucleotide sequence of ribosomal RNA (determined by mutations in the DNA
encoding ribosomal RNA) can be used as a measure to establish evolutionary
relationships between organisms.

20
Metagenomics is a new field in which it seeks to obtain genome sequences of different
microorganisms, such as bacteria, which makes up a community, globally extracting
and analyzing their DNA. The ability to directly sequence the genomes of microbes
without cultivate opens new possibilities involving a change in microbiology. This is a
scientific revolution because of its high performance and low cost that allows the access
to the genome without seeing or cultivating microorganisms2.
1.3.3 Bacterial identification by sequencing of ribosomal genes (16S rRNA)
Figure 7. 16SrRNA structure, conserved regions and hipervariables regions (V1-V9)46
To perform genome sequencing of microorganisms by analyzing their DNA, ribosomal
RNA (rRNA) genes are used24. The rRNA gene is the most conserved DNA in the
cells46. Portions of the rRNA sequence of distantly related organisms are remarkably
similar, meaning that sequences of distantly related organisms can be aligned
accurately, so that differences become easily measured. Therefore, rRNA encoding

21
genes become widely used to determine taxonomy and phylogeny, and also for
estimating rates of divergence between bacterial species30.
The 16S rRNA is the most widely used macromolecule in studies of bacterial phylogeny
and taxonomy. Its application as a molecular clock was proposed by Carl Woese in the
early 1970s, is the "target" gene most commonly used in studies of bacterial diversity,
known as a universal marker relatively unaffected by environmental pressures over
time. 16S rRNA contains about 1,500 basepairs46.
16S rRNA contains two types of regions, hypervariable regions, where the sequences
have been distanced by the evolutionary time designated as V1-V9 and strongly
conserved regions that often flanked hypervariable regions (Figure 7)46. Specific primers
are designed to bind to the conserved regions and amplify the variable regions.
The sequence analysis of the16S rRNA of various phylogenetic groups revealed the
presence of one or more characteristic sequences, which are termed “signature
oligonucleotides”. Therefore, signature oligonucleotides can be used to locate each
bacterium within their own group16.
The DNA sequence of the gene 16S rRNA has been determined for an extremely large
number of species24, 30. Sequences of tens of thousands of clinical and environmental
isolates are available through various public databases, with free internet access, such
as GenBank NCBI (National Center for Biotechnology Information), EMBL (European
Molecular Biology Laboratory), Greengenes, RDP (Ribosomal Database Project),
RIDOM (Ribosomal Differentiation of Medical Microorganisms), and other private

22
databases, as MicroSeq (Applied Biosystems), and SmartGene IDNS (Integrated
Database Network System).
It is important to keep in mind, that is the comparison of the complete genomes, and no
the comparison of 16S rRNA, which provides an accurate indication of the evolutionary
relationships. In its absence, the bacterial species are defined in taxonomy, as the set of
strains that share a similarity of 70% or more. Experiments show that strains with this
level of relatedness typically have a 97% identity or more between their 16S rRNA
genes. Thus the strains with less than 97% identity in the16S rRNA sequences are
unlikely to be related to species12. Today, the accepted species classification can only
be achieved by the recognition of genomic distances and limits between the closest
classified taxons (DNA–DNA similarity), and of those phenotypic traits that are exclusive
and serve as diagnostic of the taxon (phenotypic property)70.
The molecular identification method of bacteria by sequencing the 16S rRNA includes
three successive stages: 1) gene amplification from the appropriate sample, 2)
determining the nucleotide sequence of the amplicon, and 3) sequence analysis.
1.3.4 Next Generation Sequencing
DNA sequencing is a set of methods and biochemical techniques aimed at determining
the order of nucleotides (adenine; A, cytosine; C, guanine; G and thymine; T) in a DNA
oligonucleotide. Currently one of the most used techniques is the massive sequencing
or "Next Generation Sequencing" (NGS) which allows for millions of sequences in the
same process.

23
The continuous development of NGS, has led to a rapid increase in the amount of
genomic data generated for processing and analyzing. Unlike traditional sequencing
systems, these massive sequencing platforms, are capable of generating parallel and
massively, millions of DNA fragments in a single sequencing process in record time and
cost shrinking. Because of its high performance, this type of platform is ideal for
numerous studies on a large scale impossible to address with any other existing
technology, due to the enormous cost that this would entail.
1.3.5 Next generation sequencers
Different platforms carry out the NGS; the most common are Ion Torrent PGM (Thermo
Fisher Scientific Inc)19, MiSeq (Illumina Inc), and 454 Life Sciences (Hoffmann-La
Roche). The following explains the biochemical and physical principles of the two most
commonly used NGS platforms:
1.3.5.1 Ion Torrent PGM (IT)
Ion Torrent PGM (Personal Genome Machine) directly translates chemical encoded
information (A, T, G, C) into digital information (0,1), in a semiconductor chip, containing
millions of wells that capture chemical DNA sequencing information and convert it into
digital information19.
The sequencing process begins when a DNA sample is cut into millions of fragments,
which will bind to its complementary sequence found in each of the microspheres that
will pass through wells, copies of each of these fragments were held covering the entire
microsphere. These process covers millions of microspheres with millions of different

24
fragments. The microspheres will flow through the chip and will deposit in each of the
wells (by probabilistic chance). Thereafter, the chip is immersed by 1 of the 4-nucleotide
dNTP solutions (Deoxynucleotide Solution Mix), which contains equimolar nucleotides
concentrations of: dATP, dCTP, dGTP and dTTP. When a nucleotide is incorporated
into a DNA strand and is immersed in one of the nucleotide solutions, a hydrogen ion is
released. The released hydrogen produces pH changes in each one of the wells,
creating a voltage difference. This voltage change is registered, which indicates that a
nucleotide has been incorporated. The process is repeated every 15 s with a different
nucleotide solution and is carried out simultaneously in millions of wells (Figure 8)19 .
Figure 8. Ion Torrent PGM (IM) sequencing process (adapted from19). Four processes from left to right:

25
1 DNA sample cut into million fragments bind to the spheres, copied and coating the entire area, the process is carried out in millions of spheres. 2 Spheres flow through the chip and deposited in each of the wells, the chip is immersed in one of the four equimolar solutions and when a nucleotide is incorporated into a DNA strand a hydrogen ion is released causing pH changes generating a voltage difference. 3 Example: A polymerase incorporates a cytosine nucleotide in the DNA strand, having a complementary nucleotide (guanine) in sequence, a release of a hydrogen, a pH change and a voltage difference will occur 4 Example 2: There are two identical bases together A-A (adenine), so two nucleotides are incorporated, there will be two hydrogen ions released one by each of the joints, the voltage will double and 2 continuous bases registered.
1.3.5.2 Illumina MiSeq (IM)
Illumina MiSeq NGS, uses clonal amplification and chemical synthesis sequencing to
allow a rapid and accurate sequencing. The process (Figure 9) simultaneously identifies
DNA bases and their incorporation into a nucleic acid strand. Each base emits a single
fluorescent signal, as it is added to the growing chain, using this to determine the order
of the DNA sequence. The IM sequencing method is similar to Sanger sequencing, but
it uses modified dNTPs containing a terminator which blocks further polymerization, so
a polymerase enzyme to each growing DNA copy strand can add only a single base.
Figure 9. Illumina (IM) sequencing process29 From left to right. During sequencing, we have the primer and the fluorophores, a laser comes and excites the molecule, the fluorophore will be released emitting a color spectrum which is specific for each nucleotide, once the issue occurs, the computer has a high definition camera, which takes a picture to

26
each of the spots, as the fluorophore is gone polymerization can occurs and the next nucleotide arrives, repeating the process.
The sequencing reaction is conducted simultaneously on a very large number (many
millions) of different template molecules spread out on a solid surface. The terminator
also contains a fluorescent label, which can be detected by a camera. Only a single
fluorescent color is used, so each of the four bases must be added in a separate cycle
of DNA synthesis and imaging. Since single bases are added to all templates in a
uniform fashion, the sequencing process produces a set of DNA sequence reads of
uniform length29.
General differences among NGS platforms exist, including relative turnaround times,
per-base sequencing costs, read lengths, and several accuracies as shown in Table 2.
Table 2. Technical specifications of Next Generation Sequencing platforms (IM-Ion Torrent PGM and IM-Illumna MiSeq). Obtained from3 .All cost calculations are in dollars
IM-Ion Torrent PGM IM-Illumina MiSeq Principle of addition of nucleotides during DNA synthesis
Prepares templates by using emulsion PCR
DNA fragments are prepared by isothermic “bridge PCR”.
Error rate The error rate averages of 1.5 and 1.4 errors per 100 bases for read sequences from the forward and reverse directions, respectively
The error rate average of 0.9 errors per 100 bases for read sequences from the forward and reverse directions, respectively
Sequence yield per run 20-50 Mb on 314 chip, 100-200 Mb on 316 chip, 1Gb on 318 chip
1.5-2Gb
Run Time 2 hours 27 hours Reported Accuracy Mostly Q20 Mostly > Q30 Read length ~200 bases up to 150 bases Paired reads Yes Yes Insert size up to 250 bases up to 700 bases Typical DNA requirements 100-1000 ng 50-1000 ng Instrument Cost $80 KUSD $128 KUSD Sequencing cost per Gb* $1,000 USD (318 chip) $502 USD

27
1.3.6 Biodiversity
Biodiversity is defined as "the variability among living organisms from all sources; this
includes diversity within species, between species and of ecosystems41”. To understand
the changes in biodiversity, separation of components or indexes alpha, beta and
gamma can be very useful. Alpha diversity is the wealth of species in a particular
community which is consider as homogeneous, beta diversity is the degree of change
or replacement in species composition between different communities, and gamma
diversity is species richness of all communities that are part of an ecosystem, resulting
both alpha and beta diversities56. It is important to mention that this work focuses on
structure and diversity of bacterial communities.
1.3.6.1 Alpha diversity metrics. For full parameters of the diversity of species in a
habitat, it is advisable to quantify the number of species and their representativeness.
There are indexes that summarize a lot of information into a single value and allow us to
make quick comparisons and subject to statistical verification between the diversity of
different habitats and the diversity of the same habitat over the time41, 56.
a) Chao1 diversity index. It is an estimate of the number of species from a community
based on the number of rare species in the sample Chao 1 is a nonparametric
model42.
𝐶ℎ𝑎𝑜1 = 𝑆 + !!!!
(S is the number of species in a sample; ‘a’ is the number of represented species only by a single individual in that sample and ‘b’ is the number of species represented by exactly two individuals in the sample).

28
b) Shannon diversity index. It is a commonly used index to characterize the diversity of
species in a community, just as the Simpson index, Shannon index represents both
the abundance and uniformity of the present species42.
𝐻 = − 𝑝!∞!!! 𝑙𝑛𝑝!
c) Simpson diversity index. A community dominated by one or two species is
considered less diverse than one where different and various species have a similar
abundance. Simpson diversity index is a metric of diversity that takes into account
the number of present species and the relative abundance of each species. So if
richness and uniformity of species increase, the diversity increases42.
𝐷 = 1− (𝑛 𝑛 − 1𝑁 𝑁 − 1 )
d) Simpson reciprocal diversity index. This is an index that increases with diversity
rather than decrease. As its name says it will calculate the inverse of Simpson
index42.
∆= !!
invD=1-D
e) Rarefaction curves. Another way of exemplifying alpha diversity is through
rarefaction curves. Rarefaction is a technique for assessing species richness from
sampling results. Allows calculation of species richness for a given individual
samples, based on the construction of rarefaction curves. These curves are a
graphical representation of the number of species as a function of the number of
1. The relative proportion of species (i) is calculated with the total number of species (pi)
(n=total number of organisms of a particular species, and N=total number of organisms of all species).
Taking D as the probability of an intra specified meeting, which will increase when the community is less equitable.

29
samples. The steep slope indicates the fraction of the diversity of species, which
remains to be discovered, if the curve approaches asymptotically a maximum, it
means that a reasonable number of individual samples have been taken41.
1.3.6.2 Beta diversity metrics. The beta diversity or diversity between habitats is the
degree of replacement of species or biotic change through environmental gradients,
measuring beta diversity is based on ratios or differences41. These ratios can be
evaluated based on indexes or coefficients of similarity, dissimilarity or distance
between samples from qualitative (presence - absence of species) or quantitative data
(proportional abundance of each species measured as number of individuals, biomass,
density, coverage, etc.) as well as Heat maps, dendrograms, PLS-DA (Partial Least
Squares Discriminant Analysis) or Principal Component Analysis PCA and Principal
Coordinates Analysis PCoA graphs42.
1.7 Massive data processing
1.7.1 Bioinformatic analysis
Bioinformatics is an emerging and relatively new discipline that integrates disciplines as
biology, computer science, statistics and mathematics19. Bioinformatics comes as a
response to the exponential increase in the volume of data generated by the scientific
community over the last decade caused by the development of new high-performance
technologies such as microarrays and next generation sequencing. The difficulty of
managing a growing volume of data makes it necessary to develop new bioinformatic

30
solutions that facilitate the transformation of raw data produced in biological processes,
so that we can advance in the understanding of the molecular processes involved. In
the case of the next generation sequencing, there are many methods and bioinformatics
tools for analyzing this obtained data, the preference of each individual for programs
and platforms through graphic interfaces or terminal and also the power or
characteristics of the available computer equipment or server.
Some of these tools to perform the data analysis for the sequenced DNA microbiome
involve using virtual machines as Bio Linux or Clovr containing a set of programs used
to carry out the entire sequence analysis, open source web platforms as Galaxy where
all information is kept in the "cloud" (http://galaxy-qld.genome.edu.au/galaxy), or open
source bioinformatic pipelines and algorithms for raw data as Qiime (http://qiime.org),
Mothur ((http://www.mothur.org), Uparse, Uchime, Usearch, Ublast, Uclust among
others. Similarly, exist independent programs that allow carrying out some part of data
processing as Trimommatic and FastQC (Babraham Institute, Cambridge UK). It is
important to note that the person carrying out this type of analysis must have knowledge
of commands through (Linux) terminal, since most tools require it.
1.7.2 Bioinformatic tools for sample analysis
QIIME ™ (Quantitative Insights Into Microbial Ecology; www.quime.org)43. QIIME is an
open-source bioinformatics pipeline for performing microbiome analysis from raw DNA
sequencing data. It has been used to analyze and interpret data from nucleic acid
sequences of fungi, bacteria, viruses and archaea. QIIME is designed to take users
from raw sequencing data generated on the IM, IT or other platforms through

31
publication quality graphics and statistics. This includes demultiplexing and quality
filtering, OTU picking, taxonomic assignment, and phylogenetic reconstruction, and
diversity analyzes and visualizations. QIIME has been applied to studies based on
billions of sequences from tens of thousands of samples43. Using QIIME to analyze
data from microbial communities consists of typing a series of commands into a terminal
window, and then viewing the graphical and textual output. Some fairly basic familiarity
with a Linux-style command-line interface is useful44.
Trimmomatic18 . Trimmomatic is a bioinformatics tool that performs a variety of useful
tasks of trimming and quality analysis of the sequences. The selection of trimming steps
and their associated parameters are supplied on the command line. The trimming steps
are:
• ILLUMINACLIP: Cut adapter and other Illumina-specific sequences from the read.
• SLIDINGWINDOW: Perform a sliding window trimming.
• LEADING: Cut bases off the start of a read, if below a threshold quality
• TRAILING: Cut bases off the end of a read, if below a threshold quality
• CROP: Cut the read to a specified length
• MINLEN: Drop the read if it is below a specified length
• TOPHRED33: Convert quality scores to Phred-33
FASTQC28. FastQC is a quality control tool for high throughput sequence data. FastQC
aims to provide a simple way to do some quality control checks on raw sequence data
coming from high throughput sequencing pipelines. It provides a modular set of
analyzes, which can be use to give a quick impression of whether the data has any

32
problems of which should be aware before doing any further analysis. The main
functions of FastQC are:28
• Import of data from BAM, SAM or FastQ files (any variant)
• Providing a quick overview to tell you in which areas there may be problems
• Summary graphs and tables to quickly assess your data
• Export of results to an HTML based permanent report
USEARCH and UBLAST36. UBLAST and USEARCH are new algorithms enabling
sensitive local and global search of large sequence databases at exceptionally high
speeds. They are often orders of magnitude faster than BLAST in practical applications,
though sensitivity to distant protein relationships is lower. UCLUST is a new clustering
method that exploits USEARCH to assign sequences to clusters. UCLUST offers
several advantages over the widely used program CD-HIT, including higher speed,
lower memory use, improved sensitivity, clustering at lower identities and classification
of much larger datasets.36
UPARSE37. UPARSE, is a pipeline which reports operational taxonomic unit (OTU)
sequences with 1% incorrect bases in artificial microbial community tests, compared
with >3% incorrect bases commonly reported by other methods. The improved accuracy
results in far fewer OTUs, consistently closer to the expected number of species in a
community. It works by quality-filtering reads, trimming them to a fixed length, optionally
discarding singleton reads and then clustering the remaining reads, performs chimera
filtering and OTU clustering simultaneously. It does not require technology or gene-
specific parameters, algorithms or data, which makes it highly robust and suggests that

33
could be successfully applied to a wide range of marker genes and sequencing
technologies37.
UCHIME62. Chimeric DNA sequences often form during polymerase chain reaction
amplification, especially when sequencing single regions to assess diversity or compare
populations. Undetected chimeras may be misinterpreted as novel species, causing
inflated estimates of diversity and spurious inferences of differences between
populations. Detection and removal of chimeras is therefore of critical importance in
such experiments. UCHIME is a new program that detects chimeric sequences with two
or more segments. It either uses a database of chimera-free sequences or detects
chimeras de novo by exploiting abundance data. UCHIME has better sensitivity than
ChimeraSlayer (previously the most sensitive database method), especially with short,
noisy sequences. UCHIME is >1000× faster than ChimeraSlayer62.
Databases. It is important to mention that to carry out the processing of massive
sequencing data, one of the most important steps is the OTU picking, which needs the
use of a database as reference. 16S rRNA gene sequence and hyper variable regions
have been determined for a number of organisms, and are available in various free
access databases such as: Greengenes (http://greengenes.lbl.gov/cgi-bin/nph-
index.cgi), SILVA (http://www.arb-silva.de), RDP (Ribosomal Database Project)
(http://rdp.cme.msu.edu/) among others, and choosing one or another depends on the
researcher and the project needs or preferences.

34
2. Justification
About 1 in 6 (16%) children in the world had a developmental psychoneurological
disability (2006-2008), such as speech and language impairments to serious ones, as
intellectual disabilities, cerebral palsy, and autism11. The prevalence of the Autism
Spectrum Disorder (ASD) is being increasingly in the last years, about 1 in 68 (1.5%)
children have been identified with ASD according to estimates from Autism and
Developmental Disabilities Monitoring Network6. The total costs per year for children
with ASD in the US were estimated to be between $11.5-$60.9 billion USD.
Representing a variety of direct and in-direct costs, from medical care to special
education to lost parental productivity. On average, medical expenditures for children
with ASD were 4.1–6.2 times greater than for those without ASD14.
Schizophrenia is a mental disorder considered as part of the Autism Spectrum Disorder.
Although there is no cure (as of 2007) for schizophrenia, the treatment success rate
with antipsychotic medications and psychosocial therapies can be high. After 30 years,
of the people diagnosed with schizophrenia22:
• 25% Completely Recover
• 35% Much Improved, relatively independent
• 15% Improved, but require extensive support network
• 10% Hospitalized, unimproved
• 15% Dead (Mostly Suicide)
Today the leading theory of why people develops Schizophrenia is that it is a result of a
genetic predisposition combined with an environmental exposures and stress during

35
pregnancy or childhood that contribute to, or trigger, the disorder14. The prevalence rate
for schizophrenia was approximately 1.1% of the population over the age of 18 in
201322. Schizophrenia is a devastating disorder for most people who are afflicted, and
very costly for families and society. The overall U.S. 2002 cost of schizophrenia was
estimated to be $62.7 USD billion, with $22.7 USD billion excess direct health care cost
($7.0 billion USD outpatient, $5.0 billion USD drugs, $2.8 billion USD inpatient, $8.0
billion USD long-term care)15.
These neurodevelopmental diseases are disorders that are present in our society and
its incidence is increasing every day, therefore, is important to continue investigating
and trying to find new solutions using latest technologies. NGS is arguably one of the
most significant technological advances in the biological sciences over the last 30
years4. An increasingly diverse range of biological problems is harnessing the power
NGS technologies. Nowadays, is expected to help find the elusive, causative genetic
defects associated with neurodevelopmental disorders, such as the relationship that
exists between the brain and the gut microbiota. In comparison with traditional
sequencing, the use of NGS is regarded as ideal to discover genetic mutations and
gene expression variations causative of neurodevelopmental disorders because of the
amount and diversity of genetic variants these technologies can reveal. Biomedical
research can provide a great amount of new information, which, at times, is unrelated to
the issue that first prompted the study. This series highlights the breadth of next–
generation sequencing applications and the importance of the insights that are being
gained through these methods4.

36
3. Hypothesis
If the gut microbiota is a relevant factor on the etiology of schizophrenia, a microbial
dysbiosis will be observed in the mouse model of prenatal infection, which might work
as a microbial vector that might be also horizontally transmitted across generations.

37
4. Main objective
To demonstrate the influence of the gut microbiota in neurodevelopmental disorders by
applying bioinformatics algorithms for processing data from the next generation
microbial genome sequencing. For which the characterization of gut microbiota based in
an established mouse model of prenatal immune activation by the viral mimetic
poly(I:C), was raised.
4.1 Specific objectives
I. To compere the gut microbiota composition in relative abundance and diversity of
the F1 generation of immune challenged mice by the prenatal treatment with
poly(I:C) and the vehicle control mice.
II. To compare the results of two different NGS platforms (Illumina Miseq vs. Ion
Torrent PGM).
III. To assess whether there is a transmission of bacterial communities that are causing
dysbiosis from the F1generation to a F2 generation.
IV. To evaluate whether there is a preponderant transmission linage (maternal vs.
paternal) that is relevant for the transmission of bacterial communities from the
generation F1to a generation F2.

38
5. Materials and methods
Figure 10. (Adapted from 17) a) F1 males born to poly(I:C)-exposed mothers were mated with F1 females born to poly(I:C)-exposed mothers (N = 6 litters); and F1 males born to control mothers were mated with F1 females born to control mothers (N = 8 litters). b) The maternal (ML) and paternal lineages (PL) of F1 poly(I:C) offspring for the subsequent generation of F2 offspring was dissected. To obtain F2 poly(I:C) offspring via the ML, female F1 poly(I:C) offspring with male F1 control offspring were crossed (N = 6 litters); and to generate F2 poly(I:C) offspring via the PL, male F1 poly(I:C) offspring with female F1 control offspring were crossed (N = 7 litters). F1 control males and F1 control females were crossed to obtain the F2 control lineage. c) Experimental flow chart: the prenatal infection was carried out with the mimetic molecule poly(I:C) to the F1 and F2 generations as shown in a) and b), subsequently the offspring was divided in two different cohorts, the first one on which the behavioral tests were applied, and the second one which continue with the Microbial sample collection from the cecum, the DNA extraction, the 16SrRNA library preparation and NGS with IM-Illumina MiSeq or IM-Ion Torrent PGM and finally the bioinformatics analysis and data processing with Qiime.
5.1 Poly(I:C) prenatal infection model. C57Bl6/N mice were used throughout the
study. To generate the first-generation (F1) offspring of poly(I:C)-exposed or control
mothers (F0), female mice were subjected to a timed-mating procedure. Pregnant F0
dams on gestation day (GD) 9 were randomly assigned to receiving either a single
injection of poly(I:C) (5 mg/kg) or vehicle (sterile pyrogen-free). For each experimental
series involving F0 exposures, a total of 16 pregnant dams were used, half of which
were allocated to the poly(I:C) treatment, and the other half to the vehicle treatment.
c

39
The selected gestational window (GD 9) in mice corresponds roughly to the middle of
the first trimester of human pregnancy with respect to developmental biology and
percentage of gestation from mice to humans. All F1 offspring (48 offspring) were
weaned and sexed on postnatal day (PND) 21. Littermates of the same sex were caged
separately and maintained in groups of 3 to 5 animals per cage. Upon reaching early
adulthood (PND 70), F1 offspring were either allocated to behavioral testing or breeding,
the latter of which served to produce subsequent generations of immune-challenged or
control ancestors. Hence, behaviorally naive littermates were always used as breeding
pairs to obtain the F2 generation, thereby avoiding possible confounds in breeding mice
arising from prior behavioral testing. For generating the F2, F1 males born to poly(I:C)-
exposed mothers were mated with F1 females born to poly(I:C)-exposed mothers; and
F1 males born to control mothers were mated with F1 females born to control mothers.
In a second series of experiments, the maternal (ML) and paternal lineages (PL) of F1
poly(I:C) offspring were dissected for the subsequent generation of F2 offspring. To
obtain F2 poly(I:C) offspring via the ML, female F1 poly(I:C) offspring was cross with
male F1 control offspring; and to generate F2 poly(I:C) offspring via the PL, male F1
poly(I:C) offspring was mate with female F1 control offspring. F1 control males and F1
control females were crossed to obtain the F2 control lineage17.
5.2 Behavioral testing. For each generation, behavioral testing started when the
offspring reached PND 70 and included tests assessing social interaction, cued
Pavlovian fear conditioning, pre-pulse inhibition (PPI) of the acoustic startle reflex, and
behavioral despair in the forced swim test. For each generation, 1-2 offspring per sex
and litter were randomly selected and behaviorally tested to minimize possible

40
confounds arising from litter effects. Both male and female offspring were used in the
first experimental series. Given that the first experimental series did not reveal sex-
dependent effects in the F1 and F1 poly(I:C) offspring, all subsequent experimental
series were conducted using male offspring only in order to minimize the number of
animals. The sample sizes ranged from 9 to 14 offspring per group and sex17.
It is important to mention that the poly(I:C) model and the behavioral testing were the
ones of the previous research17: ‘Transgenerational transmission and modification of
pathological traits induced by prenatal immune activation’. We used these immune
active and tested mice for our further NGS processing and analysis of gut microbiota
relating the transmission of behavioral phenotypes across generations already reported
with the possible dysbiosis in the gut microbiota which might work as a microbial vector
that might be also horizontally transmitted across generations.
5.3 Microbiota sample collection. All the animals were sacrificed by decapitation to
proceed with the sampling. Intestinal cecum from rodent was obtained (Figs 11&12).
Figure 11. Sample collection process of cecum in mice (from left to right)
Figure 12. Acquire content (intestinal microbiota) from cecum process
Sedation Incision Withdrawthececum
Placethetissuewithbuffer
Freezethesample
Thawthesamples
Sanitizetubesandlaminar;lowhood
Emptycontentofcecum(manually
withaneedle)
Placethetissueinbuffer
Takeoutmicroorganismsadheredtocecumwalls
Homogeneizethecontentof
cecumAliquot
FreezeuntilDNA
extraction

41
Then the content from cecum was acquire, to obtain a sample of intestinal microbiota
found in it (Figure 12). The microbiota sample collection was held by the Physiology and
Behavior Laboratory, Swiss Federal Institute of Technology (ETH) Zurich,
Schwerzenbach, Switzerland.
5.4 DNA extraction. The DNA extraction (Figure 13) from intestinal contents for further
16S libraries preparation was carried out with the DNA extraction kit: QIAmp DNA Stool
Mini Kit66.
Figure 13. DNA extraction process from left to right
5.5 16S Library Preparation and Next generation sequencing.
Figure 14. 16S Library preparation process for further sequencing
The F1 samples were subjected to massive sequencing in two different types of next-
generation sequencers: 1) Ion Torrent PGM at the Support Reference Laboratory for
Characterization of Genomes, Transcriptomes and Microbiome of CINVESTAV
(CINVESTAV–IPN Mexico), and 2) Illumina MiSeq at the Department of Chemistry,
Thawthesamples Homogenize Incubate Spinthe
sampleTransferandstorealiquots
(-80ºC)Agarosegel
1stStagePCR PCRclean-up 2ndStagePCR PCRclean-up2
Libraryquanti;ication
andnormalization
Librarydenaturing
MiSeqorPGMsampleloading Sequencing

42
Biotechnology and Food Science in Norwegian University of Life Sciences (NMBU-
Norway). It is important to mention that with the exception of the second objective where
we compared the results of two different NGS platforms (IM-Illumina Miseq vs. IT-Ion
Torrent PGM), all the samples were sequenced for consistent results with only one
platform (IM-Illumina MiSeq since this was carried out at NMBU). Both the library
preparation and the next generation sequencing of the samples were carried out in the
aforementioned laboratories.
5.6 Analysis and data processing. The analysis and data processing was divided in
three main phases (Figure 15), each one represents one of the specific objectives.
Figure 15. Three main phases (in order form left to right) of the analysis and data processing
This bioinformatic analysis and data processing obtained from the next generation
sequencing was carried out using bioinformatic tools such as: Qiime, Useacrh, Uparse,
Uchime, Trimommatic, FastQC, Matlab Clustal X and MEGA; additionally, Greengenes
was used as the reference data base for all the analyzes. This processing is divided into
3 main stages or scripts: The Pre-processing, the OTU picking, and the Core diversity
analysis (Table 3).
Table 3. Three stages or scripts (Pre-processing, OTU_picking and Core diversity) used for the bioinformatic processing of the data with their function, commands and bioinformatic tools.
Stage (script) Function Commands Bioinformatic tools Pre-processing Decompressing files,
extract barcodes, join forward and
‘Extract_all_barcodes.py’ ‘Join_all_pairedends.py’
‘Split_all_libraries.py’
Qiime Trimmomatic
FastQC
Stage1F1analysis(IT,IM)
Stage2F1vsF2analysis
(IM)
Stage3F1vsF2(POL-PandPOL-M)
(IM)

43
reverse reads, trimming, quality assessment, and merge sequences
into a large sequence file.
‘fastq_stats’ ‘fastq_filter’
‘Add_qiime_labels.py’
USEARCH
OTU_picking Taxonomic assignment, inference of
phylogeny, creation of an OTU table.
‘Derep_full_length’ ‘Abundance sort’ ‘OTUs de novo’
‘Reference chimera check’ ‘Assign_taxonomy.py’
‘Filter alignment’
Qiime USEARCH UPARSE UCHIME
Core_diversity Alpha and beta diversity,
comparisons of samples, taxonomy graphs, statistical
analysis of significance between
groups.
‘Alpha_rarefaction.py’ ‘Beta_diversity_through_plots.py’
‘Summarize_taxa_through_plots.py’ ‘Compare_alpha_diversity.py’
‘Group_significance’.
Qiime
Since the F1 samples were processed with two different sequencers (Illumina Miseq and
Ion Torrent PGM), some modifications to the Pre-processing script were carried out.
The following stages: the OTU picking and the Taxonomical assignment and diversity
were run identically regardless the platform.
5.6.1 Pre-processing (Script1 ‘Filtering’)
The preprocessing includes a series of steps and commands that prepare our data
merging all sequences into one large sequence file, decompress all files, get the quality
statistics and in the case of the IM samples extract the barcodes and join all forward
and reverse reads.
All processes need a metadata file or mapping file; it must be created with all the
information of our samples. As a minimum, must contain the barcode sequence used for
each sample, the name of the samples, the sequence primer used to amplify the
sample and a description column44. This document must be created with raw text format

44
as a .txt. Subsequently we must ensure that the mapping files previously generated,
have a properly formatted and are free of errors that may affect the analysis. Qiime
contains a command that performs this function
5.6.1.1 Pre-processing with IM-Illumina MiSeq samples
1) The Pre-processing with the IM files starts decompressing the files generated by the
sequencer.
2) Then, the barcodes must be extracted, using the ‘Extract_All_barcodes.py’
command, which is designed to a fastq sequence format and barcode data. In the
output directory, there will be fastq files (barcode file, and one or two reads files)66.
We extract the barcodes in each of our 48 samples of F1 and 42 samples for the F2.
3) Next, forward and reverse IM reads need to be joined with the
‘Join_All_pairedends.py’. This script takes forward and reverse IM reads and joins
them using the method chosen. Will optionally create an updated index reads file
containing index reads for the surviving joined paired end reads66. The ‘Join
paired_ends’ method (default method) has been selected for the samples.
4) The next step is splitting all libraries; we demultiplex fastq sequence data. In this
step, we are "turning off" filter parameters, and storing the demultiplexed fastq file
with the ‘Split_All_Libraries.py’ command (Qiime scripts )
5) Then, all the sequences are merged into one large sequence file. This file will be
used in the second stage or script: the OTU_picking.

45
6) After that, the quality statistics that are needed for the trimming and quality
assessment for the following steps are obtained. The ‘fastq_stast’ command is used,
which reports statistics on reads in a fastq file67.
7) Finally, the quality reads must be removed. We make a trimming of the sequences,
and a quality assessment with the values obtained in the log file of the previous step,
using the ‘fastq_filter’ command, which performs this quality filtering and trimming of
the sequences, and also the conversion of a fastq file to fasta format67.
A value should be selected for the option –fastq_maxee E, which discard reads with > E
total expected errors for all bases in the read after any truncation options have been
applied, in both analyzes (F1 and F2), we selected a value of 0.33; for the –fastq_minlen
L option, which deletes sequences with < L number of basepairs, as the variable
regions V3 and V4 were sequenced with IM for both generations (∼450 pb), a min
length of 350pb was selected.
5.6.1.2 Pre-processing IT-Ion Torrent PGM samples.
Since for the IT samples we only work with forward reads and not with reverse reads,
and the sequences are free of barcodes and decompressed by the sequencer, we don’t
need to use the commands for this.
1) First is the trimming and quality assessment of the samples. Here, we evaluate the
quality by base sequence and quality scores, the content basis, the distribution of
sequence length and presence and quality of adapters, in order to crop, adjust, or
remove sequences.

46
We chose the command line of Trimommatic and FastQC as a graphical tool to carry
out this first step of pre-processing the F1 samples with IT. Since the variable region V3
of the 16SrRNA gene was assessed (with length of 250pb) the sequences with less
than 150bp and a quality score phred33 were discarded, also both sides were trimmed
by removing bases that not displayed in a range of good quality for each of the 48
samples. It is noteworthy that each of the samples contains a range of 25,000 to
260,000 sequences per sample.
2) Next, the data format of the files must be adapted to be processed with Qiime. IT
sequencer, generates the data in a fastq or SFF format, so it must be converted to a
fasta format (accepted format by Qiime).
3) The last step is to generate one single file (seqs.fna), which contains all the
information and sequences of each of our samples merging them all. The
add_qiime_labels.py command is used, which takes a directory, a metadata
mapping file, and a column name that contains the Fasta file names that
SamplesIDs are associated with, combines all the files that have valid Fasta
extensions into a single Fasta file, with valid Qiime Fasta labels66. A
‘combined_seqs.fasta’ file will be created in the output directory, with the sequences
assigned to the SampleID given in the metadata-mapping file44.
Since the merged file containing all the sequences and information of the samples is
generated in both Pre-processing analyses we can continue with the OTU picking.
5.6.2 OTU selection (Script 2 ‘OTU_picking’)

47
The OTU picking, is possibly the most important stage taken, is where the taxonomic
assignment, the inference of phylogeny and the creation of an OTU table takes place.
Obtaining Operational Taxonomic Units (OTUs) is based on the similarity of the
sequences within the readings, and one representative sequence of each OTU is
obtained. The protocol, assigns taxonomic identities using a reference database, aligns
the OTU sequences, creates a phylogenetic tree and builds an OTU table, which
represents the abundance of each OTU in every sample. This protocol requires a
demultiplexed sequences file as those generated in the previous step in both pre-
processing analyzes. In this stage other bioinformatics tools such as Usearch, Uchime
and Uparse are used. This second stage ‘OTU_picking’ in turn is divided into three
stages: Filtering processing, OTU processing and Taxonomy processing.
5.6.2.1 Filtering processing
1) The first step: ‘derep_full_length’, discard duplicated sequences, annotate with
cluster sizes and sort by decreasing cluster size. The aim is to reduce the number of
readings with errors. The –sizeout option may be used to specify that size
annotations are added to the unique sequence labels. USEARCH supports full-
length and prefix dereplication, but currently not substring67.
2) The next step: ‘Abundance sort’, is used for clustering when more abundant
sequences make better centroids. In 16S OTUs, more abundant sequences are
likely to be accurate biological sequences while rare or singleton reads are more
likely to contain sequencing errors or be due to PCR artifacts such as chimeras67.
3) The ‘sort_by_size’ command, sort sequences by decreasing size annotation, which
usually refers to the size of a cluster. The size is specified by a field -size=N; where

48
N is an integer. The ‑minsize option can be used to specify a minimum size. In this
case it was decided to use a –minsize of 2, so readings containing a single
sequence will be discarded as being consider chimeras or artifacts.
5.6.2.2 OTU processing
1) OTU Clustering (de novo chimera checking). The UCLUST algorithm divides a set of
sequences into clusters. A cluster is defined by one sequence, known as the
centroid or representative sequence. Every sequence in the cluster must have
similarity above a given identity threshold with the centroid. UCLUST is effective at
identities ~75% above for nucleotides. The cluster_otus command performs this
OTUs grouping using the algorithm UPARSE-OTU67. A threshold of 97% of similarity
between sequences is assigned to form part of the same cluster.
2) Subsequently the ‘reference chimera check’ is performed. The fundamental step in
UCHIME is a search for a 3-way alignment of a query sequence with two parent
sequences (A and B) such that one parent is more similar to one segment of the
query (Q) and the other parent is similar over another segment. A score is calculated
from the alignment. Higher scores indicate a stronger chimeric signal. A score cutoff
set by the ‑minh option (0.28 by default) determines whether the query is classified
as a chimera. This search can be performed with a reference database provided by
the user, or the database can be constructed de novo from the query sequences.
For the uchime_ref command, the reference database should include sequences
that might appear as parents in the query set. These should be high-quality
sequences that are believed to be free of chimeras. Errors in reference sequences

49
will degrade detection accuracy and increase the number of false positives.
Chimeras will not be detected if their parents (or sufficiently close relatives) are not
present in the database67.
3) In the next step, the ‘fasta_number.py’ command, will replace fasta labels with xxx1,
xxx2, xxx3 etc, where xxx is a prefix provided as a command-line argument. Used
e.g. to label OTUs as OTU_1, OTU_2 etc67.
4) After that the ‘Usearch_global’ command is used, to search for one (default) or a few
high-identity hits to a database using the USEARCH algorithm. The alignments are
global. To get more than one hit, increase –maxaccepts, an identity threshold must
be specified. Fasta and UDB formats are supported67. A threshold of 97% of identity
and Greengenes database were selected.
5) Next, the OTU_table will be generated with help of the ‘uc2otutab_mod.py’
command. This OTU_table is a .txt file that contains all the information obtained from
our OTUs sequences.
6) Finally, this OTU_table is converted in a biom format, so that can be carried out to
further analysis (taxonomy assignment).
5.6.2.3 Taxonomy processing
1) Taxonomy assignment. Given a set of sequences, ’assign_taxonomy.py ‘attempts to
assign the taxonomy of each sequence. The output of this step is an observation
metadata-mapping file of input sequence identifiers (1st column of output file) to
taxonomy (2nd column) and quality score (3rd column). There may be method-
specific information in subsequent columns66. Greengenes database was selected.

50
2) Add taxonomy to biom file. This taxonomic assignment now will be added to the
biom file (OTU_table.biom) generated in previous steps, creating a new OTU_table,
which will become again in a txt format for easy viewing and analysis.
3) Subsequently the alignment of sequences is performed in Qiime, with the
‘align_seqs.py’ command, which aligns the sequences in a FASTA file to each other
or to a template sequence alignment, depending on the method chosen. All aligners
will output a fasta file containing the alignment and log file in the directory specified
by --output_dir. Greengenes database was used66.
4) Next, the ‘Filter alignment’ command is used, this script should be applied to
generate a useful tree when aligning against a template alignment. Additionally, the
user can supply a lane mask file, that defines which positions should be included
when building the tree, and which should be ignored66.
5) Then, the tree is built with the ‘make_phylogeny.py’ command, which produces a
tree from a multiple sequence alignment66.
6) Finally, a compilation is generated in a summary of all the information that resides in
the biom file. A BIOM file is taken as input, and print a summary of the count
information on a per-sample basis including the number of sequences and readings,
the number of observations and the total count (sum of all values in the table) to the
new file specified by the -o parameter66.
5.6.3 Core diversity analysis (Script3 ‘Core_diversity’)
This last stage of all this processing consists in a script that plugs several Qiime
diversity analyzes together to form a basic workflow beginning with a biom table,

51
mapping file, and optional phylogenetic tree. The included scripts are those run by the
workflow scripts66:
• alpha_rarefaction.py, generates rarefied OTU tables, computes alpha diversity
metrics for each rarefied OTU table, collate alpha diversity results and generate
alpha rarefaction plots for each index that the user selects.
• beta_diversity_through_plots.py, performs beta diversity, principal coordinate
analysis, and generate a preferences file along with 3D PCoA Plots.
• summarize_taxa_through_plots.py, summarizes OTU by category, summarize
taxonomy and plot taxonomy summary at the different phylogenetic levels.
• compare_alpha_diversity.py, compares the alpha diversity of samples found in a
collated alpha diversity file. The comparison is done not between samples, but
between groups of samples. The groupings are created via the input category.
• group_significance.py, is used to compare OTU frequencies in sample groups and to
ascertain whether or not there are statistically significant differences between the
OTU abundance in the different sample groups. The script will compare each OTU
based on the passed sample groupings to see if it is differentially represented. The
sample groupings are determined by the -c option. Any samples that do not contain
a value under the given header will not be included in the comparison. At a basic
level, the script is constructing an OTUxSample (rowXcolumn) contingency table,
and testing whether or not each OTU is differentially represented in certain groups of
columns (determined by the metadata category passed).

52
Is important to mention that here the depth of sequencing is selected, the normalization
value or values to be set for the sequences of each of the samples (standardization).
For both analyzes (IT and IM) first the value of normalization of the sequences per
sample was selected. Three values for the IT F1 were chosen: 5,000, 7,000 and 10,000
and two for the IM F1and F2: 13,000 and 15,000. This because of the different amount of
sequences per sample that each analysis present.
In each of the standardization analyzes, a different number of samples is discarded.
Those samples that are discarded are the ones that do not reach the set number of
sequences per sample. These values were chosen randomly, trying to make the
smallest possible number of discarded samples. For the alpha analysis: Shannon,
Simpson, Simpson reciprocal and Chao1 indexes were selected, also the number of
Observed Species. Finding significant differences between groups was conducted with
the statistical analysis for nonparametric data, Kruskal Wallis. A p value ≤0.05 was
consider as significant. In addition to this three stages of data processing, for all the
analyzes with both generations F1 and F2 some MATLAB plots of the significant OTUs
were created, and taxonomy trees were build using the RDP (Ribosomal Database
Project), MEGA and Clustal X for a better analysis of the data.

53
6. Results and Discussion
6.1 F1 generation gut microbiota sequenced with IT-Ion Torrent PGM vs. IM-
Illumina MiSeq.
Is important to mention that with the exception of mandatory differences in platform-
specific sequencing adaptors, the bidirectional sequencing strategy used in IM (forward
and reverse primers) and the hypervariable regions that were sequenced (V3 IT vs. V3
and V4 for IM) which necessarily are uncontrolled variables, the processing and data
analysis of the samples was maintained identically for both sequencing NGS
technologies.
The generated data with two NGS platforms presents several similarities and some
important differences. This 16S rRNA amplicon analysis was done by separating the
data in the two interest groups poly(I:C) (POL) and control (SAL) for each NGS platform
analysis, focusing on the finding of similarities and differences between both; specially
in the abundance and the presence of bacterial communities in each group that can
lead to a dysbiosis.
The normalization of the number of sequences per sample was better for the analysis
with IM (13,000 and 15,000 sequences/sample) since most of the samples were found
in a smaller range of sequences, in contrast to the IT samples (5,000, 7,000 and 10,000
sequences/sample).
6.1.1 Taxonomy classification. The taxonomy classification plots (Figs 16 & 17)
shows the most abundant bacterial communities that were present in each group. We

54
did not find significant difference (Chi2) in taxonomy between the diverse analyzes of
standardization neither on IM nor in IT.
Figure 16 F1 IT-Ion Torrent taxonomy assignment (10,000 normalization value) in both treatment groups (POL: poly(I:C) offspring, SAL: control offspring). A genus of the order of Clostridiales (1) as the most abundant community with ∼30%, a genus of the family of Lachnospiraceae (2) as the second most abundant community with ∼25%, and a genus of the S24-7 family (3) as the third most abundant community with ∼20%.
Figure 17 F1 IM-Illumina taxonomy assignment (15,000 normalization value) in both treatment groups (POL: poly(I:C) offspring, SAL: control offspring). A genus of the order of Clostridiales (1) as the most abundant community
1 1
3 3
F1
F1
2 2
1 1 3 3
2 2
POL
F1 F1
SAL
F1 F1
POL
F1 F1
SAL
F1 F1

55
with ∼26%, a genus of the family S24-7 (2) as the second most abundant community with ∼19%, and a genus of the family of Lachnospiraceae (3) as the third most abundant community.
In the F1 IT samples showed a dominance of the bacterial communities Firmicutes and
Bacteroidetes can be observed; a genus of the order of Clostridiales as the most
abundant community with ∼30% in both groups and a genus of the family of
Lachnospiraceae as the second most abundant community with 28.5% in the POL
group and a less abundance in the SAL group with 20.0% both of them from phylum
Firmicutes. From the Bacteroidetes phylum a genus of the S24-7 family is the third most
abundant community with ∼20%.
Now using IM platform the F1 data indicate also a dominance of bacterial groups
Firmicutes and Bacteroidetes. Being the most abundant bacterial community the genus
of the order of Clostridiales with ∼26% in both groups. A genus of the family S24-7 from
the Bacteroidetes phylum was the second most abundant community with ∼19%, and a
genus of the family Lachnospiraceae was the third most abundant community with 8.9%
in the POL group and 8.6% in the SAL group. It should be noted that a reduced relative
abundance in both treatment groups was observed compared with the IT taxonomy
results where this community was the second most abundant with 28.5%, and 20.0%
respectively.
For both sequencing technologies (IT vs. IM), a very similar distribution of the most
abundant bacterial communities was obtained the groups, with a predominance of the
order Clostridiales from the phylum Firmicutes and the family S24-7 order of
Bacteroidales and from the Bacteroidetes phylum. Hoffman et al. 3 reported results with

56
similarities in the taxonomy abundance of bacterial communities when comparing both
sequencers (IT vs. IM).
6.1.2 Alpha diversity analysis. Rarefaction curves are shown in Figures 18 & 19 of the
10,000 and 15,000 sequences/sample normalization values respectively are presented
as they implicitly include the other standardization analysis (5,000, 7,000 IT and 13,000
sequences/sample IM, plots can be visualized in the Annex 2).
For the IT case in all the rarefaction curves it was observed a tendency and a significant
difference of the POL group to have lower diversity values in contrast to the SAL group.
This result can be interpreted as a less diversity and abundance of bacterial species in
the POL group in comparison to the SAL group. For the IM case, no significant
difference (t-stud) was observed, as they don’t present more or less abundance with
respect the other group. This data is contradictory since for IT NGS platform there is a
significant group effect, where as for the IM NGS platform groups have a similar
abundance of bacterial diversity regardless of pre-natal treatment (POL vs. SAL).
6.1.2.1 Rarefaction plots
A B
* *

57
Figure 18. F1 Rarefaction curves of alpha diversity in both treatment groups (POL: poly(I:C) and SAL: control) with the Ion Torrent analysis. Indexes of diversity: A) Chao1, B) Observed species, C) Shannon, D) Simpson and E) Simpson reciprocal. POL-red line, SAL-blue line. A tendency of less diversity in the POL group with respect the SAL group can be observed.
C D
A B
E

58
Figure 19. F1 Rarefaction curves of alpha diversity in both treatment groups (POL: poly(I:C) and SAL: control) with the Illumina analysis. Indexes of diversity: A) Chao1, B) Observed species, C) Shannon, D) Simpson and E) Simpson reciprocal. POL-red line, SAL-blue line. No tendency of less or more diversity can be found in any of the treatment groups.
It is relevant to mention that in both cases in Shannon, Simpson and Simpson reciprocal
indexes can be observed that the sequencing effort was enough, as the curve tends to
stabilize before the 2,000 sequences/ sample.
6.1.2..2 Statistic analysis of alpha diversity. The statistical analysis (t-stud) for the IT
samples the Chao 1 index (Fig 18-A) and the Observed species (Fig 18-B) reported a
statistical significant difference between both groups F1 POL and F1 SAL, in all the
different analyzes of standardization. This data can be interpreted as the diversity and
abundance in the F1 POL samples were less than those in the F1 SAL samples.
C D
E

59
Interestingly, in the other three indexes Shannon (Fig 18-C), Simpson (Fig 18-D) and
Simpson reciprocal (Fig 18-E) there wasn’t a statistical significant difference, but the
mean values obtained showed that there is a trend of lower diversity of the F1 POL
group compared to the F1 SAL group. In contrast, for the IM data the rarefaction curves
showed no statistical significant difference (t-stud) between the abundance and diversity
of the F1 POL and F1 SAL groups (Fig 19).
In this regard, alpha diversity analysis showed controversial results when comparing
two different NGS platforms, as the analysis with the IT platform did found statistically
significant differences, whereas IM did not. A possible explanation for this inconsistence
might be related to some artifacts in sequencing or an error rate of sequencers. It is
important to mention that to our knowledge differences in alpha diversity comparing two
or more NGS platforms have not been previously reported, thus the validity and
reproducibility of this sequencing technologies might be still questionable, and the
necessity of standardization procedures and references are necessary and desirable to
develop in the near future.
6.1.3 Significant OTU selection. Interestingly, a different quantity of significant OTUs
were obtained for each of the standardization values in both analyzes IT vs. IM (Tables
4 & 5). The complete tables with all the significant OTUs could be visualized in Annex3.
Table 4. Number of significant OTUs with the IT-Ion Torrent analysis in the three normalization values (5000, 7000 and 10,000 sequences/sample)
5,000 Analysis 7,000 Analysis 10,000 Analysis 77 Significant OTUs 88 Significant OTUs 100 Significant OTUs

60
Table 5. Number of significant OTUs with the IM-Illumina analysis in the two normalization values (13,000 and 15,000 sequences/sample)
13,000 Analysis 15,000 Analysis 15 Significant OTUs 10 Significant OTUs
The total assignment of bacterial communities in each of our analysis, generated a
different value of OTUs: 411 in IM and 2,756 in IT. This may explain why a different
amount of significant OTUs (Kruskal Wallis) was obtained from each of the treatment
groups depending on the NGS platform; for IT 100 statistically significant OTUs were
obtained, while for IM just 10 statistically significant OTUs were obtained (both statistical
analyzes were performed taking into account the larger value of: 1,000 and 15,000
sequences per sample respectively). It is important to mention that we found common
significant OTUs independent of the NGS platform employed. For instance, the S24-7
families from the Bacteroidetes phylum, diverse OTUs from the order of Clostridiales,
some Prevotella genus and Distasonis species. However, the reported relative
abundance of these OTUs varied considerably between the NGS platforms. Similarly,
Hoffman et al.3 have previously reported that the abundance of one or more organisms
detected by a NGS platform (OTUs) was significantly different from that detected by
other NGS platform.
Most of the significant OTUs found in the IT analysis belong to the Firmicutes and
Bacteroidetes phylum:
• Different orders of Clostridiales and Lachnospiraceae, Ruminococcaceae and
Erysipelotrichaceae families from Firmicutes

61
• Many S24-7 and some Rickenellaceae families, some Prevotella and Oridobacter
genus from the Bacteroidetes phylum.
• Also significant bacterial communities present from the Proteobacteria phylum:
Rhodobacter, Sutterella and Rhodoplanes genus, and Chromatiaceae and
Alcaligenaceae families.
Consistentetly, most of the significant OTUs found in the IM analysis also belong to the
Firmicutes and Bacteroidetes phylum:
• From the Firmicutes phylum: orders of Clostridiales, families of Lachnospiraceae
and Ruminococcaceae, and Candidatus Arthromitus, Dehalobacterium and Dorea
genus are present.
• From the Bacteroidetes phylum: S24-7 and Rikenellaceae families, Prevotella and
Parabacteroides genus
• One genus from Actinobacteria phylum: Adlercreutzia.
6.1.3.1 Significant OTU selection regardless the normalization value. It is important
to mention that not all of the statistically significant OTUs found in one analysis with a
specific NGS platform / normalization value, were found with another analysis with a
different NGS platform / normalization value (Figs 20 & 21). Therefore, we decided to
focus just on the OTUs that remained constantly statistically significant different
between treatment groups regardless the value of normalization.

62
Figure 20. 6 OTUs that show statistically significant difference between groups. White: SAL (control group), Black: POL (poly(I:C)) group, regardless the normalization value with IT-Ion Torrent analysis. A-D show OTUs that are less abundant in the POL in comparison to SAL (Bacteroidales S24-7, Prevotella, Oscillospira, Lachnospiraceae); E-F show OTUs that are more abundant in the POL in comparison to SAL (Bacteroidales S24-7 and Erysipelotrichaceae).
For the IT analysis, 6 OTUs that remained statistically significant different (Kruskal
Wallis) in the three analyzes were obtained (5,000, 7,000 and 10,000
sequences/sample), 3 from the phylum of the Bacteroidetes (the genus Prevotella of the
family Paraprevotellaceae (Fig 20 A) and 2 genera of the family S24-7 of the order
Bacteroidales (Fig 20 B and Fig 20 F) as well as 3 OTUs of the phylum Firmicutes (the
family Lachnospiraceae of the order Clostridiales (Fig 20 C), the genus Oscillospira of
the family Ruminococcaceae (Fig 20 D) and the family Erysipelotrichaceae of the order
Erysipelotrichales (Fig 20 E). It must be taken into account, that the OTUs 45
0
20
40
60 OTU45; [Prevotella]
0
2
4
6
8 OTU1063; Bacteroidales; S24�7
0
5
10
15OTU1201; Lachnospiraceae
0
1
2
3OTU1328; Oscillospira
5,000 7,000 10,0000
5
10
15OTU154; Erysipelotrichaceae
5,000 7,000 10,0000
20
40
60
Sequences/sample
Rela
tive
abun
danc
e %
OTU54; Bacteroidales; S24�7
A B
C D
E F
POL SAL
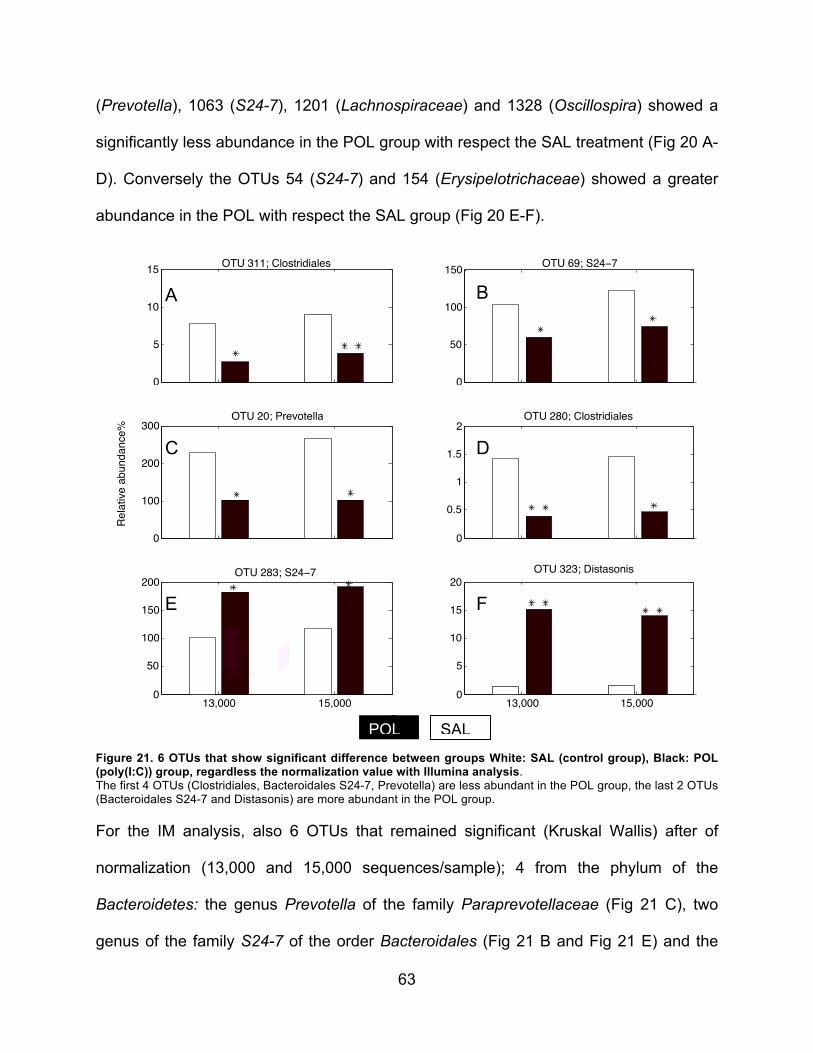
63
(Prevotella), 1063 (S24-7), 1201 (Lachnospiraceae) and 1328 (Oscillospira) showed a
significantly less abundance in the POL group with respect the SAL treatment (Fig 20 A-
D). Conversely the OTUs 54 (S24-7) and 154 (Erysipelotrichaceae) showed a greater
abundance in the POL with respect the SAL group (Fig 20 E-F).
Figure 21. 6 OTUs that show significant difference between groups White: SAL (control group), Black: POL (poly(I:C)) group, regardless the normalization value with Illumina analysis. The first 4 OTUs (Clostridiales, Bacteroidales S24-7, Prevotella) are less abundant in the POL group, the last 2 OTUs (Bacteroidales S24-7 and Distasonis) are more abundant in the POL group.
For the IM analysis, also 6 OTUs that remained significant (Kruskal Wallis) after of
normalization (13,000 and 15,000 sequences/sample); 4 from the phylum of the
Bacteroidetes: the genus Prevotella of the family Paraprevotellaceae (Fig 21 C), two
genus of the family S24-7 of the order Bacteroidales (Fig 21 B and Fig 21 E) and the
0
5
10
15 OTU 311; Clostridiales
0
50
100
150 OTU 69; S24�7
0
100
200
300OTU 20; Prevotella
0
0.5
1
1.5
2OTU 280; Clostridiales
13,000 15,0000
50
100
150
200OTU 283; S24�7
13,000 15,0000
5
10
15
20
Sequences/sample
Rela
tive
abun
danc
e%
OTU 323; Distasonis
POL SAL
A B
C D
E F

64
specie Distasonis of the genus Parabacteroides (Fig 21 F) as well as 2 OTUs of the
phylum Firmicutes: two families of the order Clostridiales (Fig 21 A & D). In this case,
the OTUs 323 (Distasonis), and 283 (S24-7) showed a significantly higher abundance in
the POL group; conversely the OTUs 69 (S24-7), 280 (Clostridiales), 20 (Prevotella)
and 311 (Clostridiales) showed a less abundance in the POL group in comparison to
SAL condition (Fig 21 A-D).
6.1.4 Phylogenetic analysis. For a better visualization and classification of these 12
significant OTUs, phylogenetic trees were built using Clustal X, MEGA, and a taxonomy
reassignment with Ribosomal Database Project (RDP).
As shown in the phylogenetic tree data is organized into 2 microbial clusters; one that
belongs to the phylum Bacteroidetes and the other belonging to the phylum Firmicutes
(Figure 22). From the Bacteroidetes cluster a closer grouping showed three pairs of
OTUs; the OTUs 20 IM and 45 IT remained grouped and seemed that they belong to
species of Prevotella, being both of them less abundant in the F1 POL group (Fig 20 A &
Fig 21 C). The OTUs 283 and 69 IM and 54 and 1063 IT cluster together belonging to
the order Bacteroidales as in the Greengenes assignment, but in a more specific way
they seemed to be Barnesiella species. It is remarkable that OUT 69-IM and OUT 1063-
IT showed a less abundance in the F1 POL group (Fig 21 B & Fig 20 B), and the other
pair (OTU 283-IM and OUT 54-IT) showed a dominance of abundance in the F1 POL
group with respect the F1 SAL group (Fig 20 F & Fig 21 E).

65
Figure 22. Phylogenetic tree of the significant OTUs in the F1 generation for both analyzes (IT-Ion Torrent and IM-Illumina). (The numbers in each branch are the values of the Bootstrap and the length of the branches the phylogenetic distance) Firmicutes phylum: Green / Bacteroidetes phylum: red. Taxonomy re-assignment with RDP. Prevotella OTUs (20 IM and 45 IT) and Barnesiella OTUs (283 and 69 IM, 54 and 1063 IT), are present as significant in both NGS platforms.
In the other big cluster (Firmicutes) OTUs were not grouped with a high similarity as in
the first one. All OTUs seemed to be some species and genus of Clostridiales, but there
was not a specific grouping between OTUs with any of the NGS platforms.
OTU 20 IM SAL
OTU 45 IT SAL
Prevotella bivia
Prevotella nigrescensCoprobacter secundus
Porphyromonas pasteri
OTU 323 IM POL
Parabacteroides distasonis
Butyricimonas synergistica
OTU 283 IM POL
OTU 54 IT POL
OTU 69 IM SAL
OTU 1063 ITSAL
Barnesiella intestinihominis
Barnesiella sp.
OTU 1328 IT SAL
Clostridium orbiscindens
OTU 154 IT POL
Brevibacullis fulvus
OTU 280 IM SAL
OTU 311 IM SAL
Sporanaerobacter sp.
Clostridium sp
Lachnospiraceae bacterium
Clostridium indolis
OTU 1201 ITSAL
Clostridium sp.7 9
9 8
9 4
9 7
9 2
6 1
4 5
4 9
9 4
8 2
100
9 4
5 9
7 0
7 2
9 5
2 3
3 0
1 2
9 8
2 7
0.02
99
99
66

66
With the help of the phylogenetic tree and the generated clusters it is documented that
some of these significant OTUs in each analysis are phylogenetically close, with some
of them being reassigned taxonomically using the RDP database.
In summary, these results indicate that there are differences in the presence and
abundance of bacterial communities in the gut microbiota between the F1 generation of
immune challenged mice that present a neurodevelopmental disorder generated by
poly(I:C) with respect the control mice. This change might be considered as an
irregularity in the microbiota within the body and therefore a dysbiosis. Importantly, we
found important and significant differences in results with each type of NGS platforms
as shown in Table 6. However, results from both NGS platforms (IM or IT) consistently
reported the irregularity in the gut microbiota with specific bacterial communities of the
orders Clostridiales and Bacteroidales.
Table 6. Summary and comparison between platforms (IT and IM). * Normalization value (sequences/sample), o_order, f_family, g_genus, s_specie.
Specifications IT-Ion Torrent PGM IM-Illumina MiSeq Sequenced hypervariable regions
V3 V3 and V4
Normalization values 5,000 7,000 and 10,000 13,000 and 15,000 Taxonomy assignment (most abundant bacterial communities)
Order Clostridiales Family Lachnospiraceae Order Bacteroidales (S24-7)
Order Clostridiales Order Bacteroidales (S24-7) Family Lachnospiraceae
Alpha diversity Less diversity abundance in POL group
No difference in diversity abundance between groups
Total OTU selection 2,756 OTUs 411 OTUs Significant OTUs between treatment groups POL vs SAL
5,000*= 77 OTUs 7,000*= 88 OTUs 10,000*= 100 OTUs
13,000*= 15 OTUs 15,000*= 10 OTUs
Significant OTUs between treatment groups POL vs SAL regardless the normalization value
g_Prevotella, 2 o_Bacteroidales (S24-7), f_Lachnospiraceae, g_Oscillospira, f_Erysipelotrichaceae.
2 o_Clostridiales, 2 o_Bacteroidales (S24-7), g_Prevotella, s_Distasonis.
More abundant significant OTUs in POL group
f_Erysipelotrichaceae and o_ Bacteroidales (S24-7)
O_ Bacteroidales (S24-7) and s_Distasonis
Less abundant significant OTUs in POL group
g_Prevotella, 2 o_Bacteroidales (S24-7), f_Lachnospiraceae, g_Oscillospira.
2 o_Clostridiales, o_Bacteroidales (S24-7), g_Prevotella.

67
6.2 Possible transmission of bacterial communities that are causing dysbiosis
between the F1 to the F2 generation.
For the second objective the transmission of a dysbiosis in the gut microbiota from the
F1 to the F2 generation was assessed. The same way as in the first objective, the
analysis was done by separating the data in the two treatment groups POL and SAL but
now also analyzing it across two generations (F1 vs. F2). It is important to mention that
just IM-NGS platform was employed to avoid an additional variable. All the F1
generation analysis is the same data that was already obtained in the first objective (IM
analysis). Additionally, the value of normalization of 15,000 sequences/sample was
selected based on the previous results; all the subsequent analyzes were reported
using it. Plots with data of the 13,000 sequences/sample normalization value can be
observed in Annex2.
6.2.1 Taxonomy classification. Taxonomy remained very similar in both generations
as shown in Figs 23 & 24. The same bacterial communities appeared to be the most
abundant and a dominant: Firmicutes and Bacteroidetes.
The most abundant bacterial community was a genus of the order of Clostridiales with
∼28% in both generations, and it seemed to be more abundant in the F2 generation with
26.3% (F1-POL) and 29.4% (F2-POL) and 27.8% (F1-SAL) and 31.1% (F2-SAL). A
genus of the family S24-7 from the Bacteroidetes phylum was the second most
abundant community with ∼19% presenting a little more abundance in the F2 generation
POL group 18.8% (F1) and 19.63% (F2). A genus of the family of Lachnospiraceae was
the third most abundant community with less abundance in the F2 generation with 8.9%

68
(F1-POL) and 5.1% (F2-POL) and 8.6% (F1-SAL) and 7.5% (F2-SAL). A genus of the
family of Rumminococcaceae presented more abundance in both POL and SAL groups
for the F2 generation with 5.0% (F1-POL) and 6.0% (F2-POL), and 3.6% (F1-SAL) and
5.8% (F2-SAL).
By the other way a genus of the family of Rikenellaceae presented less abundance in
both POL and SAL groups for the F2 generation with 6.5% (F1-POL) and 3.7% (F2-POL)
and 6.8% (F1-SAL) and 3.6% (F2-SAL). No significant difference neither in the SAL
groups or POL groups between generations was found (Chi2).
Figure 23. Taxonomy assignment for the F1 and F2 generations in SAL: control offspring treatment group. A genus of the order of Clostridiales (1) with 27.8% (F1-SAL) and 31.1% (F2-SAL), a genus of the family S24-7 (2) with 19.7% (F1-SAL) and 19.5% (F2-SAL), a genus of the family of Lachnospiraceae (3) with. 8.6% (F1-SAL) and 7.5% (F2-SAL), a genus of the family of Rumminococcaceae (4) with 3.6% (F1-SAL) and 5.8% (F2-SAL) and a genus of the family of Rikenellaceae (5) with 6.8% (F1-SAL) and 3.6% (F2-SAL).
F1 F2
1 1
3 3
2 2
5
4 4
5

69
Figure 24. Taxonomy assignment for the F1 and F2 generations in POL: poly(I:C) offspring treatment group. A genus of he order of Clostridiales (1) with 26.3% (F1-POL) and 29.4% (F2-POL), a genus of the family S24-7 (2) with 18.8% (F1-POL) and 19.63% (F2-POL), a genus of the family of Lachnospiraceae (3) with. 8.9% (F1-POL) and 5.1% (F2-POL), a genus of the family of Rumminococcaceae (4) with 5.0% (F1-POL) and 6.0% (F2-POL) and a genus of the family of Rikenellaceae (5) with 5.0% (F1-POL) and 6.0% (F2-POL).
6.2.2 Alpha diversity analysis. For the alpha diversity analysis, in both cases no
significant group difference of abundance in the alpha diversity rarefaction plots (Annex
2) were observed. This data allow us to conclude that both treatment groups remain
with a very similar diversity for each generation F1 and F2. Consistently, no statistically
significant difference were found in abundance and diversity between the POL and SAL
groups in both generations F1 and F2 with the statistical analysis (data not shown).
6.2.3 Significant OTU selection. The number of total obtained assigned OTUs in each
analysis was different. The F1 generation had an allocation of 411 OTUs and the F2
generation an allocation of 342 OTUs before applying the statistical test (Kruskal Wallis)
for significance. The number of statistically significant OTUs between each of the
generations was different for each generation: 10 significant OTUs were obtained in the
F1 generation and 30 significant OTUs in the F2 generation. It is noteworthy that the vast
F1 F2
1 1 3 3
2 2
5
4 4
5

70
majority of these OTUs belong to the same families and genera across generations.
The complete tables with all the significant OTUs could be visualized in Annex3.
6.2.3.1 Significant OTU selection F1. For the F1 analysis all statistically significant OTUs
belong to the Firmicutes and Bacteroidetes phylum, as follow:
• Different genus from the order of Clostridiales, and the Mogibacteriaceae family also
from the Clostridiales order.
• Many S24-7 families, the Prevotella genus and the Distasonis specie from the
Bacteroidales order.
Figure 25. Significant OTUs present between treatment groups (POL: poly(I:C) and SAL: control) in the F1 generation. A-G show OTUs that are less abundant in the POL group than in SAL (Clostridiales, Bacteroidales S24-
0
100
200
300 OTU 20; Prevotella
0
50
100
150 OTU 42; S24�7
0
50
100
150 OTU 69; S24�7
0
5
10
15
20 OTU 400; S24�7
0
10
20
30OTU 311; Clostridiales
0
20
40
60OTU 215; Clostridiales
0
10
20
30
40OTU 280; Clostridiales
0
10
20
30OTU 388; Mogibacteriaceae
SAL POL0
10
20
30 OTU 323; distasonis
SAL POL0
100
200
300OTU 283; S24�7
Sequences/sample
Rela
tive
Abun
danc
e%
A B C D
E F G H
I J
POL SAL

71
7, Prevotella); H-J show OTUs are more abundant in the POL group than in SAL (Mogibacteriaceae, Bacteroidales S24-7 and Distasonis).
Analysis indicate that for the F1 generation the OTUs 20 (Prevotella), 42 (S24-7), 69
(S24-7), 400 (S24-7), 311 (Clostridiales), 215 (Clostridiales) and 280 (Clostridiales)
showed a significant less abundance in the POL group than in the SAL group (Fig 25 A-
G), and in the case of the OTUs 323 (Distasonis), 283 (S24-7) and 388
(Mogibacteriaceae) they showed more abundance in the POL group than SAL group
(Fig 25 H-I).
This F1 generation results that we obtained show some similarities with the previously
reported Hsiao35 results, were they postulated that “the microbiota modulate behavioral
and physiological abnormalities associated with neurodevelopmental disorders” with the
same poly(I:C) model in a F1 generation offspring; they reported changes in the diversity
of the gut microbiota specifically in Clostridia and Bacteroidia OTUs (same as we are
reporting), however, in the next taxonomic levels (family, genus or specie) they found as
significant the bacterial communities of the families: Lachnospiraceae,
Ruminococcaceae, Erysipelotrichaceae, Alcaligenaceae, Byphyromonadaceae,
Prevotellaceae, Rikenellaceae and un-classified Bacteroidales, where only the
Prevotellaceae family coincided with our results. Interestingly, they reported that
Porphyromonadaceae, Prevotellaceae, unclassified Bacteriodales and Lachnospiriceae
were more abundant in poly(I:C) offspring. Conversely, Ruminococcaceae,
Erysipelotrichaceae, and the beta Proteobacteria family Alcaligenaceae were more
abundant in control offspring, suggesting that specific Lachnospiraceae, along with
other Bacteroidial species, may play a role in ASD pathogenesis, while other taxa may
be protective. And we reported that Mogibacteriaceae, Bacteroidales S24-7 and

72
Distasonis were more abundant in the poly(I:C) offspring and Clostridiales, another
Bacteroidales S24-7 and Prevotella were more abundant in the control group,
suggesting that Mogibacteriaceae and Distasonis may play a role in ASD pathogenesis,
while Prevotella and another Clostridiales may be protective.
In another previous research of gut microbiota in ASD human individuals, Song et al.68,
reported a significant increase specifically in Clostridium bolteae and Clostridium
clusters I & X, and Wang et al.69 reported higher abundance of Sutterella and
Ruminococcus spp. in individuals with ASD compared to controls without a family
history of ASD.
6.2.3.2 Significant OTU selection F2. In the F2 generation, most of the significant OTUs
between treatment groups POL and SAL belong to the Firmicutes and Bacteroidetes
phylum and some others belong to the Cyanobacteria and Verrucomicrobia phylum, as
follows:
• Several genus of the order Clostridiales, the Mogibacteriaceae, Lachnospiraceae
and Ruminococcaceae families, and the Ruminococcus, Lactobacillus and
Oscillospira genus and the gnavus specie from the Clostridiales order.
• Two S24-7 families, and two Rikenellaceae families from the Bacteroidales order.
• The order YS2 from the Cyanobacteria phylum.
• The specie Muciniphila order of Verrucomicrobiales from the Verrucomicrobia
phylum.

73
Figure 26. Significant OTUs present between treatment groups (POL: poly(I:C) and SAL: control) in the F2 generation, this OTUs presented more abundance in the POL group.
As shown in Figure 26 the OTUs: 284 Clostridiales (A), 209 Ruminococcaceae (B), 324
Oscillospira (C), 44 Muciniphila (D), 152 Clostridiales (E), 261 S24-7 (F), 27
Ruminococcus (G), 294 YS2 (H), 10 Clostridiales (I), 63 Rikenellaceae (J), 268
Lachnospiraceae (K) and 171 Lactobacillus (L), showed more significant abundance in
the F2 POL group with respect the F2 SAL group. By the other way in Figure 27 the
OTUs: 301 Oscillospira (A), 84 Clostridiales (B), 129 Oscillospira (C), 191
Ruminococcus (D), 91 Oscillospira (E), 180 S24-7 (F), 45 Clostridiales (G), 252
Mogibacteriaceae (H), 76 Clostridiales (I), 343 Ruminococcus (J), 153
Ruminococcaceae (K), 39 Clostridiales (L), 248 Ruminococcus (M), 246 Clostridiales
(N), 293 Lachnospiraceae (O), 183 Rikenellaceae (P) and 263 Clostridiales (Q) showed
less significant abundance in the F2 POL group with respect the F2 SAL group.
0
5
10 OTU 284; Clostridiales
0
20
40OTU 209; Ruminococcaceae
0
20
40
60 OTU 324; Oscillospira
0
50
100 OTU 44; muciniphila
0
50
100OTU 152; Clostridiales
0
10
20
30OTU 261; S24�7
0
100
200OTU 27; Ruminococcus
0
10
20
30OTU 294; YS2
SAL POL0
200
400
600OTU 10; Clostridiales
SAL POL0
50
100OTU 63; Rikenellaceae
SAL POL0
10
20
30OTU 268; Lachnospiraceae
SAL POL0
50
100OTU 171; Lactobacillus
Sequences/sample
Rela
tive
Abun
danc
e%
A B C D
E F G H
I J K L
POL SAL

74
Figure 27. Significant OTUs present between treatment groups (POL: poly(I:C) and SAL: control) in the F2 generation, this OTUs presented less abundance in the POL group.
Furthermore, for the F2 generation, some of the significant OTUs between treatment
groups from the F1 generation remained present (i.e. transmitted): S24-7 families,
various orders of Clostridiales and the Mogibacteriaceae family. However, some of the
OTUs in the F2 generation that are significant (Kruskal Wallis) between treatment
groups were not found as statistically significant (Kruskal Wallis) in the F1 generation, as
follow: Lachnospiraceae and Ruminococcaceae families from the Firmicutes phylum,
Rikenellaceae families from the Bacteroidetes phylum, an order of Cyanobacteria and
Muciniphila species from the Verrucomicrobia phylum (Figs 26 A-L & 27 A-Q).
A B C D
E F G H
I J K L
M N O P
Q
POL SAL

75
Interestingly, in both F1 and F2 generations, most of the found significant OTUs were
reported with a less abundance in POL groups compared to SAL groups.
6.2.4 Phylogenetic analysis. In the phylogenetic tree shown in Figure 28, it can be
visualized that there are two big clusters of bacteria; the large one of the Firmicutes
phylum and the small one of the Bacteroidetes phylum.
In the Firmicutes phylum cluster the pairs of OTUs: 215 F1 with 263 F2 and 280 F1 with
246 F2 from the order Clostridiales more specifically Gracillibacter species, produced
differences in the gut microbiota all of them with less abundance in the POL group and
more specifically were clearly transmitted from F1 generation to F2 generation.
On the other hand, within the Bacteroidetes phylum cluster presented a possible
transmission from the F1 to the F2 generation as shown by the aggrupation of OTUs: 42,
283, 69 and 400 for the F1, and 261 and 180 for the F2, which were assigned as
Barnesiella species. However, it is not clearly shown a relationship between the
transmission of these significant OTUs across generations and their abundance in the
POL group vs. SAL grup.
In summary, these results suggest that both F1 and F2 generations showed differences
in the presence and abundance of bacterial communities in the gut microbiota of
immune challenged mice that present a neurodevelopmental disorder generated by
poly(I:C) with respect the control mice. The orders Clostridiales and Bacteroidales are
confirmed as the primary drivers of gut microbiota differences between the prenatal F1
treatment groups (POL vs. SAL). It is important to mention that specifically the species
Gracillibacter (Clostridiales) with a less abundance in the POL group and Barnesiella

76
(Bacteroidales) were transmitted from F1 generation to F2 generation. All these results
have a direct relationship with the results of novel phenotypes across generations17 in
which our work is based and the same cohorts of mice are analyzed, inasmuch as they
demonstrated that prenatal viral-like immune activation leads to a transmission of
behavioral phenotypes across generations. Whereas social interaction deficits and
increased cued fear expression are similarly present in the F1 and F2 offspring of
immune-challenged mothers, and increased behavioral despair emerges as a novel
phenotype in the F2 generation, suggesting that maternal immune activation during
pregnancy can induce latent behavioral symptoms that are passed on to and become
manifest only in subsequent generations.
In both researches, for the F1 generation, the behavior changes (impaired sociability,
increased fear expression, robust reduction un sensorimotor gating) and bacterial
composition of gut microbiota (10 different significant OTUs mainly of the orders
Clostridiales and Bacteroidales) was presented in the immune challenged mice (POL) in
contrast to the control mice (SAL). Furthermore, for the F2 generation these responses
are increased, taking into account that there was a rise in the behavioral despair (similar
deficit in sociability than F1, increased fear expression, did not inherit the sensorimotor
gating deficit, by contrast with the F1 offspring that present an absence of behavioral
despair associated with depressive-like behaviors, the F2 offspring develop signs of
behavioral despair) and therefore, we obtained a greater number of significant OTUs
(17 OTUs also mostly from the orders Clostridiales and Bacteroidales ) that present a
different abundance in the gut microbiota of POL and SAL groups.

77
Figure 27. Phylogenetic tree of the significant OTUs transmitted from the first F1 to the F2 generation. (The numbers in each branch are the values of the Bootstrap and the length of the branches the phylogenetic distance) Firmicutes phylum: Green / Bacteroidetes phylum: Red / other phyla: black. The bacterial community Gracillibacter of significant OTUs (215 and 280 F1, 263 and 246 F2) is being transmitted from the F1 generation to the F2. The set of Barnesiella OTUs (42, 283, 69 and 400 F1 with 261 and 180 F2) are also present in the dysbiosis of both generations.
OTU 10 F2 POL
OTU 152 F2 POL
OTU 45 F2 SAL
Syntrophococcus
OTU 84 F2 SAL
Clostridium saccharolyticum
Clostridium xylanovorans
Lachnospiraceae
OTU 268 F2 POL
Roseburia
Blautia
Clostridium hylemonae
OTU 159 F2 SAL
Clostridium scindens
OTU 293 F2 SAL
OTU 76 F2 SAL
OTU 39 F2 SAL
OTU 284 F2 POL
Clostridium propionicum
OTU 311 F1 SAL
OTU 215 F1 SAL
OTU 263 F2 SAL
OTU 246 F2 SAL
OTU 280 F1 SAL
Gracilibacter
OTU 171 F2 POL
Lactobacillus
Clostridium gasigenes
Tissierella
Clostridiaceae
Alkalliphilus
OTU 388 F1 POL
Fusobacterium
OTU 252 F2 SAL
Peptostreptococcaceae
OTU 191 F2 SAL
Clostridium leptum
Ruminococcus
OTU 27 F2 POL
Acetanaerobacterium
Anaerotruncus
OTU 209 F2 POL
OTU 343 F2 SAL
OTU 248 F2 SAL
OTU 294 F2 POL
Rumen
OTU 44 F2 POL
Akkermansia
OTU 129 F2 SAL
OTU 324 F2 POL
OTU 153 F2 SAL
OTU 91 F2 SAL
OTU 301 F2 SAL
Oscillospiraceae
Clostrodium orbiscindens
OTU 63 F2 POL
OTU 183 F2 SAL
Bacteroides
Alistipes
OTU 20 F1 SAL
Paraprevotella
OTU 323 F1 POL
Parabacteroides
Barnesiella intestinihominis
Barnesiella Viscericola
OTU 42 F1 SAL
OTU 283 F1 POL
OTU 261 F2 POL
OTU 180 F2 SAL
OTU 69 F1 SAL
OTU 400 F1 SAL
100
100
8 3
100
100
100
8 1
2 9
3 7
3 7
9 5
9 2
100
8 5
100
5 4
6 1
100
100
9 9
100
100
9 8
9 9
4 9
3 5
9 7
5 9
9 0
8 9
9 0
3 9
3 4
9 9
9 2
7 3
100
9 0
9 8
3 8
4 6
3 6
9 1
9 9
4 5
5 5
3 6
3 6
4 4
6
1 2
4
8
9 2
6 3
6 8
6 4
9 84 8
4 7
1 7
3 06 7
4 12 1
2 1
1 2
7
0.02

78
6.3 Possible transmission of bacterial communities that are causing microbiota
dysbiosis between the F1 generation to the F2 generation divided by progenitor
lineages (POL-Maternal vs. POL-Paternal).
The third and last objective was to evaluate whether there is a progenitor linage
(maternal: POL-M or paternal: POL-P) that is preponderant in the transmission of
bacterial communities from the F1 to the F2 generation. The importance of this analysis
is that the F2 POL group was separated in two different categories depending on the
progenitor lineage by which the offspring was generated maternal (POL-M) or paternal
(POL-P). In the same way as in the previous results, this analysis used a 15,000
sequences/sample value for normalization. Additional analysis with other normalization
can be found in Annex2.
6.3.1 Taxonomy classification. For the taxonomy assignment the three groups
showed a very similar bacterial composition as shown in Figure 29. No significant
difference neither in the SAL groups or POL groups between generations was found
(Chi2). The most abundant bacterial community in each case was a genus of the order
of Clostridiales with ∼32% (SAL and POL-M) and it seemed to be a little less diversity in
the POL-P group with 26.0%, the second most abundant community was a genus of the
S24-7 family of phylum Bacteroidetes with a very similar percentage of abundance in
the groups with ∼20%, and the third most abundant bacterial community in each case
was a genus of the family of Lachnospiraceae which showed to have less abundance in
both POL groups 5.2% (POL-M) and 4.9% (POL-P) with respect 7.5% (SAL). The
Oscillospira genus with 6.5% (POL-M), 5.6% (POL-P) and 5.8% (SAL) was also present

79
as an abundant bacterial community, the same as a genus of the Rikenellaceae family
with 3.9% (POL-M) 3.6% (POL-P) and 3.6% (SAL).
Figure 28. Taxonomy assignment for the F2 generation (15,000 sequences/sample normalization value) in the three treatment groups (POL-P: poly(I:C) paternal lineage POL-M: poly(I:C) maternal lineage, SAL: control) Order of Clostridiales (1) with ∼32% (SAL and POL-M) and 26.0% (POL-P), the S24-7 family (2) with ∼20% in all groups, the family of Lachnospiraceae (3) with 5.2% (POL-M), 4.9% (POL-P) and 7.5% (SAL), the Oscillospira genus (4) with 6.5% (POL-M), 5.6% (POL-P) and 5.8% (SAL) and the Rikenellaceae family (5) with 3.9% (POL-M) 3.6% (POL-P) and 3.6% (SAL).
6.3.2 Significant OTU selection. A different quantity of significant OTUs was obtained
by analyzing the SAL group versus each one of the F2 POL groups, 16 for F2 POL-M
lineage and 23 for F2 POL-P lineage. The complete tables with all the significant OTUs
could be visualized in Annex3.
6.3.2.1 POL-P lineage. Most of the significant OTUs found between F2 POL-P and SAL
groups belong to the Firmicutes and Bacteroidetes phylum and others belong to the
Tenericutes and Verrucomicrobia phylum, as follows:
F2 POL-M F2 SAL
F1 F1
F2 POL-P
1
2 2 2
1 1
3 3 3
4 4
4
5 5 5

80
• Several genus of the order Clostridiales, the Mogibacteriaceae, Lachnospiraceae
and Ruminococcaceae families, and the Ruminococcus and Lactobacillus genus
from the Clostridiales order.
• Four S24-7 families from the Bacteroidales order.
• The order RF39 and the Anaeroplasmatales order from the Tenericutes phylum.
• The specie Muciniphila from the Verrucomicrobiales order.
Figure 29. Significant OTUs present between treatment groups (POL: poly(I:C) and SAL: control) in the F2 generation POL-P lineage. The first 14 OTUs A) Lachnospiraceae, B) S24-7, C) Mogibacteriaceae, D) S24-7, E) Lachnospiraceae, F) Clostridiales, G) RF39, H) Ruminococcaceae, I) S24-7, J) Ruminococcus, K) Clostridiales, L) Clostridiales, M) Clostridiales, and N) S24-7, are less abundant in the POL group, the last 9 OTUs O) Unassigned, P) Clostridiales, Q) Ruminococcaceae, R) Anaeroplasma, S) Clostridiales, T) Lactobacillus, U) Ruminococcaceae, V) Clostridiales and W) Muciniphila are more abundant in the POL group.
0
10
20OTU 248; Lachnospiraceae
0
50
100 OTU 145; S24�7
0
20
40OTU 237; Mogibacteriaceae
0
20
40 OTU 168; S24�7
0
50
100OTU 278; Lachnospiraceae
0
500
1000OTU 1; Clostridiales
0
20
40OTU 207; RF39
0
50
100OTU 129; Ruminococcaceae
0
100
200OTU 36; S24�7
0
50OTU 171; Ruminococcus
0
50OTU 71; Clostridiales
0
50
100OTU 118; Clostridiales
0
200
400OTU 34; Clostridiales
0
20
40OTU 282; S24�7
0
20
40OTU 302; Unassigned
0
20
40OTU 267; Clostridiales
0
20
40OTU 217; Ruminococcaceae
0
50OTU 127; Anaeroplasma
0
20
40OTU 247; Clostridiales
0
50
100OTU 201; Lactobacillus
SAL POL0
50
100OTU 49; Ruminococcaceae
SAL POL0
500OTU 9; Clostridiales
SAL POL0
50
100OTU 77; muciniphila
Sequences/sample
Rela
tive
Abun
danc
e%
POL SAL
A B C D
E F G H
I J K L
M N O P
Q R S T
U V W

81
The OTUs: 248 Lachnospiraceae (Fig 29-A)), 145 S24-7 (Fig 29-B), 168 S24-7 (Fig 29-
D), 237 Mogibacteriaceae (Fig 29-C), 278 Lachnospiraceae (Fig 29-E), 1 Clostridiales
(Fig 29-F), 207 RF39 (Fig 29-G), 129 Ruminococcaceae (Fig 29-H), 36 S24-7 (Fig 29-I),
171 Ruminococcus (Fig 29-J), 71 Clostridiales (Fig 29-K), 34 Clostridiales (Fig 28-L),
282 S24-7 (Fig 29-N) and 118 Clostridiales (Fig 29-O) showed less significant
abundance in the POL-P group with respect the SAL group. The OTUs: 127
Anaeroplasma (Fig 29-R), 247 Clostridiales (Fig 29-S), 201 Lactobacillus (Fig 29-T), 49
Ruminococcaceae (Fig 29-U), 9 Clostridiales (Fig 29-V), 77 Muciniphila (Fig 29-W), 302
Unassigned (Fig 29-O), 267 Clostridiales (Fig 29-P) and 217 Ruminococcaceae (Fig 29-
Q) showed more significant abundance in the POL-P group with respect the SAL group
(Fig 29 A-M).
6.3.2.2 POL-M lineage. Most of the significant OTUs found between maternal lineage F2
POL-M and SAL groups belong to the Firmicutes and Bacteroidetes phylum and other
belong to the Actinobacteria phylum:
• Several orders of Clostridiales, the Lachnospiraceae and Ruminococcaceae
families, and the Oscillospira genus from the Firmicutes phylum.
• S24-7 and Rikenellaceae families from the Bacteroidetes phylum.
• The Adlercreutzia genus from the Actinobacterias phylum.
The OTUs: 203 Rikenellaceae (Fig 31-A), 59 Oscillospira (Fig 31-B), 63 Clostridiales
(Fig 31-C), 118 Rikenellaceae (Fig 31-D), 84 Oscillospira (Fig 31-E), 25 Clostridiales
(Fig 31-F), 174 S24-7 (Fig 31-G), 82 Lachnospiraceae (Fig 31-H) and 168 Oscillospira

82
(Fig 31-I), showed less significant abundance in the F2 POL-M group with respect the F2
SAL.
Figure 30. Significant OTUs present between treatment groups (POL: poly(I:C) and SAL: control) in the F2 generation POL-M lineage. The first 9 OTUs: A) Rikenellaceae, B) Oscillospira, C) Clostridiales, D) Rikenellaceae, E) Oscillospira, F) Clostridiales, G) S24-7, H) Lachnospiraceae and I) Oscillospira less abundant in the POL group, the last 7 OTUs: J) Oscillospira, K) Ruminococcaceae, L) Ruminococcaceae, M) Adlercreutzia, N) Clostridiales, O) Clostridiales, P) Lachnospiraceae are more abundant in the POL group.
The OTUs: 95 Clostridiales (Fig 31-N), 29 Clostridiales (Fig 31-O), 116
Lachnospiraceae (Fig 31-P), 270 Oscillospira (Fig 31-J), 304 Ruminococcaceae (Fig
31-K), 311 Ruminococcaceae (Fig 31-L) and 238 Adlercreutzia (Fig 31-M) showed
0
5
10
15OTU 203; Rikenellaceae
0
50
100
150 OTU 59; Oscillospira
0
20
40 OTU 63; Clostridiales
0
50
100OTU 118; Rikenellaceae
0
50
100OTU 84; Oscillospira
0
100
200OTU 25; Clostridiales
0
50
100OTU 174; S24�7
0
50
100OTU 82; Lachnospiraceae
0
100
200
300OTU 186; Oscillospira
0
50
100OTU 270; Oscillospira
0
10
20
30OTU 304; Ruminococcaceae
0
20
40
60OTU 311; Ruminococcaceae
SAL POL0
10
20
30OTU 238; Adlercreutzia
SAL POL0
20
40
60OTU 95; Clostridiales
SAL POL0
50
100OTU 29; Clostridiales
SAL POL0
20
40
60OTU 116; Lachnospiraceae
Sequences/sample
Rela
tive
Abun
danc
e%
E F G H
I J K L
M N O P
A B C D

83
more significant abundance in the F2 POL-M group with respect the F2 SAL group (Fig
30 A-I).
6.3.4 Phylogenetic analysis. The Figure 31 shows a set of Barnesiella species OTUs:
42, 69 and 400 F1 generation, 36, 145, 168 and 282 F2 POL-P, and 174 F2 POL-M, from
the Bacteroidetes phylum, showed a direct transmission from the F1 to the F2 generation
(as already reported in the second objective) specially to the F2 generated by a POL-P.
When we separated by lineages it can be observed that the association of the
Barnesiella OTUs followed a direction in abundance (which couldn’t be found in the
second objective), all of them showed less abundance presence in the POL groups with
respect the SAL groups in both F1 and F2 generations. Include that 4 of the 5 F2 OTUs
were generated by a POL-P and only one by a POL-M.
Therefore we have evidence that document that the paternal lineage is preponderant in
the shaping of bacterial communities in the gut microbiota of poly(I:C) F2. Interestingly
linked with the results of the transgenerational effects of prenatal infection17, were their
data further suggested that the transgenerational effects in behavior of prenatal immune
activation occur also via the paternal lineage. The authors tempted to speculate that
prenatal immune activation may induce transgenerational effects via epigenetic
modifications in male gametes, which might also affect gut microbiota composition
indirectly.

84
Figure 31 . Phylogenetic tree of the significant OTUs transmitted from the first F1 to the F2 generation taking into account the paternal (POL-P) or maternal (POL-M) lineage. (The numbers in each branch are the values of the Bootstrap and the length of the branches the phylogenetic distance) Firmicutes phylum: Green / Bacteroidetes phylum: red OTUs Barnesiella are transmitted from to first to the F2 generation and show a less abundance presence in POL groups with respect the SAL in F1, and in the F2 most of them in POL-P and one of them in POL-M.
OTU 116 F2_ML POL
Roseburia
Clostrodium scindens
Syntrophococcus
Blautia
Clostrodium xylanovorans
Clostrodium saccharolyticum
Clostrodium sp
OTU 63 F2_ML SAL
OTU 71 F2_PL SAL
OTU 95 F2_ML POL
OTU 9 F2_PL POL
OTU 1 F2_PL POL
OTU 29 F2_ML SAL
OTU 34 F2_PL SAL
OTU 248 F2_PL SAL
OTU 82 F2_ML SAL
OTU 278 F2_PL SAL
OTU 267 F2_PL POL
OTU 25 F2_ML SAL
OTU 311 F1 SAL
OTU 129 F2_PL SAL
Clostridiales
Acetivibrio
OTU 304 F2_ML POL
OTU 59 F2_ML SAL
Oscillospira
OTU 186 F2 _ML SAL
OTU 270 F2_ML POL
OTU 84 F2_ML SAL
Clostridium orbiscindens
OTU 215 F1 SAL
OTU 247 F2_PL POL
OTU 280 F1 SAL
OTU 388 F1 POL
Fusobacterium
OTU 237 F2_PL SAL
Peptostreptococcaceae
Clostridiaceae
Tissierella
Gracilibacter
Ruminococcus albus
OTU 311 F2_ML POL
OTU 171 F2_PL SAL
Clostridium leptum
OTU 49 F2_PL POL
OTU 217 F2_PL POL
OTU 127 F2_PL POL
Acholeplasma
OTU 207 F2_PL SAL
Erysipelothrix
OTU 201 F2_PL POL
Lactobacillus
OTU 238 F2_ML POL
Adlercreutzia
OTU 77 F2_PL POL
Akkermansia
OTU 20 F1 SAL
Paraprevotella
OTU 203 F2_ML SAL
OTU 118 F2_ ML SAL
Alistipes
Bacteroides
OTU 323 F1 POL
Parabacteroides
Barnesiella intestinihominis
Barnesiella viscericola
OTU 283 F1 POL
OTU 36 F2_PL SAL
OTU 42 F1 SAL
OTU 174 F2_ML SAL
OTU 145 F2_PL SAL
OTU 69 F1 SAL
OTU 168 F2_PL SAL
OTU 400 F1 SAL
OTU 282 F2_PL SAL
9 9
7 3
4 2
9 9
7 2
9 8
9 9
9 9
9 9
7 6
6 1
7 5
5 7
9 5
9 4
9 9
9 9
7 2
3 9
4 2
9 9
9 9
9 7
9 4
9 8
9 7
9 4
8 5
7 1
9 9
6 6
9 3
9 1
3 7
3 7
4 4
4 7
2 0
5 6
4 6
4 3
1 6
3 9
4 8
3 9
3 9
2 3
9
3
1 5
1
1 1
3
4
9 9
9 29 9
4 7
5 9
3 7
2 3
2 5
3 0
1 0
7
1 1
7
1 7
8
1 7
9
0.02
21
90

85
7. Conclusions
We proposed that: If the gut microbiota is a relevant factor on the etiology of
schizophrenia, a microbial dysbiosis will be observed in the mouse model of prenatal
infection, which might work as a microbial vector that might be also horizontally
transmitted across generations. Therefore, we demonstrated the presence of a
microbial dysbiosis in the gut microbiota of the F1 and F2 offspring and its transmission
from one generation to the other.
For our first objective, we demonstrate that there were differences in the presence and
abundance of bacterial communities in the gut microbiota between the F1 generation
immune challenged offspring with poly(I:C) and the control offspring, with specific
bacterial communities of the orders Clostridiales and Bacteroidales. Differences in the
assignment of specific significant OTUs families or genus were found between platforms
(IM or IT), as well as the alpha diversity; however, both of them reported the irregularity
in the gut microbiota considered as a dysbiosis in the F1 generation.
For the second objective, our data of the F1 generation agree with the previously
reported by Hsiao35, where they also indicated that changes in the diversity of the gut
microbiota are specifically in Clostridia and Bacteroidia OTUs, they found as significant
the bacterial communities of the families: Lachnospiraceae, Ruminococcaceae,
Erysipelotrichaceae, Alcaligenaceae, Byphyromonadaceae, Prevotellaceae,
Rikenellaceae and un-classified Bacteroidales, suggesting that specific
Lachnospiraceae, along with other Bacteroidial species, may play a role in ASD
pathogenesis, while other taxa may be protective. We found as significant changes on

86
other bacterial communities: Mogibacteriaceae, Bacteroidales S24-7, Clostridiales,
Prevotella and Distasonis suggesting that Mogibacteriaceae and Distasonis may play a
role in ASD pathogenesis, while Prevotella and another Clostridiales may be protective
against the pathogenesis.
The F2 generation also showed differences in the gut microbiota of immune challenged
offspring with the orders Clostridiales and Bacteroidales as the primary drivers of the
dysbiosis. We found that some of the significant OTUs were transmitted from the F1 to
the F2 generation, more specifically some Gracillibacter species from order Clostridiales
that presented less abundance in the POL group of both generations and Barnesiella
species from the order Bacteroidales which don’t clearly show a relationship between
the transmission of these significant OTUs across generations and their abundance in
the POL group vs. SAL group.
However, for the third objective were we separated the POL offspring according to the
lineage for which they were generated, we demonstrated that the order Bacteroidales
showed a less abundance presence in the POL groups with respect the SAL groups
and were transmitted from the F1 to a F2 offspring mainly generated by a paternal
lineage.
All our results have a direct relationship with the ones already obtained
(transgenerational effects of prenatal infection17) in which our research is based. They
demonstrated that prenatal viral-like immune activation leads to a transmission of
behavioral phenotypes across generations, showing that reduced sociability and
increased cued fear expression were similarly present in the first and second-generation

87
offspring of immune-challenged ancestors, that sensorimotor gating impairments were
confined to the direct descendants of infected mothers, whereas increased behavioral
despair emerges as a novel phenotype in the second generation, and that the effects
were mediated via the paternal lineage, demonstrating transgenerational non-genetic
inheritance of pathological traits following in-utero immune activation. For the F1
generation, a behavior despaired in the POL group was presented with an impaired
sociability, increased fear expression and a robust reduction in sensorimotor gating.
Similarly, we found 10 different significant OTUs mainly of the orders Clostridiales and
Bacteroidales that differed in abundance and presence of in the POL group in contrast
to the SAL group. Furthermore, for the F2 generation the responses were increased
inasmuch as there was a rise in the behavioral despair, showing a similar deficit in
sociability than F1, an increased fear expression, and by contrast with the F1 offspring
that present an absence of behavioral despair associated with depressive-like
behaviors, the F2 offspring developed signs of behavioral despair, we obtained a greater
number of significant OTUs also from the orders Clostridiales and Bacteroidales, that
present a different abundance in the of POL and SAL groups creating the dysbiosis in
the gut microbiota of the immune challenged offspring.
In conclusion, we demonstrated that the gut microbiota is a relevant factor on the
etiology of schizophrenia and ASD, inasmuch as a microbial dysbiosis was observed in
the mouse model of prenatal infection, and was horizontally transmitted across
generations and that the paternal lineage is a preponderant linage for the transmission
of bacterial communities from the F1 to the F2 generation. Which positions the gut
microbiota as a possible vector of transgenerational transfer. However, it is important to

88
mention that our research had some limitations, first of all, we didn’t analyze the gut
microbiota composition of the ‘generation zero’ F0, given that we assumed that the gut
microbiota would be equal or equivalent to the control F1. However, our own data
indicated that the microbiota of the control groups varies between generations (F1 vs.
F2). Additionally, our experimental design remains at a phenomenological level without
any intervention to look for causality since it remains at a descriptive status. So that, for
further research a new experimental design should be raised that includes and takes
into account these limitations, specially to look for the causality of the already obtained
results.
Acknowledgements
I recognize that this work would not have been possible without the contribution of the
Consejo Nacional de Ciencia y Tecnología, México (CONACYT) with the fund of
mobility, and graduate scholarship to S. A. Velazquez Villegas (number CVU/ Fellow
640343/570674), research grant to G. Pacheco López (No. 255399), the support and all
the work carried out at the Universidad Autónoma Metropolitana (UAM) campus
Iztapalapa and campus Lerma, and the collaborations of the Laboratorio de referencia y
apoyo para la caracterización de genomas, transcriptomas y microbiomas, Centro de
Investigación y de Estudios Avanzados del IPN (Cinvestav) and the Norwegian
University of Life Sciences (NMBU).

89
Colaboraciones
Universidad Autónoma Metropolitana Unidad Lerma, Unidad Iztapalapa y Unidad Xochimilco UAM-LERMA UAM-Izt UAM-Xochimilco
• Dra. Kioko Guzmán: sacrificio de animales y extracción de microbiota intestinal de ciego.
• Ma. en C. Gabriela Bravo: extracción y amplificación de DNA de muestras para Ion Torrent.
• Dr. Félix Aguirre: apoyo en el análisis y procesamiento bioinformático de los datos
Centro de investigación y de estudios Avanzados Cinvestav-IPN
• Ma. en C. Otoniel Maya: apoyo en el análisis y procesamiento bioinformático de los datos provenientes de Ion Torrent.
• Biol. Alberto Piña: secuenciación Ion Torrent. • Dr. Selvasankar Murugesan: apoyo en la extracción de DNA, y
preparación de genotecas Ion Torrent.
Swiss Federal Institute of Technology ETH Zurich, Switzerland.
• Dra. Ulrike Weber: modelo de infección prenatal en ratones (poly(I:C)) y pruebas de comportamiento F1 y F2.
Norwegian University of Life Sciences NMBU Ås, Norway
• Dra. Ekhaternia Avershina: apoyo en el análisis y procesamiento bioinformático de los datos provenientes de Illumina Miseq.
• Ma. en C. Inga Leena Angell: extracción y amplificación de DNA, preparación de genotecas y secuenciación Illumina.

90
References
1 Didier Raoult (2013). TRUC or the Need for a New Microbial Classification; Unité de Recherche sur les Maladies Infectieuses et Tropicales Emergentes, Aix Marseille Université, Faculté de Médecine, Marseille, France
2 Ellen Jo Baron. (1996). Medical Microbiology. Galveston (TX): University of Texas Medical Branch at Galveston; 4th edition.
3 Stephen J. Salipante, . K. (2014). Performance Comparison of Illumina and Ion Torrent Next-Generation Sequencing Platforms for 16S rRNA-Based Bacterial Community Profiling. Appl Environ Microbiol , 80 (24), 7583–7591.
4 Cliff Meldrum, M. A. (2011). Next Generation Sequencing for Cancer Diagnostics: a Practical perspective. The Clinical Biochemist reviews , 32 (4), 177-195.
5 Cunningham C, C. S. (2007). The sickness behaviour and CNS inflammatory mediator profile induced by systemic challenge of mice with synthetic double-stranded RNA (poly I:C). Brain Behav Immun. 21, 490–502 .
6 Levy SE, G. E. (2010). Autism spectrum disorder and co-occurring developmental, psychiatric, and medical conditions among children in multiple populations of the United States. 31 (4), 267-275.
7 Lipina TV, Z. C. (2013). Maternal immune activation during gestation interacts with Disc1 point mutation to exac- erbate schizophrenia-related behaviors in mice. . J Neurosci , 33, 59. 7654– 7666 .
8 Collins, S. M. (2009). The relationship between intestinal microbiota and the central nervous system in normal gastrointestinal function and disease. . Gastroenterology , 136, 2033-2014.
9 Collins, S. M. (2009). The relationship between intestinal microbiota and the central nervous system in normal gastrointestinal function and disease. . Gastroenterology , 136, 2003-2014.
10 Cryan JF, D. T. (2012). Mind-altering microorganisms: the impact of the gut microbiota on brain and behaviour. . Neuron , 13, 701-712.
11 Christensen, D. L., Baio, J., Kim Van Naarden Braun, Deborah Bilder, Jane Charles, John N. Constantino, et al. (2016). Prevalence and Characteristics of Autism Spectrum Disorder Among Children Aged 8 Years —
12 Stackebrandt E, G. B. (1994). Taxonomic note: A place for DNA-DNA reassociation and 16S rRNA sequence analysis in the present species definition in bacteriology. Int J Syst Bacteriol , 44, 846-849.
13 Stephen M. Collins, M. S. The interplay between the intestinal microbiota and the brain . (M. Publishers, Ed.) NATURE REVIEWS MICROBIOLOGY , 10 (2012), 735-742.

91
14 Shimabukuro TT1, G. S. (2007). Medical expenditures for children with an autism spectrum disorder in a privately insured population. 38 (3), 546-552.
15 Wu EQ, B. H. (2005). The economic burden of schizophrenia in the United States in 2002. 66 (9), 1122-1129.
16 Woese CR, S. E. (1995). A phylogenetic definition of the major eubacterial taxa. Syst Appl Microbiol , 6, 143-151.
17 Ulrike Weber-Stadlbauer, J. R. (2016). Transgenerational Transmission and modification of pathological traits induced by prenatal immune activation.
18 Usadellab.org. (2014). Retrieved 04 05, 2016, from Trimmomatic: A flexible read trimming tool for Illumina NGS data: http://www.usadellab.org/cms/?page=trimmomatic
19 Thampi, S. M. (2013). Bioinformatics. LBS College of Engineering.
Thermo Fisher Scientific. (2015). Retrieved 01 13, 2016, from Ion Torrent PGM: https://www.thermofisher.com/no/en/home/brands/ion-torrent.html
20 Tillisch, K. L.-R. (2013). Consumption of fermented milk product with probiotic modulates brain activ- ity . Gastroenterology , 144, 1394-1401.
21 Timothy G. Dinan *, J. F. (2012). Regulation of the stress response by the gut microbiota: Implications for psychoneuroendocrinology . Elsevier , 2149, 1-10.
22 Torrey, E. F. (2013). Surviving Schizophrenia: a manual for families, patients and providers (5ta ed.). New York, USA: Harper Perennial.
23 Abazyan B, N. J. (2012). Prenatal interaction of mutant DISC1 and immune activation produces adult psychopathology. . Biol Psychiatry , 68, 1172-1181.
24 Abbott, J. M. (2007). 16S rRNA Gene Sequencing for Bacterial Identification in the Diagnostic Laboratory: Pluses, Perils, and Pitfalls. Journal of Clinical Microbiology , 45 (9), 2761–2764.
25 AdamsJB, J. (2011). Gastrointestinalfloraand gastrointestinal status in children with autism—comparisons to typical children and correlation with autism severity. . BMC Gastroenterol. , 11 (22), 1-13.
26 Akira S, T. T. (2012) Toll-like receptor signalling. Nat Rev Immunol , 4, 499-511.
27 Arsenault D, S.-A. I. (2014). The different effects of LPS and poly I:C prenatal immune challenges on the behavior, development and inflammatory responses in pregnant mice and their offspring. . Brain Behav Immun , 77-90.
28 Babraham, I. (2010). Babraham Bioinformatics. Retrieved 04 05, 2016, from FastQC: http://www.bioinformatics.babraham.ac.uk/projects/fastqc/
29 Bitesizebio. (2015, 05 13). Retrieved 04 12, 2016, from Sequencing-by-Synthesis: Explaining the Illumina Sequencing Technology:

92
http://bitesizebio.com/13546/sequencing-by-synthesis-explaining-the-illumina-sequencing-technology/
30 Boye, E. H. (1999). 16S rDNA sequencing to identify unknown microorganisms. Microbiol Res. , 154, 6-23.
31 Britannica, E. (2016). Taxonomy . Retrieved 05 22, 2016, from Encyclopedia Britannica: http://global.britannica.com/science/taxonomy/Making-a-classification#toc48702
32 Brown AS, D. E. (2010). Prenatal infection and schizophrenia: a review of epidemiologic and translational studies. . Am J Psychiatry , 167, 261-280.
33 Dethlefsen, L. M.-N. (2007). An ecological and evolutionary perspective on human-microbe mutualism and disease. . Nature , 449, 811-818.
34 Diaz Heijtz R, W. S. (2011). Normal gut microbiota modulates brain development and behavior. . Proc Natl Acad Sci USA , 108, 3047–3052 .
35 Elaine Y. Hsiao, S. W. (2013). Microbiota Modulate Behavioral and Physiological Abnormalities Associated with Neurodevelopmental Disorders . (E. Inc., Ed.) Cell , 11 (24), 1451-1463.
36 Edgar, R. C. (2010). Search and clustering orders of magnitude faster than BLAST. Bioinformatics Applications note , 26 (19), 2460-2461.
37 Edgar, R. C. (2013). UPARSE: highly accurate OTU sequences from microbial amplicon reads . Nature Methods , 10 (10), 996-999.
38 Falkow, M. J. (2009). What are the consequences of the disappearing human microbiota? (M. Publishers, Ed.) Nature Reviews Microbiology , 7, 887-894.
39 Hallmayer, J. C. (2011). Genetic heritability and shared environmental factors among twin pairs with autism. . phsychiatry , 68, 1095-1102.
40 Hooper LV, M. T. (2002). How host-microbial interactions shape the nutrient environment of the mammalian intestine. . Annu Rev Nutr. , 22, 283-307.
41 Ganter, H. (2013). Rarefaction. 8-16.
42 Gotelli, N. J., & Colwell, R. K. (2001). Quantifying biodiversity: procedures and pitfalls in the measurement and comparison of species richness. Ecology Letters , 4, 379-391.
43 J Gregory Caporaso, J. K. (2015). Quantitative Insights Into Microbial Ecology. (Copyright 2015--, QIIME development team.) Retrieved from QIIME: http://qiime.org
44 Justin Kuczynski, 1. J. (2011). Using QIIME to Analyze 16S rRNA Gene Sequences from Microbial Communities . Current Protocols in Bioinformatics , 10 (7), 1-20.
45 James M. Hill, S. B. (2014). The gastrointestinal tract microbiome and potential link to Alzheimer’s disease . Frontiers in Neurology , 5 (43).

93
46 Jill E. Clarridge, I. (2004). Impact of 16S rRNA Gene Sequence Analysis for Identification of Bacteria on Clinical Microbiology and Infectious Diseases. Clinical Microbiology Reviews , 17 (4).
47 Mawdsley, J. E. (2005). Psychological stress in IBD: new insights into pathogenic and therapeutic implications. . Gut , 54, 1481-1491.
48 MathWorks. (2016). Retrieved 05 16, 2016, from MATLAB: http://es.mathworks.com/products/matlab/features.html#key_features
49 Martha Douglas-Escobar, M., Elliott, E., & Josef Neu, M. (2013). Author Affiliations: Division of Neonatology, Department of Pediatrics, University of Florida, Gainesville. REVIEW ARTICLE Effect of Intestinal Microbial Ecology on the Developing Brain . JAMAPEDIATR , 167 (4), 374-379.
50 Marie A. Labouesse, W. L. (2015, Marzo 6). Long-term pathological consequences of prenatal infection: beyond brain disorders . (T. A. Society, Ed.) R1-R12.
51 Meyer U, F. J. (2009). In-vivo rodent models for the experimental investigation of prenatal immune activation effects in neurodevelopmental brain disorders. . Neurosci Biobehav Rev , 33, 1061-1079.
52 Meyer, U. (2014). Prenatal Poly(I:C) Exposure and Other Developmental Immune Activation Models in Rodent Systems . Society of Biological Psychiatry , 75, 307-315.
53 Miller BJ, C. N. (2013). Prenatal inflam- mation and neurodevelopment in schizophrenia: a review of human studies. . Prog Neuropsychopharmacol Biol Psychiatry , 42, 92-100.
54 Molecular Evolution. (2016). Retrieved 05 15, 2016, from ClustalX: http://www.molecularevolution.org/software/alignment/clustal
55 Molecular Evolutionary Genetics Analysis. (2016). Retrieved 05 15, 2016, from MEGA: http://www.megasoftware.net/features
56 Moreno, C. E. (2001). Métodos para medir la biodiversidad. In CYTED (Ed.). Zaragoza, España.
57 NeuJ, L. (2010). Theintestinalmicrobiome:relationship to type 1 diabetes. . Endocrinol Metab Clin North Am. , 39 (3), 563-571.
58 Neffs J-M, V. d. (1990). Compilation of small Ribosomal subunit RNA sequences. Nucls Acids Res , 18, 2237-2330.
59 NIH. (2015). National Institute of Mental Health. Retrieved Febrero 17, 2016, from Transforming the understanding and treatment of mental illnesses.: http://www.nimh.nih.gov/health/topics/schizophrenia/index.shtml
60 P., B. (2010). Effects of prenatal infection on brain development and behav- ior: a review of findings from animal models. . Brain Behav Immun , 24, 881-897.

94
61 Onore, C. C. (2012). The role of immune dysfunc- tion in the pathophysiology of autism. . Brain Behav. Immun. , 26, 383-392.
62 Robert C., E. (2011). UCHIME improves sensitivity and speed of chimera detection. Bioinformatics , 27 (16), 2194-2200.
63 Pacheco-López Gustavo, Giovanoli Sandra, Langhans Wolfgang, Meyer Urs. (2013). "Priming of metabolic dysfunctions by prenatal immune activation in mice: relevance to schizophrenia." Schizophrenia bulletin 39 (2): 319-29. doi:10.1093/schbul/sbr178
64 Richard J. Lamont and George Hajishengallis (2015) Polymicrobial synergy and dysbiosis in inflammatory disease, HHS Public Access, Trends Mol Med 21(3): 172-183.
65 Autism and Developmental Disabilities Monitoring Network, 11 Sites, United States, (2012.) 65 (3), 1-23.
66 Qiime scripts . (n.d.). Retrieved 04 14, 2016, from Qiime: http://qiime.org/scripts/assign_taxonomy.html
67 USEARCH manual. (n.d.). Retrieved 04 14, 2016, from Drive5: http://drive5.com/usearch/manual6/otu_clustering.html
68 Song Y, Liu C, Finegold SM. (2004) Real-time PCR quantitation of clostridia in feces of autistic children. Appl Environ Microbiol;70:6459–65.
69 Wang L, Christophersen CT, Sorich MJ, Gerber JP, Angley MT, Conlon MA, et al.(2013) Increased abundance of Sutterella spp. and Ruminococcus torques in feces of children with autism spectrum disorder. Mol Autism;4:42.
70 Ramon Rosselló-Mora, Rudolf Amann (2001) The species concept for prokaryotes. Microbiology Reviews; 39-67.