Experimental data on SOA formation from mixtures Of … · 2017-02-26 · SOA formation from...
15
Experimental data on SOA formation from mixtures of anthropogenic and biogenic organic compounds M. G. VIVANCO, M. SANTIAGO, M. SÁNCHEZ, M. A. CLAVERO Centro de Investigaciones Energéticas, Medioambientales y Tecnológicas (CIEMAT), Departamento de Medio Ambiente, Av. Complutense 22, 28040-Madrid, España Corresponding author: Marta G. Vivanco; e-mail: [email protected] E. BORRÁS, M. RÓDENAS, F. ALACREU, M. VÁZQUEZ, E. CLEMENTE, R. PORRAS, A. MUÑOZ Centro de Estudios Ambientales del Mediterráneo (CEAM), Fundación CEAM, Charles R. Darwin 14 (Parque Tecnológico), 46980-Paterna-Valencia, España A. STEIN Earth Resources & Technology (ERT) on assignment to NOAA’s Air Resources Laboratory (ARL), Silver Spring, MD, USA Received January 9, 2012; accepted July 26, 2012 RESUMEN Los aerosoles orgánicos secundarios (AOS) constituyen una fracción de las partículas atmosféricas. Este tipo de partículas se forman como consecuencia de la reacción de oxidación de ciertos gases orgánicos, lo que conduce a la formación de compuestos de baja volatilidad. Del mismo modo que para otros contaminantes atmosféricos, los modelos de calidad del aire permiten la simulación de partículas, una herramienta muy útil en tareas de gestión de la calidad del aire. Sin embargo, el uso adecuado de estos modelos debe basarse en la validación de su capacidad para reproducir las concentraciones observadas. Las estaciones de monito- reo de la calidad del aire registran información sobre una amplia variedad de contaminantes atmosféricos. Desafortunadamente, no se dispone habitualmente de medidas de AOS, ya que la instrumentación que se tiene en dichas redes de monitoreo no permite la diferenciación de las fuentes primarias y secundarias de los aerosoles orgánicos. Este documento presenta una serie de experimentos de fotooxidación realizados en las cámaras de simulación del Fotorreactor Europeo (CEAM, España) en diferentes condiciones experimentales con objeto de obtener datos sobre la formación de AOS. El uso de este tipo de cámaras permite aislar los procesos químicos y de formación de aerosoles, por lo que los datos presentados en este estudio tienen un considerable valor para propósitos de evaluación de modelos de formación de AOS, al igual que para el estudio del comportamiento de este tipo de partículas. ABSTRACT 6HFRQGDU\ RUJDQLF DHURVROV 62$ FRQVWLWXWH D VLJQL¿FDQW IUDFWLRQ RI WKH DWPRVSKHULF SDUWLFXODWH PDWWHU Theses particles are formed as a consequence of the oxidation reaction of certain organic gases that leads to the formation of low-volatility compounds. As for other pollutants, air quality models allow the simulation of particle levels and thus models constitute a powerful tool in air quality management. Nevertheless, the Atmósfera 26(1), 59-73 (2013)
Transcript of Experimental data on SOA formation from mixtures Of … · 2017-02-26 · SOA formation from...
Experimental data on SOA formation from mixtures of anthropogenic and biogenic organic compounds
M. G. VIVANCO, M. SANTIAGO, M. SÁNCHEZ, M. A. CLAVEROCentro de Investigaciones Energéticas, Medioambientales y Tecnológicas (CIEMAT), Departamento de
Medio Ambiente, Av. Complutense 22, 28040-Madrid, EspañaCorresponding author: Marta G. Vivanco; e-mail: [email protected]
E. BORRÁS, M. RÓDENAS, F. ALACREU, M. VÁZQUEZ, E. CLEMENTE, R. PORRAS, A. MUÑOZ
Centro de Estudios Ambientales del Mediterráneo (CEAM), Fundación CEAM, Charles R. Darwin 14 (Parque Tecnológico), 46980-Paterna-Valencia, España
A. STEINEarth Resources & Technology (ERT) on assignment to NOAA’s Air Resources Laboratory (ARL),
Silver Spring, MD, USA
Received January 9, 2012; accepted July 26, 2012
RESUMEN
Los aerosoles orgánicos secundarios (AOS) constituyen una fracción de las partículas atmosféricas. Este tipo de partículas se forman como consecuencia de la reacción de oxidación de ciertos gases orgánicos, lo que conduce a la formación de compuestos de baja volatilidad. Del mismo modo que para otros contaminantes atmosféricos, los modelos de calidad del aire permiten la simulación de partículas, una herramienta muy útil en tareas de gestión de la calidad del aire. Sin embargo, el uso adecuado de estos modelos debe basarse en la validación de su capacidad para reproducir las concentraciones observadas. Las estaciones de monito-reo de la calidad del aire registran información sobre una amplia variedad de contaminantes atmosféricos. Desafortunadamente, no se dispone habitualmente de medidas de AOS, ya que la instrumentación que se tiene en dichas redes de monitoreo no permite la diferenciación de las fuentes primarias y secundarias de los aerosoles orgánicos. Este documento presenta una serie de experimentos de fotooxidación realizados en las cámaras de simulación del Fotorreactor Europeo (CEAM, España) en diferentes condiciones experimentales con objeto de obtener datos sobre la formación de AOS. El uso de este tipo de cámaras permite aislar los procesos químicos y de formación de aerosoles, por lo que los datos presentados en este estudio tienen un considerable valor para propósitos de evaluación de modelos de formación de AOS, al igual que para el estudio del comportamiento de este tipo de partículas.
ABSTRACT
Theses particles are formed as a consequence of the oxidation reaction of certain organic gases that leads to the formation of low-volatility compounds. As for other pollutants, air quality models allow the simulation of particle levels and thus models constitute a powerful tool in air quality management. Nevertheless, the
Atmósfera 26(1), 59-73 (2013)
60 M. G. Vivanco et al.
accepted use of models must be based on the validation of its capacity to reproduce observed concentrations. Air monitoring sites provide measured information of a large variety of ambient pollutants. Unfortunately, measurements on SOA are not normally available, as current monitoring networks do not include instrumen-tation to distinguish primary from secondary sources of organic carbonaceous aerosol. This paper presents a set of photooxidation experiments performed in the European Photorreactor (EUPHORE) smog chamber (CEAM, Spain) under different experimental conditions to investigate SOA formation. The use of cham-bers allows the isolation of atmospheric chemistry and aerosol formation processes. Thus, although these measurements were obtained at initial precursor concentrations higher than those in atmospheric conditions, they constitute a valuable set of information for SOA model evaluation purposes.
Keywords: SOA formation, chamber experiments, organic gases, aerosols.
1. Introduction
of this, clean air legislation all around the world aims at avoiding high atmospheric particle levels by establishing air quality thresholds that should not be exceeded (EU, 1999; EU, 2008).
A wide range of inorganic and organic compounds can be present in particulate matter. Organic
for 20-90% of aerosol mass in the lower troposphere (Kanakidou et al., 2005). Both inorganic
plants emissions) or natural sources (such as volcanoes or dust storms). They can also be formed in the atmosphere as a consequence of chemical and physical processes (secondary particles). Organic particles formed in the atmosphere are commonly referred to as secondary organic aerosols (SOA).
Although there are very few studies focused on the effects of SOA on health, the fact that summer high particle levels are commonly associated with the production of SOA could indicate
summer periods, as suggested in Alfaro-Moreno et al. (2007).To simulate particle mass concentrations all the processes affecting atmospheric particle levels
must be considered, and thus SOA formation must be included in model codes. Knowledge of the
et al., 2009). The most studied and probably the most important mechanism of SOA formation is the oxidation of volatile organic compounds (VOCs), frequently produced through the reaction with OH radicals, forming products of lower volatility that subsequently partition into the condensed phase (Kroll and Seinfeld, 2008). Additional pathways consisting of the reaction of less-volatile organic gases may also lead to the production of SOA (Robinson et al., 2007).
Both biogenic and anthropogenic sources of VOCs contribute to SOA formation (Kanakidou et al., 2005). Until recently, the major biogenic SOA precursors were believed to be the terpenes, being et al., 1999; Kanakidou et al.
et al., 2004; Kleindienst et al., 2006). Whilst biogenic VOCs are the dominant contributors to global SOA formation, anthropogenic species, such as aromatic compounds (benzene, toluene, xylenes and trimethylbenzenes), can
et al., 2005).
61SOA formation from mixtures of anthropogenic and biogenic organic compounds
The oxidation processes of different VOCs have been studied in depth in chambers. These experiments offer a framework for the study of chemical reactions under controlled conditions,
formation take place. In most of the previous experiments, the formation of SOA was investigated by introducing one single VOC or binary mixtures. Lim and Ziemann (2005) analyzed the alkane oxidation with the OH radical in the presence of NOx. For some aromatic compounds, such as 1,3,5-trimethylbenzene (1,3,5-TMB), toluene, and xylenes, the SOA formation potential has also been investigated (Kalberer et al., 2004; Song et al., 2005; Weitkamp et al., 2007). Regarding biogenically-emitted VOCs, experiments based on -pinene and limonene have also been presented in a large number of publications (Kamens and Jaoui, 2001; Leungsakul et al., 2005; Yu et al., 2008). Some research has also been focused on the role of isoprene on SOA formation (Claeys et al., 2004; Kroll et al., 2006). Experiments performed by introducing diesel and gasoline in chambers have also been presented (Odum et al., 1997; Weitkamp et al., 2007). Nevertheless, investigating
A recent publication on the current and emerging issues related to SOA suggests that more complex mixtures than just one or two VOCs should be investigated in laboratories studies, in order to describe their effect on SOA formation (Hallquist et al., 2009). In Vivanco et al. (2011) we presented the results of ten photooxidation experiments performed in the European Photorreactor (EUPHORE) outdoor chamber (CEAM, Valencia, Spain) in order to study SOA formation under different VOCs initial conditions. Those experiments were performed by introducing a mixture of toluene (TOL), 1,3,5 trimethylbenzene (TMB), o-xylene (OXYL), octane (OCT) and mixtures of isoprene (ISO), limonene (LIM) and -pinene (APIN) into the EUPHORE photoreactor. In this paper the results of 23 new experiments performed in 2009, 2010 and 2011 again in the EUPHORE photoreactor are presented. Further relative humidity, oxidant and acidic conditions were explored. Also two experiments with an even more complex mixture were performed, by introducing all the mentioned anthropogenic and biogenic VOCs and benzene. With these new experiments the aim has been to facilitate the evaluation of air quality models, since normally no SOA information
the isolation of the chemistry and aerosol formation in chambers facilitates the evaluation of these
atmospheric processes are involved.
2. Experimental section2.1 Experimental conditions
light transmission is reached in the range of 280-640 nm (range at which photochemical atmospheric processes take place). The chamber volume is approximately 200 m3. Two mixing fans are used to
The EUPHORE facility has been described in detail elsewhere (Becker, 1996; Volkamer et al., 2001)A total of 23 experiments were performed in the EUPHORE smog chamber. They were
carried out in June, October and November 2009, June 2010 and June 2011. Eleven experiments were carried out using mixtures of anthropogenic VOCs (1,3,5 trimethylbenzene [TMB],
62 M. G. Vivanco et al.
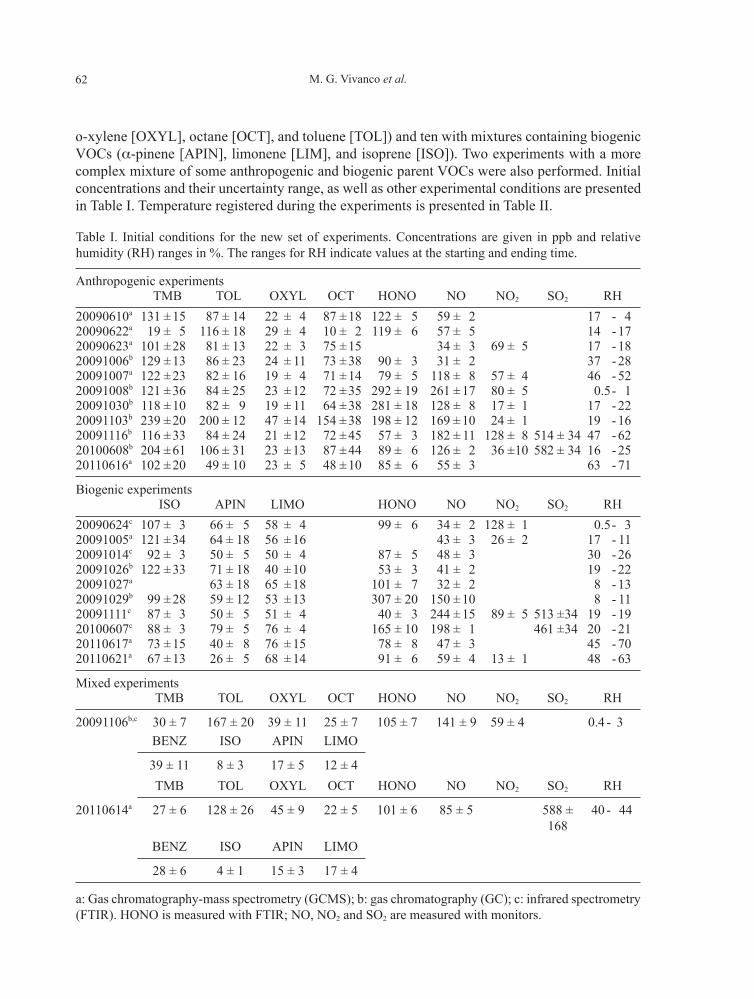
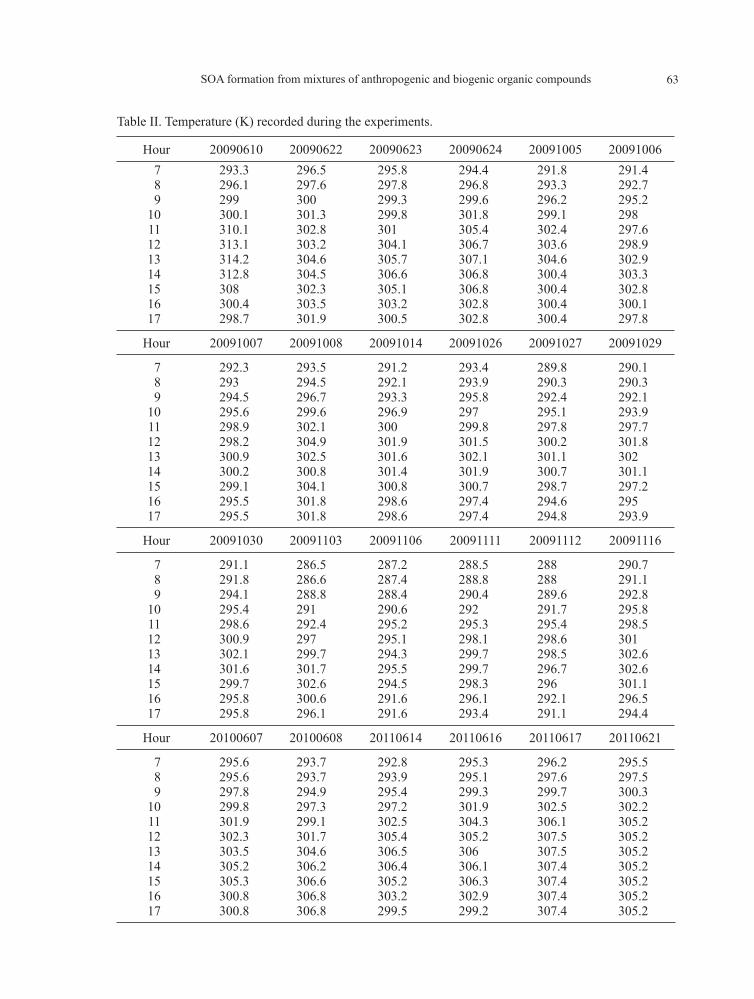
o-xylene [OXYL], octane [OCT], and toluene [TOL]) and ten with mixtures containing biogenic VOCs ( -pinene [APIN], limonene [LIM], and isoprene [ISO]). Two experiments with a more complex mixture of some anthropogenic and biogenic parent VOCs were also performed. Initial concentrations and their uncertainty range, as well as other experimental conditions are presented in Table I. Temperature registered during the experiments is presented in Table II.
Table I. Initial conditions for the new set of experiments. Concentrations are given in ppb and relative humidity (RH) ranges in %. The ranges for RH indicate values at the starting and ending time.
Anthropogenic experimentsTMB TOL OXYL OCT HONO NO NO2 SO2 RH
20090610a 131 ± 15 87 ± 14 22 ± 4 87 ± 18 122 ± 5 59 ± 2 17 - 420090622a 19 ± 5 116 ± 18 29 ± 4 10 ± 2 119 ± 6 57 ± 5 14 - 1720090623a 101 ± 28 81 ± 13 22 ± 3 75 ± 15 34 ± 3 69 ± 5 17 - 1820091006b 129 ± 13 86 ± 23 24 ± 11 73 ± 38 90 ± 3 31 ± 2 37 - 2820091007a 122 ± 23 82 ± 16 19 ± 4 71 ± 14 79 ± 5 118 ± 8 57 ± 4 46 - 5220091008b 121 ± 36 84 ± 25 23 ± 12 72 ± 35 292 ± 19 261 ± 17 80 ± 5 0.5 - 120091030b 118 ± 10 82 ± 9 19 ± 11 64 ± 38 281 ± 18 128 ± 8 17 ± 1 17 - 2220091103b 239 ± 20 200 ± 12 47 ± 14 154 ± 38 198 ± 12 169 ± 10 24 ± 1 19 - 1620091116b 116 ± 33 84 ± 24 21 ± 12 72 ± 45 57 ± 3 182 ± 11 128 ± 8 514 ± 34 47 - 6220100608b 204 ± 61 106 ± 31 23 ± 13 87 ± 44 89 ± 6 126 ± 2 36 ± 10 582 ± 34 16 - 2520110616a 102 ± 20 49 ± 10 23 ± 5 48 ± 10 85 ± 6 55 ± 3 63 - 71
Biogenic experimentsISO APIN LIMO HONO NO NO2 SO2 RH
20090624c 107 ± 3 66 ± 5 58 ± 4 99 ± 6 34 ± 2 128 ± 1 0.5 - 320091005a 121 ± 34 64 ± 18 56 ± 16 43 ± 3 26 ± 2 17 - 1120091014c 92 ± 3 50 ± 5 50 ± 4 87 ± 5 48 ± 3 30 - 2620091026b 122 ± 33 71 ± 18 40 ± 10 53 ± 3 41 ± 2 19 - 2220091027a 63 ± 18 65 ± 18 101 ± 7 32 ± 2 8 - 1320091029b 99 ± 28 59 ± 12 53 ± 13 307 ± 20 150 ± 10 8 - 1120091111c 87 ± 3 50 ± 5 51 ± 4 40 ± 3 244 ± 15 89 ± 5 513 ± 34 19 - 1920100607c 88 ± 3 79 ± 5 76 ± 4 165 ± 10 198 ± 1 461 ± 34 20 - 2120110617a 73 ± 15 40 ± 8 76 ± 15 78 ± 8 47 ± 3 45 - 7020110621a 67 ± 13 26 ± 5 68 ± 14 91 ± 6 59 ± 4 13 ± 1 48 - 63
Mixed experimentsTMB TOL OXYL OCT HONO NO NO2 SO2 RH
20091106b,c 30 ± 7 167 ± 20 39 ± 11 25 ± 7 105 ± 7 141 ± 9 59 ± 4 0.4 - 3BENZ ISO APIN LIMO
39 ± 11 8 ± 3 17 ± 5 12 ± 4TMB TOL OXYL OCT HONO NO NO2 SO2 RH
20110614a 27 ± 6 128 ± 26 45 ± 9 22 ± 5 101 ± 6 85 ± 5 588 ± 168
40 - 44
BENZ ISO APIN LIMO
28 ± 6 4 ± 1 15 ± 3 17 ± 4
a: Gas chromatography-mass spectrometry (GCMS); b: gas chromatography (GC); c: infrared spectrometry (FTIR). HONO is measured with FTIR; NO, NO2 and SO2 are measured with monitors.
63SOA formation from mixtures of anthropogenic and biogenic organic compounds
Table II. Temperature (K) recorded during the experiments.
Hour 20090610 20090622 20090623 20090624 20091005 200910067 293.3 296.5 295.8 294.4 291.8 291.48 296.1 297.6 297.8 296.8 293.3 292.79 299 300 299.3 299.6 296.2 295.2
10 300.1 301.3 299.8 301.8 299.1 29811 310.1 302.8 301 305.4 302.4 297.612 313.1 303.2 304.1 306.7 303.6 298.913 314.2 304.6 305.7 307.1 304.6 302.914 312.8 304.5 306.6 306.8 300.4 303.315 308 302.3 305.1 306.8 300.4 302.816 300.4 303.5 303.2 302.8 300.4 300.117 298.7 301.9 300.5 302.8 300.4 297.8
Hour 20091007 20091008 20091014 20091026 20091027 20091029
7 292.3 293.5 291.2 293.4 289.8 290.18 293 294.5 292.1 293.9 290.3 290.39 294.5 296.7 293.3 295.8 292.4 292.1
10 295.6 299.6 296.9 297 295.1 293.911 298.9 302.1 300 299.8 297.8 297.712 298.2 304.9 301.9 301.5 300.2 301.813 300.9 302.5 301.6 302.1 301.1 30214 300.2 300.8 301.4 301.9 300.7 301.115 299.1 304.1 300.8 300.7 298.7 297.216 295.5 301.8 298.6 297.4 294.6 29517 295.5 301.8 298.6 297.4 294.8 293.9
Hour 20091030 20091103 20091106 20091111 20091112 20091116
7 291.1 286.5 287.2 288.5 288 290.78 291.8 286.6 287.4 288.8 288 291.19 294.1 288.8 288.4 290.4 289.6 292.8
10 295.4 291 290.6 292 291.7 295.811 298.6 292.4 295.2 295.3 295.4 298.512 300.9 297 295.1 298.1 298.6 30113 302.1 299.7 294.3 299.7 298.5 302.614 301.6 301.7 295.5 299.7 296.7 302.615 299.7 302.6 294.5 298.3 296 301.116 295.8 300.6 291.6 296.1 292.1 296.517 295.8 296.1 291.6 293.4 291.1 294.4
Hour 20100607 20100608 20110614 20110616 20110617 20110621
7 295.6 293.7 292.8 295.3 296.2 295.58 295.6 293.7 293.9 295.1 297.6 297.59 297.8 294.9 295.4 299.3 299.7 300.3
10 299.8 297.3 297.2 301.9 302.5 302.211 301.9 299.1 302.5 304.3 306.1 305.212 302.3 301.7 305.4 305.2 307.5 305.213 303.5 304.6 306.5 306 307.5 305.214 305.2 306.2 306.4 306.1 307.4 305.215 305.3 306.6 305.2 306.3 307.4 305.216 300.8 306.8 303.2 302.9 307.4 305.217 300.8 306.8 299.5 299.2 307.4 305.2
64 M. G. Vivanco et al.
2.2 Analytical instrumentationA tapered element oscillating monitor (TEOM 1400a, Rupprecht & Patashnick) and a scanning mobility particle sizer (SMPS) with a particle counter (TSI 3022A CPC) and a differential mobility analyzer (TSI 3081 DMA), were used to study the aerosol particles formed during the experiments. These techniques were described in Vivanco et al. (2011).
For the monitoring of the gas phase, a gas chromatograph (GC), a gas chromatograph coupled to a mass spectrometer (GCMS) and an infrared spectrometer (FTIR) were used, together with several monitors.
Finally, considering that soluble sulphates and nitrates are the most relevant inorganic
chromatography (Vivanco et al., 2011). Ammonium (NH4+) content was also determined in these
experiments with a Dionex DX-500.
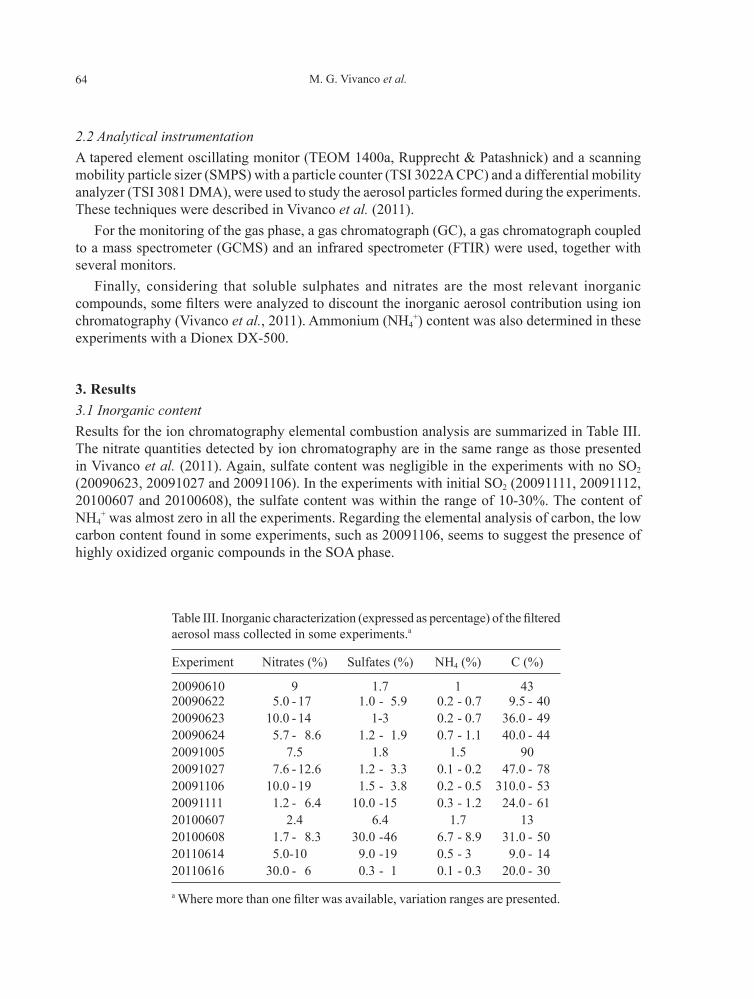
3. Results3.1 Inorganic contentResults for the ion chromatography elemental combustion analysis are summarized in Table III. The nitrate quantities detected by ion chromatography are in the same range as those presented in Vivanco et al. (2011). Again, sulfate content was negligible in the experiments with no SO2 (20090623, 20091027 and 20091106). In the experiments with initial SO2 (20091111, 20091112, 20100607 and 20100608), the sulfate content was within the range of 10-30%. The content of NH4
+ was almost zero in all the experiments. Regarding the elemental analysis of carbon, the low carbon content found in some experiments, such as 20091106, seems to suggest the presence of highly oxidized organic compounds in the SOA phase.
aerosol mass collected in some experiments.a
Experiment Nitrates (%) Sulfates (%) NH4 (%) C (%)
20090610 9 1.7 1 4320090622 5.0 - 17 1.0 - 5.9 0.2 - 0.7 9.5 - 4020090623 10.0 - 14 1-3 0.2 - 0.7 36.0 - 4920090624 5.7 - 8.6 1.2 - 1.9 0.7 - 1.1 40.0 - 4420091005 7.5 1.8 1.5 9020091027 7.6 - 12.6 1.2 - 3.3 0.1 - 0.2 47.0 - 7820091106 10.0 - 19 1.5 - 3.8 0.2 - 0.5 310.0 - 5320091111 1.2 - 6.4 10.0 - 15 0.3 - 1.2 24.0 - 6120100607 2.4 6.4 1.7 1320100608 1.7 - 8.3 30.0 - 46 6.7 - 8.9 31.0 - 5020110614 5.0 -10 9.0 - 19 0.5 - 3 9.0 - 1420110616 30.0 - 6 0.3 - 1 0.1 - 0.3 20.0 - 30
a
65SOA formation from mixtures of anthropogenic and biogenic organic compounds
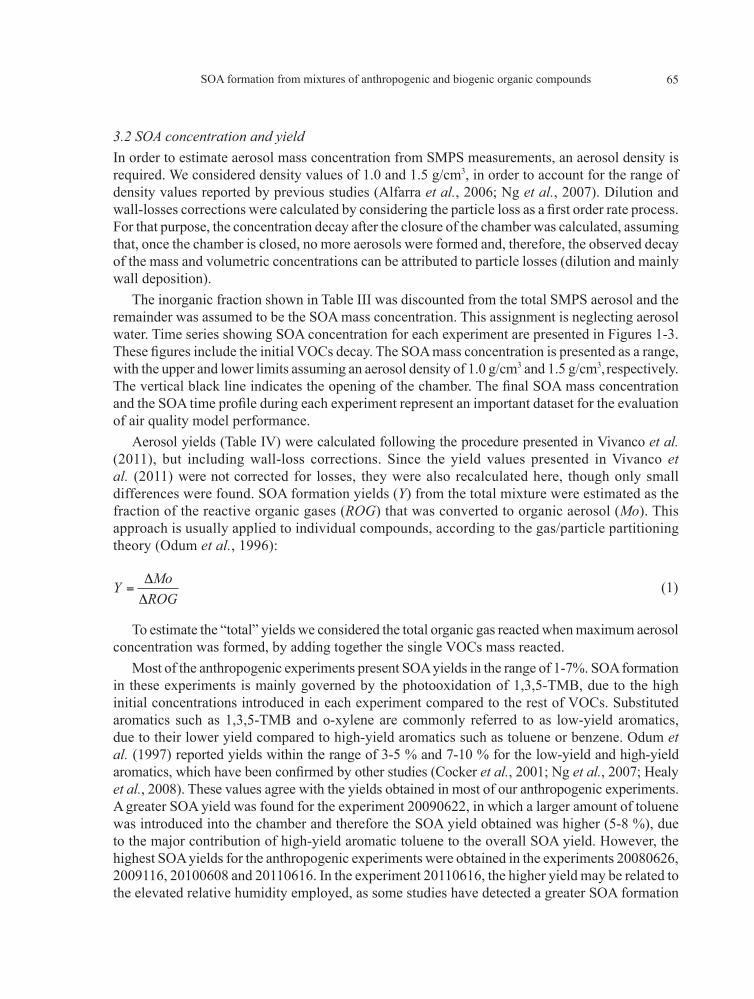
3.2 SOA concentration and yieldIn order to estimate aerosol mass concentration from SMPS measurements, an aerosol density is required. We considered density values of 1.0 and 1.5 g/cm3, in order to account for the range of density values reported by previous studies (Alfarra et al., 2006; Ng et al., 2007). Dilution and
For that purpose, the concentration decay after the closure of the chamber was calculated, assuming that, once the chamber is closed, no more aerosols were formed and, therefore, the observed decay of the mass and volumetric concentrations can be attributed to particle losses (dilution and mainly wall deposition).
The inorganic fraction shown in Table III was discounted from the total SMPS aerosol and the remainder was assumed to be the SOA mass concentration. This assignment is neglecting aerosol water. Time series showing SOA concentration for each experiment are presented in Figures 1-3.
with the upper and lower limits assuming an aerosol density of 1.0 g/cm3 and 1.5 g/cm3, respectively.
of air quality model performance.Aerosol yields (Table IV) were calculated following the procedure presented in Vivanco et al.
(2011), but including wall-loss corrections. Since the yield values presented in Vivanco et al. (2011) were not corrected for losses, they were also recalculated here, though only small differences were found. SOA formation yields (Y) from the total mixture were estimated as the fraction of the reactive organic gases (ROG) that was converted to organic aerosol (Mo). This approach is usually applied to individual compounds, according to the gas/particle partitioning theory (Odum et al., 1996):
MoYROG
= (1)
To estimate the “total” yields we considered the total organic gas reacted when maximum aerosol concentration was formed, by adding together the single VOCs mass reacted.
Most of the anthropogenic experiments present SOA yields in the range of 1-7%. SOA formation in these experiments is mainly governed by the photooxidation of 1,3,5-TMB, due to the high initial concentrations introduced in each experiment compared to the rest of VOCs. Substituted aromatics such as 1,3,5-TMB and o-xylene are commonly referred to as low-yield aromatics, due to their lower yield compared to high-yield aromatics such as toluene or benzene. Odum et al. (1997) reported yields within the range of 3-5 % and 7-10 % for the low-yield and high-yield
et al., 2001; Ng et al., 2007; Healy et al., 2008). These values agree with the yields obtained in most of our anthropogenic experiments. A greater SOA yield was found for the experiment 20090622, in which a larger amount of toluene was introduced into the chamber and therefore the SOA yield obtained was higher (5-8 %), due to the major contribution of high-yield aromatic toluene to the overall SOA yield. However, the highest SOA yields for the anthropogenic experiments were obtained in the experiments 20080626, 2009116, 20100608 and 20110616. In the experiment 20110616, the higher yield may be related to the elevated relative humidity employed, as some studies have detected a greater SOA formation
66 M. G. Vivanco et al.
0
100
200
300
40020090610 - SOA and PARENT VOCs
6:00 9:00 12:00 15:00 18:00
100
200
300
400
VO
Cs
conc
entra
tion
(ppb
)TOLOXYLOCTTMBSOA
0
100
200
300
40020090622 - SOA and PARENT VOCs
6:00 9:00 12:00 15:00 18:00
100
200
300
400
VOC
s co
ncen
tratio
n (p
pb)
TOLOXYLOCTTMBSOA
0
100
200
300
400 20090623 - SOA and PARENT VOCs
6:00 9:00 12:00 15:00 18:000
100
200
300
400TOLOXYLOCTTMB
SOA
0
100
200
300
400 20091006 - SOA and PARENT VOCs
6:00 9:00 12:00 15:00 18:00
100
200
300
400TOLOXYLOCTTMB
SOA
0
100
200
300
400 20091007 - SOA and PARENT VOCs
6:00 9:00 12:00 15:00 18:000
100
200
300
400
0
TOLOXYLOCTTMBSOA
TOLOXYLOCTTMBSOA
20091008 - SOA and PARENT VOCs
20091030 - SOA and PARENT VOCs 20091103 - SOA and PARENT VOCs
SO
A c
once
ntra
tion
(μg/
m3 )
VO
Cs
conc
entra
tion
(ppb
)
SO
A c
once
ntra
tion
(μg/
m3 )
VO
Cs
conc
entra
tion
(ppb
)
SO
A c
once
ntra
tion
(μg/
m3 )
0
100
200
300
400
6:00 9:00 12:00 15:00 18:000
100
200
300
400
0
VO
Cs
conc
entra
tion
(ppb
)
SO
A c
once
ntra
tion
(μg/
m3 )
0
100
200
300
400
6:00 9:00 12:00 15:00 18:000
100
200
300
400
0
TOLOXYLOCTTMBSOA
VO
Cs
conc
entra
tion
(ppb
)
SO
A c
once
ntra
tion
(μg/
m3 )
0
100
200
300
400
6:00 9:00 12:00 15:00 18:000
100
200
300
400
0
VO
Cs
conc
entra
tion
(ppb
)
SO
A c
once
ntra
tion
(μg/
m3 )
SO
A c
once
ntra
tion
(μg/
m3 )
SO
A c
once
ntra
tion
(μg/
m3 )
VO
Cs
conc
entra
tion
(ppb
)
0 0
0
Fig. 1. Time series with parent VOCs and SOA concentration. Range in light blue indicates aerosol concentration assuming 1.0 and 1.5 g/cm3 (X axis represents local time).
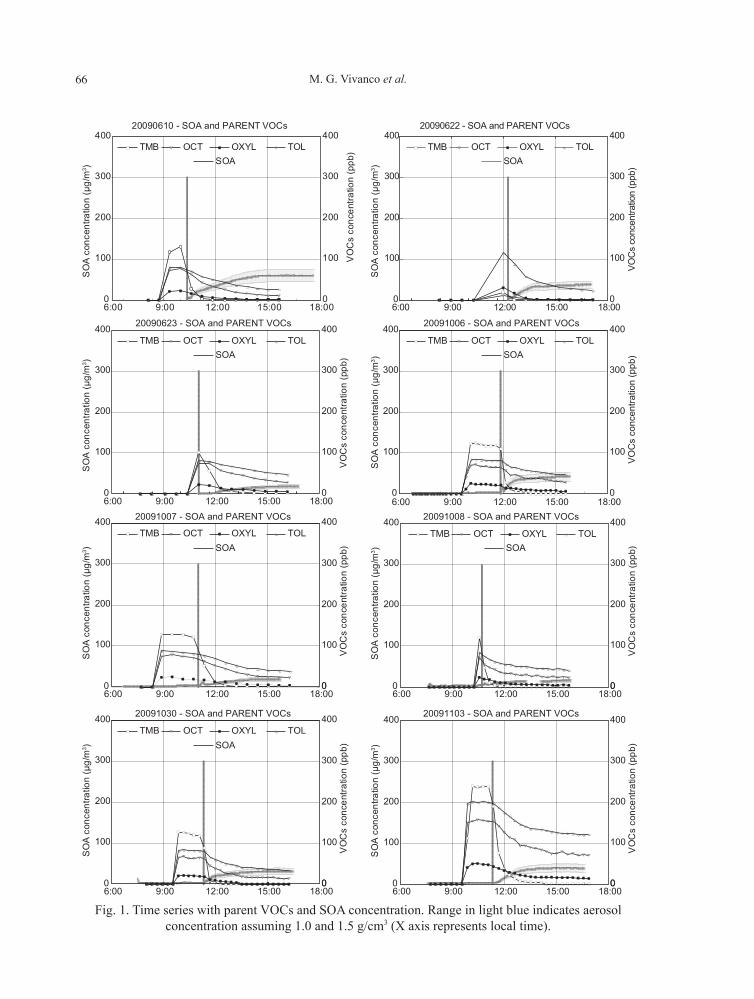
67SOA formation from mixtures of anthropogenic and biogenic organic compounds
20091116 - SOA and PARENT VOCs 20100608 - SOA and PARENT VOCs
20110616 - SOA and PARENT VOCs 20090624 - SOA and PARENT VOCs
20091005 - SOA and PARENT VOCs 20091014 - SOA and PARENT VOCs
20091026 - SOA and PARENT VOCs 20091027 - SOA and PARENT VOCs
0
100
200
300
400
6:00 9:00 12:00 15:00 18:00
100
200
300
400
VO
Cs
conc
entra
tion
(ppb
)TOLOXYLOCTSOA
0
100
200
300
400
6:00 9:00 12:00 15:00 18:00
100
200
300
400
VOC
s co
ncen
tratio
n (p
pb)
TOLOXYLOCTTMBTMB
TMB
ISO
ISO
SOA
SO
A c
once
ntra
tion
(μg/
m3 )
SO
A c
once
ntra
tion
(μg/
m3 )
0 0
0
100
200
300
400
6:00 9:00 12:00 15:00 18:00
100
200
300
400
VO
Cs
conc
entra
tion
(ppb
)TOLOXYLOCTSOA
0
100
200
300
400
6:00 9:00 12:00 15:00 18:00
100
200
300
400
VOC
s co
ncen
tratio
n (p
pb)
LIMAPINISOSOA
SO
A c
once
ntra
tion
(μg/
m3 )
SO
A c
once
ntra
tion
(μg/
m3 )
0 0
0
100
200
300
400
6:00 9:00 12:00 15:00 18:00
100
200
300
400
VO
Cs
conc
entra
tion
(ppb
)LIMAPINSOA
0
100
200
300
400
6:00 9:00 12:00 15:00 18:00
100
200
300
400
VOC
s co
ncen
tratio
n (p
pb)
LIMAPINISOSOA
SO
A c
once
ntra
tion
(μg/
m3 )
SO
A c
once
ntra
tion
(μg/
m3 )
0 0
0
100
200
300
400
6:00 9:00 12:00 15:00 18:00
100
200
300
400
VO
Cs
conc
entra
tion
(ppb
)LIMAPINSOA
0
100
200
300
400
6:00 9:00 12:00 15:00 18:00
100
200
300
400
VOC
s co
ncen
tratio
n (p
pb)
LIMAPINSOA
SO
A c
once
ntra
tion
(μg/
m3 )
SO
A c
once
ntra
tion
(μg/
m3 )
0 0
Fig. 2. Time series with parent VOCs and SOA concentration (X axis represents local time).
68 M. G. Vivanco et al.
20091029 - SOA and PARENT VOCs
LIMAPINISOSOA SOA
20091111 - SOA and PARENT VOCs
LIMAPINISO
20100607 - SOA and PARENT VOCs
LIMAPINISOSOA
20110617 - SOA and PARENT VOCs
LIMAPINISOSOA
20110621 - SOA and PARENT VOCs
LIMAPINISOSOA
20091106 - SOA and PARENT VOCs
OCTOXYLTOLTMB
SOABENZ ISOAPINLIM
20110614 - SOA and PARENT VOCs
OCTOXYLTOLTMB
SOABENZ ISOAPINLIM
0
100
200
300
400
6:00 9:00 12:00 15:00 18:00
100
200
300
400
VO
Cs
conc
entra
tion
(ppb
)
SO
A c
once
ntra
tion
(μg/
m3 )
0 0
100
200
300
400
6:00 9:00 12:00 15:00 18:00
100
200
300
400
VO
Cs
conc
entra
tion
(ppb
)
SO
A c
once
ntra
tion
(μg/
m3 )
0
0
100
200
300
400
6:00 9:00 12:00 15:00 18:00
100
200
300
400V
OC
s co
ncen
tratio
n (p
pb)
SO
A c
once
ntra
tion
(μg/
m3 )
0 0
100
200
300
400
6:00 9:00 12:00 15:00 18:00
100
200
300
400
VO
Cs
conc
entra
tion
(ppb
)
SO
A c
once
ntra
tion
(μg/
m3 )
0
0
100
200
300
400
6:00 9:00 12:00 15:00 18:00
100
200
300
400
VO
Cs
conc
entra
tion
(ppb
)
SO
A c
once
ntra
tion
(μg/
m3 )
0 0
100
200
300
400
6:00 9:00 12:00 15:00 18:00
100
200
300
400
VO
Cs
conc
entra
tion
(ppb
)
SO
A c
once
ntra
tion
(μg/
m3 )
0
0
100
200
300
400
6:00 9:00 12:00 15:00 18:00
100
200
300
400
VO
Cs
conc
entra
tion
(ppb
)
SO
A c
once
ntra
tion
(μg/
m3 )
0
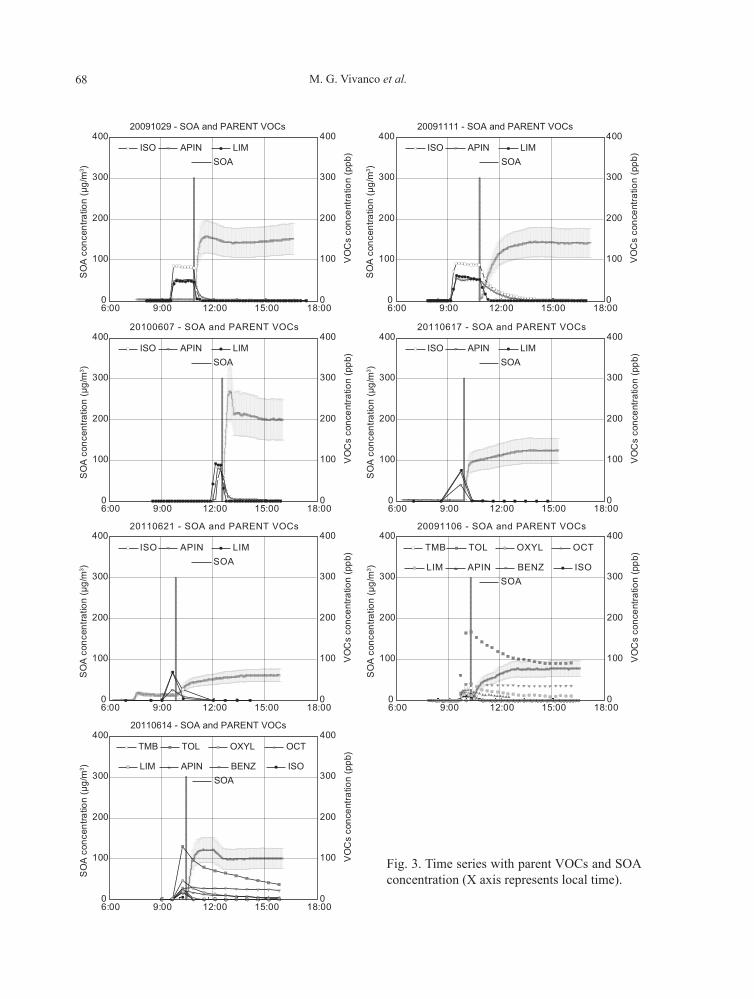
Fig. 3. Time series with parent VOCs and SOA concentration (X axis represents local time).
69SOA formation from mixtures of anthropogenic and biogenic organic compounds
from aromatic VOCs under high relative humidity conditions (Hu and Kamens, 2007). In the other three experiments, the higher values are related to the inclusion of SO2 in the chamber. During the last years, several authors have reported the existence of an important group of heterogeneous acid-catalyzed reactions, in which oxygenated compounds such as glyoxal, methylglyoxal or octanal formed through gas-phase oxidation of aromatic VOCs and alkanes, react in the presence of sulfuric acid particles to form low volatility products that increase the total SOA mass of the system (Jang and Kamens, 2001; Jang et al., 2002).
Regarding the biogenic experiments, higher yield values were obtained compared to the anthropogenic experiments (between 9 and 30%, considering all the experiments). Some authors have reported high monoterpenes SOA yields, with values up to 12 and 40% for -pinene and limonene, respectively (Odum et al., 1996; Hoffmann et al., 1997; Leungsakul et al., 2005), in agreement with our results. On the other hand, isoprene is a VOC with a relatively low SOA yield (1-5%) and thus its presence in the mixture reduces the overall yield, as it is quickly consumed without a high formation of SOA (Dommen et al., 2006; Kroll et al., 2006). Because of that reason, experiment 20091027 presents the highest SOA yield, as no isoprene was included in the mixture.
2 in SOA formation from isoprene
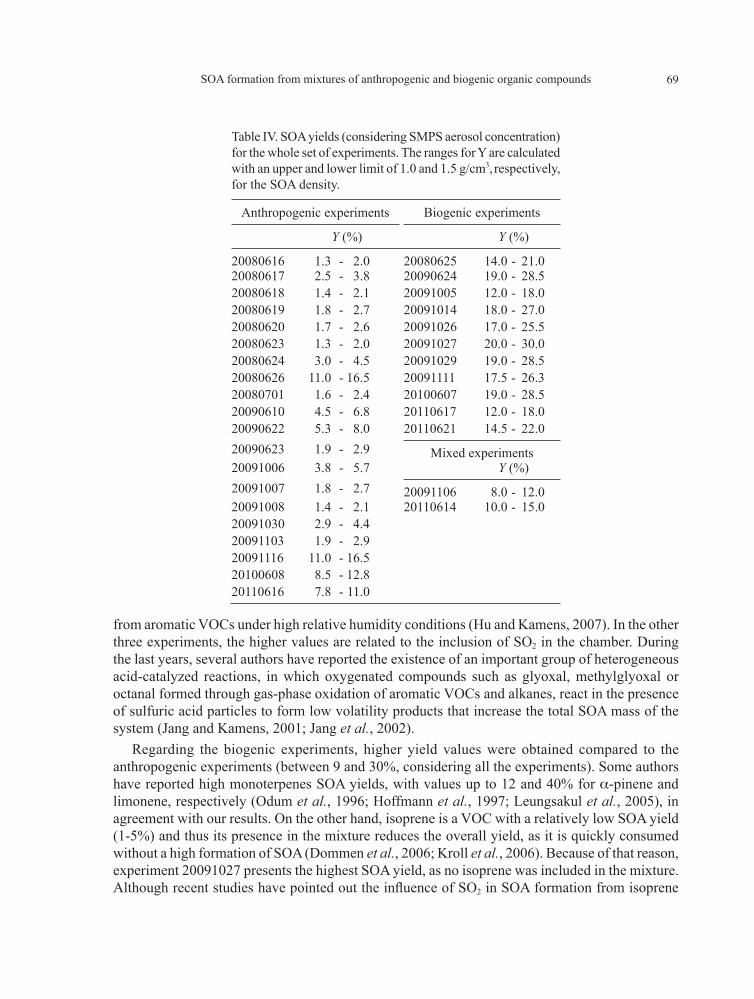
Table IV. SOA yields (considering SMPS aerosol concentration) for the whole set of experiments. The ranges for Y are calculated with an upper and lower limit of 1.0 and 1.5 g/cm3, respectively, for the SOA density.
Anthropogenic experiments Biogenic experiments
Y (%) Y (%)
20080616 1.3 - 2.0 20080625 14.0 - 21.020080617 2.5 - 3.8 20090624 19.0 - 28.520080618 1.4 - 2.1 20091005 12.0 - 18.020080619 1.8 - 2.7 20091014 18.0 - 27.020080620 1.7 - 2.6 20091026 17.0 - 25.520080623 1.3 - 2.0 20091027 20.0 - 30.020080624 3.0 - 4.5 20091029 19.0 - 28.520080626 11.0 - 16.5 20091111 17.5 - 26.320080701 1.6 - 2.4 20100607 19.0 - 28.520090610 4.5 - 6.8 20110617 12.0 - 18.020090622 5.3 - 8.0 20110621 14.5 - 22.020090623 1.9 - 2.9 Mixed experiments20091006 3.8 - 5.7 Y (%)20091007 1.8 - 2.7 20091106 8.0 - 12.020091008 1.4 - 2.1 20110614 10.0 - 15.020091030 2.9 - 4.420091103 1.9 - 2.920091116 11.0 - 16.520100608 8.5 - 12.820110616 7.8 - 11.0
70 M. G. Vivanco et al.
et al.increase in the experiments in which initial SO2 was introduced in the chamber (20091111 and 20100607), likely due to variations in other experimental conditions.
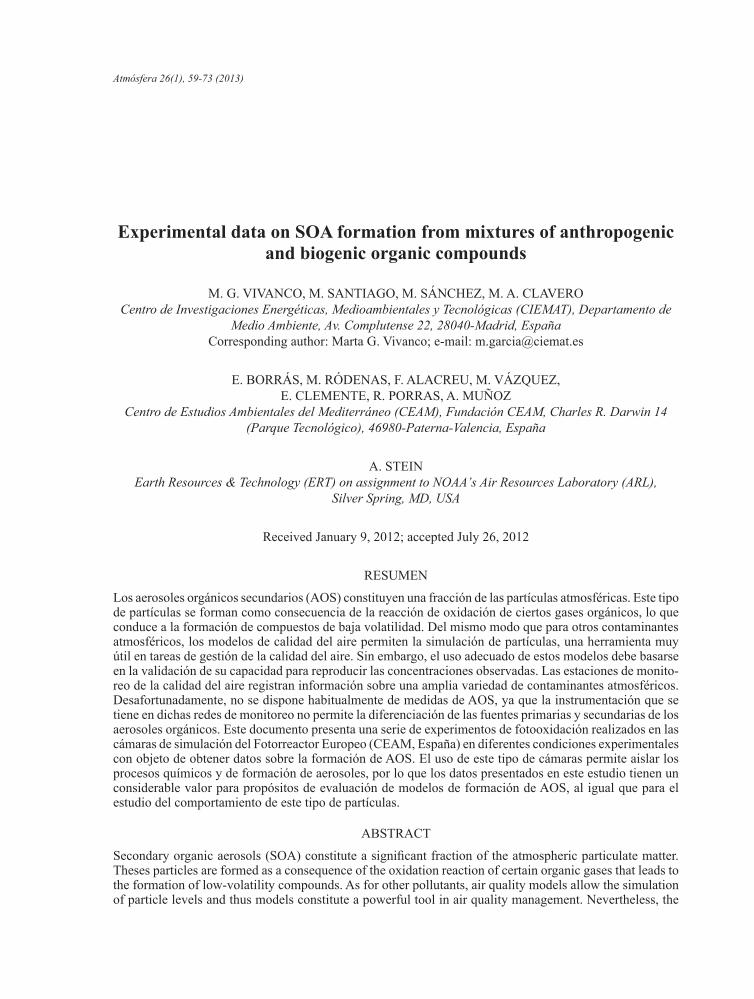
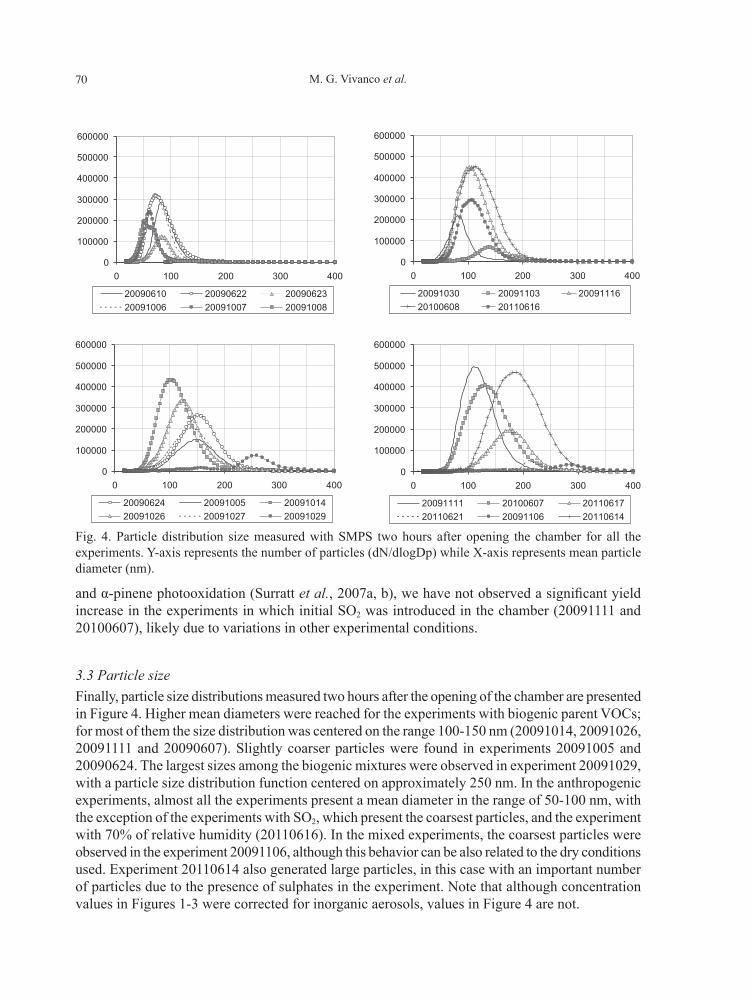
3.3 Particle sizeFinally, particle size distributions measured two hours after the opening of the chamber are presented in Figure 4. Higher mean diameters were reached for the experiments with biogenic parent VOCs; for most of them the size distribution was centered on the range 100-150 nm (20091014, 20091026, 20091111 and 20090607). Slightly coarser particles were found in experiments 20091005 and 20090624. The largest sizes among the biogenic mixtures were observed in experiment 20091029, with a particle size distribution function centered on approximately 250 nm. In the anthropogenic experiments, almost all the experiments present a mean diameter in the range of 50-100 nm, with the exception of the experiments with SO2, which present the coarsest particles, and the experiment with 70% of relative humidity (20110616). In the mixed experiments, the coarsest particles were observed in the experiment 20091106, although this behavior can be also related to the dry conditions used. Experiment 20110614 also generated large particles, in this case with an important number of particles due to the presence of sulphates in the experiment. Note that although concentration values in Figures 1-3 were corrected for inorganic aerosols, values in Figure 4 are not.
Fig. 4. Particle distribution size measured with SMPS two hours after opening the chamber for all the experiments. Y-axis represents the number of particles (dN/dlogDp) while X-axis represents mean particle diameter (nm).
0
100000
200000
300000
400000
500000
600000
0 100 200 300 400
20090610 20090622 2009062320091006 20091007 20091008
0
100000
200000
300000
400000
500000
600000
0 100 200 300 400
20091030 20091103 2009111620100608 20110616
0
100000
200000
300000
400000
500000
600000
0 100 200 300 400
20090624 20091005 2009101420091026 20091027 20091029
0
100000
200000
300000
400000
500000
600000
0 100 200 300 400
20091111 20100607 2011061720110621 20091106 20110614
71SOA formation from mixtures of anthropogenic and biogenic organic compounds
4. ConclusionsNew experiments performed in 2009, 2010 and 2011 in the EUPHORE chamber supplement the experimental data presented in Vivanco et al. (2011). In general, SOA yields and particle sizes were higher in the experiments with biogenic VOCs, compared to the experiments with anthropogenic VOCs. The presence of SO2 increased SOA yields, providing additional evidence of the SOA formation enhancement in acidic conditions previously mentioned in Vivanco et al. (2011) for the anthropogenic mixtures. This behavior was not so clearly observed for the biogenic experiments. Also coarser particles were observed in the presence of initial SO2.
This set of data provides a relevant support for model performance evaluation activities, as measurements of explicit SOA concentration are not generally available (and model community must currently apply certain approaches to evaluate model results). With these experiments the direct comparison between models and observation is feasible. Even the evaluation of
due to transport and mixing are involved inside the chamber. When dealing with air quality measurements, the evaluation of these modules cannot be done directly, as other atmospheric processes affect SOA concentrations.
Acknowledgments)
and the Ministerio del Medio Ambiente of Spain.
ReferencesAlfaro-Moreno E., T. S. Nawrot, A. Nemmar and B. Nemery, 2007. Particulate matter in the
environment: pulmonary and cardiovascular effects. Curr. Opin. Pulm. Med. 13, 98-106.Alfarra M. R., D. Paulsen, M. Gysel, A. A. Garforth, J. Dommen, A. S. H. Prevot, D. R. Worsnop,
U. Baltensperger and H. Coe, 2006. A mass spectrometric study of secondary organic aerosols formed from the photooxidation of anthropogenic and biogenic precursors in a reaction chamber. Atmos. Chem. Phys. 6, 5279–5293.
Becker K. H., 1996. The European photoreactor EUPHORE. Final report of the EC-Project, contract No EV5V-CT92-0059.
Claeys M., B. Graham, G. Vas, W. Wang, R. Vermeylen, V. Pashynska, J. Cafmeyer, P. Guyon, M. O. Andreae, P. Artaxo and W. Maenhaut, 2004. Formation of secondary organic aerosols through photooxidation of isoprene. Science 303, 1173-1176.
Cocker D. R., B. T. Mader, M. Kalberer, R. C. Flagan and J. H. Seinfeld, 2001. The effect of water on gas–particle partitioning of secondary organic aerosol: II. M-xylene and 1,3,5-trimethylbenzene photooxidation systems. Atmos. Environ. 35, 6073–6085.
Dommen J., A. Metzger, J. Duplissy, M. Kalberer, M. R. Alfarra, A. Gascho, E. Weingartner, A. S. H. Prevot, B. Verheggen and U. Baltensperger, 2006. Laboratory observation of oligomers in the aerosol from isoprene/NOx photooxidation. J. Geophys. Res. 33, L13805.
EU, 1999. Council directive 1999/30/EC of 22 April 1999 relating to limit values for sulphur dioxide, nitrogen dioxide and oxides of nitrogen, particulate matter and lead in ambient air.
.
72 M. G. Vivanco et al.
EU, 2008. Directive 2008/50/EC of the European Parliament and of the Council of 21 May 2008 on ambient air quality and cleaner air for Europe. .
the oxidation of biogenic hydrocarbons. J. Geophys. Res. 104, 3555-3567.Hallquist M., J. C. Wenger, U. Baltensperger, Y. Rudich, D. Simpson, M. Claeys, J. Dommen,
N. M. Donahue, C. George, A. H. Goldstein, J. F. Hamilton, H. Herrmann, T. Hoffmann, Y. Iinuma, M. Jang, M. E. Jenkin, J. L. Jimenez, A. Kiendler-Scharr, W. Maenhaut, G. McFiggans, T. F. Mentel, A. Monod, A. S. H. Prevot, J. H. Seinfeld, J. D. Surratt, R. Szmigielski and J. Wildt, 2009. The formation, properties and impact of secondary organic aerosol: Current and emerging issues. Atmos. Chem. Phys. 9, 5155–5236.
Healy R. M., J. C. Wenger, A. Metzger, J. Duplissy, M. Kalberer and J. Dommen, 2008. Gas/particle partitioning of carbonyls in the photooxidation of isoprene and 1,3,5-trimethylbenzene. Atmos. Chem. Phys. 8, 3215-3220.
Hoffmann T., J. R. Odum, F. Bowman, D. Collins, D. Klockow, R. C. Flagan and J. H. Seinfeld, 1997. Formation of organic aerosols from the oxidation of biogenic hydrocarbons. J. Atmos. Chem. 26, 189-222.
Hu D. and R. M. Kamens, 2007. Evaluation of the UNC toluene-SOA mechanism with respect to other chamber studies and key model parameters. Atmos. Environ. 41, 6465-6477.
Jang M. and R. M. Kamens, 2001. Atmospheric secondary aerosol formation by heterogeneous reactions of aldehydes in the presence of a sulfuric acid aerosol catalyst. Environ. Sci. Technol. 35, 4758-4766.
Jang M., N. M. Czoschke, S. Lee and R. M. Kamens, 2002. Heterogeneous atmospheric aerosol production by acid-catalyzed particle-phase reactions. Science 298, 814-817.
Kalberer M., D. Paulsen, M. Sax, M. Steinbacher, J. Dommen, A. S. H. Prevot, R. Fisseha, E.
as major components of atmospheric organic aerosols. Science 303, 1659-1662.Kamens R. M. and M. Jaoui, 2001. Modeling aerosol formation from alpha-pinene + NOx in
the presence of natural sunlight using gas-phase kinetics and gas-particle partitioning theory. Environ. Sci. Technol. 35, 1394-1405.
Kanakidou M., J. H. Seinfeld, S. N. Pandis, I. Barnes, F. J. Dentener, M. C. Facchini, R. V. Dingenen, B. Ervens, A. Nenes and C. J. Nielsen, 2005. Organic aerosol and global climate modeling: A review. Atmos. Chem. Phys. 5, 1053-1123.
Kleindienst T. E., E. O. Edney, M. Lewandowski, J. H. Offenberg and M. Jaoui, 2006. Secondary organic carbon and aerosol yields from the irradiations of isoprene and alpha-pinene in the presence of NOx and SO2. Environ. Sci. Tecnol. 40, 3807-3812.
Kroll J. H., N. L. Ng, S. M. Murphy, R. C. Flagan and J. H. Seinfeld, 2006. Secondary organic aerosol formation from isoprene photooxidation. Environ. Sci. Tecnol. 40, 1869-1877.
Kroll J. H. and J. H. Seinfeld, 2008. Chemistry of secondary organic aerosol: Formation and evolution of low-volatility organics in the atmosphere. Atmos. Environ. 42, 3593-3624.
Leungsakul S., H. E. Jeffries and R. M. Kamens, 2005. A kinetic mechanism for predicting secondary aerosol formation from the reactions of d-limonene in the presence of oxides of nitrogen and natural sunlight. Atmos. Environ. 39, 7063-7082.
Lim Y. B. and P. J. Ziemann, 2005. Products and mechanism of secondary organic aerosol formation from reactions of n-alkanes with OH radicals in the presence of NOx. Environ. Sci. Tecnol. 39, 9229-9236.
73SOA formation from mixtures of anthropogenic and biogenic organic compounds
Ng N. L., J. H. Kroll, A. W. H. Chan, P. S. Chhabra, R. C. Flagan and J. H. Seinfeld, 2007. Secondary organic aerosol formation from m-xylene, toluene, and benzene. Atmos. Chem. Phys. 7, 3909-3922.
Odum J. R., T. Hoffmann, F. Bowman, D. Collins, R. C. Flagan and J. H. Seinfeld, 1996. Gas/particle partitioning and secondary organic aerosol yields. Environ. Sci. Tecnol. 30, 2580-2585.
1997. Aromatics, reformulated gasoline, and atmospheric organic aerosol formation. Environ. Sci. Tecnol. 31, 1890-1897.
Robinson A. L., N. M. Donahue, M. K. Shrivastava, E. A. Weitkamp, A. M. Sage, A. P. Grieshop, T. E. Lane, J. R. Pierce and S. N. Pandis, 2007. Rethinking organic aerosols: Semivolatile emissions and photochemical aging. Science 315, 1259-1262.
Song C., K. Na and D. R. Cocker, 2005. Impact of the hydrocarbon to NOx ratio on secondary organic aerosol formation. Environ. Sci. Tecnol. 39, 3143-3149.
Surratt J. D., J. H. Kroll, T. E. Kleindienst, E. O. Edney, M. Claeys, A. Sorooshian, N. L. Ng, J. H. Offenberg, M. Lewandowski, M. Jaoui, R. C. Flagan and J. H. Seinfeld, 2007a. Evidence for organosulfates in secondary organic aerosol. Environ. Sci. Tecnol. 41, 517-527.
Surratt J. D., M. Lewandowski, J. H. Offenberg, M. Jaoui, T. E. Kleindienst, E. O. Edney and J. H. Seinfeld, 2007b. Effect of acidity on secondary organic aerosol formation from isoprene. Environ. Sci. Tecnol. 41, 5363-5369.
Vivanco M. G., M. Santiago, A. Martínez-Tarifa, E. Borrás, M. Ródenas, C. García-Diego and M. Sánchez, 2011. SOA formation in a photoreactor from a mixture of organic gases and HONO for different experimental conditions. Atmos. Environ. 45, 708-715.
Volkamer R., U. Platt and K. Wirtz, 2001. Primary and secondary glyoxal formation from aromatics: Experimental evidence for the bicycloalkyl-radical pathway from benzene, toluene, and p-xylene. J. Phys. Chem. A 105, 7865-7874.
Weitkamp E. A., A. M. Sage, J. R. Pierce, N. M. Donahue and A. L. Robinson, 2007. Organic aerosol formation from photochemical oxidation of diesel exhaust in a smog chamber. Environ. Sci. Tecnol. 41, 6969-6975.
Yu Y., M. J. Ezell, A. Zelenyuk, D. Imre, L. Alexander, J. Ortega, B. D’Anna, C. W. Harmon, S. N. Johnson and B. J. Finlayson-Pitts, 2008. Photooxidation of alpha-pinene at high relative humidity in the presence of increasing concentrations of NOx. Atmos. Environ. 42, 5044-5060.