Facultad de Ciencias · 2020. 5. 18. · Facultad de Ciencias ESTUDIO DE LA INFLUENCIA DE LA...
187
Facultad de Ciencias ESTUDIO DE LA INFLUENCIA DE LA OSTEOPONTINA EN EL DESARROLLO DE LA OBESIDAD Y SUS COMORBILIDADES Andoni Lancha Urtasun 2014
Transcript of Facultad de Ciencias · 2020. 5. 18. · Facultad de Ciencias ESTUDIO DE LA INFLUENCIA DE LA...

Facultad de Ciencias
ESTUDIO DE LA INFLUENCIA DE LA OSTEOPONTINA EN EL
DESARROLLO DE LA OBESIDAD Y SUS COMORBILIDADES
Andoni Lancha Urtasun
2014

Facultad de Ciencias
ESTUDIO DE LA INFLUENCIA DE LA OSTEOPONTINA EN EL DESARROLLO DE LA OBESIDAD Y SUS COMORBILIDADES
Memoria presentada por Don Andoni Lancha Urtasun
para aspirar al grado de Doctor en Ciencias Biológicas por
la Universidad de Navarra
El presente trabajo ha sido realizado bajo la dirección del Dr. Javier
Gómez Ambrosi y la Dra. Gema Frühbeck Martínez en el Laboratorio de
Investigación Metabólica de la Universidad de Navarra, y autorizo su
presentación ante el Tribunal que lo ha de juzgar.
Pamplona, Junio de 2014
Dr. Javier Gómez Ambrosi Dra. Gema Frühbeck Martínez


A mis padres y mi hermana

AGRADECIMIENTOS
El trabajo presentado en esta memoria ha sido posible gracias a la
concesión de la beca de ayuda a la formación de personal investigador de la
Asociación de Amigos de la Universidad de Navarra y a un contrato como
personal investigador del CIBER Fisiopatología de la Obesidad y Nutrición
(CIBERobn). El proyecto ha sido financiado por el Fondo de Investigación
Sanitaria (FIS) y el CIBERobn, del Instituto de Salud Carlos III y los
Departamentos de Salud y Educación del Gobierno de Navarra.
A la Universidad de Navarra y a la Clínica Universidad de Navarra por
darme la oportunidad de realizar esta Tesis Doctoral y facilitarme sus
instalaciones.
A mis dos directores de tesis:
Al Dr. Gómez Ambrosi por su gran asesoramiento y dedicación para que
esta tesis se haya podido llevar a cabo.
A la Dra. Frühbeck por la confianza depositada en mí, por sus amplios
conocimientos, por su trabajo y por compartir conmigo su amor por la ciencia.
A mis compañeros de laboratorio:
A Amaia por su simpatía, por estar siempre dispuesta a ayudar y por sus
innumerables consejos.
A Victoria por estar siempre con una sonrisa en la cara y por su ayuda,
especialmente en todo lo relacionado con el Real Time.

A Bea por tus “consejillos” y las pequeñas ayudas en el día a día, las
cuales nos facilitan el trabajo.
A Sara por tu compañía y tus consejos durante todo este tiempo.
A Leire por dar un toque alegre al laboratorio y estar siempre dispuesta a
echar una mano.
A Javier por tu simpatía y por proporcionar un apoyo masculino en el
laboratorio, aunque he de decir que mis compañeras del laboratorio siempre
me han tratado muy bien.
A los que ya no están en el laboratorio: en especial a Neira por
ayudarme tanto en unos inicios con muchas trabas, por todos tus consejos y
por tu amistad y a Edurne que siempre ayudaba en todo lo que podía.
A todo el personal del animalario por facilitarnos el trabajo con los
animales y en especial a Igor con el que compartí “zulo” mientras escribía los
artículos y la tesis, por sus ánimos y su gran simpatía.
A Rubén y a Eneko por su compañía, por su amistad, por levantarme el
ánimo en los momentos malos y por compartir conmigo sus experiencias
durante la tesis.
A todos mis amigos de la cuadrilla de San Juan por su apoyo y por todos
los momentos compartidos y en especial a Alberto con el que he compartido
casi todas mis inquietudes y al que me une una gran amistad.
A Gema Reula por estar siempre ahí, tanto en los momentos buenos
como en los malos.

A toda mi familia por mostrarme su apoyo e interesarse tanto por mí, y
en especial, a mis padres y mi hermana que tanto me han ayudado y apoyado
durante todos estos años.


ABREVIATURAS
ACC
AG
AGT
AKT-1
AMPK
ANGPLT4
ANG-II
ATGL
BAT
CB
CLS
COL
CRP
CTX
DT1
DT2
ELN
Acetil-CoA carboxilasa
Ácidos grasos
Angiotensinógeno
Proteína kinasa B
Kinasa activada por monofosfato de adenosina
Péptido similar a angiopoyetina 4
Angiotensina II
Lipasa de triglicéridos del tejido adiposo
Tejido adiposo pardo
Cirugía bariátrica
Estructuras similares a coronas
Colágeno
Proteína C reactiva
Telopéptido C terminal
Diabetes mellitus tipo 1
Diabetes mellitus tipo 2
Elastina

ETA-1
EWAT
EWL
FAS
HFD
HOMA
HSL
ICTP
IFNγ
IL
IMC
IPITT
LCN2
LPS
MAPK
MCP-1
MIF
MMP
Proteína activadora temprana de linfocitos T1
Tejido adiposo blanco epididimal
Exceso de peso perdido
Sintasa de ácidos grasos
Dieta alta en grasa
Homeostatic model assessment
Lipasa sensible a hormonas
Telopéptido carboxiterminal del colágeno tipo I
Interferón γ
Interleuquina
Índice de masa corporal
Prueba de tolerancia a la insulina intraperitoneal
Lipocalina 2
Lipopolisacárido
Proteína kinasa activada por mitógenos
Proteína quimiotáctica de macrófagos 1
Factor de inhibición de migración de macrófagos
Metaloproteinasa de la matriz
NAFLD
NASH
NF-κB
ND
NO
OPN
PAI-1
PPARγ
PRDM16
QUICKI
RYGBP
SAA
SG
SPP1
TG
TGFβ
TIMP
Enfermedad del hígado graso no alcohólico
Esteatohepatitis no alcohólica
Factor nuclear potenciador de las cadenas ligeras κ de las
células B activadas
Dieta normal
Óxido nítrico
Osteopontina
Inhibidor del activador del plasminógeno 1
Receptor activado por proliferadores de peroxisomas γ
Dominio PR que contiene 16
Quantitative insulin sensitivity check index
Bypass gástrico en Y de Roux
Proteína sérica amiloide A
Gastrectomía tubular
Fosfoproteína secretada 1
Triglicéridos
Factor de crecimiento transformante β
Inhibidores tisulares de metaloproteinasas

TNFα
UCP
VEGF
WAT
Factor de necrosis tumoral α
Proteína desacoplante
Factor de crecimiento vascular endotelial
Tejido adiposo blanco

ÍNDICE


INTRODUCCIÓN
1. TEJIDO ADIPOSO ............................................................................. 1
1.1. TEJIDO ADIPOSO BLANCO 2
1.2. TEJIDO ADIPOSO PARDO 2
1.3. TEJIDO ADIPOSO BEIGE 3
2. OBESIDAD ........................................................................................ 4
2.1. PREVALENCIA, TIPOS E IMPLICACIONES
FISIOPATOLÓGICAS DE LA OBESIDAD 4
2.2. HIPOXIA, INFLAMACIÓN Y FIBROSIS DEL TEJIDO ADIPOSO
BLANCO DURANTE LA OBESIDAD 6
2.3. COMORBILIDADES ASOCIADAS A LA OBESIDAD 9
2.3.1. Diabetes tipo 2 9
2.3.2. Síndrome metabólico 10
2.3.3. Hígado graso no alcohólico 11
2.4. TRATAMIENTO DE LA OBESIDAD 12
2.4.1. Modificación del estilo de vida 13
2.4.2. Tratamiento farmacológico 13
2.4.3. Cirugía bariátrica 14
3. OSTEOPONTINA ............................................................................ 18
3.1. ESTRUCTURA DE LA OSTEOPONTINA 18
3.2. RECEPTORES DE OSTEOPONTINA 19
3.3. SÍNTESIS Y REGULACIÓN DE LA OSTEOPONTINA 20
3.4. EFECTOS FISIOLÓGICOS DE LA OSTEOPONTINA 21
3.4.1. Metabolismo óseo 21
3.4.2. Respuesta inmune e inflamatoria 22
3.4.3. Procesos tumorales 24

3.4.4. Enfermedades renales 26
3.4.5. Alteraciones respiratorias 26
3.4.6. Procesos ateroscleróticos y cardiovasculares 27
3.4.7. Cicatrización de heridas 28
3.4.8. Diabetes 29
3.4.9. Hígado graso no alcohólico 29
3.4.10. Efectos de la osteopontina en la obesidad 30
HIPÓTESIS GENERAL 31
OBJETIVOS GENERALES 35
ARTÍCULOS 39
1. REVISIÓN DE LA RELEVANCIA DE LAS SEÑALES PERIFÉRICAS
EN LA HOMEOSTASIS ENERGÉTICA 41
2. ESTUDIO EN RATONES DEFICIENTES EN OSTEOPONTINA 71
3. EFECTOS DE LA GASTRECTOMÍA TUBULAR SOBRE LA
OSTEOPONTINA EN RATAS 101
4. EFECTO DE DIFERENTES TÉCNICAS DE CIRUGÍA BARIÁTRICA
SOBRE LOS NIVELES CIRCULANTES DE OSTEOPONTINA EN
HUMANOS 113
DISCUSIÓN 145
1. ESTUDIO EN RATONES DEFICIENTES EN OSTEOPONTINA 129
1.1. Efecto sobre el peso corporal y el WAT 130
1.2. Efecto sobre el remodelado de la matriz extracelular en el
EWAT 131
1.3. Efecto sobre el estrés oxidativo 133
1.4. Efecto sobre la inflamación en el EWAT 133
1.5. Efecto sobre la fibrosis en el EWAT e hígado 135
1.6. Efecto sobre la esteatosis hepática 136
1.7. Efecto sobre la inflamación en el hígado 137
1.8. Efecto sobre la sensibilidad a la insulina 137
1.9. Efecto sobre el tejido adiposo pardo 138
2. EFECTOS DE LA GASTRECTOMÍA TUBULAR SOBRE LA
OSTEOPONTINA EN RATAS 139
3. EFECTO DE DIFERENTES PROCEDIMIENTOS DE CIRUGÍA
BARIÁTRICA SOBRE LOS NIVELES CIRCULANTES DE
OSTEOPONTINA EN HUMANOS 143
CONCLUSIONES 149
BIBLIOGRAFÍA 153
OTRAS PUBLICACIONES RELACIONADAS 175
ARTÍCULO 1: Physiology and pathophysiology of aquaporins 177
ARTÍCULO 2: Sleeve gastrectomy induces weight loss in diet-induced
obese rats even if high-fat feeding is continued 195
ARTÍCULO 3: Sleeve gastrectomy reduces blood pressure in obese
(fa/fa) Zucker rats 205
ARTÍCULO 4: Short- and long-term changes in gastric morphology
and histopathology following sleeve gastrectomy in diet-induced
obese rats 217


INTRODUCCIÓN


Introducción
1
1. TEJIDO ADIPOSO
En un principio, se consideraba que el tejido adiposo representaba
exclusivamente un almacén de energía en forma de grasa. Sin embargo, los
estudios realizados en los últimos años han puesto de manifiesto que
constituye un tejido muy activo que secreta numerosos factores (Figura 1) tales
como citoquinas, factores de crecimiento, factores vasoactivos, proteínas de la
matriz extracelular, entre otras moléculas (Frühbeck et al, 2001; Frühbeck,
2008).
Figura 1. Factores secretados por el tejido adiposo (modificada de Frühbeck and Gómez-
Ambrosi, 2013).
Todos estos factores hacen que el tejido adiposo participe en un amplio
rango de procesos fisiológicos entre los que se incluyen reproducción,
apoptosis, inflamación, angiogénesis, regulación de la presión sanguínea,
Introducción
2
aterogénesis, coagulación, fibrinolisis, inmunidad y homeostasis vascular
(Frühbeck, 2008).
1.1. TEJIDO ADIPOSO BLANCO
Los adipocitos del tejido adiposo blanco (WAT) tienen un tamaño que
varía entre 20 y 200 μm de diámetro, poseen forma esférica u oval y están
formados por una gran gota lipídica que ocupa casi toda la célula y que
desplaza el núcleo y el citoplasma a la periferia (Frühbeck, 2008).
El WAT representa el principal depósito del excedente de energía
aportada con la ingesta, la cual se acumula en los adipocitos en forma de
triglicéridos (TG). Durante la obesidad, este exceso en la acumulación de TG
provoca la hipertrofia de los adipocitos (Frühbeck, 2008).
1.2. TEJIDO ADIPOSO PARDO
El tejido adiposo pardo (BAT) tiene un papel destacado en el
metabolismo energético de pequeños mamíferos y recién nacidos (Cannon and
Nedergaard, 1986). Los adipocitos pardos poseen la capacidad de almacenar y
sintetizar TG. Presentan entre 15 y 60 μm de diámetro y apariencia multilocular,
almacenando los lípidos en numerosas gotas lipídicas de reducido tamaño, en
vez de en una gran gota lipídica como los adipocitos blancos. El BAT se
encuentra mucho más vascularizado que el WAT y posee una gran abundancia
de mitocondrias.
Los adipocitos pardos disipan la energía en forma de calor. Este efecto
se produce por el desacoplamiento producido por la proteína desacoplante 1
(UCP1) en la cadena transportadora de electrones, el cual provoca la

Introducción
3
producción de calor en lugar de ATP (Cannon and Nedergaard, 2004; Frühbeck
et al, 2009).
Antiguamente se pensaba que el BAT era inexistente en adultos, pero
estudios recientes de tomografía por emisión de positrones han demostrado su
existencia en humanos adultos (Cypess et al, 2009; Virtanen et al, 2009). Por
tanto, se ha planteado que su estimulación podría ser una diana terapéutica
contra la obesidad (Frühbeck et al, 2009).
1.3. TEJIDO ADIPOSO BEIGE
El tejido adiposo beige, denominado así por tener un fenotipo intermedio
entre la grasa blanca y la grasa parda, está constituido por adipocitos con
apariencia similar a los adipocitos pardos, pero que se encuentran en
localizaciones correspondientes al WAT. Los adipocitos beige expresan UCP1
lo que les confiere cierta capacidad termogénica, aunque menor que la de los
adipocitos pardos (Sharp et al, 2012; Wu et al, 2012; Cypess et al, 2013). Son
fenotípicamente distintos tanto de los adipocitos blancos como de los pardos,
expresando genes propios como TNFRF9, TBX1 o TMEM26. Pueden ser
generados a través de células progenitoras presentes en el WAT o por
transdiferenciación de adipocitos blancos. Pueden diferenciarse ante una
estimulación hormonal o por una exposición prolongada al frío (Figura 2) (Giralt
and Villarroya, 2013; Jespersen et al, 2013; Bartelt and Heeren, 2014).

Introducción
4
Figura 2. “Empardecimiento” del WAT (modificada de Bartelt and Heeren, 2014).
2. OBESIDAD
2.1. PREVALENCIA, TIPOS E IMPLICACIONES
FISIOPATOLÓGICAS DE LA OBESIDAD
La obesidad se define como un exceso de grasa corporal. Se considera
que una persona tiene sobrepeso cuando posee un índice de masa corporal
(IMC, peso expresado en kilogramos dividido entre la altura expresada en
metros al cuadrado) entre 25,0 y 29,9 kg/m2, y que presenta obesidad cuando
tiene un IMC igual o mayor a 30,0 kg/m2. Sin embargo, aunque el IMC ha
demostrado ser muy útil, se ha observado que presenta una elevada tasa de
error en la clasificación de la obesidad. En este sentido, lo ideal sería utilizar el
porcentaje de grasa corporal para definir sobrepeso y obesidad. Según el
porcentaje de grasa corporal los puntos de corte para el sobrepeso son 20,1-
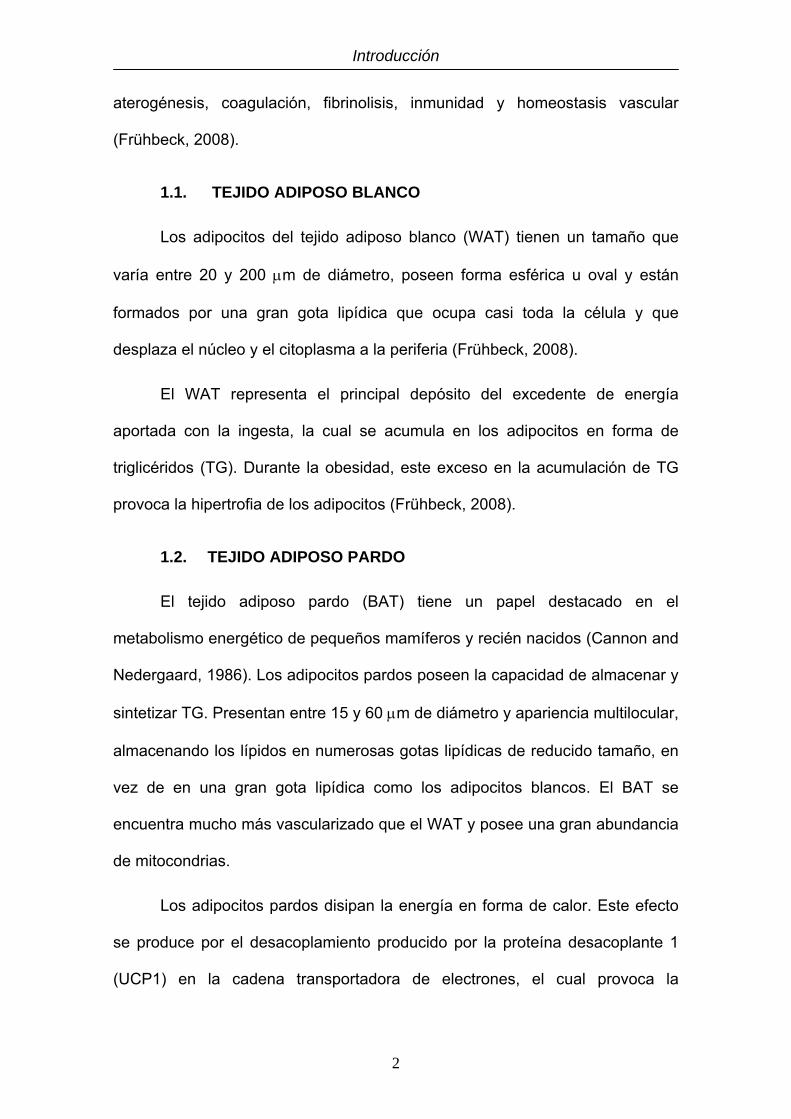
25,0% para hombres y 30,1-35,0% para mujeres, mientras que los puntos de
corte para la obesidad se sitúan en 25% en varones y 35% en mujeres (Tabla
1) (Gómez-Ambrosi et al, 2012).
Introducción
5
Tabla 1. Puntos de corte para la obesidad según el porcentaje de grasa corporal.
La obesidad aparece como resultado del desequilibrio entre la ingesta
calórica y el gasto energético. Cambios en el estilo de vida y en la dieta han
provocado en las últimas décadas un progresivo aumento del sobrepeso y de la
obesidad, llegando a ser uno de los principales problemas de salud en los
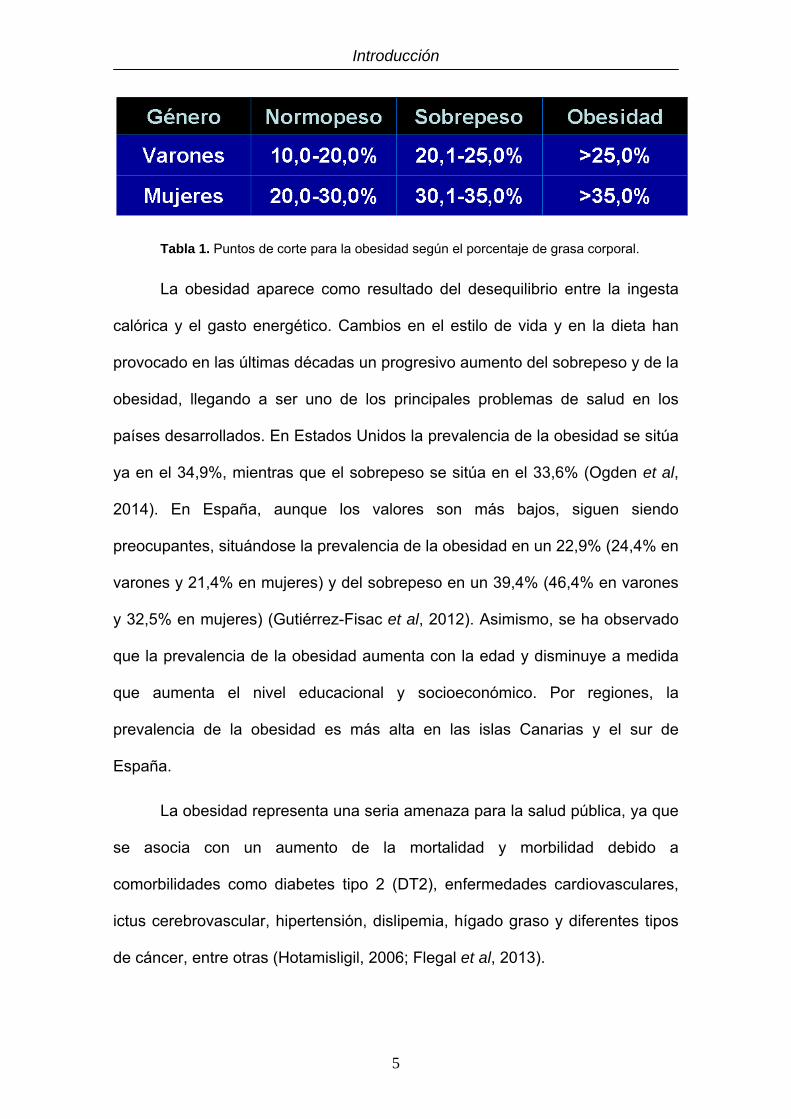
países desarrollados. En Estados Unidos la prevalencia de la obesidad se sitúa
ya en el 34,9%, mientras que el sobrepeso se sitúa en el 33,6% (Ogden et al,
2014). En España, aunque los valores son más bajos, siguen siendo
preocupantes, situándose la prevalencia de la obesidad en un 22,9% (24,4% en
varones y 21,4% en mujeres) y del sobrepeso en un 39,4% (46,4% en varones
y 32,5% en mujeres) (Gutiérrez-Fisac et al, 2012). Asimismo, se ha observado
que la prevalencia de la obesidad aumenta con la edad y disminuye a medida
que aumenta el nivel educacional y socioeconómico. Por regiones, la
prevalencia de la obesidad es más alta en las islas Canarias y el sur de
España.
La obesidad representa una seria amenaza para la salud pública, ya que
se asocia con un aumento de la mortalidad y morbilidad debido a
comorbilidades como diabetes tipo 2 (DT2), enfermedades cardiovasculares,
ictus cerebrovascular, hipertensión, dislipemia, hígado graso y diferentes tipos
de cáncer, entre otras (Hotamisligil, 2006; Flegal et al, 2013).

Introducción
6
La distribución del WAT constituye un importante factor en el desarrollo
del síndrome metabólico. Se ha observado que la acumulación de grasa
visceral (obesidad androide o central) resulta más perjudicial que la
acumulación de grasa subcutánea gluteofemoral (obesidad ginoide o
periférica). En la figura 3 pueden apreciarse los diferentes tipos de obesidad
según la distribución del tejido adiposo (Frühbeck, 2008).
Figura 3. Tipos de obesidad según la distribución del WAT (modificada de Frühbeck, 2008).
2.2. HIPOXIA, INFLAMACIÓN Y FIBROSIS DEL TEJIDO ADIPOSO
BLANCO DURANTE LA OBESIDAD
La expansión del WAT y el aumento de tamaño de los adipocitos
provoca que el oxígeno no pueda difundir correctamente, creando cierto grado
de hipoxia dentro del tejido (Wood et al, 2009; Trayhurn, 2013). Se ha
observado que los adipocitos de sujetos obesos pueden llegar a alcanzar un
diámetro de 150-200 μm (Skurk et al, 2007), pudiendo exceder de esta manera
la distancia normal de difusión celular del oxígeno, que es de aproximadamente
100 μm (Helmlinger et al, 1997). Trayhurn y Wood observaron que la expansión
del WAT durante el desarrollo de la obesidad aumenta la hipoxia en ciertas

Introducción
7
partes del WAT, ya que el incremento en la angiogénesis es incapaz de
mantener niveles suficientes de oxígeno en el WAT en su totalidad (Trayhurn
and Wood, 2004). Muchas adipoquinas que están relacionadas con la
inflamación, tales como el inhibidor del activador de plasminógeno 1 (PAI-1), el
factor de crecimiento vascular endotelial (VEGF), el factor de inhibición de
migración de macrófagos (MIF), el péptido similar a angiopoyetina 4
(ANGPLT4), las metaloproteinasas de la matriz 2 y 9 (MMP2 y MMP9), la
interleuquina 6 (IL-6) y la leptina se encuentran sobreexpresadas por la hipoxia
(Sun et al, 2011). Esta hipoxia del WAT podría provocar que numerosos
adipocitos mueran, lo cual representaría un estímulo para que los macrófagos
acudan para fagocitar los restos celulares, formándose agregados de
macrófagos alrededor de los adipocitos muertos, lo cual en estados avanzados
de obesidad da lugar a las denominadas “estructuras similares a coronas” (del
inglés CLS, crown like structures) (Cinti et al, 2005; Nishimura et al, 2007).
Otros autores postulan que la acumulación de macrófagos en el WAT es
provocada por la liberación de ácidos grasos (AG), la cual desencadenaría la
respuesta inflamatoria (Shi et al, 2006; Suganami et al, 2007). Otra teoría
propone que los macrófagos se acumulan al intentar proteger frente a la
acumulación de lípidos potencialmente tóxicos en el WAT (Xu et al, 2013).
En la obesidad se ha observado que, además de una mayor infiltración
de macrófagos en el WAT, éstos presentan un perfil proinflamatorio, con una
mayor presencia de macrófagos M1, los cuales contribuyen a aumentar el
estado de inflamación crónica del WAT, respecto a los macrófagos
antiinflamatorios M2 (Figura 4) (Patsouris et al, 2008).

Introducción
8
Figura 4. Expansión del tejido adiposo en la obesidad e infiltración de macrófagos asociada
(modificada de Sun et al, 2011).
Los macrófagos del tejido adiposo sintetizan citoquinas proinflamatorias
que, junto con las sintetizadas por los adipocitos y otras células del WAT, dan
lugar a una inflamación crónica de bajo grado, la cual es característica de la
obesidad (Hotamisligil, 2006). Asimismo, se ha observado que diferentes
proteínas proinflamatorias tales como IL1α, IL-1β, IL-3, IL-6, factor de necrosis
tumoral α (TNFα), factor de crecimiento transformante β (TGFβ), proteína
quimiotáctica de macrófagos 1 (MCP-1), proteína sérica amiloide A (SAA),
angiotensinógeno (AGT) y proteína C reactiva (CRP), entre otras, están
sobreexpresadas en la obesidad (Frühbeck et al, 2001; Cottam et al, 2004;
Catalán et al, 2007).
La inflamación crónica de bajo grado se encuentra altamente
relacionada con la infiltración de macrófagos en el tejido adiposo y la
resistencia a la insulina. La inflamación provoca que los macrófagos sean
atraídos hacia ella y estos, a su vez, provocan una mayor síntesis de proteínas
proinflamatorias, formando un bucle de retroalimentación positiva. Además, una
de las principales proteínas sobreexpresadas en la obesidad, TNFα, se ha
observado que se encuentra estrechamente relacionada con la resistencia a la

Introducción
9
insulina, ya que activa varias cascadas de señales que actúan inhibiendo la
sensibilidad a la insulina (Hotamisligil, 2006; Sun et al, 2011).
Durante estados avanzados de obesidad también se ha observado una
mayor síntesis de componentes de la matriz extracelular y una mayor
remodelación de ésta, posiblemente como resultado de la hipoxia y la
inflamación del WAT. Esta excesiva acumulación de componentes de la matriz
extracelular (principalmente colágeno I, IV y VI) puede desembocar en fibrosis,
provocando una menor plasticidad del tejido adiposo (Khan et al, 2009; O'Hara
et al, 2009).
2.3. COMORBILIDADES ASOCIADAS A LA OBESIDAD
2.3.1. Diabetes tipo 2
La resistencia a la insulina viene determinada por una baja sensibilidad a
la insulina de sus principales órganos diana (músculo esquelético, hígado y
WAT). En el hígado la insulina inhibe la gluconeogénesis y en el músculo
induce la entrada de glucosa. En el WAT la insulina disminuye la lipólisis,
reduciendo la salida de AG. En consecuencia, la resistencia a la insulina
conduce al aumento de las concentraciones circulantes de glucosa y AG, así
como a un aumento en los niveles circulantes de insulina (Oliver et al, 2010;
Donath and Shoelson, 2011).
Varios mecanismos que tienen lugar durante la obesidad se han
asociado a la DT2, tales como la glucotoxicidad debido a la hiperglucemia, la
lipotoxicidad debido al aumento de los AG en plasma y su acumulación en
músculo, hígado y páncreas, el estrés oxidativo o el estrés del retículo
endoplasmático (Donath and Shoelson, 2011).

Introducción
10
2.3.2. Síndrome metabólico
El concepto de síndrome metabólico se acuñó para hacer referencia a la
coexistencia de varios factores de riesgo en un mismo individuo que aumentan
la probabilidad de sufrir una enfermedad cardiovascular (Grundy et al, 2004).
No se trata de una simple enfermedad, sino de un grupo de alteraciones
causadas por la combinación de factores genéticos y factores asociados al
estilo de vida, especialmente un exceso de alimentación y una deficiencia en la
actividad física, que provocan una excesiva acumulación de grasa
principalmente en la zona abdominal (Alberti et al, 2009; Tesauro and Cardillo,
2011). Los principales componentes del síndrome metabólico son la obesidad
abdominal, la resistencia a la insulina, la hipertensión arterial y la dislipemia
(Tabla 2), así como un estado proinflamatorio y protrombótico (Grundy et al,
2004; Alberti et al, 2009). En 2009, varias asociaciones internacionales
consensuaron que el síndrome metabólico se define como la presencia de al
menos 3 de los 5 factores de riesgo expuestos en la tabla 2 (Grundy et al,
2004; Alberti et al, 2009).
Medida Puntos de corte
Circunferencia de cintura elevada Específicos según el género, la raza y el país
(p. ej., caucásicos: >102 cm en varones y >88 cm en mujeres)
Triglicéridos elevados (o tratamiento) ≥50 mg/dL (1,7 mmol/L)
Colesterol HDL reducido (o tratamiento) <40 mg/dL (1,0 mmol/L) en varones; <50 mg/dL (1,3 mmol/L) en mujeres
Presión sanguínea elevada (o tratamiento) Presión sistólica ≥130 mm Hg y/o presión diastólica ≥85 mm Hg
Glucosa en ayunas elevada (o tratamiento) ≥100 mg/dL
Tabla 2. Criterios clínicos para el diagnóstico del síndrome metabólico (modificada de Alberti et
al, 2009).
Introducción
11
2.3.3. Hígado graso no alcohólico
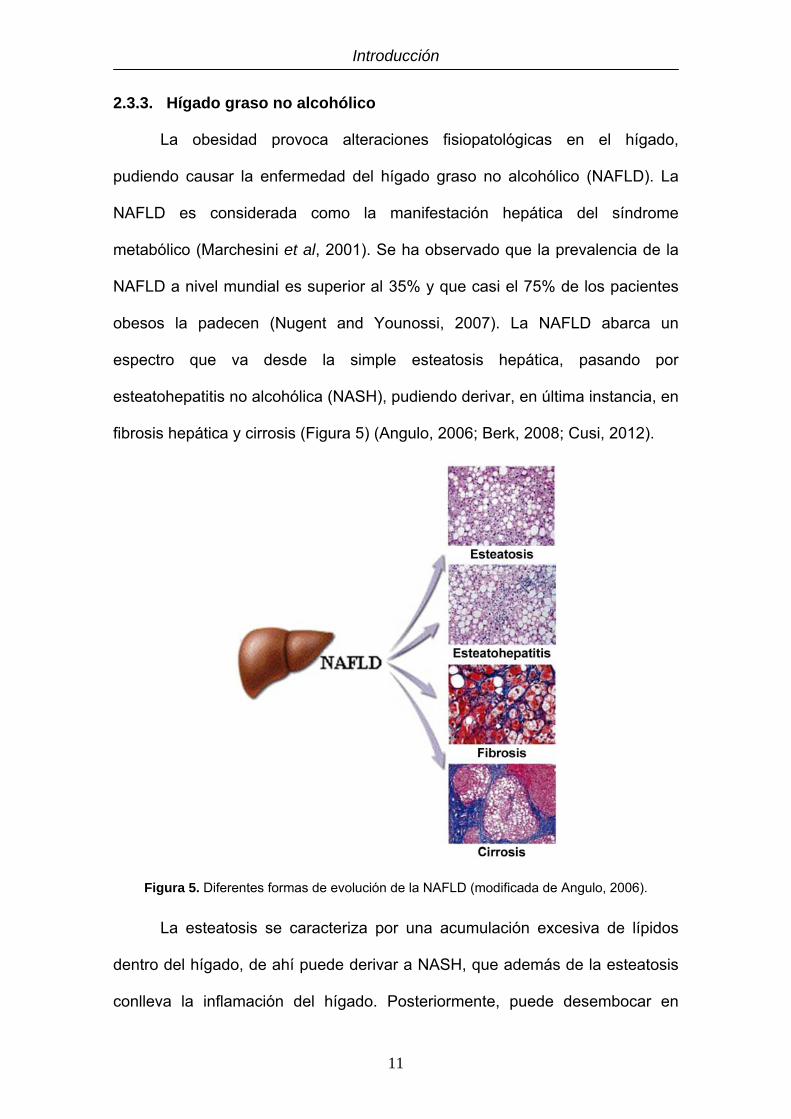
La obesidad provoca alteraciones fisiopatológicas en el hígado,
pudiendo causar la enfermedad del hígado graso no alcohólico (NAFLD). La
NAFLD es considerada como la manifestación hepática del síndrome
metabólico (Marchesini et al, 2001). Se ha observado que la prevalencia de la
NAFLD a nivel mundial es superior al 35% y que casi el 75% de los pacientes
obesos la padecen (Nugent and Younossi, 2007). La NAFLD abarca un
espectro que va desde la simple esteatosis hepática, pasando por
esteatohepatitis no alcohólica (NASH), pudiendo derivar, en última instancia, en
fibrosis hepática y cirrosis (Figura 5) (Angulo, 2006; Berk, 2008; Cusi, 2012).
Figura 5. Diferentes formas de evolución de la NAFLD (modificada de Angulo, 2006).
La esteatosis se caracteriza por una acumulación excesiva de lípidos
dentro del hígado, de ahí puede derivar a NASH, que además de la esteatosis
conlleva la inflamación del hígado. Posteriormente, puede desembocar en

Introducción
12
fibrosis, que se acompaña de una excesiva acumulación de proteínas de la
matriz, lo cual provoca la distorsión de la estructura hepática. La fibrosis puede
derivar en cirrosis, que se produce por una fibrosis excesiva en forma de
nódulos que altera notablemente la estructura del hígado y dificulta la función
de los hepatocitos (Angulo, 2006; Hübscher, 2006).
La severidad de la esteatosis se encuentra estrechamente asociada con
la cantidad de WAT visceral, así como con el IMC y el porcentaje de grasa
corporal, pero débilmente asociada con la cantidad de grasa subcutánea
(Kelley et al, 2003).
Formas avanzadas de la NAFLD aparecen con mayor frecuencia en
pacientes obesos con comorbilidades asociadas como la insulino-resistencia y
la obesidad central (Dixon et al, 2001). La pérdida de peso y el ejercicio han
mostrado tener efectos beneficiosos sobre la NAFLD (Zelber-Sagi et al, 2011).
Los efectos de la cirugía bariátrica (CB) sobre la NAFLD también han mostrado
ser favorables (Clark et al, 2005; Mathurin et al, 2006).
2.4. TRATAMIENTO DE LA OBESIDAD
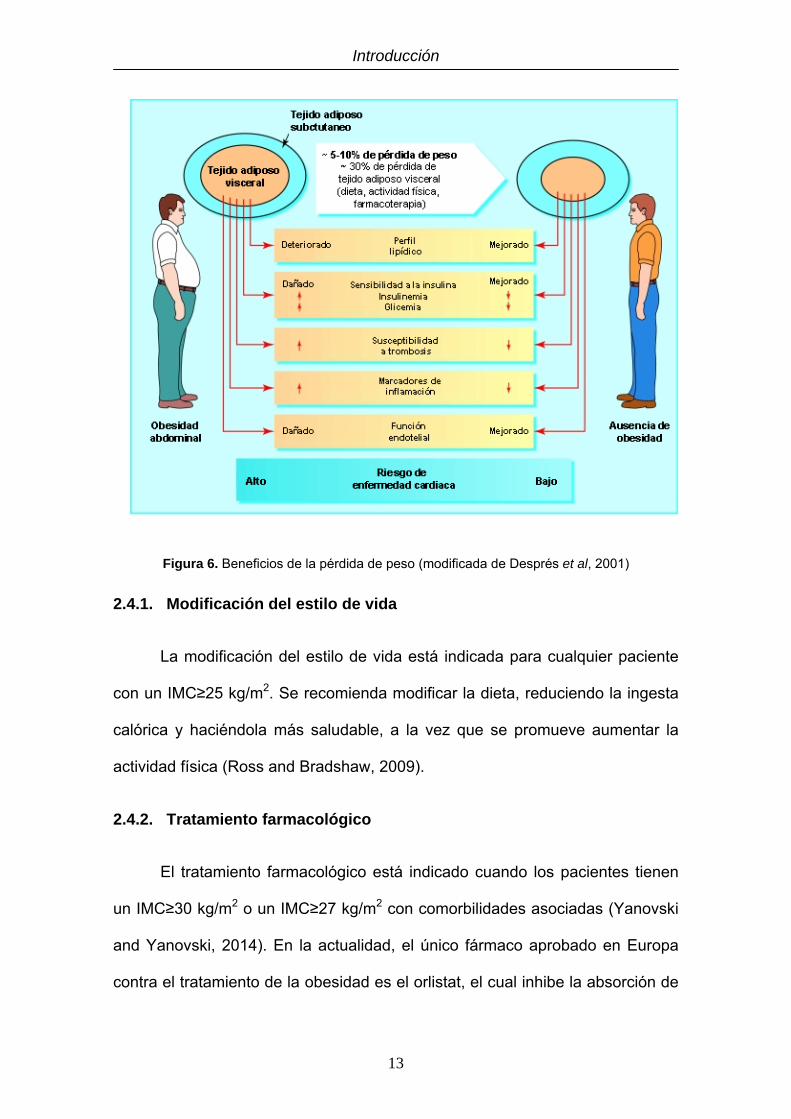
Se ha observado que la pérdida de peso mejora o revierte las
comorbilidades asociadas a la obesidad (Després et al, 2001; Cottam et al,
2004), por lo que un tratamiento adecuado frente al exceso de tejido adiposo
resulta muy beneficioso para la salud (Figura 6).
Introducción
13
Figura 6. Beneficios de la pérdida de peso (modificada de Després et al, 2001)
2.4.1. Modificación del estilo de vida
La modificación del estilo de vida está indicada para cualquier paciente
con un IMC≥25 kg/m2. Se recomienda modificar la dieta, reduciendo la ingesta
calórica y haciéndola más saludable, a la vez que se promueve aumentar la
actividad física (Ross and Bradshaw, 2009).
2.4.2. Tratamiento farmacológico
El tratamiento farmacológico está indicado cuando los pacientes tienen
un IMC≥30 kg/m2 o un IMC≥27 kg/m2 con comorbilidades asociadas (Yanovski
and Yanovski, 2014). En la actualidad, el único fármaco aprobado en Europa
contra el tratamiento de la obesidad es el orlistat, el cual inhibe la absorción de

Introducción
14
grasa a nivel intestinal, al inhibir la lipasa pancreática, aunque su efecto es
limitado (Padwal and Majumdar, 2007).
2.4.3. Cirugía bariátrica
La CB está indicada en pacientes cuidadosamente seleccionados con un
IMC≥40 kg/m2 o con IMC≥35 kg/m2 con comorbilidades asociadas susceptibles
de mejorar con la pérdida de peso (Fried et al, 2013; Fried et al, 2014).
Los procedimientos quirúrgicos de CB se clasifican en restrictivos,
malabsortivos o mixtos. Los procedimientos restrictivos limitan el consumo de
alimentos al reducir el tamaño o la capacidad gástrica. Sin embargo, los
procedimientos malabsortivos consisten en eliminar porciones del intestino
delgado disminuyendo, por tanto, la absorción de nutrientes. Las técnicas
mixtas son una combinación de ambos métodos (DeMaria, 2007; Schernthaner
and Morton, 2008).
Las cuatro técnicas de CB más utilizadas en la actualidad son la banda
gástrica ajustable, la gastrectomía tubular (SG), el bypass gástrico en Y de
Roux (RYGBP) y la derivación biliopancreática (DeMaria, 2007; Scott and
Batterham, 2011).
La banda gástrica ajustable (Figura 7) se coloca por vía laparoscópica
en la parte superior del estómago, justo por debajo de la unión gastroesofágica.
El nivel de restricción se puede ajustar mediante la adición o eliminación de
una solución salina al interior de la banda a través de un depósito subcutáneo.
Es una técnica restrictiva que provoca que los pacientes coman menos y que la
sensación de saciedad persista más tiempo (DeMaria, 2007; Dixon et al, 2012).

Introducción
15
Figura 7. Ilustración de la banda gástrica ajustable (modificada de DeMaria, 2007).
La SG (Figura 8) constituye un procedimiento restrictivo que consiste en
reducir el tamaño del estómago en torno a un 80%, disminuyendo la capacidad
gástrica. Este procedimiento, que se realiza mediante laparoscopia, se basa en
modificar la anatomía del estómago creando un estrecho tubo gástrico al
seccionar de manera ascendente y vertical el antro gástrico, el cuerpo y el
fundus (Deitel et al, 2008; Katz et al, 2011). En los últimos años ha emergido
como una técnica muy efectiva para la pérdida de peso y mejoría de la DT2 en
pacientes con obesidad mórbida. La pérdida del exceso de peso (EWL) se sitúa
en torno al 63% dentro del primer año, por lo que parece ser más efectiva que
la banda gástrica y se sitúa a la par que el RYGBP. Además, posee una baja
tasa de complicaciones (Deitel et al, 2011; Scott and Batterham, 2011).
Introducción
16
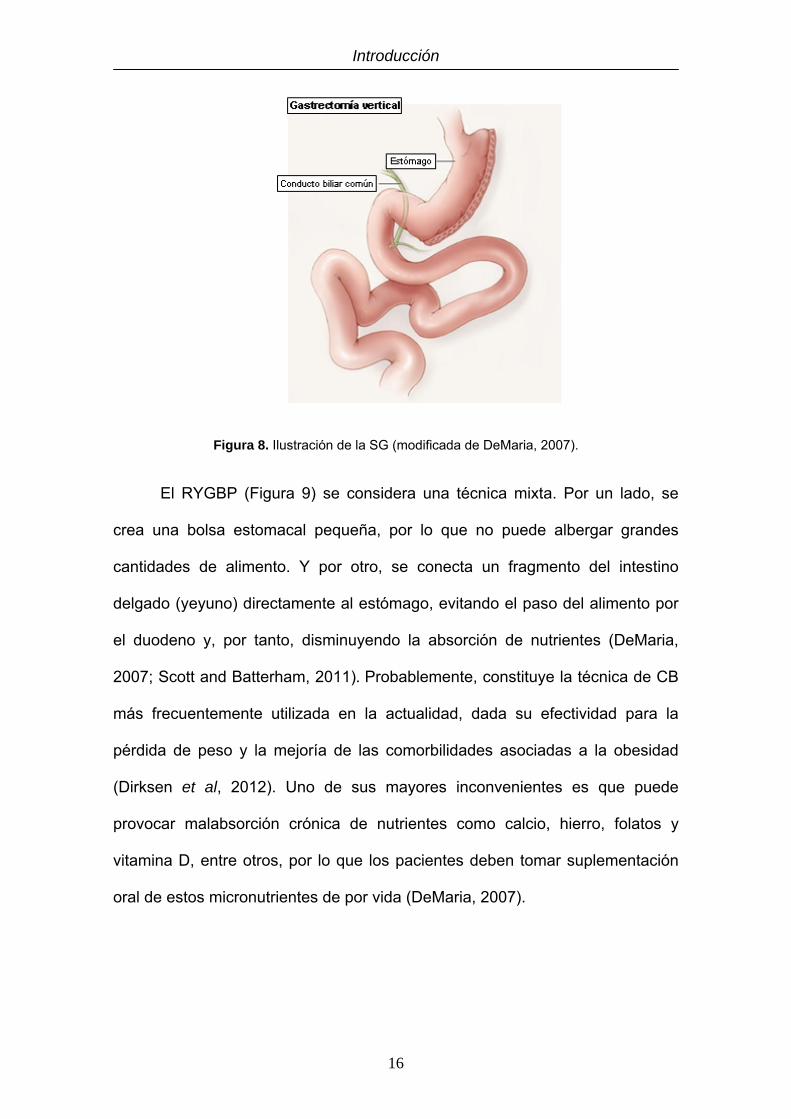
Figura 8. Ilustración de la SG (modificada de DeMaria, 2007).
El RYGBP (Figura 9) se considera una técnica mixta. Por un lado, se
crea una bolsa estomacal pequeña, por lo que no puede albergar grandes
cantidades de alimento. Y por otro, se conecta un fragmento del intestino
delgado (yeyuno) directamente al estómago, evitando el paso del alimento por
el duodeno y, por tanto, disminuyendo la absorción de nutrientes (DeMaria,
2007; Scott and Batterham, 2011). Probablemente, constituye la técnica de CB
más frecuentemente utilizada en la actualidad, dada su efectividad para la
pérdida de peso y la mejoría de las comorbilidades asociadas a la obesidad
(Dirksen et al, 2012). Uno de sus mayores inconvenientes es que puede
provocar malabsorción crónica de nutrientes como calcio, hierro, folatos y
vitamina D, entre otros, por lo que los pacientes deben tomar suplementación
oral de estos micronutrientes de por vida (DeMaria, 2007).

Introducción
17
Figura 9. Ilustración del RYGBP (modificada de DeMaria, 2007).
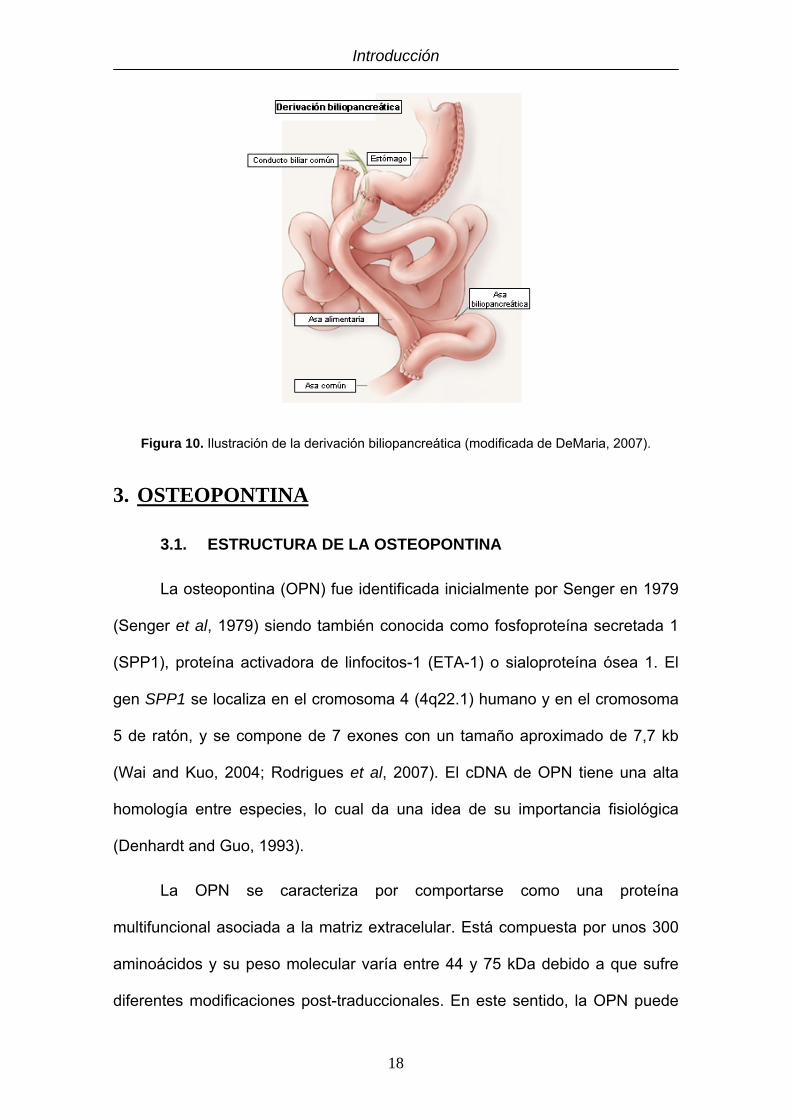
La derivación biliopancreática (Figura 10) se considera una técnica mixta,
aunque predomina el componente malabsortivo. En su forma clásica consiste
en realizar una gastrectomía vertical con una gastroenterostomía en Y de
Roux. La EWL se sitúa en torno al 70%, siendo superior a la obtenida por otros
procedimientos bariátricos. Al igual que el RYGBP provoca la malabsorción de
nutrientes, por lo que los pacientes deben tomar suplementación oral de
minerales y vitaminas de por vida. Esta técnica es menos utilizada debido al
mayor número de complicaciones que puede presentar. Muchos cirujanos han
optado por hacerla en dos partes realizando primero la gastrectomía y, una vez
que los pacientes han perdido cierto peso, realizar la gastroenterostomía,
reduciendo así el riesgo por complicaciones quirúrgicas (Van Hee, 2004; Elder
and Wolfe, 2007).
Introducción
18
Figura 10. Ilustración de la derivación biliopancreática (modificada de DeMaria, 2007).
3. OSTEOPONTINA
3.1. ESTRUCTURA DE LA OSTEOPONTINA
La osteopontina (OPN) fue identificada inicialmente por Senger en 1979
(Senger et al, 1979) siendo también conocida como fosfoproteína secretada 1
(SPP1), proteína activadora de linfocitos-1 (ETA-1) o sialoproteína ósea 1. El
gen SPP1 se localiza en el cromosoma 4 (4q22.1) humano y en el cromosoma
5 de ratón, y se compone de 7 exones con un tamaño aproximado de 7,7 kb
(Wai and Kuo, 2004; Rodrigues et al, 2007). El cDNA de OPN tiene una alta
homología entre especies, lo cual da una idea de su importancia fisiológica
(Denhardt and Guo, 1993).
La OPN se caracteriza por comportarse como una proteína
multifuncional asociada a la matriz extracelular. Está compuesta por unos 300
aminoácidos y su peso molecular varía entre 44 y 75 kDa debido a que sufre
diferentes modificaciones post-traduccionales. En este sentido, la OPN puede

Introducción
19
ser fosforilada y glicosilada, lo que da lugar a diferentes variantes funcionales
de la proteína (Buback et al, 2009). Además, la OPN puede ser modulada
funcionalmente por escisión proteolítica mediante la acción de la trombina y de
metaloproteinasas de matriz (MMP2, MMP3, MMP7, MMP9 y MMP12). Las
modificaciones post-traduccionales que sufre la OPN dependen del tipo celular
donde se producen (Bulfone-Paus and Paus, 2008).
La estructura secundaria de la OPN revela que esta proteína se
compone de 8 hélices α y 6 láminas β. Posee un sitio de unión a hidroxiapatito,
un sitio de unión a calcio y dos dominios de unión a heparina (Wai and Kuo,
2004).
3.2. RECEPTORES DE OSTEOPONTINA
Los receptores primarios para la OPN son aquellas integrinas que se
unen al motivo RGD, una secuencia clásica de las proteínas de adhesión. Las
integrinas son una familia de proteínas que participa mayoritariamente en la
adhesión celular. Las integrinas de mayor afinidad a la secuencia de OPN son
αvβ3, αvβ1 y αvβ5. La unión de estas tres integrinas se ve reforzada por Mg2+ o
Mn2+, pero no por Ca2+, el cual inhibe la unión a αvβ3 de la OPN. Otras
integrinas de unión a RGD son αvβ6 y α8β1, aunque poseen una menor afinidad.
La secuencia adyacente a RGD, SVVYGLR en humanos y SLAYGLR en
ratones, representa un ligando para α4β1 y α9β1, y también se une a α4β7 y α5β1,
aunque con menor afinidad (Figura 11) (Kazanecki et al, 2007; Rittling, 2011).

Introducción
20
Figura 11. Estructura de la OPN en donde se detallan los sitios de modificación y de unión con
moléculas o células (modificada de Rittling, 2011).
Se ha demostrado que la OPN también puede unirse al receptor CD44,
desde el extremo carboxi terminal al motivo RGD (Weber et al, 1996). Además,
parece existir una retroalimentación positiva, ya que se ha observado que la
OPN aumenta la expresión de CD44 (Rittling, 2011).
3.3. SÍNTESIS Y REGULACIÓN DE LA OSTEOPONTINA
La OPN se expresa en diversos tipos celulares, tales como osteoclastos,
osteoblastos, células epiteliales, endoteliales, del sistema nervioso y del
sistema inmune, por lo que se halla presente, en mayor o menor medida, en
casi todos los tejidos corporales (Wai and Kuo, 2004).

Introducción
21
Su regulación no se conoce en su totalidad. Sin embargo, se sabe que
su expresión está aumentada por citoquinas inflamatorias, tales como TNF-α,
IL-1β y TGF-β. Otros factores que inducen la sobreexpresión de OPN son el
óxido nítrico (NO), el lipopolisacárido (LPS), la angiotensina-II (ANG-II), los
esteroides, el ácido retinoico, los glucocorticoides, la hiperglucemia o la hipoxia
(Mazzali et al, 2002; El-Tanani et al, 2006).
3.4. EFECTOS FISIOLÓGICOS DE LA OSTEOPONTINA
La OPN está implicada, además de en el metabolismo óseo (Hunter et
al, 1996; Gerstenfeld, 1999), en la respuesta inmune e inflamatoria (Ashkar et
al, 2000; Chabas et al, 2001), en procesos tumorales (El-Tanani et al, 2006;
Rangaswami et al, 2006), en enfermedades renales (Wüthrich, 1998; Susztak
et al, 2004) y respiratorias (O'Regan, 2003; Kohan et al, 2009), en procesos
ateroscleróticos y cardiovasculares (Okamoto, 2007; Scatena et al, 2007), así
como en el desarrollo de DT2 (Towler et al, 1998; Susztak et al, 2004), la
cicatrización de heridas (Liaw et al, 1998; Weber et al, 2012) y el desarrollo de
la NAFLD (Sahai et al, 2004; Syn et al, 2011).
3.4.1. Metabolismo óseo
La OPN es una de las proteínas no colagenosas más abundantes en el
hueso (McKee and Nanci, 1996). Es expresada por osteoclastos y
osteoblastos, los cuales son las principales células responsables de la
remodelación ósea (Hunter et al, 1996).
Al estudiar ratones deficientes en OPN se ha observado que se
desarrollan normalmente y que sus huesos parecen ser morfológicamente
normales. Sin embargo, se han apreciado diferencias en la ultraestructura de

Introducción
22
los huesos y propiedades nanomecánicas, tales como un aumento en el
contenido y cristalinidad mineral del hueso (Boskey et al, 2002; Kavukcuoglu et
al, 2007). También se ha observado que, aunque los ratones deficientes en
OPN tienen la misma masa ósea, presentan una mayor fragilidad, siendo más
proclives a sufrir fracturas óseas (Thurner et al, 2010). Además, estudios in
vitro mostraron que los osteoclastos exhiben una movilidad disminuida en
ausencia de OPN (Chellaiah et al, 2003).
Por lo tanto, la OPN parece participar en el reclutamiento y la migración
de osteoclastos hacia la zona de remodelación ósea, regulando la forma y el
tamaño de los cristales óseos, favoreciendo una mejor y más resistente
estructura ósea (Gerstenfeld, 1999; Kazanecki et al, 2007; Thurner et al, 2010).
3.4.2. Respuesta inmune e inflamatoria
La OPN regula el sistema inmune a diferentes niveles; sirve como
proteína quimiotáctica que promueve la migración de las células inflamatorias
al tejido dañado y promueve además que permanezcan en el lugar. La OPN
también funciona como una citoquina inflamatoria y puede modular la
respuesta inmune al aumentar la expresión de citoquinas Th1 y de enzimas
que degradan la matriz (Weber et al, 2002; Bruemmer et al, 2003). Los ratones
deficientes en OPN son más susceptibles a infecciones, aunque están
protegidos frente a enfermedades inflamatorias y autoinmunes. Estas
patologías suelen verse afectadas por la función anormal de los macrófagos y
de otras células del sistema inmune (Rittling, 2011).
La OPN se produce a bajos niveles en monocitos, pero su expresión
aumenta drásticamente durante su diferenciación a macrófagos (Atkins et al,
1998). La OPN desempeña un papel clave en la biología de los macrófagos al

Introducción
23
regular la migración, la diferenciación, la supervivencia, la fagocitosis y la
producción de citoquinas (Bruemmer et al, 2003; Nystrom et al, 2007). La OPN
es inducida en macrófagos por varias citoquinas, tales como TNF-α, IL-1β,
interferón-γ (IFN-γ) e IL-6 y otros factores como ANG-II (Bruemmer et al, 2003;
Ogawa et al, 2005), siendo inhibida por IL-4 e IL-13 (Konno et al, 2006). La
OPN, además, puede inducir la producción de IL-12, mientras que inhibe la de
IL-10 (Ashkar et al, 2000; Weber et al, 2002). La inflamación crónica se
caracteriza por la presencia de macrófagos en los lugares del daño tisular y por
la liberación de citoquinas proinflamatorias por parte de los mismos. La
deficiencia genética de OPN o su inhibición funcional, reduce el reclutamiento
de los macrófagos a los sitios de inflamación, dificultando la liberación de
citoquinas proinflamatorias por parte de los macrófagos en el lugar de la
inflamación y, por tanto, disminuyendo la inflamación en estas zonas
(Bruemmer et al, 2003; Nomiyama et al, 2007; Mori et al, 2008).
Los neutrófilos expresan bajas cantidades de OPN, aunque es muy
importante para su reclutamiento, migración e infiltración. Los ratones
deficientes en OPN poseen neutrófilos con estas funciones disminuidas,
aunque no se ve afectada su capacidad de fagocitosis, generación de especies
reactivas de oxígeno o producción de citoquinas (Diao et al, 2004; Koh et al,
2007).
La OPN se encuentra altamente expresada en células T activadas y
desempeña un papel importante en la migración, adhesión y proliferación de
estas células en la inducción de la respuesta inmune (O'Regan et al, 1999;
Shinohara et al, 2005). Ratones deficientes en OPN tienen una respuesta Th1

Introducción
24
disminuida (Ashkar et al, 2000) y una menor producción de citoquinas
proinflamatorias (Bruemmer et al, 2003).
La OPN también desempeña un papel importante en la maduración,
migración y polarización de las células dendríticas. Se ha observado que
estimula la producción de citoquinas y la migración de las células dendríticas
de forma dosis-dependiente, de manera que en ausencia de OPN las células
dendríticas no migran correctamente y, además, reducen la producción de
citoquinas proinflamatorias (Weiss et al, 2001; Shinohara et al, 2008).
3.4.3. Procesos tumorales
La OPN está involucrada en múltiples tipos de cáncer, tales como cáncer
de colon, mama, cerebro, piel, ovario, pulmón, vejiga, próstata, tiroides, hígado,
riñón y estómago, entre otros (El-Tanani et al, 2006; Cao et al, 2012). En un
principio, se pensó que los altos niveles de OPN detectados en los tipos de
cáncer citados se debían a los infiltrados de macrófagos del tumor, más que al
tumor en sí mismo (Furger et al, 2001). Sin embargo, posteriormente se
observó que múltiples células tumorales también son capaces de expresar
OPN (Rittling and Chambers, 2004).
Se ha constatado que la OPN actúa en el cáncer a través de integrinas y
de CD44, en un mecanismo que implica a VEGF, proteínas quinasas activadas
por mitógenos (MAPK), proteína quinasa B (AKT-1) y factor nuclear potenciador
de las cadenas ligeras κ de las células B activadas (NF-κB), entre otros
factores, como un mecanismo que favorece el desarrollo tumoral al estimular la
angiogénesis, la degradación de la matriz extracelular, la migración celular y la
supervivencia (Figura 12).

Introducción
25
Figura 12. Mecanismos moleculares de la OPN en el cáncer (modificada de Cao et al, 2012).
Por regla general, las células tumorales que sobreexpresan OPN tienen
aumentada la capacidad de crecimiento, invasión y metástasis, lo cual se
asocia con un peor pronóstico y una menor tasa de supervivencia (Rodrigues et
al, 2007; Cao et al, 2012).
Se ha asociado el aumento de las concentraciones séricas de OPN con
un peor pronóstico y una menor tasa de supervivencia en cáncer de mama
(Rudland et al, 2002). Asimismo, se ha descrito una asociación similar en
cáncer gástrico (Dai et al, 2007), hepatocarcinoma (Kim et al, 2006), cáncer de
próstata (Thoms et al, 2012) y cáncer de páncreas (Zhivkova-Galunska et al,
2010).

Introducción
26
Dada la gran cantidad de procesos tumorales en los que participa la
OPN, ésta podría ser una diana terapéutica de interés para muchos de ellos
(Shevde et al, 2010).
3.4.4. Enfermedades renales
En los riñones sanos, la OPN es producida principalmente en el asa de
Henle y las neuronas distales, aunque en enfermedades renales su expresión
está significativamente aumentada en todos los segmentos tubulares y en el
glomérulo (Xie et al, 2001). La OPN puede ser detectada también en la orina
(Min et al, 1998).
En el riñón, la OPN interviene en la regulación del tono vascular, en la
hemodinámica glomerular y en la regulación del balance sal/agua a través de la
inhibición de la producción de óxido nítrico (Rollo et al, 1996). En condiciones
patológicas, favorece la isquemia renal, la obstrucción uretral, la proteinuria,
diversos tipos de nefritis (Wüthrich, 1998), la formación de cristales y piedras
renales (Hamamoto et al, 2010), el carcinoma renal (Zhang et al, 2009), así
como la inflamación y la fibrosis renal (Wolak et al, 2009; Irita et al, 2011).
Además, se ha observado que la deficiencia de OPN puede prevenir algunas
de estas patologías (Ophascharoensuk et al, 1999; Hamamoto et al, 2010; Irita
et al, 2011). Finalmente, se ha sugerido que la OPN podría constituir un buen
marcador de daño renal y del índice de supervivencia en pacientes con daño
renal (Lorenzen et al, 2010; Lorenzen et al, 2011).
3.4.5. Alteraciones respiratorias
En pulmones sanos, la OPN se expresa principalmente en las células
epiteliales bronquiales y en los macrófagos alveolares. Sin embargo, durante
Introducción
27
los procesos patológicos también se encuentra altamente expresada en el
epitelio lesionado, en los macrófagos intersticiales y alveolares, en las células
T, así como en el epitelio vascular pulmonar (O'Regan, 2003).
La OPN participa en un amplio rango de enfermedades pulmonares en
las que suele sobreexpresarse. Se ha puesto de manifiesto que participa en la
formación de granulomas (O'Regan et al, 2001), fibrosis pulmonar (Sabo-
Attwood et al, 2011), carcinoma de pulmón (Isa et al, 2009), enfermedades
vasculares pulmonares (Isoda et al, 2002), alergias (Xanthou et al, 2007) y
asma (Takahashi et al, 2009). También se ha comprobado que participa en las
enfermedades pulmonares asociadas al tabaquismo (Prasse et al, 2009).
Varios estudios han demostrado en ratones que la deficiencia de OPN
previene o disminuye los daños asociados a algunas de estas patologías
(Kohan et al, 2009; Simoes et al, 2009; Sabo-Attwood et al, 2011). Sin
embargo, su deficiencia resulta perjudicial en la formación de granulomas
asociados a infecciones, ya que los ratones poseen una menor capacidad de
respuesta frente a las infecciones intracelulares (O'Regan et al, 2001).
3.4.6. Procesos ateroscleróticos y cardiovasculares
La OPN no se expresa en tejido muscular cardiaco sano, pero su
expresión se ve estimulada por el estrés mecánico y la hipoxia (Ashizawa et al,
1996; Xie et al, 2004).
La OPN presenta efectos contrapuestos sobre el sistema cardiovascular.
Por un lado, se ha observado que la OPN favorece la regeneración del daño
vascular al regular los niveles de TGF-β y MMPs, así como la proliferación,
migración y acumulación de células musculares lisas y endoteliales que

Introducción
28
participan en la reparación y el remodelado vascular (Okamoto, 2007; Scatena
et al, 2007). Sin embargo, por otro lado promueve la aterosclerosis (Matsui et
al, 2003). En este contexto, se ha propuesto que los niveles plasmáticos de
OPN podrían ser utilizados como marcador de severidad de la arteriosclerosis,
del daño isquémico del corazón y del fallo cardiaco (Okamoto, 2007).
3.4.7. Cicatrización de heridas
La OPN participa en el proceso de cicatrización de las heridas, donde
actúa como un factor quimiotáctico para reclutar células inflamatorias al lugar
del daño (Lund et al, 2009). También se ha observado que la OPN participa en
el reclutamiento, regulación y diferenciación de fibroblastos y miofibroblastos
(Lenga et al, 2008). Sin embargo, aunque resulta necesaria para la
cicatrización de heridas, se ha observado que altas concentraciones de OPN
mantenidas a lo largo del tiempo originan un exceso de cicatrización y fibrosis
(Weber et al, 2012).
Los ratones deficientes en OPN, aunque tienen las mismas propiedades
tensiles en sus heridas, muestran una gran desorganización de la matriz, con
un menor número de fibras de colágeno, un menor diámetro de las mismas y
una estructura más desorganizada (Liaw et al, 1998). Asimismo, presentaron
una menor expresión de colágeno tipo I, Mmp9, fibronectina y Tgfb, todos ellos
genes con un importante papel en la cicatrización de heridas (Mori et al, 2008).
Por tanto, la OPN parece ser necesaria también para el depósito de
componentes de la matriz extracelular en la cicatrización de las heridas,
especialmente para el depósito de colágeno.

Introducción
29
3.4.8. Diabetes
La OPN participa en el desarrollo tanto de la diabetes tipo 1 (DT1) como
de la DT2. La DT1 cursa con destrucción de las células β del páncreas,
generalmente debido a un problema autoinmune (Schranz and Lernmark,
1998). Se ha observado que la OPN está aumentada en el suero de pacientes
con esta patología (Fierabracci et al, 1999). Sin embargo, la OPN parece tener
un papel protector de los islotes pancreáticos, protegiendo frente a la insulinitis
destructiva y la severidad de la DT1, probablemente, a través un aumento de la
supervivencia de las células β (Katakam et al, 2005; Arafat et al, 2007; Gong et
al, 2009).
La DT2 se desarrolla debido a que las células insulino-sensibles
adquieren resistencia a los efectos de la insulina. Varios estudios han
demostrado que los niveles de OPN están aumentados en la resistencia a la
insulina asociada a la obesidad en roedores y humanos (Gómez-Ambrosi et al,
2007; Nomiyama et al, 2007; Kiefer et al, 2008; Bertola et al, 2009; Chapman et
al, 2010; Kiefer et al, 2010; Kiefer et al, 2011).
3.4.9. Hígado graso no alcohólico
Dentro del hígado, la OPN se produce principalmente por las células
inflamatorias, aunque también es producida y liberada por los hepatocitos
(Kwon et al, 2010). Diversos estudios han puesto de manifiesto que la OPN se
encuentra estrechamente implicada en la NAFLD favoreciendo la acumulación
de grasa, la inflamación y la fibrosis hepática (Sahai et al, 2004; Bertola et al,
2009; Kiefer et al, 2011; Syn et al, 2011). Por otra parte, se ha constatado que
la OPN también está implicada en las afecciones alcohólicas del hígado,

Introducción
30
mostrando una estrecha asociación con la inflamación y la fibrosis hepática
asociada al alcoholismo (Patouraux et al, 2012).
3.4.10. Efectos de la osteopontina en la obesidad
Nuestro grupo fue pionero en demostrar que la OPN es producida por el
WAT, así como que su concentración en el plasma y su expresión en el WAT
se encuentran muy aumentadas en sujetos obesos (Gómez-Ambrosi et al,
2007; Hurtado del Pozo et al, 2011). Posteriormente, otros grupos han
confirmado nuestros hallazgos y han mostrado que la OPN es producida
principalmente por los macrófagos, aunque también es sintetizada en menor
medida por adipocitos y preadipocitos (Nomiyama et al, 2007; Kiefer et al,
2008). Se ha observado que la OPN está muy implicada en el estado
proinflamatorio del WAT asociado con la obesidad, (Nomiyama et al, 2007;
Kiefer et al, 2008; Bertola et al, 2009; Chapman et al, 2010; Kiefer et al, 2010),
ya que sus niveles se relacionan con la expresión de citoquinas
proinflamatorias, tanto en suero (IL-6, MCP-1, PAI-1 y resistina) como en el
propio tejido (IL-1β, IL-10, IL-12p70, IFNγ, TNFα, IL-6 y MCP1) (Nomiyama et
al, 2007; Chapman et al, 2010; Kiefer et al, 2010), así como con el
reclutamiento de macrófagos al WAT (Nomiyama et al, 2007; Bertola et al,
2009; Chapman et al, 2010; Kiefer et al, 2010). En este contexto cabe destacar
que el descenso de peso por disminución de la ingesta calórica disminuye los
niveles séricos de OPN (Gómez-Ambrosi et al, 2007). Sin embargo, la
reducción de peso por CB parece aumentar las concentraciones circulantes de
OPN (Riedl et al, 2008; Schaller et al, 2009; Komorowski et al, 2011).

HIPÓTESIS GENERAL


Hipótesis general
33
La obesidad consiste en un exceso de grasa corporal que resulta del
desequilibrio entre la ingesta y el gasto energético. La OPN es una proteína
expresada en múltiples tipos celulares, lo cual explica su presencia, en mayor o
menor medida, en la práctica totalidad de los tejidos. Además, la OPN ha
mostrado estar implicada en diversas funciones fisiológicas. En este sentido,
nuestro grupo ha observado que la expresión de OPN se encuentra aumentada
en el WAT en situaciones de obesidad. Otros grupos lo han confirmado
posteriormente, habiéndose descrito que la OPN está relacionada con la
inflamación y la insulino-resistencia. Sin embargo, los mecanismos moleculares
mediante los cuales la OPN participa en estos procesos no se conocen en su
totalidad. La hipótesis del presente trabajo consiste en que la OPN podría jugar
un papel destacado en el desarrollo de la obesidad y en las comorbilidades
asociadas a la misma. En este contexto, la OPN podría estar implicada,
asimismo, en los cambios metabólicos e inflamatorios que tienen lugar tras la
pérdida de peso inducida mediante CB.


OBJETIVOS GENERALES

Objetivos generales
37
1. Analizar la implicación de la OPN en el desarrollo de obesidad en un
modelo murino de obesidad inducida por dieta en ratones deficientes en
OPN.
2. Examinar la importancia de la OPN en el metabolismo glucídico y lipídico,
así como en los procesos de fibrosis y remodelado de la matriz
extracelular.
3. Evaluar la implicación de la OPN en la inflamación asociada a la obesidad.
4. Examinar la importancia de la OPN en el tejido adiposo pardo.
5. Analizar el efecto de la CB sobre los niveles séricos de OPN y su
expresión en WAT e hígado en ratas con obesidad inducida por dieta.
6. Explorar el efecto de la CB sobre los niveles plasmáticos de OPN y su
relación con el metabolismo glucídico, así como el remodelado óseo en
humanos.


ARTÍCULOS


41
1. REVISIÓN DE LA RELEVANCIA DE LAS
SEÑALES PERIFÉRICAS EN LA
HOMEOSTASIS ENERGÉTICA


1.1. Objetivos
1. Realizar una revisión exhaustiva de las señales periféricas implicadas en la homeostasis energética, mediante el estudio de los factores de regulación de la ingesta y del gasto energético, así como de sus principales funciones. 2. Analizar cómo los efectos de estas moléculas en el control de la ingesta y el gasto energético inciden sobre el mantenimiento del peso corporal y el desarrollo de obesidad. 1.2. Artículo Lancha A, Frühbeck G and Gómez-Ambrosi J. Peripheral signalling in energy homeostasis control. Nutr Res Rev 2012;25:223-48.

71
2. ESTUDIO EN RATONES DEFICIENTES EN
OSTEOPONTINA


Artículo 2
73
2.1. Hipótesis
La deficiencia en OPN podría proteger frente al desarrollo de obesidad y
esteatosis hepática.
2.2. Objetivos
1. Analizar la implicación de la OPN en el desarrollo de obesidad en un modelo
murino de obesidad inducida por dieta alta en grasa en ratones deficientes en
OPN.
2. Examinar la importancia de la OPN sobre el metabolismo glucídico.
3. Estudiar la implicación de la OPN sobre el metabolismo lipídico.
4. Determinar la influencia de la OPN en los procesos de fibrosis y remodelado
de la matriz extracelular.
5. Evaluar la implicación de la OPN en la inflamación asociada a la obesidad.
6. Analizar el efecto de la deficiencia de OPN sobre la actividad del BAT.
2.3. Artículo
Lancha A, Rodríguez A, Catalán V, Becerril S, Sáinz N, Ramírez B, Burrell MA,
Salvador J, Frühbeck G and Gómez-Ambrosi J. Osteopontin deletion prevents
the development of obesity and hepatic steatosis via impaired adipose tissue
matrix remodeling and reduced inflammation and fibrosis in adipose tissue and
liver in mice. PLoS One 2014;9:e98398.


Osteopontin Deletion Prevents the Development ofObesity and Hepatic Steatosis via Impaired AdiposeTissue Matrix Remodeling and Reduced Inflammationand Fibrosis in Adipose Tissue and Liver in MiceAndoni Lancha1,2, Amaia Rodrıguez1,2, Victoria Catalan1,2, Sara Becerril1,2, Neira Sainz1,
Beatriz Ramırez1,2, Marıa A. Burrell2,3, Javier Salvador2,4, Gema Fruhbeck1,2,4, Javier Gomez-Ambrosi1,2*
1 Metabolic Research Laboratory, Clınica Universidad de Navarra, Pamplona, Spain, 2 CIBER Fisiopatologıa de la Obesidad y Nutricion (CIBERobn), Instituto de Salud Carlos
III, Madrid, Spain, 3 Department of Histology and Pathology, University of Navarra, Pamplona, Spain, 4 Department of Endocrinology & Nutrition, Clınica Universidad de
Navarra, Pamplona, Spain
Abstract
Osteopontin (OPN) is a multifunctional extracellular matrix (ECM) protein involved in multiple physiological processes. OPNexpression is dramatically increased in visceral adipose tissue in obesity and the lack of OPN protects against thedevelopment of insulin resistance and inflammation in mice. We sought to unravel the potential mechanisms involved inthe beneficial effects of the absence of OPN. We analyzed the effect of the lack of OPN in the development of obesity andhepatic steatosis induced by a high-fat diet (HFD) using OPN-KO mice. OPN expression was upregulated in epididymal whiteadipose tissue (EWAT) and liver in wild type (WT) mice with HFD. OPN-KO mice had higher insulin sensitivity, lower bodyweight and fat mass with reduced adipose tissue ECM remodeling and reduced adipocyte size than WT mice under a HFD.Reduced MMP2 and MMP9 activity was involved in the decreased ECM remodeling. Crown-like structure number in EWAT aswell as F4/80-positive cells and Emr1 expression in EWAT and liver increased with HFD, while OPN-deficiency blunted theincrease. Moreover, our data show for the first time that OPN-KO under a HFD mice display reduced fibrosis in adiposetissue and liver, as well as reduced oxidative stress in adipose tissue. Gene expression of collagens Col1a1, Col6a1 and Col6a3in EWAT and liver, as well as the profibrotic cytokine Tgfb1 in EWAT were increased with HFD, while OPN-deficiencyprevented this increase. OPN deficiency prevented hepatic steatosis via reduction in the expression of molecules involved inthe onset of fat accumulation such as Pparg, Srebf1, Fasn, Mogat1, Dgat2 and Cidec. Furthermore, OPN-KO mice exhibitedhigher body temperature and improved BAT function. The present data reveal novel mechanisms of OPN in thedevelopment of obesity, pointing out the inhibition of OPN as a promising target for the treatment of obesity and fatty liver.
Citation: Lancha A, Rodrıguez A, Catalan V, Becerril S, Sainz N, et al. (2014) Osteopontin Deletion Prevents the Development of Obesity and Hepatic Steatosis viaImpaired Adipose Tissue Matrix Remodeling and Reduced Inflammation and Fibrosis in Adipose Tissue and Liver in Mice. PLoS ONE 9(5): e98398. doi:10.1371/journal.pone.0098398
Editor: Luısa M. Seoane, Complexo Hospitalario Universitario de Santiago, Spain
Received April 9, 2014; Accepted May 2, 2014; Published May 28, 2014
Copyright: � 2014 Lancha et al. This is an open-access article distributed under the terms of the Creative Commons Attribution License, which permitsunrestricted use, distribution, and reproduction in any medium, provided the original author and source are credited.
Data Availability: The authors confirm that all data underlying the findings are fully available without restriction. Data are available upon request to thecorresponding author.
Funding: This work was supported by grants from the Fondo de Investigacion Sanitaria-FEDER, Instituto de Salud Carlos III (ISCIII), (PI081146, PI11/02681, andPI12/00515); and from the Departments of Health (58/2011) and Education (res228/2008) of the Gobierno de Navarra of Spain. CIBERobn is an initiative of theISCIII, Spain. The funders had no role in study design, data collection and analysis, decision to publish, or preparation of the manuscript.
Competing Interests: The authors have declared that no competing interests exist.
* E-mail: [email protected]
Introduction
Changes in lifestyle and diet have caused over the last decades a
progressive increase in the incidence of obesity, being one of the
most prevalent metabolic disorders. Obesity is associated with
increased morbi-mortality from conditions such as type 2 diabetes,
cardiovascular disease, hyperlipidemia, steatohepatitis and cancer
[1].
Osteopontin (OPN, Spp1), is a multifunctional extracellular
matrix-associated protein abundantly expressed in bone, being
also expressed in other cell types such as macrophages, smooth
muscle cells and hepatocytes [2]. OPN expression is upregulated
by proinflammatory cytokines such as tumor necrosis factor-a(TNF-a) and transforming growth factor-b (TGF-b), as well as by
hypoxia and hyperglycemia [2]. OPN binds to integrin receptors
and CD44 mediating cell-matrix and cell-cell interactions [3].
Besides its function as a key molecule regulating bone mineral-
ization [4], OPN is also involved in the immune and inflammatory
responses, playing an active role in the development of cardio-
vascular disease, diabetes, fatty liver disease and cancer [2,3,5].
We have previously shown that OPN is produced by adipose
tissue and that OPN expression is dramatically increased in
visceral adipose tissue in obesity [6,7]. Subsequently, others have
confirmed our findings showing that OPN is heavily involved in
the obesity-associated proinflammatory state and insulin resistance
[8–14], although the mechanisms involved have not been fully
elucidated. Thus, the aim of our study was to analyze the effect of
the absence of OPN in the development of obesity induced by a
PLOS ONE | www.plosone.org 1 May 2014 | Volume 9 | Issue 5 | e98398

high-fat diet (HFD) in mice to unravel the potential mechanisms
involved. Herein we report that mice lacking OPN are protected
against the development of diet-induced obesity through mecha-
nisms involving impairment of adipose tissue extracellular matrix
remodeling, reduction in fibrosis and inflammation in adipose
tissue and liver, and improvement in brown adipose tissue (BAT)
function.
Materials and Methods
Ethics StatementThis study was carried out in strict accordance with the
European Guidelines for the Care and Use of Laboratory Animals
and was approved by the Ethical Committee for Animal
Experimentation of the University of Navarra (071/07).
Animals and treatmentTen-week old male wild type (C57BL/6J) (n = 18) and OPN-
knockout [Opn-/-(B6.Cg-Spp1tm1blh/J (The Jackson Laboratory)]
(n = 18) were housed with controlled temperature (2262uC),
relative humidity (50%) and lighting (12:12 h cycle of light-
darkness, lights on at 08:00 am). Half of the animals were fed for
20 weeks with a commercial HFD [fat (60%), 23 kJ/g, Product #F3282, BioServe] and the other half with a chow diet [fat (13%),
12 kJ/g, 2014 Teklad diet, Harland Laboratories] [15]. The body
weight of the animals and the amount of food eaten were
registered every 3 days. Mice were sacrificed by CO2 inhalation
after 6 h of fasting following the 20 week experimental period.
After sacrifice, blood was obtained by cardiac puncture, body
weight was recorded and white adipose tissue from different depots
(epididymal, perirenal and subcutaneous) carefully dissected and
weighed together with that of other organs. Serum and tissues
were frozen at 280uC for subsequent experiments.
Body temperatureBody temperature was determined at the end of the study by
measuring the rectal temperature using a thermoprobe (YSI 4600
Thermometers, Yellow Springs Instruments).
Intraperitoneal glucose tolerance tests andintraperitoneal insulin tolerance tests
The animals were fasted overnight prior to the tests. At 10:00
am glucose was measured at baseline in blood taken from the tail.
Mice given 2 g of glucose/kg body weight (intraperitoneal glucose
tolerance tests-IPGTT) or 75 of U insulin/kg body weight
(intraperitoneal insulin tolerance tests-IPITT). Blood glucose was
measured at 15, 30, 60 and 120 min.
Blood analysisSerum glucose concentrations were measured using a sensitive-
automatic glucose sensor (Ascensia Elite, Bayer). Concentrations of
triglycerides, total cholesterol (Infinity, Thermo Electron), free
fatty acids (FFA) (WAKO Chemicals) and glycerol (Sigma) were
measured by enzymatic methods using commercially available kits.
Insulin and leptin were determined using mouse enzyme
immunoassay ELISA kits (Crystal Chem) [16]. Insulin resistance
was calculated using the HOMA index. Adiponectin (BioVendor),
testosterone (R&D Systems), osteopontin (R&D Systems), resistin
(Immuno-Biological Laboratories), corticosterone (Immuno-Bio-
logical Laboratories), ghrelin (Linco) and SAA (Biosource)
concentrations were assessed using ELISA kits. Intra- and inter-
assay coefficients of variation for measurements of the ELISA kits
ranged between 2.6–4.2% for the former, and 5.3–8.1%, for the
latter.
Thiobarbituric acid reactive substancesDetermination of lipid peroxidation was measured as previously
described [17]. We used serum MDA levels as an indicator of lipid
peroxidation and oxidative stress. Briefly, 5 mL of serum or
standard (MDA) were mixed with 120 mL of diethyl thiobarbituric
acid (DETBA) 10 mmol/L and then vortexed and incubated for
1 h at 95 uC. Vials were cooled 5 min at room temperature (RT)
and 360 mL of n-butanol were added to DETBA-MDA adducts.
Samples were shaken with vortex for 1 min and centrifuged for
10 min at 1,600 g at RT. Then, 250 mL of supernatant were
read on 96-well plates on a Fluroskan Ascent (Thermo Lab-
systems) with 535 nm and 590 nm excitation and emission
wavelength, respectively.
RNA extraction and microarray experiments and analysisRNA isolation from liver and adipose tissue was performed by
homogenization with an ULTRA-TURRAX T 25 basic (IKA
Werke GmbH) using respectively TRIzol (Invitrogen) and QIAzol
Reagent (Qiagen). Samples were purified with the RNeasy Mini
Kit and RNeasy Lipid Tissue Mini Kit (Qiagen) and treated with
DNase I (RNase-free DNase Set, Qiagen) in order to remove any
trace of genomic DNA. For first strand cDNA synthesis constant
amounts of 2 mg of total RNA were reverse transcribed in a final
volume of 40 mL using random hexamers (Roche) as primers and
400 units of M-MLV reverse transcriptase (Invitrogen) as
previously described [18].
Gene expression profile analyses were performed using the
Agilent Whole Mouse Genome array (G4121B, Agilent Technol-
ogies) as previously described [18,19]. Five animals were used per
group. Slides were scanned with a GenePix 4100A scanner (Axon
Instruments) and images and data were analyzed using GenePiX
Pro 6.0 and GeneSpring GX software v 7.3.1 (Agilent),
respectively. Functional annotation networks were generated using
the Ingenuity Pathway Analysis (IPA, Ingenuity Systems).
Real-Time PCRRNA was extracted as described above and transcript levels
were quantified by Real-Time PCR (7300 Real Time PCR
System, Applied Biosystem). Primers and probes (Table S1) were
designed using the software Primer Express 2.0 (Applied
Biosystems) and purchased from Genosys (Sigma). Primers or
TaqMan probes covering fragments of the areas from the
extremes of two exons were designed to ensure the detection of
the corresponding transcript preventing genomic DNA amplifica-
tion. The cDNA was amplified at the following conditions: 95uCfor 10 min, followed by 45 cycles of 15 s at 95 uC and 1 min at 59
uC, using the TaqMan Universal PCR Master Mix (Applied
Biosystems). The primer and probe concentrations for gene
amplification were 300 and 200 nmol/L, respectively. The results
were normalized to the levels of the 18S rRNA (Applied
Biosystems) and relative quantification was calculated using the
DDCt formula [6,20]. Relative mRNA expression was expressed as
fold expression over the calibrator sample (average of gene
expression corresponding to the wild type group). All samples were
run in triplicate and the average values were calculated.
Western blotSamples of epididymal white adipose tissue (EWAT) and liver
were homogenized in RIPA buffer [1 mol/L Tris-HCl pH 7.40,
150 mmol/L NaCl, 1% Triton X-100, 0.1% sodium dodecyl
Lack of OPN Prevents Obesity and Fatty Liver
PLOS ONE | www.plosone.org 2 May 2014 | Volume 9 | Issue 5 | e98398

Figure 1. OPN-Deficiency prevents HFD-induced increase in body weight and adipose tissue mass. (A) Body weight evolution of thedifferent experimental groups and weight gain of the animals from the different experimental groups after 20 weeks under CD or HFD. The arrowindicates the start of the HFD. *P,0.05, **P,0.01 and ***P,0.001 WT-CD vs WT-HFD. "P,0.05, ""P,0.01 and """P,0.001 WT-HFD vs OPN-HFD.Mean 6 SEM of 8–10 animals. (B) Cumulative food intake expressed as weight of food (g) or total energy (kcal) during the 20-week experimentalperiod. Mean 6 SEM of 8–10 animals. (C) Adipose mass (sum of epididymal, perirenal and subcutaneous depots) of the animals from the different
Lack of OPN Prevents Obesity and Fatty Liver
PLOS ONE | www.plosone.org 3 May 2014 | Volume 9 | Issue 5 | e98398

sulphate (SDS), 5 mmol/L EDTA 2H2O, 1% deoxycolate] and
supplemented with protein inhibitors (CompleteTM Mini-EDTA
free, Roche). The soluble proteins were extracted after centrifu-
gation at 16,000 g for 15 min at 4 uC. The protein concentration
was determined by the method of Bradford using bovine serum
albumin (BSA) (Sigma) as standard. Equal amounts of protein
(30 mg) were run out in 12% SDS-PAGE, subsequently transferred
to nitrocellulose membranes (Bio-Rad Laboratories) and blocked
in Tris-buffered saline (10 mmol/L Tris-HCl, 150 mmol/L NaCl,
pH 8.00) with 0.05% Tween 20 (TBS-T) containing 5% non-fat
dry milk for 1 h at RT. Blots were then incubated overnight at 4
uC with primary antibodies against AKT1-p (Ser473), AKT1
(Upstate), AMPK-p (Thr172), AMPK, ACC-p (Ser79), ACC,
FAS, ATGL (Cell Signaling), HSL-p (Ser554), HSL, MMP2,
MMP9, NOX2, ANXA2, UCP3, UCP1 (Abcam), UCP2 (Milli-
pore) and AQP7 (Santa Cruz Biotechnology). Anti b-actin
antibody (Sigma) was used for the normalization of density values.
The antigen-antibody complexes were visualized using horseradish
peroxidase-conjugated anti-goat (Zymed), anti-rabbit or anti-
mouse IgG antibodies (Amersham Biosciences) and the enhanced
chemiluminescence ECL detection system (Amersham bioscienc-
es). The intensity of the bands was determined by densitometric
analysis with the Gel DocTM gel documentation system and the
Quantity One 4.5.0 software (Bio-Rad).
Gelatin zymographyMMP2 and MMP9 gelatinolytic activities were measured as
previously described [21]. Briefly, protein extracts of 15 mg from
each sample were run in 10% SDS-PAGE containing 0.1% gelatin
(Sigma). After the electrophoresis, gels were washed in 2.5%
Triton X-100 (Sigma) for 45 min and subsequently incubated
overnight at 37 uC in enzyme development buffer (Invitrogen).
After incubation, gels were fixed in 50% (v/v), methanol and 7%
(v/v) acetic acid (Sigma) for 15 min and then stained for 1 h in
GelCode Blue Stain Reagent (Pierce). Finally, the gels were
cleared in distilled water. Mmp-9 and Mmp-2 complex were
identified based on their molecular weight and Quantity One (Bio-
Rad) was used for densitometric analysis of the zymographic
activities.
Histological analysisEWAT (6 mm), BAT (6 mm) or liver (4 mm) sections of tissue
previously fixed in formalin and embedded in paraffin, were
deparaffinized with xylene and hydrated with decreasing concen-
trations of ethanol. Samples were stained with hematoxylin-eosin
or Sirius red. The sections were dehydrated with increasing
concentrations of ethanol and xylene, mounted in DePex
(Panreac) and observed with an optical microscope (Axiovert 40
CFL, Zeiss). The size of adipocytes and lipid droplets was
determined by analyzing the cross-sectional area of white and
brown adipose tissue with the software AxioVision 4.6 (Zeiss).
Images of five fields per section from each animal were captured
with a 200X magnification, and the adipocyte cell surface areas
(H/E) from, at least, 100 cells/section or fibrotic streaks (Sirius
red) were measured.
experimental groups after 20 weeks under CD or HFD. Mean 6 SEM of 8–10 animals. (D) Representative images of histological sectionscorresponding to EWAT from mice of different groups. The sections were stained with hematoxylin-eosin (H–E). Magnification 200X. Scale bar,100 mm. (E) Cell surface area and distribution by areas of adipocytes in EWAT determined in histological sections of the different experimental groupsafter 20 weeks under the CD or HFD. Mean 6 SEM of 5 animals. Statistical differences were determined by two-way ANOVA, aP,0.05, effect of OPNdeficiency; bP,0.05 effect of diet. If an interaction was detected one-way ANOVA followed by Tukey’s HSD test was performed, *P,0.05, **P,0.01and ***P,0.001.doi:10.1371/journal.pone.0098398.g001
Table 1. Metabolic Characteristics of Experimental Animals.
Chow diet High-fat diet
WT OPN-KO WT OPN-KO
Glucose (mg/dL) b, c 130611 175618 243612***,{ 215617**
Insulin (ng/mL) a, b, c 0.5860.04 0.6360.15 3.9460.43***,{{{ 1.8060.39```
HOMA a, b, c 4.460.4 7.262.2 58.568.9***,{{{ 25.567.0``
Glycerol (mg/dL) b, c 0.03660.002 0.03860.003 0.04660.002*** 0.03860.002`
FFA (mmol/L) a 0.6860.06 0.6260.03 0.6460.02 0.5160.03
TG (mg/dL) b 10366 96610 9263 7465
Cholesterol (mg/dL) a, b, c 13063 11467 22266***,{{{ 153610{{,```
Leptin (ng/mL) a, b, c 3.562.4 4.865.8 35.362.0***,{{{ 19.6611.4***,{{{,```
Resistin (ng/mL) b 14.261.9 12.561.3 18.162.9 22.362.9
Adiponectin (mg/mL) a 22.061.4 17.861.1 27.461.4 17.661.6
Corticosterone (nmol/L) a, b 381631 304663 562638 347652
Testosterone (ng/mL) 0.6760.16 0.7860.20 0.9160.25 1.4260.29
Total ghrelin (ng/mL) a, b 1.6060.41 2.4260.44 0.7560.08 1.3160.19
SAA (mg/mL) 4.460.5 4.360.3 8.662.5 5.961.3
Mean 6 SEM of 8–10 animals. Statistical differences were determined by two-way ANOVA. aP,0.05, main effect of OPN-deficiency; bP,0.05, main effect of diet; cP,0.05,interaction between factors. When interaction was detected, data were analyzed by one-way ANOVA followed by Tukey’s HSD test. **P,0.01 and ***P,0.001 vs WT onCD; {P,0.05 and {{{P,0.001 vs OPN-KO on a CD; `P,0.05, ``P,0.01 and ``` P,0.001 vs WT on HFD.doi:10.1371/journal.pone.0098398.t001
Lack of OPN Prevents Obesity and Fatty Liver
PLOS ONE | www.plosone.org 4 May 2014 | Volume 9 | Issue 5 | e98398

ImmunohistochemistrySections of formalin-fixed paraffin-embedded EWAT (6 mm) or
liver (4 mm) were dewaxed with xylene and hydrated in decreasing
concentrations of ethanol. Endogen peroxidase activity was
quenched using 3% H2O2 (Sigma) in absolute methanol for
20 min at RT, and washed 3 times with ethanol. Sections were
immersed in 10 mmol/L citrate buffer (pH 6.00) and heated using
a microwave oven at 800 W for 10 min to enhance antigen
retrieval. After cooling, sections were blocked for 1 h at RT in a
humidified chamber with 5% goat serum (Sigma) in TBS. Sections
were subsequently incubated with rat anti-mouse F4/80 antibody
(AbD serotec) at a dilution of 1:100 (EWAT) or 1:50 (liver) in TBS
with 2% goat serum (Sigma) in a humidified chamber overnight at
4 uC. After washing with TBS (365 min), sections were incubated
Figure 2. OPN-deficiency decreases MMP2 and MMP9 activity in adipose tissue. (A) Heat map showing changes in expression of selectedgenes in EWAT. Red and green colors represent up- and down-regulated expression, respectively on a log2 scale. (B) Gene expression levels of Mmp2and Mmp9 in EWAT. (C) Protein expression levels of MMP2 and MMP9 in EWAT. (D) Zymography analysis of MMP2 and MMP9 activity in EWAT after 20weeks of exposure to the chow diet or HFD. Mean 6 SEM of 8–10 animals. Statistical differences were determined by two-way ANOVA, bP,0.05 effectof diet. If an interaction was detected one-way ANOVA followed by Tukey’s HSD test was performed, *P,0.05, **P,0.01 and ***P,0.001.doi:10.1371/journal.pone.0098398.g002
Lack of OPN Prevents Obesity and Fatty Liver
PLOS ONE | www.plosone.org 5 May 2014 | Volume 9 | Issue 5 | e98398
with horseradish peroxidase-conjugated secondary anti-rat anti-
body (1:200) (Amersham Biosciences) diluted in TBS with 2% goat
serum for 1 h at RT. After washing with TBS (365 min),
localization of the antigen-antibody complexes was performed by
adding diaminobenzidine (DAB) (Amersham Biosciences). Nega-
tive control slides with omission of the primary antibodies were
included in the immunostaining procedure. The reaction was
stopped and contrasted with Harris hematoxylin solution (Sigma).
Sections were dehydrated with increasing concentrations of
ethanol and xylol, mounted in DePeX and observed with an
optical microscope (Axiovert 40 CFL). The quantification of F4/
80 positive cells in EWAT and liver, and crown-like structures
(CLS) in EWAT content in 5 samples/group were analyzed using
a double-blind protocol. The total number of F4/80 expressing
cells and the total number of cells were counted in 5 slides (original
magnification 6200 in EWAT and 6100 in liver) of each sample
using the image analysis program AxioVision 4.6. The number of
macrophages and total cells in each sample provided the
percentage of F4/80 positive cells for each section analyzed.
Intrahepatic lipid contentThe hepatic triglyceride content was measured by enzymatic
methods, in accordance with previously published procedures
[22]. Briefly, tissues were homogenized and diluted in saline at a
final concentration of 50 mg/mL. Homogenates were diluted (1:1)
in 1% deoxycholate (Sigma) and incubated at 37 uC for 5 min. For
triglyceride measurements, samples were diluted 1:100 in the
reagent (Infinity Triglycerides Liquid Stable Reagent, Thermo
Electron) and incubated for 30 min at 37 uC. The resulting dye
was measured based on its absorbance at 550 nm with a Sunrise
ELISA plate reader (Tecan). Concentrations were determined
compared with a standard curve of triglycerides (Infinity
Triglycerides Standard, Thermo Electron). The protein content
of the preparations was measured by the Bradford method, using
BSA (Sigma) as standard. All assays were performed in duplicate.
Statistical analysisData are presented as mean 6 SEM. The analysis of differences
between experimental groups was performed by two-way ANOVA
(genotype x diet) or by one-way ANOVA followed by Tukey HSD
post-hoc tests, where appropriate. Statistical comparisons for
microarray data to identify differentially expressed genes across
different groups were performed using two-way ANOVA. The
calculations were performed using the SPSS statistical package for
Windows version 15.0.1 (SPSS). A P value less than 0.05 was
considered statistically significant.
Results
OPN-deletion prevents HFD-induced increase in bodyweight and adipose tissue mass
OPN-KO mice showed significant differences compared with
WT mice in body weight since the ninth week under the HFD.
Weight gain during the 20 weeks under the HFD was significantly
lower in OPN-KO mice (Fig. 1A). OPN-deficiency influenced the
weight of most of the studied organs (Table S2). Interestingly,
OPN-KO mice exhibited a significantly higher food intake than
WT mice reported either as weight of food eaten or amount of
energy (Fig. 1B).
Serum and mRNA levels of OPN (Spp1) were, as expected,
undetectable in KO animals. No differences in serum OPN
concentrations in WT mice exposed to HFD were observed.
However, mRNA expression of Spp1 was significantly increased in
EWAT and liver (30- and 1.7-fold, respectively) from WT mice
exposed to HFD. Transcript levels of the OPN receptor Cd44
increased after the HFD in adipose tissue and liver, but remained
at normal levels in OPN-KO mice (Fig. S1).
Adipose mass (sum of epididymal, perirenal and subcutaneous
depots) was significantly lower in OPN-KO mice than in WT mice
with HFD (Fig. 1C). Furthermore, the EWAT adipocyte size was
significantly lower in animals lacking OPN than in WT mice
under HFD, which exhibited a lower percentage of large
adipocytes than WT mice (Fig. 1D–E). Exposure to the HFD
resulted in increased serum levels of leptin and corticosterone,
which were significantly reduced in mice lacking OPN (Table 1).
These results evidence that OPN is necessary for HFD-induced
adipose tissue expansion.
HFD and OPN-deficiency did not cause any disturbance in the
amount of proteins involved in lipogenesis or lipolysis, nor in Pparg
expression (Fig. S2A–G). We conclude that the changes observed
in adipose mass are unlikely to be related with alterations in
lipolysis or lipogenesis.
Lack of OPN improves insulin sensitivity in mice fed withHFD
HFD resulted in increased serum levels of glucose, insulin and
HOMA, which were significantly reduced in mice lacking OPN
(Table 1). The IPGTT showed that mice under the HFD exhibited
increased blood glucose levels, but no differences were detected by
the lack of OPN. However, the IPITT showed that WT mice
subjected to HFD had increased blood glucose levels while glucose
concentrations of OPN-KO mice remained similar to the levels of
WT mice (Fig. S3A–B).
Microarray gene expression profiling of EWAT, showed that
OPN-deficiency prevented the HFD-induced decrease in mRNA
levels of Slc2a4 (GLUT4) and Slc2a12 (GLUT12) (Fig. 2A and
Table S3), which could be related to the improvement of glucose
metabolism. To analyze the implication of skeletal muscle in the
improvement of insulin sensitivity by the lack of OPN, gene
expression levels of Irs1, Irs2, Slc2a4 and Ucp3 in gastrocnemius
muscle were evaluated. Slc2a4 levels decreased with HFD, but no
other changes due to diet or the absence of OPN were observed
(Fig. S3C–F).
OPN-deletion decreases MMP2 and MMP9 activity inadipose tissue
Matrix metalloproteinases (MMPs) are extracellular proteolytic
enzymes involved in adipose tissue expansion [21]. Functional
annotation network from IPA revealed an important role of
MMPs in the action of OPN in HFD-induced adipose tissue
expansion (Fig. S4). In order to assess the involvement of MMPs in
adipose tissue extracellular matrix remodeling, we studied gene
and protein expression levels as well as activity of MMP2 and
MMP9. Mmp2 mRNA increased with HFD in the WT mice while
OPN-deficiency prevented this increase (Fig. 2A–B). Protein
expression of MMP2 and MMP9 was not affected either by
HFD or OPN-deficiency (Fig. 2C). Interestingly, the gelatinase
activity of MMP2 and MMP9 was dramatically increased with
HFD, and this effect was prevented by OPN-deficiency (Fig. 2D).
These data are consistent with a deficit in extracellular matrix
remodeling in OPN-KO mice with HFD.
Lack of OPN decreases inflammation, oxidative stress andfibrosis in adipose tissue
CLS number increased with HFD, while OPN-deficiency
blunted the increase (Fig. 3A–B). The number of macrophages
in EWAT, as evidenced by the higher number of F4/80-positive
Lack of OPN Prevents Obesity and Fatty Liver
PLOS ONE | www.plosone.org 6 May 2014 | Volume 9 | Issue 5 | e98398

Lack of OPN Prevents Obesity and Fatty Liver
PLOS ONE | www.plosone.org 7 May 2014 | Volume 9 | Issue 5 | e98398

cells and Emr1 expression, increased with HFD and OPN-
deficiency partially prevented this increase (Fig. 3C–D). CD11c
(Itgax) gene expression, a marker of M1 macrophage proinflam-
matory polarization [23], increased with HFD in EWAT, a
phenomenon that was not observed with OPN-deficiency (Fig. 3D).
Moreover, Tnf mRNA increased with HFD and OPN-deficiency
prevented this increase. Il6 mRNA and serum levels of the acute-
phase reactant SAA showed the same trend, although the
differences were not significant (Fig. 3D and Table 1). Adipoq
mRNA decreased with HFD, and OPN-deficiency seemed to
prevent this effect (Fig. 3D).
We next examined the levels of oxidative stress. HFD
significantly increased serum TBARS concentrations, while
OPN-deficiency prevented this increase (Fig. 3E). Mice under
the HFD exhibited increased mRNA levels of Nox1 and Cybb and
NOX2 protein with OPN-deletion protecting against these
increments (Fig. 3F and G). The decreased number and
proinflammatory profile of macrophages, reduced expression of
proinflammatory cytokines and NADPH components as well as
lower lipid peroxidation indicate that OPN-deficiency protects
against HFD-induced adipose tissue inflammation and oxidative
stress.
Many studies have shown that obesity and diabetes are related
to fibrosis in adipose tissue and liver [24,25]. Whereas collagen
fiber staining with Sirius red in adipose tissue obtained from WT
mice with CD showed very thin collagen sheets surrounding
adipocytes, adipose tissue from WT mice with HFD contained
very pronounced fibrotic streaks among adipocytes. OPN-
deficiency reduced the thickness of the fibrotic streaks (Fig. 3H–
I). Gene expression of collagens Col1a1, Col6a1 and Col6a3 and
profibrotic cytokine Tgfb1 were increased with HFD, while OPN-
deficiency prevented this increase (Fig. 2A and 3J and Fig. S4).
The decrease of fibrotic streaks together with the decreased
expression of collagens and markers of fibrosis indicate that OPN-
deficiency protects against diet-induced fibrosis in adipose tissue.
Lack of OPN prevents HFD-induced liver lipidaccumulation
Liver weight increased with HFD and was significantly lower in
OPN-KO mice (Fig. 4A). Animals under HFD showed an altered
cell structure, characterized by the presence of macrovesicular
steatosis, whereas this effect was observed to a lesser extent in
OPN-KO mice (Fig. 4B). Analysis of intrahepatic TG content
showed elevated TG levels in WT mice with HFD and that OPN-
deficiency prevented this increase (Fig. 4C). Moreover, HFD
resulted in increased serum levels of glycerol and cholesterol,
which were significantly reduced in mice lacking OPN (Table 1).
Lack of OPN was associated with a decrease in mRNA levels of
the lipogenic transcription factors Pparg and Srebf1, their down-
stream target genes involved in the synthesis of FFA (Fasn), and
TG (Mogat1 and Dgat2), the formation of lipid droplets (Cidec) as
well as in the VLDL uptake (Vldlr) (Fig. 4D–F). OPN-KO mice
also reduced HFD-induced increase in AQP7 protein, an
aquaporin involved in glycerol transport [26]. On the other hand,
protein levels of UCP2 and UCP3, involved in fatty acid fuelling
for energy expenditure, were increased with the HFD and with
UCP3 being further increased in OPN-KO mice (Fig. 4G). The
differential expression of other genes involved in lipid accumula-
tion (Anxa2, Cd36, Egfr) caused by the HFD, were prevented by
OPN-deficiency (Fig. 4D and Table S4). OPN-deficiency prevents
the accumulation of intrahepatic TG and reduces the expression of
molecules involved in the onset of liver steatosis.
OPN-deletion decreases HFD-induced liver inflammationand fibrosis
Similar to the changes observed in adipose tissue, the
macrophage number as well as F4/80 and CD11c mRNA in
the liver were increased by HFD, while OPN deficiency prevented
this increase (Fig. 5A–C). Analogously, Tnf mRNA increased with
the HFD, being normal in OPN-KO mice. Lipocalin 2 (Lcn2)
mRNA was upregulated with HFD, which was not observed in
OPN-deficient mice (Fig. 5C). Mice lacking OPN have reduced
hepatic macrophage infiltration, and Tnf and Lcn2 expression
compared to WT mice when fed a HFD. In the liver, an increase
in size or number of fibrotic streak was not evident (data not
shown). However, Col1a1, Col6a3 and Eln mRNA increased with
HFD, being normal in OPN-KO mice (Fig. 4D and 5D). a-SMA
(Acta2) mRNA and annexin 2 mRNA and protein decreased in
OPN-KO mice (Fig. 4D and 5D–E).
Lack of OPN improves BAT functionWe next examined whether BAT function may explain the
protection against HFD-induced obesity observed in OPN-KO
mice. BAT weight increased by HFD, while OPN-deficiency
partially prevented this increase (Fig. 6A). WT mice under HFD
showed an altered cellular structure of BAT, characterized by the
presence of large lipid droplets, increased number of unilocular fat
cells and lower number of multilocular adipocytes (Fig. 6B–C).
This effect was observed to a lesser extent in animals lacking OPN.
Furthermore OPN-KO mice had a higher body temperature than
their wild genotype counterparts (Fig. 6D). PRDM16, PGC1a and
UCP1 are proteins involved in BAT adipocyte differentiation and
thermogenesis regulation. Prdm16 mRNA tended to increase
(P = 0.051) in OPN-KO mice. Neither diet nor genotype affected
Ppargc1a mRNA. Ucp1 mRNA as well as UCP1 and UCP3 protein
were significantly increased by the deficiency in OPN (Fig. 6E–F).
OPN-KO mice with HFD have a better structure of BAT and an
increase in body temperature and thermogenic proteins compared
to WT mice.
Discussion
In this study we provide evidence that OPN plays a major role
in the adipose tissue expansion and liver steatosis that take place in
HFD-induced obesity in mice. Furthermore, lack of OPN provides
protection against inflammation, oxidative stress and fibrosis in
both organs.
Figure 3. OPN-deficiency decreases inflammation, oxidative stress and fibrosis in adipose tissue. (A) Representative immunohisto-chemical staining of EWAT against the specific macrophage marker F4/80. Magnification 200X. Mean 6 SEM of 5 animals. (B) CLS content determinedby F4/80 positive staining and (C) percentage of F4/80 positive cells. Mean 6 SEM of 5 animals. (D) Gene expression levels of Emr1, Cd11c (Itgax), Tnf,Il6 and Adipoq in EWAT. Mean 6 SEM of 8–10 animals. (E–G) Oxidative stress in serum and EWAT. TBARS in serum (E), Nox1 and Nox2 (Cybb) mRNA (F)and NOX2 protein (G) in EWAT after 20 weeks under the CD or HFD. (H–J) Fibrosis in EWAT. (H) Representative images of histological sections fromEWAT stained with Sirius red. Magnification 200X. Scale bar, 100 mm. (I) Cell surface area of fibrotic streak in EWAT determined in histological sections.Mean 6 SEM of 5 animals. (J) Expression of Col1a1, Col6a1, Col6a3 and Tgfb1 mRNA, genes involved in fibrosis, in EWAT. Mean 6 SEM of 8–10 animals.Statistical differences were determined by two-way ANOVA, aP,0.05, effect of OPN deficiency; bP,0.05 effect of diet. If an interaction was detectedone-way ANOVA followed by Tukey’s HSD test was performed, ***P,0.001.doi:10.1371/journal.pone.0098398.g003
Lack of OPN Prevents Obesity and Fatty Liver
PLOS ONE | www.plosone.org 8 May 2014 | Volume 9 | Issue 5 | e98398

Figure 4. Lack of OPN prevents HFD-induced liver lipid accumulation. (A) Liver weight of the animals from the different experimentalgroups after 20 weeks of exposure to the chow diet or HFD. Mean 6 SEM of 8–10 animals. (B) Representative images of histological sections from theliver of mice of different groups. The sections were stained with H–E. Magnification 100X. Scale bar, 200 mm. (C) Triglyceride content in the liver. (D)Heat map showing changes in expression of selected genes in liver. Red and green colors represent up- and down-regulated expression, respectivelyon a log2 scale. (E and F) Expression of lipogenic genes in the liver. Pparg, Srebf1, Fasn, Dgat2 (E), Mogat1, Cidec and Vldlr (F). (G) Levels of proteinsinvolved in liver steatosis. AQP7, UCP2, and UCP3 in liver after 20 weeks of exposure to the chow diet or HFD. Mean 6 SEM of 8–10 animals. Statistical
Lack of OPN Prevents Obesity and Fatty Liver
PLOS ONE | www.plosone.org 9 May 2014 | Volume 9 | Issue 5 | e98398
Circulating OPN levels of WT mice were not changed by HFD,
which is in agreement with other reports [9,12]. Nonetheless, this
fact contrasts with data reported in obese patients [6,9,10] and
with findings observed in mice by some groups [8]. However, we
found that Spp1 mRNA expression was dramatically increased in
EWAT and liver of WT mice exposed to HFD, suggesting a more
important pathophysiological role of OPN at the autocrine/
paracrine level than systemically.
OPN binds to multiple integrin receptors and CD44, which is
one of the main OPN receptors [2]. CD44 plays a causative role in
the development of adipose tissue inflammation and insulin
resistance in mice and has been related to type 2 diabetes in
humans [27,28]. In agreement with previously published results
[28], Cd44 increased with HFD, likely aggravating the effects
triggered by OPN regarding inflammation and insulin resistance
in EWAT and liver. We expected a compensatory increase of
CD44 in OPN-KO mice, however it decreased to baseline levels
likely because OPN promotes the expression of CD44 [29].
Lack of OPN blunted the HFD-induced increase in body weight
and fat mass, despite a higher caloric intake, which agrees with
previous reports [12] but contrasts with results reported by others
[8,30]. In this sense, OPN-KO mice showed higher total ghrelin
levels and lower leptin concentrations, which could explain the
higher food intake observed, since ghrelin and leptin show
orexigenic and anorexigenic effects, respectively [31,32]. More-
over, a reduction in adipocyte size in OPN-KO mice under the
HFD was evidenced. We explored possible changes in main
proteins involved in lipogenic or lipolytic pathways to explain the
lower accumulation of adipose tissue in OPN-KO mice, but they
remained unchanged. Therefore, changes in lipolytic or lipogenic
pathways are unlikely explaining the observed effects on adipose
tissue mass.
Adipose tissue remodeling is a continuous process that is
pathologically accelerated in obesity [33]. MMP2 and MMP9
exert a pivotal role in adipose tissue remodeling that occurs during
the development of obesity [34]. Previous studies from our group
showed that gene expression of MMPs increases in obesity in
parallel with a rise in OPN expression [21]. MMP2 and MMP9
activity increased with HFD, with this effect being more evident
for MMP2, highlighting the importance of MMP2 in adipose
tissue expansion. The diet-induced MMP activity increase
occurred despite the reduction of MMP9 mRNA and the
unchanged protein expression levels. The complex regulation of
MMPs causes that levels of gene, protein and activity of MMPs,
are not always concordant [35–37]. However, OPN-deletion
prevented the increase of activity caused by HFD. It has been
reported that OPN regulates gene and protein expression of
MMP2 and MMP9 in neoplastic processes and cardiac remod-
eling [38–40]. Therefore, the decrease in adipose tissue remod-
eling via the reduction of MMPs activity may constitute a new
mechanism by which OPN-deficiency protects against adipose
tissue accretion caused by HFD.
Many studies have shown that obesity is associated with
increased oxidative stress [41]. Moreover, OPN has been related
with oxidative stress in mice and humans [42,43]. NADPH
oxidase is an enzyme that produces reactive oxygen species which
is upregulated by HFD [41]. We observed that expression of Nox1
and Cybb mRNA, and NOX2 protein levels were increased by the
HFD, while OPN-deficiency protected against this increase.
Moreover, lack of OPN prevented the increase of serum lipid
peroxidation levels caused by HFD, suggesting that OPN-
deficiency protects against systemic oxidative stress. Similar effects
have been reported to take place in the kidney of OPN-KO mice,
which are protected against aldosterone-induced oxidative stress
[43]. Our data evidence a novel mechanism by which OPN-
deletion exerts protective effects against the development of
obesity-associated oxidative stress by decreasing lipid peroxidation
and NADPH component levels.
The adipose tissue expansion that takes place in obesity is
associated with macrophage accumulation [10]. OPN represents a
potent chemoattractant and activator for macrophages [44]. Our
data show that lack of OPN partly prevented the increase of
macrophages, CLS and Tnf expression caused by HFD in EWAT,
extending previously reported data [8,45]. The decrease of Cd11c
in OPN-KO mice with HFD showed that absence of OPN
prevents the obesity-induced polarization switch of macrophages
to a M1 proinflammatory state in EWAT. These findings are
consistent with previous observations, reporting that the deletion
of CD11c causes a decrease in CLS, improving insulin sensitivity
through a decrease in inflammatory markers such as TNF-a and
IL6 [23]. Taken together, our data evidence a lower macrophage
inflammation, reduced phenotypic switch from M2 to M1
macrophages and decreased expression of proinflammatory
cytokines in the adipose tissue of OPN-KO fed a HFD.
OPN has been related to fibrosis in different tissues such as the
liver, heart, kidney and muscle [43,46,47]. Moreover, obesity has
been related to the increased expression of collagens and the
profibrotic cytokine TGF-b in adipose tissue, which has been
associated with increased fibrosis [48,49]. OPN-KO mice showed
a reduction in HFD-induced fibrotic streaks as well as a decreased
expression of collagens and Tgfb1 in EWAT, showing for the first
time that OPN-deficiency prevents the fibrosis induced by HFD in
adipose tissue. No fibrotic structures were observed in the liver,
probably due to the fact that fibrosis was still in its initial stages. In
this sense, OPN-deficiency prevented the HFD-induced increase
in extracellular matrix proteins such as Col1a1, Col6a3 and Eln.
Moreover Col6a1 and markers of liver fibrosis such as a-SMA and
annexin 2 [50] decreased by OPN-deletion regardless of diet. Our
findings suggest the OPN-deficiency may prevent liver fibrosis,
which is consistent with the observations reported by Syn and
colleagues showing that OPN drives to fibrogenesis in NASH [47].
The reduced degree of inflammation observed in EWAT and liver
of OPN-KO mice might be contributing to the lower fibrosis, since
inflammation has been reported to be involved in the development
of fibrosis in those organs [51,52].
The absence of OPN reversed HFD-induced fatty liver, as
shown by the reduction of lipogenic gene expression of Srebf1,
Mogat1 and Dgat2 and TG accumulation in the liver. Fasn
expression decreased in OPN-KO mice reflecting a reduced
synthesis of FFA. OPN-deficiency prevented the increase of Vldlr,
Cidec and Pparg caused by high-fat feeding, thus reflecting a defense
against lipid accumulation. These data are consistent with those
reported by Duval et al [53], showing that Mogat1, Vldlr and Cidec
are increased in liver of mice with a high degree of hepatic
steatosis. Reduced expression of Cidec, a protein involved in the
formation of lipid droplets, has also been shown to be related to
the protection against hepatic lipid accumulation in CD44-KO
mice [28].OPN has been previously involved in the development
of fatty liver and steatohepatitis in mice [5] and humans [54], in
parallel with an increase in lipogenic genes. In addition, UCP3
differences were determined by two-way ANOVA, aP,0.05, effect of OPN deficiency; bP,0.05 effect of diet. If an interaction was detected one-wayANOVA followed by Tukey’s HSD test was performed, {P,0.1, *P,0.05, **P,0.01 and ***P,0.001.doi:10.1371/journal.pone.0098398.g004
Lack of OPN Prevents Obesity and Fatty Liver
PLOS ONE | www.plosone.org 10 May 2014 | Volume 9 | Issue 5 | e98398

Figure 5. OPN-deficiency decreases HFD-induced liver inflammation and fibrosis. (A and B) Representative immunohistochemical stainingof liver against the specific macrophage marker F4/80. Magnification 400X. Mean 6 SEM of 5 animals. (C) Gene expression levels of Emr1, Itgax, Tnf,Il6, and Lcn2 in liver after 20 weeks under CD or HFD. (D) Expression of Col1a1, Col6a1, Col6a3, Eln, Tgfb1 and Acta2 genes involved in fibrosis and (E)Annexin 2 protein. Mean 6 SEM of 8–10 animals. Statistical differences were determined by two-way ANOVA, aP,0.05, effect of OPN deficiency; bP,0.05 effect of diet. If an interaction was detected one-way ANOVA followed by Tukey’s HSD test was performed, *P,0.05, **P,0.01 and ***P,0.001.doi:10.1371/journal.pone.0098398.g005
Lack of OPN Prevents Obesity and Fatty Liver
PLOS ONE | www.plosone.org 11 May 2014 | Volume 9 | Issue 5 | e98398
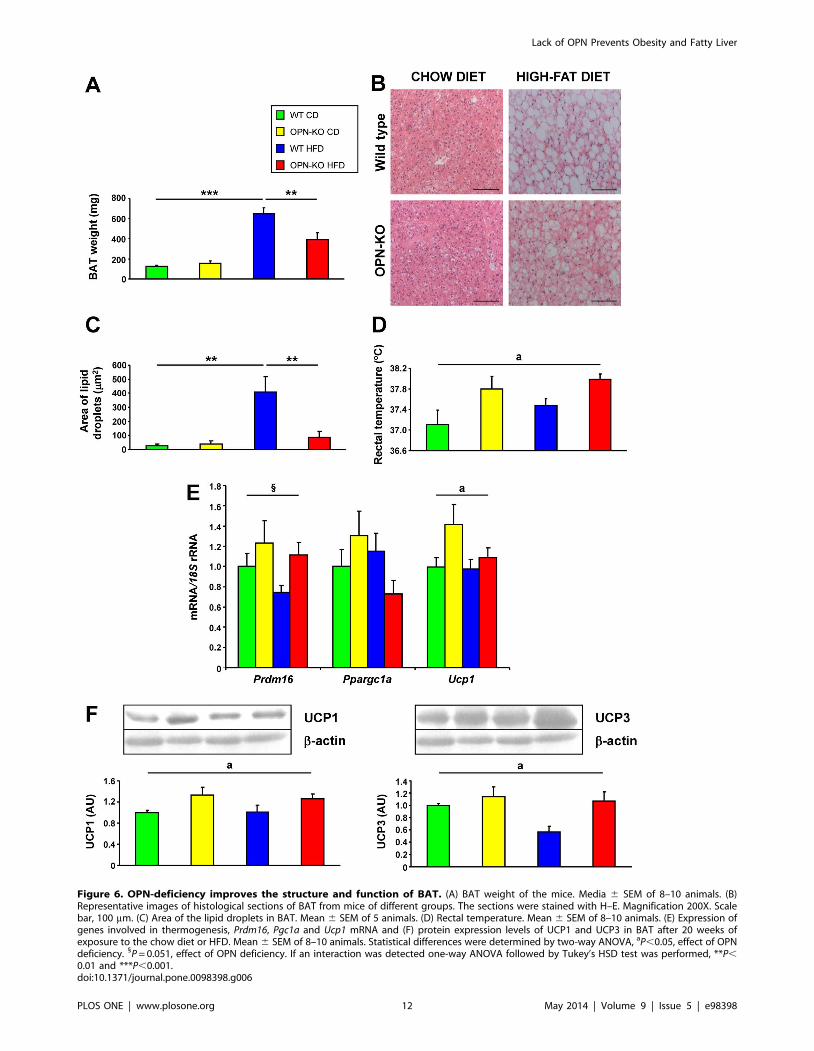
Figure 6. OPN-deficiency improves the structure and function of BAT. (A) BAT weight of the mice. Media 6 SEM of 8–10 animals. (B)Representative images of histological sections of BAT from mice of different groups. The sections were stained with H–E. Magnification 200X. Scalebar, 100 mm. (C) Area of the lipid droplets in BAT. Mean 6 SEM of 5 animals. (D) Rectal temperature. Mean 6 SEM of 8–10 animals. (E) Expression ofgenes involved in thermogenesis, Prdm16, Pgc1a and Ucp1 mRNA and (F) protein expression levels of UCP1 and UCP3 in BAT after 20 weeks ofexposure to the chow diet or HFD. Mean 6 SEM of 8–10 animals. Statistical differences were determined by two-way ANOVA, aP,0.05, effect of OPNdeficiency. 1P = 0.051, effect of OPN deficiency. If an interaction was detected one-way ANOVA followed by Tukey’s HSD test was performed, **P,0.01 and ***P,0.001.doi:10.1371/journal.pone.0098398.g006
Lack of OPN Prevents Obesity and Fatty Liver
PLOS ONE | www.plosone.org 12 May 2014 | Volume 9 | Issue 5 | e98398

protein increased with OPN-deletion, which is associated with a
higher rate of lipid catabolism. Furthermore, the membrane
protein AQP7, which correlates with hepatic steatosis [55], was
also decreased in OPN-KO mice. Accordingly, OPN-deficiency
improve shepatic steatosis induced by HFD.
Lack of OPN completely reversed the hepatic macrophage
recruitment caused by HFD. The absence of OPN prevented the
increase of Cd11c and Tnf mRNA showing that OPN-deficiency
protects against obesity-induced liver inflammation. LCN2 is an
early biomarker of liver damage and inflammation [56] related to
obesity [21]. Moreover, Lcn2-KO mice exhibit improved insulin
sensitivity [57]. Therefore, the decrease of Lcn2 mRNA in OPN-
KO mice may contribute to the reduced liver damage and
inflammation as well as to the higher insulin sensitivity in the liver
of these mice. The lower concentration of macrophages, together
with the decrease of Tnf and Lcn2 mRNA show that OPN-KO
mice exhibit a better hepatic inflammatory profile than WT mice
fed the HFD, similar to that observed in adipose tissue.
OPN-deletion protects against insulin resistance caused by
HFD, as evidenced by the improvement in insulin levels, HOMA
and IPITT. The lack of changes in Irs1, Irs2 and Slc2a4 in skeletal
muscle, suggest that changes in adipose and liver could have a
more important role in the improvement in insulin sensitivity
observed in OPN-KO mice [30].
The reduced adiposity despite the increased food intake led us
to hypothesize that OPN-KO mice exhibit an increased thermo-
genesis. In this respect, OPN-KO mice have a higher body
temperature than WT mice. In addition, absence of OPN
improved the brown-like phenotype of BAT in animals fed a
HFD, which are characterized by a ‘‘white-like’’ appearance of
brown fat. Moreover, OPN-deficient mice showed increased
UCP1 and UCP3, proton transporters from the mitochondrial
respiratory chain that generate heat by non-shivering thermogen-
esis and contribute to lower lipid accumulation in BAT as well as a
lower body weight [58,59]. Therefore, the increased body
temperature and the changes in BAT morphology and expression
of BAT-specific genes, identify the improvement of BAT function
as a potential new mechanism whereby OPN-deficiency improves
energy homeostasis.
In conclusion, OPN-deletion prevents the increase in body
weight and adipose tissue expansion, in addition to decreasing
macrophage infiltration, inflammation, oxidative stress, fibrosis
and insulin resistance. Therefore, our results suggest that OPN
could be an attractive target for the treatment of obesity and
associated pathologies.
Supporting Information
Figure S1 HFD increases the expression of Opn andCd44 in EWAT and liver of WT mice. (A) Circulating levels of
OPN in the experimental groups, (B) Opn and (C) Cd44 mRNA in
EWAT, (D) Opn and (E) Cd44 mRNA in liver of mice fed a CD or
a HFD for 20 weeks. Mean 6 SEM of 8–10 animals. Statistical
differences were determined by Student’s t test or two-way
ANOVA as appropriate. If an interaction in the two-way ANOVA
was detected, one-way ANOVA followed by Tukey’s HSD test
was performed. *P,0.05 and ***P,0.001.
(TIF)
Figure S2 The expression of proteins involved inlipogenesis and lipolysis is not modified by OPN-deletion. Protein kinase B (AKT1), 59 AMP-activated protein
kinase (AMPK), acetyl-coA carboxylase (ACC) and fatty acid
synthase (FAS), involved in lipogenesis, and adipose triglyceride
lipase (ATGL) and hormone-sensitive lipase (HSL), involved in
lipolysis were analyzed in order to explore whether the changes
observed in adipose mass were due to alterations in either lipolysis
or lipogenesis. (A) Active AKT1 (ratio AKT1-P/AKT1), (B) active
AMPK (ratio AMPK-P/AMPK), (C) active ACC (ratio ACC/
ACC-P), (D) total amount of ATGL protein, (E) total amount of
FAS protein, (F) active HSL (ratio HSL/HSL-P) and (G) Pparg
mRNA in EWAT after 20 weeks under the CD or HFD. Mean 6
SEM of 8-10 animals. Statistical differences were determined by
two-way ANOVA, bP,0.05 effect of diet.
(TIF)
Figure S3 Lack of OPN improves insulin sensitivity inmice fed a HFD. (A) Serum glucose during intraperitoneal
glucose tolerance test (IPGTT) and area under the curve (AUC) of
the IPGTT, (B) serum glucose during intraperitoneal insulin
tolerance test (IPITT) and AUC of the IPITT in animals of
different experimental groups. Mean 6 SEM of 5-6 animals.
Statistical differences were determined by two-way ANOVA. bP,
0.05 effect of diet. If an interaction was detected, one-way
ANOVA followed by Tukey’s HSD test was performed. *P,0.05.
"P,0.05 WT CD vs WT HFD; #P,0.05 WT HFD vs OPN
HFD. Gene expression levels of (C) Irs1, (D) Irs2, (E) Slc2a4 and (F)
Ucp3 in gastrocnemius muscle of mice after 20 weeks of exposure
to a CD or HFD. Mean 6 SEM of 8-10 animals. Data were
analyzed by two-way ANOVA, bP,0.05 effect of diet.
(TIF)
Figure S4 Functional annotation network from IPA(Ingenuity Pathway Analysis) reveals an important roleof MMPs and collagens in OPN’s effect on HFD-inducedadipose tissue expansion. Colored genes are differentially
expressed by OPN deletion in mice exposed to HFD. Green stands
for those genes decreased with the lack of OPN while red reflects
those genes increased with OPN deletion.
(TIF)
Table S1 Sequences of the primers and probes used inthe Real-Time PCR experiments.
(PDF)
Table S2 Sequences of the primers and probes used inthe Real-Time PCR experiments.
(PDF)
Table S3 Selected genes differentially expressed inEWAT.
(PDF)
Table S4 Selected genes differentially expressed in theliver.
(PDF)
Acknowledgments
The authors thank Vıctor Segura from the Unidad de Bioinformatica
(CIMA, University of Navarra) for help with microarray analysis, and all
the staff of the CIFA animal housing facilities.
Author Contributions
Conceived and designed the experiments: GF JGA. Performed the
experiments: AL AR VC SB NS BR MAB JGA. Analyzed the data: AL
JS GF JGA. Contributed reagents/materials/analysis tools: AR VC GF
JGA. Contributed to the writing of the manuscript: AL AR VC GF JGA.
Approved the final version of the manuscript: AL AR VC SB NS BR MAB
JS GF JGA.
Lack of OPN Prevents Obesity and Fatty Liver
PLOS ONE | www.plosone.org 13 May 2014 | Volume 9 | Issue 5 | e98398

References
1. Berrington de Gonzalez A, Hartge P, Cerhan JR, Flint AJ, Hannan L, et al.
(2010) Body-mass index and mortality among 1.46 million white adults.N Engl J Med 363: 2211–2219.
2. Scatena M, Liaw L, Giachelli CM (2007) Osteopontin. A multifunctional
molecule regulating chronic inflammation and vascular disease. Arterioscler
Thromb Vasc Biol 27: 2302–2309.
3. Denhardt DT, Noda M, O’Regan AW, Pavlin D, Berman JS (2001)
Osteopontin as a means to cope with environmental insults: regulation of
inflammation, tissue remodeling, and cell survival. J Clin Invest 107: 1055–1061.
4. Gerstenfeld LC (1999) Osteopontin in skeletal tissue homeostasis: An emerging
picture of the autocrine/paracrine functions of the extracellular matrix. J Bone
Miner Res 14: 850–855.
5. Sahai A, Malladi P, Melin-Aldana H, Green RM, Whitington PF (2004)
Upregulation of osteopontin expression is involved in the development of
nonalcoholic steatohepatitis in a dietary murine model. Am J Physiol Gastro-intest Liver Physiol 287: G264–273.
6. Gomez-Ambrosi J, Catalan V, Ramırez B, Rodrıguez A, Colina I, et al. (2007)
Plasma osteopontin levels and expression in adipose tissue are increased inobesity. J Clin Endocrinol Metab 92: 3719–3727.
7. Gomez-Ambrosi J, Rodrıguez A, Catalan V, Fruhbeck G (2008) The bone-
adipose axis in obesity and weight loss. Obes Surg 18: 1134–1143.
8. Nomiyama T, Perez-Tilve D, Ogawa D, Gizard F, Zhao Y, et al. (2007)
Osteopontin mediates obesity-induced adipose tissue macrophage infiltration
and insulin resistance in mice. J Clin Invest 117: 2877–2888.
9. Kiefer FW, Zeyda M, Todoric J, Huber J, Geyeregger R, et al. (2008)
Osteopontin expression in human and murine obesity: extensive local
upregulation in adipose tissue but minimal systemic alterations. Endocrinology149: 1350–1357.
10. Bertola A, Deveaux V, Bonnafous S, Rousseau D, Anty R, et al. (2009) Elevated
expression of osteopontin may be related to adipose tissue macrophage
accumulation and liver steatosis in morbid obesity. Diabetes 58: 125–133.
11. Kiefer FW, Zeyda M, Gollinger K, Pfau B, Neuhofer A, et al. (2010)
Neutralization of osteopontin inhibits obesity-induced inflammation and insulin
resistance. Diabetes 59: 935–946.
12. Chapman J, Miles PD, Ofrecio JM, Neels JG, Yu JG, et al. (2010) Osteopontin is
required for the early onset of high fat diet-induced insulin resistance in mice.
PLoS ONE 5: e13959.
13. Lancha A, Fruhbeck G, Gomez-Ambrosi J (2012) Peripheral signalling involved
in energy homeostasis control. Nutr Res Rev 25: 223–248.
14. Aouadi M, Tencerova M, Vangala P, Yawe JC, Nicoloro SM, et al. (2013) Genesilencing in adipose tissue macrophages regulates whole-body metabolism in
obese mice. Proc Natl Acad Sci U S A 110: 8278–8283.
15. Fruhbeck G, Alonso R, Marzo F, Santidrian S (1995) A modified method for theindirect quantitative analysis of phytate in foodstuffs. Anal Biochem 225: 206–
212.
16. Muruzabal FJ, Fruhbeck G, Gomez-Ambrosi J, Archanco M, Burrell MA (2002)Immunocytochemical detection of leptin in non-mammalian vertebrate
stomach. Gen Comp Endocrinol 128: 149–152.
17. Conti M, Morand PC, Levillain P, Lemonnier A (1991) Improved fluorometricdetermination of malonaldehyde. Clin Chem 37: 1273–1275.
18. Sainz N, Rodrıguez A, Catalan V, Becerril S, Ramırez B, et al. (2009) Leptin
administration favors muscle mass accretion by decreasing FoxO3a andincreasing PGC-1a in ob/ob mice. PLoS ONE 4: e6808.
19. Becerril S, Rodrıguez A, Catalan V, Sainz N, Ramırez B, et al. (2012)
Transcriptional analysis of brown adipose tissue in leptin-deficient mice lackinginducible nitric oxide synthase: evidence of the role of Med1 in energy balance.
Physiol Genomics 44: 678–688.
20. Catalan V, Gomez-Ambrosi J, Rotellar F, Silva C, Rodrıguez A, et al. (2007)Validation of endogenous control genes in human adipose tissue: relevance to
obesity and obesity-associated type 2 diabetes mellitus. Horm Metab Res 39:
495–500.
21. Catalan V, Gomez-Ambrosi J, Rodrıguez A, Ramırez B, Silva C, et al. (2009)
Increased adipose tissue expression of lipocalin-2 in obesity is related to
inflammation and matrix metalloproteinase-2 and -9 activity in humans. J Mol
Med 87: 803–813.
22. Miao B, Zondlo S, Gibbs S, Cromley D, Hosagrahara VP, et al. (2004) Raising
HDL cholesterol without inducing hepatic steatosis and hypertriglyceridemia by
a selective LXR modulator. J Lipid Res 45: 1410–1417.
23. Patsouris D, Li PP, Thapar D, Chapman J, Olefsky JM, et al. (2008) Ablation of
CD11c-positive cells normalizes insulin sensitivity in obese insulin resistant
animals. Cell Metab 8: 301–309.
24. Divoux A, Tordjman J, Lacasa D, Veyrie N, Hugol D, et al. (2010) Fibrosis in
human adipose tissue: composition, distribution, and link with lipid metabolism
and fat mass loss. Diabetes 59: 2817–2825.
25. Lo L, McLennan SV, Williams PF, Bonner J, Chowdhury S, et al. (2011)
Diabetes is a progression factor for hepatic fibrosis in a high fat fed mouse
obesity model of non-alcoholic steatohepatitis. J Hepatol 55: 435–444.
26. Fruhbeck G (2005) Obesity: Aquaporin enters the picture. Nature 438: 436–437.
27. Kodama K, Horikoshi M, Toda K, Yamada S, Hara K, et al. (2012) Expression-
based genome-wide association study links the receptor CD44 in adipose tissuewith type 2 diabetes. Proc Natl Acad Sci U S A 109: 7049–7054.
28. Kang HS, Liao G, Degraff LM, Gerrish K, Bortner CD, et al. (2013) CD44plays a critical role in regulating diet-induced adipose inflammation, hepatic
steatosis, and insulin resistance. PLoS ONE 8: e58417.
29. Rittling SR (2011) Osteopontin in macrophage function. Expert Rev Mol Med
13: e15.
30. Kiefer FW, Neschen S, Pfau B, Legerer B, Neuhofer A, et al. (2011) Osteopontin
deficiency protects against obesity-induced hepatic steatosis and attenuatesglucose production in mice. Diabetologia 54: 2132–2142.
31. Rodrıguez A, Gomez-Ambrosi J, Catalan V, Gil MJ, Becerril S, et al. (2009)
Acylated and desacyl ghrelin stimulate lipid accumulation in human visceraladipocytes. Int J Obes 33: 541–552.
32. Sainz N, Rodrıguez A, Catalan V, Becerril S, Ramırez B, et al. (2012) Leptinreduces the expression and increases the phosphorylation of the negative
regulators of GLUT4 Traffic TBC1D1 and TBC1D4 in muscle of ob/ob mice.PLoS ONE 7: e29389.
33. Sun K, Kusminski CM, Scherer PE (2011) Adipose tissue remodeling andobesity. J Clin Invest 121: 2094–2101.
34. Bouloumie A, Sengenes C, Portolan G, Galitzky J, Lafontan M (2001) Adipocyte
produces matrix metalloproteinases 2 and 9: involvement in adipose differen-tiation. Diabetes 50: 2080–2086.
35. Bourboulia D, Stetler-Stevenson WG (2010) Matrix metalloproteinases (MMPs)and tissue inhibitors of metalloproteinases (TIMPs): Positive and negative
regulators in tumor cell adhesion. Semin Cancer Biol 20: 161–168.
36. Hadler-Olsen E, Fadnes B, Sylte I, Uhlin-Hansen L, Winberg JO (2011)
Regulation of matrix metalloproteinase activity in health and disease. FEBS J278: 28–45.
37. Hopps E, Caimi G (2012) Matrix metalloproteinases in metabolic syndrome.
Eur J Intern Med 23: 99–104.
38. Liu H, Chen A, Guo F, Yuan L (2010) A short-hairpin RNA targeting
osteopontin downregulates MMP-2 and MMP-9 expressions in prostate cancerPC-3 cells. Cancer Lett 295: 27–37.
39. Bruemmer D, Collins AR, Noh G, Wang W, Territo M, et al. (2003)Angiotensin II-accelerated atherosclerosis and aneurysm formation is attenuated
in osteopontin-deficient mice. J Clin Invest 112: 1318–1331.
40. Lai CF, Seshadri V, Huang K, Shao JS, Cai J, et al. (2006) An osteopontin-
NADPH oxidase signaling cascade promotes pro-matrix metalloproteinase 9activation in aortic mesenchymal cells. Circ Res 98: 1479–1489.
41. Furukawa S, Fujita T, Shimabukuro M, Iwaki M, Yamada Y, et al. (2004)
Increased oxidative stress in obesity and its impact on metabolic syndrome. J ClinInvest 114: 1752–1761.
42. Georgiadou P, Iliodromitis EK, Varounis C, Mavroidis M, Kolokathis F, et al.(2008) Relationship between plasma osteopontin and oxidative stress in patients
with coronary artery disease. Expert Opin Ther Targets 12: 917–920.
43. Irita J, Okura T, Jotoku M, Nagao T, Enomoto D, et al. (2011) Osteopontin
deficiency protects against aldosterone-induced inflammation, oxidative stress,and interstitial fibrosis in the kidney. Am J Physiol Renal Physiol 301: F833–844.
44. Zeyda M, Gollinger K, Todoric J, Kiefer FW, Keck M, et al. (2011) Osteopontin
is an activator of human adipose tissue macrophages and directly affectsadipocyte function. Endocrinology 152: 2219–2227.
45. Lee YH, Petkova AP, Granneman JG (2013) Identification of an adipogenicniche for adipose tissue remodeling and restoration. Cell Metab 18: 355–367.
46. Matsui Y, Jia N, Okamoto H, Kon S, Onozuka H, et al. (2004) Role ofosteopontin in cardiac fibrosis and remodeling in angiotensin II-induced cardiac
hypertrophy. Hypertension 43: 1195–1201.
47. Syn WK, Agboola KM, Swiderska M, Michelotti GA, Liaskou E, et al. (2012)
NKT-associated hedgehog and osteopontin drive fibrogenesis in non-alcoholic
fatty liver disease. Gut 61: 1323–1329.
48. Halberg N, Khan T, Trujillo ME, Wernstedt-Asterholm I, Attie AD, et al.
(2009) Hypoxia-inducible factor 1a induces fibrosis and insulin resistance inwhite adipose tissue. Mol Cell Biol 29: 4467–4483.
49. Khan T, Muise ES, Iyengar P, Wang ZV, Chandalia M, et al. (2009) Metabolicdysregulation and adipose tissue fibrosis: role of collagen VI. Mol Cell Biol 29:
1575–1591.
50. Zhang L, Peng X, Zhang Z, Feng Y, Jia X, et al. (2010) Subcellular proteome
analysis unraveled annexin A2 related to immune liver fibrosis. J Cell Biochem
110: 219–228.
51. Sun K, Tordjman J, Clement K, Scherer PE (2013) Fibrosis and adipose tissue
dysfunction. Cell Metab 18: 470–477.
52. Morales-Ibanez O, Domınguez M, Ki SH, Marcos M, Chaves JF, et al. (2013)
Human and experimental evidence supporting a role for osteopontin in alcoholichepatitis. Hepatology 58: 1742–1756.
53. Duval C, Thissen U, Keshtkar S, Accart B, Stienstra R, et al. (2010) Adiposetissue dysfunction signals progression of hepatic steatosis towards nonalcoholic
steatohepatitis in C57BL/6 mice. Diabetes 59: 3181–3191.
54. Lima-Cabello E, Garcia-Mediavilla MV, Miquilena-Colina ME, Vargas-
Castrillon J, Lozano-Rodriguez T, et al. (2011) Enhanced expression of pro-
inflammatory mediators and liver X-receptor-regulated lipogenic genes in non-alcoholic fatty liver disease and hepatitis C. Clin Sci 120: 239–250.
55. Rodrıguez A, Catalan V, Gomez-Ambrosi J, Garcıa-Navarro S, Rotellar F, et al.(2011) Insulin- and leptin-mediated control of aquaglyceroporins in human
adipocytes and hepatocytes is mediated via the PI3K/Akt/mTOR signalingcascade. J Clin Endocrinol Metab 96: E586–597.
Lack of OPN Prevents Obesity and Fatty Liver
PLOS ONE | www.plosone.org 14 May 2014 | Volume 9 | Issue 5 | e98398
56. Borkham-Kamphorst E, Drews F, Weiskirchen R (2011) Induction of lipocalin-2
expression in acute and chronic experimental liver injury moderated by pro-inflammatory cytokines interleukin-1b through nuclear factor-kB activation.
Liver Int 31: 656–665.
57. Law IK, Xu A, Lam KS, Berger T, Mak TW, et al. (2010) Lipocalin-2 deficiencyattenuates insulin resistance associated with aging and obesity. Diabetes 59: 872–
882.
58. Nau K, Fromme T, Meyer CW, von Praun C, Heldmaier G, et al. (2008) Brown
adipose tissue specific lack of uncoupling protein 3 is associated with impaired
cold tolerance and reduced transcript levels of metabolic genes. J Comp Physiol B
178: 269–277.
59. Fruhbeck G, Becerril S, Sainz N, Garrastachu P, Garcıa-Velloso MJ (2009)
BAT: a new target for human obesity? Trends Pharmacol Sci 30: 387–396.
Lack of OPN Prevents Obesity and Fatty Liver
PLOS ONE | www.plosone.org 15 May 2014 | Volume 9 | Issue 5 | e98398


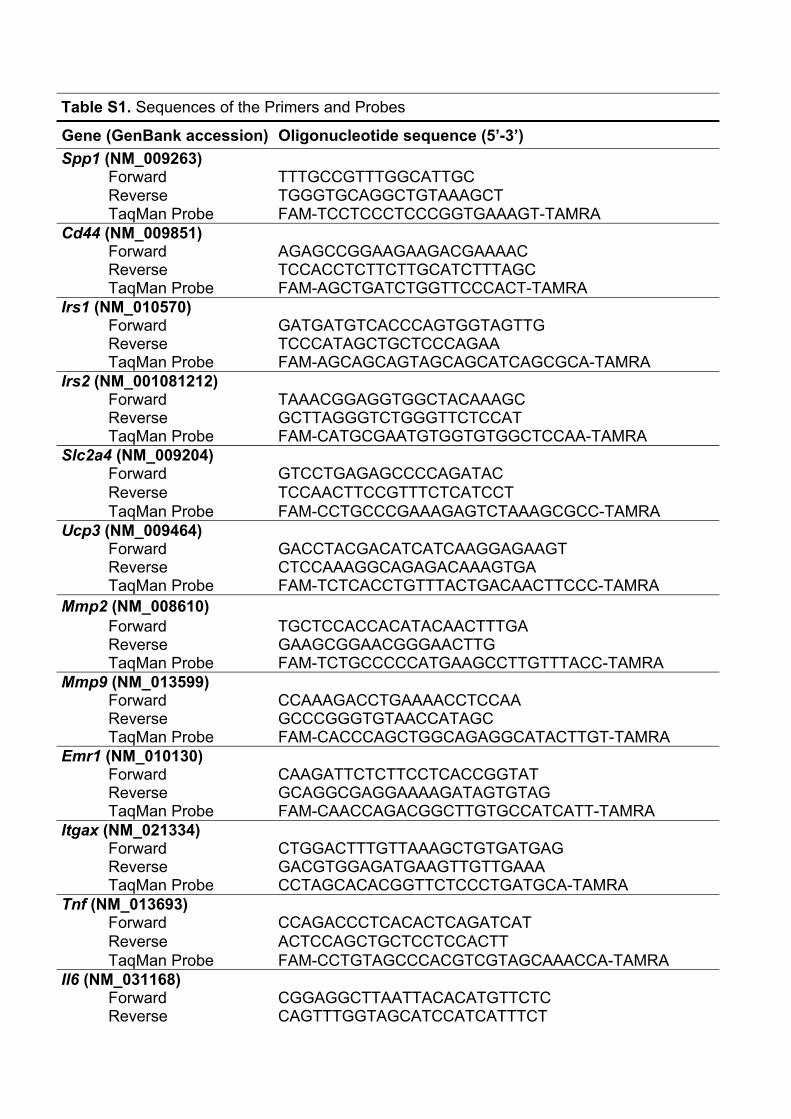
Table S1. Sequences of the Primers and Probes
Gene (GenBank accession) Oligonucleotide sequence (5’-3’) Spp1 (NM_009263)
Forward TTTGCCGTTTGGCATTGC Reverse TGGGTGCAGGCTGTAAAGCT TaqMan Probe FAM-TCCTCCCTCCCGGTGAAAGT-TAMRA
Cd44 (NM_009851) Forward AGAGCCGGAAGAAGACGAAAAC Reverse TCCACCTCTTCTTGCATCTTTAGC TaqMan Probe FAM-AGCTGATCTGGTTCCCACT-TAMRA
Irs1 (NM_010570) Forward GATGATGTCACCCAGTGGTAGTTG Reverse TCCCATAGCTGCTCCCAGAA TaqMan Probe FAM-AGCAGCAGTAGCAGCATCAGCGCA-TAMRA
Irs2 (NM_001081212) Forward TAAACGGAGGTGGCTACAAAGC Reverse GCTTAGGGTCTGGGTTCTCCAT TaqMan Probe FAM-CATGCGAATGTGGTGTGGCTCCAA-TAMRA
Slc2a4 (NM_009204) Forward GTCCTGAGAGCCCCAGATAC Reverse TCCAACTTCCGTTTCTCATCCT TaqMan Probe FAM-CCTGCCCGAAAGAGTCTAAAGCGCC-TAMRA
Ucp3 (NM_009464) Forward GACCTACGACATCATCAAGGAGAAGT Reverse CTCCAAAGGCAGAGACAAAGTGA TaqMan Probe FAM-TCTCACCTGTTTACTGACAACTTCCC-TAMRA
Mmp2 (NM_008610) Forward TGCTCCACCACATACAACTTTGA Reverse GAAGCGGAACGGGAACTTG TaqMan Probe FAM-TCTGCCCCCATGAAGCCTTGTTTACC-TAMRA
Mmp9 (NM_013599) Forward CCAAAGACCTGAAAACCTCCAA Reverse GCCCGGGTGTAACCATAGC TaqMan Probe FAM-CACCCAGCTGGCAGAGGCATACTTGT-TAMRA
Emr1 (NM_010130) Forward CAAGATTCTCTTCCTCACCGGTAT Reverse GCAGGCGAGGAAAAGATAGTGTAG TaqMan Probe FAM-CAACCAGACGGCTTGTGCCATCATT-TAMRA
Itgax (NM_021334) Forward CTGGACTTTGTTAAAGCTGTGATGAG Reverse GACGTGGAGATGAAGTTGTTGAAA TaqMan Probe CCTAGCACACGGTTCTCCCTGATGCA-TAMRA
Tnf (NM_013693) Forward CCAGACCCTCACACTCAGATCAT Reverse ACTCCAGCTGCTCCTCCACTT TaqMan Probe FAM-CCTGTAGCCCACGTCGTAGCAAACCA-TAMRA
Il6 (NM_031168) Forward CGGAGGCTTAATTACACATGTTCTC Reverse CAGTTTGGTAGCATCCATCATTTCT
TaqMan Probe FAM-CGTGGAAATGAGAAAAGAGTTGTGCAATGG-TAMRAAdipoq (NM_009605)
Forward AAGGAGATGCAGGTCTTCTTGGT Reverse CACTGAACGCTGAGCGATACAT TaqMan Probe FAM-TGGAATGACAGGAGCTGAAGGGCCA-TAMRA
Nox1 (NM_172203) Forward TTATCGCTCCCAGCAGAAGGT Reverse CATGCTAAAGCCTCGCTTCCT TaqMan Probe FAM-ATTACCAAGGTTGTCATGCACCCA-TAMRA
Cybb (NM_007807) Forward TGTGTCGAAATCTGCTCTCCTTT Reverse AAAGTGAGGTTCCTGTCCAGTTGT TaqMan Probe FAM-AGTGCGTGTTGCTCGACAAGGAT-TAMRA
Col1a1 (NM_007742) Forward TGTCCCAACCCCCAAAGAC Reverse GGTCCCTCGACTCCTACATCTTC TaqMan Probe FAM-CTGCCCGGAAGAATACGTATCACCAAACTC-TAMRA
Col6a1 (NM_009933) Forward CACCTGGGCCAGATGAGTGT Reverse CCAGCACGAAGAGGATGTCAA TaqMan Probe FAM-AAATGTGCTCCTGCTGTGA-TAMRA
Col6a3 (NM_001243008) Forward TGATGGCACCTCTCAGGACTCT Reverse TTGTCGGAGCCATCCAAAAG TaqMan Probe FAM-CCACGGAAGTTCACGTAA-TAMRA
Tgfb1 (NM_011480) Forward TCCCAAGAGCCCTGCACTT Reverse GTCCACAAAGAAACGGTGACCTA TaqMan Probe FAM-TTGACACGTTTCTTCCTGAGCAGCGC-TAMRA
Eln (NM_007925) Forward CAAGACCTGGCTTTGGACTTTCT Reverse CAAAGCAGCCCCCACCTT TaqMan Probe FAM-CCATTTATCCAGGTGGTGGT-TAMRA
Acta2 (NM_007392) Forward GTATCCGATAGAACACGGCATCA Reverse GGCCACACGAAGCTCGTTATAG TaqMan Probe FAM-CATGGAAAAGATCTGGCACC-TAMRA
Pparg (NM_001127330) Forward GCTTCCACTATGGAGTTCATGCTT Reverse ATCCGGCAGTTAAGATCACACCTA TaqMan Probe AGGATGCAAGGGTTTTTTCCGA-TAMRA
Srebf1 (NM_011480) Forward TCCCAAGAGCCCTGCACTT Reverse GTCCACAAAGAAACGGTGACCTA TaqMan Probe FAM-TTGACACGTTTCTTCCTGAGCAGCGC-TAMRA
Fasn (NM_007988) Forward GATGACATCGTGCATGCCTTT Reverse GTCAGGTTTCAGTCCCACAGAAGT TaqMan Probe FAM-CTGCCATCCAGATTGCCCTCATCG-TAMRA
Mogat1 (NM_026713) Forward GTTTCCCGTTGTTCCGAGAATAT
Reverse TGCTCAGCACATGAGACAAACTC TaqMan Probe FAM-TGATGAGTAACGGGCCGGTTTCAGTG-TAMRA
Dgat2 (NM_026384) Forward GAAGAACCGCAAAGGCTTTGT Reverse GATCACCTGCTTGTATACCTCATTCTC TaqMan Probe FAM-AGCTGATCTGGTTCCCACT-TAMRA
Cidec (NM_178373) Forward CCTGGCAAAAGATACCATGTTCA Reverse GCTTCTGGGAAAGGGCTAGCT TaqMan Probe FAM-CCCCATCAGAACAGCGCAAGAAGAGAG-TAMRA
Vldlr (NM_001161420) Forward TCGTGGCTATCAAATGGATCTTG Reverse GGCCAATCTTCCTGATGTCTCTT TaqMan Probe CGTGTGCAAGGCAGTAGGCAAAGAGC-TAMRA
Lcn2 (NM_008491) Forward TTGATCCCTGCCCCATCTC Reverse CTGTTTTTTTCTGGACCGCATT TaqMan Probe FAM-TCCGGAGCGATCAGTTCCGGG-TAMRA
Prdm16 (NM_027504) Forward GATGGGAGATGCTGACGGATAC Reverse CTCGCTACCCAAGTCTTCAGACAT TaqMan Probe FAM-CATCCCAGGAGAGCTGCATCAAAAAGC-TAMRA
Ppargc1a (NM_008904) Forward GTCTGAAAGGGCCAAACAGAG Reverse TCAATTCTGTCCGCGTTGTG TaqMan Probe FAM-AGCAGAAAGCAATTGAAGAGCGCCGT-TAMRA
Ucp1 (NM_009463) Forward CGATGTCCATGTACACCAAGGA Reverse ACCCGAGTCGCAGAAAAGAAG TaqMan Probe FAM-ACCGACGGCCTTTTTCAAAGGGTTTG-TAMRA
Spp1, secreted phosphoprotein 1; Cd44, Cd44 antigen; Irs1, insulin receptor substrate 1; Irs2, insulin receptor substrate 2; Slc2a4, solute carrier family 2, member 4 (Glut4); Ucp3, uncoupling protein 3; Mmp2, matrix metalloproteinase 2; Mmp9, matrix metalloproteinase 9; Emr1, EGF-like module containing, mucin-like, hormone receptor-like sequence 1; Itgax, integrin alpha X (Cd11c); Tnf, tumor necrosis factor alpha; Il6, interleukin 6; Adipoq, adiponectin; Nox1, NADPH oxidase 1; Cybb, cytochrome b-245, beta polypeptide (Nox2); Col1a1, collagen, type I, alpha 1; Col6a1, collagen, type VI, alpha 1; Col6a3, collagen, type VI, alpha 3; Tgfb1, transforming growth factor, beta 1; Eln, elastin; Acta2, actin, alpha 2, smoth muscle, aorta (alpha-Sma); Pparg, peroxisome proliferators-activated receptor gamma; Srebf1, sterol regulatory element binding transcription factor 1; Fasn, fatty acid synthase; Mogat1, monoacylglycerol O-acyltransferase 1; Dgat2, diacylglycerol O-acyltransferase 2; Cidec, cell death-inducing DFFA-like effector c; Vldlr, very low density lipoprotein receptor; Lcn2, lipocalin 2; Prdm16, PR domain containing 16; Ppargc1a, peroxisome proliferators-activated receptor gamma coactivator 1 alpha; Ucp1, uncoupling protein1.

Mean ± SEM of 8-10 animals. Statistical differences were determined by two-way ANOVA. a P<0.05, effect of OPN deletion; b P<0.05 effect of diet.
Table S2. Organ Weights of Experimental Animals
Chow diet High-fat diet Wild type OPN-KO Wild type OPN-KO
Heart (mg) a,b 143 ± 6 184 ± 7 170 ± 5 190 ± 7
Spleen (mg) a 67 ± 5 115 ± 12 86 ± 6 106 ± 9
Kidney (mg) a,b 187 ± 8 222 ± 7 212 ± 10 224 ± 9
Adrenal glands (mg) a 1.5 ± 0.2 1.9 ± 0.2 1.5 ± 0.1 1.9 ± 0.2
Testicle (mg) 82 ± 6 90 ± 2 90 ± 4 96 ± 3
Brain (mg) a 447 ± 6 423 ± 8 438 ± 2 436 ± 5
EDL (mg) 11.6 ± 1.0 12.7 ± 0.6 11.7 ± 0.6 12.2 ± 0.8
Soleus (mg) b 9.5 ± 0.9 9.7 ± 0.4 11.9 ± 0.8 10.3 ± 0.6
Gastrocnemius (mg) a 161 ± 7 167 ± 5 166 ± 3 180 ± 4
Femur (mg) a 82 ± 3 86 ± 3 80 ± 2 89 ± 3 Tibia (mg) a 61 ± 2 65 ± 3 54 ± 1 66 ± 2 Body length (cm) 10.2 ± 0.1 10.4 ± 0.4 10.4 ± 0.1 10.7 ± 0.2 Femur length (mm) a 15.6 ± 0.6 16.8 ± 0.4 15.8 ± 0.3 17.0 ± 0.3 Tibia length (mm) 18.8 ± 0.5 19.4 ± 0.3 18.7 ± 0.2 18.9 ± 0.2

GenBank accesion number Gene Symbol Gene name
Wild type CD
OPN-KO CD
Wild type HFD
OPN-KO HFD
NM_020258 Slc37a2 Solute carrier family 37 (glycerol-3-phosphate transporter), member 2 1.00 1.38 30.55 4.24NM_007498 Atf3 Activating transcription factor 3 1.00 1.20 27.60 4.08NM_001044384 Timp1 Tissue inhibitor of metalloproteinase 1, transcript variant 1 1.00 2.18 26.62 3.29NM_010130 Emr1 EGF-like module containing, mucin-like, hormone receptor-like sequence 1 1.00 2.07 23.77 2.64NM_001033245 Hk3 Hexokinase 3 1.00 1.26 18.88 3.27NM_009853 Cd68 CD68 antigen 1.00 2.42 16.56 4.15NM_030682 Tlr1 Toll-like receptor 1 1.00 1.48 14.26 3.00NM_009230 Soat1 Sterol O-acyltransferase 1 1.00 1.89 13.46 2.88NM_009914 Ccr3 Chemokine (C-C motif) receptor 3 1.00 2.94 13.22 1.23NM_133212 Tlr8 Toll-like receptor 8 1.00 1.16 11.52 2.59NM_010809 Mmp3 Matrix metallopeptidase 3 1.00 1.78 9.83 1.23NM_009917 Ccr5 Chemokine (C-C motif) receptor 5 1.00 1.60 8.72 3.03AK037554 Itgax NOD-derived CD11c +ve dendritic cells cDNA, RIKEN full-length enriched library, clone:F630002M04 product:integrin
alpha X, full insert sequence1.00 1.58 7.47 2.20
NM_007742 Col1a1 Procollagen, type I, alpha 1 1.00 1.77 7.42 1.65NM_007798 Ctsb Cathepsin B 1.00 1.06 7.27 2.20NM_008855 Prkcb1 Protein kinase C, beta 1 1.00 1.23 6.84 1.57NM_021460 Lip1 Lysosomal acid lipase 1 1.00 1.13 5.78 1.78NM_011604 Tlr6 Toll-like receptor 6 1.00 1.28 5.61 2.02NM_133211 Tlr7 Toll-like receptor 7 1.00 1.44 5.24 1.35NM_008610 Mmp2 Matrix metallopeptidase 2 1.00 1.77 4.24 1.36NM_007739 Col8a1 Procollagen, type VIII, alpha 1 1.00 1.28 3.93 1.25NM_015763 Lpin1 Lipin 1, transcript variant 2 1.00 0.74 0.28 0.69NM_009204 Slc2a4 Solute carrier family 2 (facilitated glucose transporter), member 4 1.00 0.74 0.27 0.67NM_178934 Slc2a12 Solute carrier family 2 (facilitated glucose transporter), member 12 1.00 0.85 0.24 0.87NM_023184 Klf15 Kruppel-like factor 15 1.00 0.78 0.22 0.72
Table S3. Selected Genes Differentially Expressed in EWAT
Genes sorted from largest to smallest value of fold change (wild type with HFD compared to wild type with CD)

GenBank accesion number Gene Symbol Gene name
Wild type CD
OPN-KO CD
Wild type HFD
OPN-KO HFD
NM_013703 Vldlr Very low density lipoprotein receptor 1.00 0.67 9.57 2.12NM_007585 Anxa2 Annexin A2 1.00 0.91 6.05 1.37NM_008484 Lamb3 Laminin, beta 3 1.00 1.32 4.37 1.49NM_007742 Col1a1 Procollagen, type I, alpha 1 1.00 1.54 2.66 0.98NM_016704 C6 Complement component 6 1.00 0.88 0.29 0.89NM_172498 Ptk2b PTK2 protein tyrosine kinase 2 beta 1.00 0.96 0.23 0.91NM_133882 C8b Complement component 8, beta subunit 1.00 0.83 0.23 0.69NM_007912 Egfr Epidermal growth factor receptor 1.00 1.06 0.22 0.96NM_008294 Hsd3b4 Hydroxy-delta-5-steroid dehydrogenase, 3 beta- and steroid delta-isomerase 4 1.00 0.77 0.02 1.32NM_008295 Hsd3b5 Hydroxy-delta-5-steroid dehydrogenase, 3 beta- and steroid delta-isomerase 5 1.00 0.74 0.01 1.29
Table S4. Selected Genes Differentially Expressed in the Liver
Genes sorted from largest to smallest value of fold change (wild type with HFD compared to wild type with CD)


101
3. EFECTOS DE LA GASTRECTOMÍA
TUBULAR SOBRE LA OSTEOPONTINA EN
RATAS


3.1. Hipótesis La CB podría modificar los niveles séricos de OPN en ratas alimentadas con una HFD, así como su expresión en WAT e hígado. 3.2. Objetivo 1. Analizar el efecto de la CB sobre los niveles séricos de OPN y su expresión en WAT e hígado de ratas con obesidad inducida por una HFD. 2. Estudiar la posible correlación de los cambios en los niveles séricos de OPN y su expresión en WAT e hígado con los cambios en el peso corporal y la adiposidad, así como con marcadores de metabolismo glucídico y de inflamación. 3.3. Artículo Lancha A, Moncada R, Valentí V, Rodríguez A, Catalán V, Becerril S, Ramírez B, Méndez-Giménez L, Frühbeck G and Gómez-Ambrosi J. Effect of sleeve gastrectomy on osteopontin circulating levels and expression in adipose tissue and liver in rats. Obes Surg 2014:DOI:10.1007/s11695-014-1240-z.


113
4. EFECTO DE DIFERENTES TÉCNICAS DE
CIRUGÍA BARIÁTRICA SOBRE LOS
NIVELES CIRCULANTES DE
OSTEOPONTINA EN HUMANOS

4.1. Hipótesis La pérdida de peso inducida por diferentes técnicas de CB podría modificar de distinta manera los niveles plasmáticos de OPN en humanos. 4.2. Objetivo 1. Analizar el efecto de la CB sobre los niveles plasmáticos de OPN y su relación con cambios en el metabolismo glucídico, inflamación, así como en marcadores de remodelado óseo. 2. Comparar el posible impacto diferencial de una técnica restrictiva (SG) frente a una de tipo mixto (RYGB). 4.3. Artículo Lancha A, Moncada R, Valentí V, Rodríguez A, Catalán V, Becerril S, Ramírez B, Méndez-Giménez L, Gil MJ, Rotellar F, Fernández S, Salvador J, Frühbeck G and Gómez-Ambrosi J. Comparative effects of gastric bypass and sleeve gastrectomy on plasma osteopontin concentrations in humans. Surg Endosc 2014:DOI:10.1007/s00464-014-3490-1.


DISCUSIÓN


Discusión
129
La alarmante prevalencia de la obesidad ha estimulado el estudio
exhaustivo de los mecanismos moleculares que controlan la homeostasis
energética. Su regulación es más compleja de lo que se pensaba en un
principio, ya que se ha observado que está regulada por una gran variedad de
señales provenientes de diferentes órganos. Una de estas señales es la OPN,
una proteína producida principalmente en el hueso, pero que también se
produce en otros tipos celulares y sobre la cual se centra el presente estudio.
1. ESTUDIO EN RATONES DEFICIENTES EN OSTEOPONTINA
En humanos, se ha observado que la OPN circulante se encuentra
aumentada en pacientes obesos (Gómez-Ambrosi et al, 2007; Kiefer et al,
2008; Bertola et al, 2009). Sin embargo, en roedores los resultados son
contradictorios. Por una parte, algunos autores han observado que las
concentraciones circulantes de OPN aumentan en ratones alimentados con
HFD (Nomiyama et al, 2007), mientras que otros grupos, de acuerdo con
nuestros hallazgos, no han observado diferencias (Kiefer et al, 2008; Chapman
et al, 2010). Por otra parte, al analizar los niveles de expresión de OPN en el
WAT epididimal (EWAT) e hígado, observamos que aumentan drásticamente,
lo cual sugiere que la OPN desempeña un papel más importante a nivel
autocrino/paracrino que a nivel sistémico.
La OPN se une a CD44 y a múltiples integrinas (Mazzali et al, 2002). Se
ha observado que CD44 se asocia con DT2 en humanos y que posee un papel
destacado en la resistencia a la insulina y en la inflamación en el WAT e hígado
(Kodama et al, 2012; Kang et al, 2013). En nuestro estudio constatamos que la
expresión de Cd44 aumenta con la HFD en EWAT e hígado, confirmando los

Discusión
130
datos de un trabajo previo (Bertola et al, 2009). Este aumento de Cd44 podría
exacerbar los efectos provocados por la OPN en EWAT e hígado. A pesar de
que cabría esperar un efecto compensatorio tendente a aumentar los niveles
de Cd44 en los ratones OPN-KO, éstos mostraron una menor expresión. Este
efecto podría deberse a que la OPN promueve la expresión de Cd44 (Rittling,
2011).
1.1. Efecto sobre el peso corporal y el WAT
Por otro lado, se observó que la deficiencia de OPN previene el
incremento del peso corporal y del WAT provocado por la HFD, lo cual, aunque
está en consonancia con un estudio previo (Chapman et al, 2010), contrasta
con lo observado en otras investigaciones donde no observaron cambios en el
peso corporal (Nomiyama et al, 2007; Kiefer et al, 2011). Este efecto protector
frente a la ganancia de peso con la HFD, se pone de manifiesto a pesar de que
los ratones deficientes en OPN presentan una mayor ingesta. Los ratones
OPN-KO poseen unos niveles de ghrelina aumentados, lo cual podría explicar
su mayor ingesta. Además de un menor peso del WAT, también se observó
que los adipocitos presentaban un menor tamaño en los ratones OPN-KO
alimentados con HFD respecto a los ratones WT, lo cual concuerda con lo
observado por Chapman y colaboradores (Chapman et al, 2010). Esta
disminución del tamaño de los adipocitos se asocia con un menor depósito
ectópico de grasa y con un aumento de la sensibilidad a la insulina (Goossens,
2008).
Con objeto de intentar explicar la disminución del WAT y del peso
corporal en los ratones OPN-KO analizamos las principales proteínas
implicadas en las vías lipogénicas [AKT1 (proteína kinasa B), AMPK (kinasa

Discusión
131
activada por AMP), ACC (acetil-CoA carboxilasa) y FAS (sintasa de ácidos
grasos)] y lipolíticas [ATGL (lipasa de triglicéridos del tejido adiposo) y HSL
(lipasa sensible a hormonas)], así como el receptor activado por proliferadores
de peroxisomas γ (PPARγ), una proteína que estimula la adipogénesis y la
entrada de lípidos a los adipocitos (Jones et al, 2005). Sin embargo, no
observamos cambio alguno en la cantidad y la actividad de estas proteínas en
los ratones OPN-KO, por lo que no parece probable que cambios en estas vías
sean los responsables del menor peso corporal y del WAT en los ratones
deficientes en OPN.
1.2. Efecto sobre el remodelado de la matriz extracelular en el EWAT
El WAT está sometido a un proceso de remodelado continuo, el cual se
encuentra aumentado patológicamente durante la obesidad (Sun et al, 2011).
Las MMPs son las principales moléculas encargadas de regular el balance
entre la síntesis y la degradación de las proteínas de la matriz. De todas ellas,
se ha observado que MMP2 y MMP9 ejercen un papel destacado en la
remodelación que sufre el WAT durante la obesidad (Bouloumie et al, 2001;
Chavey et al, 2003; Catalán et al, 2009). Además, estudios previos de nuestro
grupo demostraron que la expresión de MMP2 y MMP9 estaba aumentada en
sujetos obesos y que su expresión se correlacionaba con los niveles de
expresión de la OPN (Catalán et al, 2009). En nuestro estudio, la actividad
MMP2 y MMP9 se encuentra elevada por la HFD, siendo este efecto
especialmente evidente para la MMP2, la cual aumenta hasta 25 veces. Este
incremento de la actividad se produce a pesar de una menor expresión génica
de Mmp9 con la HFD y de que los niveles proteicos de MMP2 y MMP9
permanecen sin cambios. Esto podría ser debido a la compleja regulación a la

Discusión
132
que se ven sometidas MMP2 y MMP9. Estas gelatinasas se segregan como
zimógenos inactivos y deben ser activadas por factores tales como citoquinas,
factores de crecimiento o proteínas de la matriz extracelular, y mediante la
excisión de un prodominio adquieren su forma activa. Posteriormente, pueden
ser inhibidas por los inhibidores tisulares de metaloproteinasas (TIMP) o por
inhibidores no específicos como el inhibidor de proteinasas α1 o la α2-
macroglobulina (Bourboulia et al, 2010; Hadler-Olsen et al, 2011; Hopps et al,
2012). Esta regulación puede provocar que los niveles génicos, proteicos y de
actividad no coincidan. Esta discordancia entre la expresión génica y proteica
de MMP2 y MMP9 también ha sido observada por otros investigadores. En este
sentido, Van Hul y Lijnen observaron que la expresión de Mmp2 aumentaba
con la restricción calórica, mientras que la cantidad de proteína no variaba (Van
Hul and Lijnen, 2011). De manera análoga, la restricción calórica disminuyó la
formación de MMP9 sin cambiar los niveles génicos. Similares diferencias han
sido puestas de manifiesto en otros tejidos (Lichtinghagen et al, 2002; Urso et
al, 2012). En el presente estudio, la deficiencia de OPN previno el aumento de
la actividad MMP2 y MMP9 provocado por la HFD. Estos resultados estarían en
consonancia con lo observado anteriormente en el remodelado cardiaco y en
los procesos neoplásicos, donde se ha observado que la OPN regula la
expresión génica y proteica de MMP2 y MMP9 (Lai et al, 2006; Liu et al, 2010).
Por tanto, la disminución de la remodelación del WAT, reflejada en la
disminución de la actividad de MMP2 y MMP9, parece ser un mecanismo por el
cual la deficiencia de OPN protege frente al aumento de peso del WAT.

Discusión
133
1.3. Efecto sobre el estrés oxidativo
Numerosos estudios han mostrado que la obesidad está asociada a un
aumento del estrés oxidativo (Furukawa et al, 2004; Matsuzawa-Nagata et al,
2008). Por otra parte, la OPN también ha sido relacionada con el estrés
oxidativo en ratones y humanos (Georgiadou et al, 2008; Irita et al, 2011). La
NADPH oxidasa es una de las principales enzimas productoras de especies
reactivas de oxígeno, la cual está formada por varias subunidades
(Nox/gp91phox, p47phox, p40phox, p67phox y p22phox). Se ha observado que
las subunidades de la NADPH oxidasa tienen aumentada su expresión en
animales alimentados con HFD y que la subunidad Nox corresponde a la
subunidad catalítica de la enzima (Hagiwara et al, 2009). En el presente
estudio, hemos observado que la expresión génica de Nox1 y Cybb (Nox2), así
como la cantidad de proteína NOX2 está aumentada con la HFD y que la
deficiencia de OPN protege frente a este aumento. Además, también hemos
constatado que la deficiencia de OPN protege frente al aumento de los niveles
circulantes de peroxidación lipídica causado por la HFD, lo que sugiere que los
ratones OPN-KO están protegidos frente al estrés oxidativo sistémico. Efectos
similares han sido evidenciados en riñones de ratones deficientes en OPN, los
cuales están protegidos frente al estrés oxidativo producido por la aldosterona
(Irita et al, 2011). Por lo tanto, la deficiencia de OPN ejerce un papel protector
frente al desarrollo del estrés oxidativo al disminuir la subunidad catalítica de la
NADPH oxidasa y la peroxidación lipídica.
1.4. Efecto sobre la inflamación en el EWAT
La expansión del WAT que tiene lugar durante la obesidad está asociada
con la acumulación de macrófagos (Bertola et al, 2009). Además, estudios

Discusión
134
anteriores han mostrado que la OPN regula la activación, migración y
acumulación de macrófagos (Lund et al, 2009; Zeyda et al, 2011; Lund et al,
2013). Nuestros estudios muestran que la deficiencia de OPN previene
parcialmente el aumento de macrófagos, de CLS y de la expresión génica de
Tnfa provocado por la HFD, lo cual está en consonancia con estudios
anteriores (Nomiyama et al, 2007). Además, CD11c, un marcador de
macrófagos M1 (Patsouris et al, 2008), se encuentra disminuido en los ratones
OPN-KO alimentados con HFD, lo que demuestra que la deficiencia de OPN
previene frente a la polarización de los macrófagos hacia estados
proinflamatorios en el WAT. Este hallazgo estaría en consonancia con estudios
anteriores que muestran que la deleción de Cd11c provoca una mejoría en la
insulino-sensibilidad, un descenso de CLS y una disminución de citoquinas
proinflamatorias como TNFα e IL6 (Patsouris et al, 2008). Por tanto, nuestros
datos muestran que el WAT de los ratones deficientes en OPN alimentados con
una HFD presenta una disminución de la expresión de citoquinas inflamatorias
y una menor infiltración de macrófagos, los cuales, además, poseen un perfil
menos inflamatorio.
Mediante técnicas de alto rendimiento (microarrays) se llevó a cabo el
análisis del perfil de expresión génica en el WAT de los diferentes grupos de
ratones. Así, se puso de manifiesto la presencia de una gran cantidad de genes
diferencialmente expresados por la HFD, siendo, al menos en parte, estos
cambios revertidos por la deficiencia de OPN. Estos genes pertenecen a
diversos procesos celulares tales como respuesta inmune (Cd40, Cd180 y
Tlr6), inflamación (Itgax, Tlr1 y Ccr3), metabolismo glucídico (Slc2a4 y

Discusión
135
Slc2a12), metabolismo lipídico (Hsd3b4, Soat1 y Lip1) o fibrosis (Col1a1,
Col8a1 y Anxa2), entre otros.
1.5. Efecto sobre la fibrosis en el EWAT e hígado
La obesidad también se asocia con un aumento de la fibrosis en el WAT,
habiéndose observado un incremento en la expresión de colágenos y de
citoquinas profibróticas como Tgfb1, así como la presencia de estructuras
fibróticas (Halberg et al, 2009; Khan et al, 2009). Asimismo, la OPN ha sido
relacionada con fibrosis en diferentes órganos como el hígado, el corazón, el
riñón o el músculo esquelético (Matsui et al, 2004; Lo et al, 2010; Irita et al,
2011; Syn et al, 2011). En este sentido, los ratones OPN-KO alimentados con
HFD mostraron un menor número de estructuras fibróticas, así como una
disminución en la expresión de colágenos (Col1a1, Col6a1 y Col6a3) y de Tgfb
en EWAT, lo que sugiere que la deficiencia de OPN protege frente a la fibrosis
inducida por la HFD en el WAT.
Sin embargo, en el hígado de los ratones WT alimentados con HFD no
se detectaron estructuras fibróticas, lo cual podría deberse a que la fibrosis se
encontraba todavía en estados iniciales. A pesar de no detectarse estructuras
fibróticas, sí que se puso de manifiesto un aumento en la expresión de
proteínas de la matriz extracelular como Col1a1, Col6a3 y Eln (elastina). No
obstante, la deficiencia de OPN previno este aumento. Además, la expresión
hepática de Col6a1 y marcadores de fibrosis como Acta2 (α-Sma) y anexina 2
(Xu et al, 2010; Zhang et al, 2010) disminuyeron en los ratones OPN-KO
independientemente de la dieta. Por tanto, nuestros datos sugieren que la
deficiencia de OPN previene la fibrosis hepática, lo cual estaría en consonancia

Discusión
136
con estudios anteriores que muestran que la OPN promueve la fibrosis en
NASH (Syn et al, 2011; Syn et al, 2012).
1.6. Efecto sobre la esteatosis hepática
La HFD provocó una acumulación de grasa en el hígado de los ratones
WT, sin embargo, no ocurrió así en los ratones deficientes en OPN. En los
ratones OPN-KO también se observa una menor expresión de Fasn (FAS),
Mogat1, Dgat2 y Srebf1, lo que mostraría una menor síntesis de AG (Cao et al,
2004; Jump et al, 2005; Lage et al, 2008) y una disminución en la expresión de
Vldlr (receptor de lipoproteínas de muy baja densidad), Cidec (FSP27) y Pparg,
proteínas que promueven la formación de gotas lipídicas y el almacenaje de TG
(Tacken et al, 2001; Matsusue, 2010). Estos datos estarían en consonancia con
lo observado anteriormente por Duval et al, que constataron que Mogat1, Vldlr
y Cidec estaban aumentados en el hígado de ratones con un alto grado de
esteatosis hepática (Duval et al, 2010). En nuestro estudio, también se observó
un descenso de la proteína de membrana aquaporina 7 (AQP7) en el hígado de
los ratones deficientes en OPN. Esta proteína se correlaciona con la cantidad
de TG en hígado y con la esteatosis hepática (Rodríguez et al, 2011). Por otro
lado, UCP3 resultó estar aumentada por la deficiencia de OPN, lo cual se
asocia a un mayor catabolismo lipídico (Camara et al, 2009; Senese et al,
2010). Por tanto, la deficiencia de OPN mejora notablemente la esteatosis
hepática inducida por la HFD, al disminuir la acumulación de TG y reducir la
expresión de varias proteínas relacionadas con dicho proceso. Este hallazgo
concuerda con estudios previos que muestran que la OPN está involucrada en
el desarrollo de hígado graso y esteatosis hepática en ratones (Sahai et al,
2004) y humanos (Lima-Cabello et al, 2011).

Discusión
137
1.7. Efecto sobre la inflamación en el hígado
La deficiencia de OPN revirtió completamente la infiltración de
macrófagos provocada por la HFD en el hígado. Asimismo, la deficiencia de
OPN previno el aumento de Cd11c y Tnfa, evidenciando que la ausencia de
OPN protege frente a la inflamación inducida por la obesidad. La lipocalina 2
(LCN2) es un marcador temprano de daño celular e inflamación en el hígado
(Borkham-Kamphorst et al, 2011) relacionado con la obesidad (Catalán et al,
2009). Además, se ha demostrado que los ratones LCN2-KO tienen aumentada
la sensibilidad a la insulina (Law et al, 2010). En los ratones del presente
estudio se observó que la deficiencia en OPN revierte el aumento de expresión
hepática de Lcn2 provocado por la HFD, mostrando que la ausencia de OPN
contribuye a reducir la inflamación y el daño hepático, así como a aumentar la
sensibilidad a la insulina en el hígado. Por lo tanto, la menor infiltración de
macrófagos, el menor perfil inflamatorio de éstos y la menor expresión de Tnf y
Lcn2 muestran que los ratones deficientes en OPN presentan una menor
inflamación hepática que los ratones WT alimentados con HFD, de manera
similar a lo observado en el WAT. En este sentido, la OPN ha sido
recientemente propuesta como un marcador de inflamación portal en pacientes
con NAFLD (Yilmaz et al, 2012).
1.8. Efecto sobre la sensibilidad a la insulina
La deficiencia de OPN también protege frente a la insulino-resistencia
provocada por la HFD, como muestran unos menores niveles de insulina, un
menor HOMA (índice de resistencia a la insulina) y una menor curva de
glucemia en el test de tolerancia a la insulina intraperitoneal (IPITT). Sin
embargo, la expresión de Irs1, Irs2 y Slc2a4 en el músculo esquelético de los
Discusión
138
ratones OPN-KO no resultó afectada por la deficiencia de OPN, por lo que no
parecen intervenir en la mejora de la insulino-sensibilidad de estos ratones.
Este hallazgo sugiere que los cambios en el tejido adiposo e hígado podrían
tener un papel más importante en la mejora de la sensibilidad a la insulina, que
los cambios a nivel sistémico (Kiefer et al, 2011). En este sentido, estudios
previos han observado que la deleción genética de la OPN en ratones revierte
la resistencia a la insulina en hígado, músculo y tejido adiposo (Nomiyama et
al, 2007; Chapman et al, 2010; Kiefer et al, 2011). El tratamiento con
anticuerpos anti-OPN también ha demostrado revertir la resistencia a la insulina
(Kiefer et al, 2010). Por tanto, la OPN parece ser un claro modulador de la
resistencia a la insulina.
1.9. Efecto sobre el tejido adiposo pardo
La baja adiposidad de los ratones OPN-KO a pesar de tener aumentada
la ingesta, nos condujo a pensar que podrían tener la termogénesis
aumentada. En este sentido, hemos observado que los ratones deficientes en
OPN presentan una temperatura corporal aumentada respecto a los ratones
WT. Además, la ausencia de OPN mejora el fenotipo del BAT en animales
alimentados con HFD, los cuales poseen un BAT con grandes gotas lipídicas
más propias del WAT. PRDM16 (Dominio PR que contiene 16) constituye una
proteína involucrada en la diferenciación de los adipocitos pardos y UCP1
representa la principal proteína implicada en la regulación de la termogénesis
(Frühbeck et al, 2009). UCP3, aunque tiene una capacidad termogénica menor,
también posse la capacidad de promover la oxidación de AG, y su
sobreexpresión contribuye a una menor acumulación de lípidos en el BAT y a
un menor peso corporal (Costford et al, 2008; Nau et al, 2008). De hecho, los
Discusión
139
ratones deficientes en UCP1 o UCP3 presentan obesidad (Costford et al, 2008;
Feldmann et al, 2009). Los ratones OPN-KO mostraron una mayor expresión
de Prdm16, lo que sugiere una mayor diferenciación de los adipocitos pardos.
De igual modo, exhibieron una mayor expresión génica de Ucp1, así como una
mayor cantidad de proteína UCP1 y UCP3, lo cual indicaría que estos ratones
tienen aumentada la termogénesis. Por tanto, los ratones deficientes en OPN
muestran un aumento de la temperatura corporal y una mejora en la morfología
y en la expresión de genes específicos del BAT, lo que sugiere que poseen una
mayor capacidad termogénica que los ratones WT.
En conclusión, la deficiencia de OPN reduce el aumento en el peso
corporal y la expansión del WAT. Además, disminuye la infiltración de
macrófagos, la inflamación, el estrés oxidativo, la fibrosis, la esteatosis hepática
y la resistencia a la insulina. Por lo tanto, nuestros resultados sugieren que la
OPN podría ser una diana terapéutica para el tratamiento de la obesidad y de
sus principales patologías asociadas.
2. EFECTOS DE LA GASTRECTOMÍA TUBULAR SOBRE LA
OSTEOPONTINA EN RATAS
Se ha investigado mucho sobre las distintas funciones de la OPN en
diferentes tejidos, sin embargo, los cambios que tienen lugar en la expresión
tisular y concentración circulante de OPN tras la pérdida de peso por diferentes
abordajes no se conocen en profundidad. Por tanto, en un subsiguiente estudio
se procedió a analizar los efectos de la pérdida de peso debido a la CB sobre
los niveles de OPN en ratas, las cuales fueron sometidas a SG.

Discusión
140
Estudios anteriores de nuestro grupo han mostrado que la SG es una
técnica efectiva para reducir la ingesta y el peso corporal en ratas (Valentí et al,
2011; Martín et al, 2012; Rodríguez et al, 2012a; Rodríguez et al, 2012b). De
igual modo, se ha puesto de manifiesto que la SG reduce la presión sanguínea
en ratas alimentadas con HFD y en ratas Zucker genéticamente obesas
(Rodríguez et al, 2012a; Rodríguez et al, 2012b). En este sentido, la SG es una
técnica que va más allá de una simple reducción en la capacidad gástrica, ya
que, por un lado, produce cambios macro y microscópicos en el estómago de
las ratas (Martín et al, 2012) y, por otro, al igual que en los humanos (Frezza et
al, 2008), disminuye los niveles de ghrelina, una hormona producida por el
estómago que posee efectos orexigénicos, lo cual podría contribuir a una
mayor pérdida de peso (Rodríguez et al, 2012a).
En el presente estudio, hemos observado cómo, efectivamente, las ratas
sometidas a SG presentaron un menor peso corporal y de EWAT, a la vez que
una mayor EWL. Además, las ratas sometidas a SG que continuaron con una
HFD tras la cirugía, mostraron un menor índice HOMA que las ratas no
sometidas a cirugía que comieron la misma cantidad de alimento. Este hecho
sugiere que las ratas sometidas a SG, además de la pérdida de peso,
presentan una mejora de la insulino-sensibilidad.
Respecto a las concentraciones séricas de OPN en roedores
alimentados con HFD, se han descrito diversas observaciones contradictorias.
Por un lado, algunos autores observan una disminución de los niveles de OPN
con respecto a los animales alimentados con dieta normal (Kiefer et al, 2008).
Sin embargo, otros autores, al igual que nuestro estudio en ratones, no
encuentran diferencias significativas (Kiefer et al, 2008; Chapman et al, 2010) u

Discusión
141
observan un aumento de las concentraciones circulantes (Nomiyama et al,
2007; Bertola et al, 2009). Nuestros resultados muestran un descenso
significativo de las concentraciones séricas de OPN en las ratas alimentadas
con HFD. Estas diferencias en las concentraciones de OPN séricas pueden
deberse a que se usaron diferentes especies (rata o ratón), cepas (ratones
C57BL/6J o db/db, ratas Wistar o Sprague-Dawley), composición de la dieta
(40-60% de kcal provenientes de la grasa) o tiempos de exposición a la HFD
(2-25 semanas) (Nomiyama et al, 2007; Kiefer et al, 2008; Bertola et al, 2009;
Chapman et al, 2010; Wang et al, 2012).
Aunque la mayoría de las concentraciones circulantes de citoquinas pro-
inflamatorias disminuyen tras la CB (Gómez-Ambrosi et al, 2006; Catalán et al,
2007), estudios previos en humanos han puesto de manifiesto que los niveles
plasmáticos de OPN aumentan después de la CB en humanos (Riedl et al,
2008; Bertola et al, 2009; Schaller et al, 2009; Komorowski et al, 2011). Sin
embargo, no observamos cambios en las concentraciones séricas de OPN en
ratas sometidas a SG. Las diferencias observadas en los niveles circulantes de
OPN tras la CB en ratas y humanos, podrían ser debidas a las diferencias entre
especies o a la diferente naturaleza de los procedimientos quirúrgicos, ya que
las técnicas realizadas en humanos combinan el componente restrictivo con el
malabsortivo, mientras que en nuestro estudio en ratas el procedimiento
utilizado fue puramente restrictivo. No obstante, al igual que sucede con la
OPN, determinadas citoquinas como TNFα o sICAM-1 disminuyen con el
descenso de peso por restricción calórica, pero no por la reducción ponderal
inducida por CB (Forsythe et al, 2008; Tziomalos et al, 2010).
Discusión
142
Numerosos estudios han demostrado que la HFD desencadena la
respuesta inflamatoria en el tejido adiposo. La disfunción de los adipocitos
debido a su hipertrofia, junto con una infiltración aumentada de los macrófagos,
provoca un aumento de la liberación de citoquinas proinflamatorias durante la
obesidad (Catalán et al, 2007; Chapman et al, 2010; Kiefer et al, 2010; Catalán
et al, 2012; Lancha et al, 2012). De hecho, en el presente estudio se observó
que la expresión de Spp1 en EWAT se correlaciona positivamente con el peso
corporal y la masa grasa, demostrando que la OPN está altamente implicada
en la expansión del tejido adiposo y en el desarrollo de la obesidad.
Además, las ratas control alimentadas con HFD mostraron una mayor
expresión de Spp1 en EWAT comparadas con las alimentadas con ND, lo cual
está en consonancia con lo observado por otros grupos (Nomiyama et al, 2007;
Kiefer et al, 2008; Chapman et al, 2010) y por nuestro estudio en ratones. El
hecho de que el aumento local de Spp1 en el tejido adiposo no se refleje en un
aumento significativo de los niveles circulantes, sugiere que la OPN
desempeña un papel más importante a nivel autocrino/paracrino que a nivel
sistémico. Por otra parte, el cambio de la alimentación en las ratas de HFD a
ND, se tradujo en una disminución significativa de los niveles de Spp1 mRNA
en EWAT, sin embargo, el tratamiento quirúrgico no aportó beneficio adicional
alguno. Que los niveles de OPN no disminuyesen con la pérdida de peso
podría deberse al estrés causado por el daño quirúrgico, sobre todo en las
ratas sometidas a la SG, ya que la OPN aumenta debido a la respuesta
inflamatoria de las heridas (Pardo et al, 2005). El hecho de que los grupos
sometidos a cirugía alimentados con HFD no mostrasen diferencias en la
expresión de Spp1 mRNA respecto a los alimentados con dieta normal, es

Discusión
143
probable que se deba al hecho de que todos los grupos han experimentado
cierta pérdida de peso, lo cual podría tender a normalizar sus niveles. Sin
embargo, al analizar la expresión de Spp1 mRNA en el hígado no se
observaron diferencias debidas a la alimentación con una HFD, o en relación
con los diferentes tratamientos quirúrgicos.
En conclusión, los niveles séricos de OPN disminuyeron en las ratas
alimentadas con la HFD, sin que la SG produjese cambios significativos en sus
niveles. Además la expresión de la OPN aumentó con la HFD en EWAT sin que
la SG revirtiese los efectos de la HFD a la normalidad. Por tanto, la OPN
parece tener un papel más importante a nivel local que a nivel sistémico,
induciendo la expansión del tejido adiposo y actuando como un factor
proinflamatorio asociado a la obesidad.
3. EFECTO DE DIFERENTES PROCEDIMIENTOS DE CIRUGÍA
BARIÁTRICA SOBRE LOS NIVELES CIRCULANTES DE
OSTEOPONTINA EN HUMANOS
En un estudio posterior se analizaron los niveles plasmáticos de OPN en
humanos tras dos tipos diferentes de CB, el RYGBP y la SG. Nuestros
resultados mostraron que la CB mejora el perfil metabólico de los pacientes, al
aumentar la insulino-sensibilidad y disminuir tanto el peso corporal como el
porcentaje de grasa, entre otros factores. Asimismo, mejoró el perfil
inflamatorio al disminuir los niveles séricos de proteína C reactiva. Por otra
parte, al analizar los niveles plasmáticos de OPN se observó que el RYGBP
aumentaba los niveles circulantes de OPN, lo cual coincide con estudios
previos (Riedl et al, 2008; Schaller et al, 2009). Sin embargo, los niveles
Discusión
144
circulantes de OPN no cambiaron tras la SG. Por el contrario, estudios previos
de nuestro grupo evidenciaron que la pérdida ponderal convencional inducida
por restricción calórica reduce los niveles circulantes de OPN (Gómez-Ambrosi
et al, 2007).
El RYGBP se ha asociado en varios estudios con pérdida de masa ósea
debida a malabsorción de calcio, fosfatos y vitamina D (Coates et al, 2004;
Gómez et al, 2009). En este sentido, Rield et al, observaron que la OPN
circulante aumenta en los pacientes sometidos a RYGBP, y que este aumento
se correlaciona positivamente con marcadores de recambio óseo tales como el
CTX (telopéptido C terminal), un marcador de resorción ósea, y la osteocalcina,
un marcador de formación ósea (Riedl et al, 2008). En el presente estudio
también se observó un aumento en las concentraciones plasmáticas de
osteocalcina y del telopéptido carboxiterminal del colágeno tipo I (ICTP), otro
producto de degradación del colágeno óseo. Tras el RYGBP, sin embargo, las
concentraciones circulantes de calcio, fosfato y vitamina D aumentaron,
probablemente debido a la administración oral de estos nutrientes que
recibieron los pacientes. De igual modo, los niveles de OPN plasmática se
correlacionaron positivamente con la fosfatasa alcalina y el ICTP tras el
RYGBP, lo cual sugiere que la OPN está implicada en la remodelación ósea
asociada al RYGBP. Además, observamos una disminución de la densidad
mineral ósea en los pacientes sometidos a RYGBP, lo cual está en
consonancia con lo descrito por otros grupos (Coates et al, 2004; Gómez et al,
2009; Stemmer et al, 2013). Por tanto, la OPN parece estar relacionada con el
aumento de la resorción ósea inducida por los efectos malabsortivos de la
técnica.

Discusión
145
Por otra parte, el aumento en los niveles circulantes de la OPN podría
estar relacionado, además de con el remodelado óseo, con un aumento de la
síntesis de OPN por otros órganos tales como el riñón, en el cual se ha
observado un aumento de la síntesis de OPN tras RYGBP en ratas (Canales et
al, 2012).
Los pacientes sometidos a SG mostraron niveles más elevados de ICTP.
Además, se observó una correlación positiva del cambio en los niveles
circulantes de ICTP tras la SG con los cambios en los niveles circulantes de
OPN. Esto parece reflejar un aumento en la resorción ósea. Este posible
aumento de la resorción ósea podría deberse a la disminución de la secreción
del jugo gástrico que ha sido observado en pacientes sometidos a RYGBP o
SG. Esto conllevaría la alcalinización del jugo gástrico, lo cual podría dificultar
la absorción de ciertos nutrientes como el calcio (Folli et al, 2012).
Desafortunadamente, no disponemos de densitometrías óseas postoperatorias
en los pacientes sometidos a SG, ya que al ser una técnica sin componente
malabsortivo las densitometrías óseas no están incluidas en el protocolo clínico
de seguimiento. Una potencial explicación para el diferente comportamiento de
la OPN tras el RYGBP y la SG son los cambios observados en los niveles de
vitamina D. En este sentido, la vitamina D aumentó tras ambos procedimientos,
pero en mayor medida en los pacientes sometidos a SG. Además, se
comprobó que los cambios en la vitamina D tras la cirugía se correlacionaban
negativamente con el cambio en los niveles de OPN solo en los pacientes
sometidos a SG. Esto podría provocar la reducción de OPN en los pacientes
sometidos a SG, ya que se ha observado que la vitamina D podría reducir los
niveles circulantes de OPN (Yu et al, 2010; Wang et al, 2011).

Discusión
146
Estas alteraciones en la absorción de nutrientes, las cuales afectan al
metabolismo óseo, podrían explicar que las concentraciones plasmáticas de
OPN no disminuyan en pacientes sometidos a RYGBP o SG, contrariamente a
lo que sucede con los pacientes que pierden peso debido a la restricción
calórica (Gómez-Ambrosi et al, 2007). Sin embargo, en la banda gástrica
laparoscópica (LAGB) los niveles circulantes de OPN aumentan, a pesar de ser
una técnica sin componente malabsortivo y sin que se produzca la
alcalinización del estómago. Este aumento podría ser debido al efecto de la
ghrelina ya que, al contrario de lo que sucede en el RYGBP y en la SG, la
ghrelina aumenta tras la LAGB (Frühbeck et al, 2004; Schindler et al, 2004;
Foschi et al, 2008). En este sentido, varios estudios han mostrado que la
ghrelina estimula la producción de OPN (Li et al, 2005; Wang et al, 2011), lo
cual podría explicar el aumento en los niveles de OPN tras la LAGB.
Estudios previos han demostrado que la OPN está estrechamente
implicada en la inflamación asociada con la obesidad y con el desarrollo de
resistencia a la insulina (Nomiyama et al, 2007; Bertola et al, 2009; Chapman et
al, 2010; Kiefer et al, 2010; Kiefer et al, 2011; Lancha et al, 2012). En este
sentido, observamos una correlación positiva de los niveles circulantes de OPN
con las concentraciones de insulina y el HOMA. Asimismo, se observó una
correlación positiva del cambio de los niveles de OPN con el cambio en los
niveles de fibrinógeno y una correlación negativa del cambio de los niveles de
OPN con el cambio en el índice cuantitativo insulino-sensibilidad (QUICKI) en
los pacientes sometidos a RYGBP. Por otra parte, en los pacientes sometidos a
SG se observó una correlación positiva de los niveles plasmáticos de la OPN
con el HOMA y una correlación negativa con el QUICKI. Por lo tanto, nuestros

Discusión
147
datos sugieren que los pacientes sometidos a CB con altos niveles circulantes
de OPN presentan una mayor resistencia a la insulina y un peor perfil
inflamatorio.
La CB mejora el perfil inflamatorio de los pacientes obesos, sin embargo,
ciertos marcadores proinflamatorios no varían o incluso aumentan, tal y como
hemos observado con los niveles circulantes de OPN en humanos. Por
ejemplo, TNFα y sICAM-1 disminuyen significativamente con la restricción
calórica, mientras que no muestran cambios en los pacientes sometidos a CB
(Forsythe et al, 2008; Tziomalos et al, 2010). Por tanto, como se ha comentado
anteriormente, se necesita investigar más para comprender el diferente
comportamiento de la OPN circulante en humanos tras la pérdida de peso por
restricción calórica o CB, así como las diferencias encontradas entre las
diferentes técnicas quirúrgicas.
Por tanto, estos resultados muestran que las concentraciones
plasmáticas de OPN aumentan en los pacientes sometidos a RYGBP, mientras
que no se encuentran diferencias en los pacientes sometidos a SG. El cambio
en los niveles de OPN podría estar relacionado con cambios en el metabolismo
óseo, sugiriendo que la OPN está involucrada en la reducción de masa ósea
que experimentan los pacientes sometidos a RYGBP.
En resumen, nuestros resultados sugieren que la OPN podría ser un
objetivo terapeútico atractivo para el tratamiento de la obesidad y de sus
comorbilidades. Sin embargo, se necesitan más investigaciones para
comprender mejor los mecanismos mediante los cuales la OPN participa en el
desarrollo de la obesidad, así como para profundizar en los cambios en las
concentraciones de OPN tras la CB.


CONCLUSIONES

Conclusiones
151
1. La deficiencia de OPN previene el aumento de WAT y de peso corporal
provocado por la HFD en ratones.
2. Los ratones OPN-KO alimentados con una HFD presentan menor estrés
oxidativo y una menor remodelación de la matriz extracelular en el tejido
adiposo.
3. La ausencia de OPN disminuye la inflamación y la fibrosis inducidas por la
HFD en el tejido adiposo y en el hígado.
4. Los ratones deficientes en OPN alimentados con la HFD muestran una
mayor sensibilidad a la insulina, al presentar menores niveles de glucemia
e insulinemia y una menor curva de glucosa en el IPITT.
5. La deficiencia de OPN previene la esteatosis hepática en ratones
sometidos a una HFD.
6. La carencia de OPN mejora la estructura del BAT y aumenta la
termogénesis bajo una HFD.
7. Las concentraciones séricas de OPN no varían tras la SG en ratas.
8. El cambio en la alimentación de una HFD a una ND en ratas revierte los
niveles aumentados de OPN en el tejido adiposo, sin embargo, la CB no
aporta beneficio adicional alguno.
9. La expresión de OPN hepática en ratas no resulta afectada ni por la HFD
ni por la SG.

Conclusiones
152
10. Los niveles plasmáticos de OPN en humanos aumentan tras el RYGBP,
pero no tras la SG.
11. Los cambios en la OPN circulante en humanos están relacionados con
cambios en marcadores de metabolismo óseo.

BIBLIOGRAFÍA


Bibliografía
155
1. Alberti KG, Eckel RH, Grundy SM, Zimmet PZ, Cleeman JI, Donato KA, Fruchart JC, James WP, Loria CM and Smith SC, Jr. Harmonizing the metabolic syndrome: a joint interim statement of the International Diabetes Federation Task Force on Epidemiology and Prevention; National Heart, Lung, and Blood Institute; American Heart Association; World Heart Federation; International Atherosclerosis Society; and International Association for the Study of Obesity. Circulation 2009;120:1640-5.
2. Angulo P. NAFLD, obesity, and bariatric surgery. Gastroenterology 2006;130:1848-52.
3. Arafat HA, Katakam AK, Chipitsyna G, Gong Q, Vancha AR, Gabbeta J and Dafoe DC. Osteopontin protects the islets and β-cells from interleukin-1 β-mediated cytotoxicity through negative feedback regulation of nitric oxide. Endocrinology 2007;148:575-84.
4. Ashizawa N, Graf K, Do YS, Nunohiro T, Giachelli CM, Meehan WP, Tuan TL and Hsueh WA. Osteopontin is produced by rat cardiac fibroblasts and mediates A(II)-induced DNA synthesis and collagen gel contraction. J Clin Invest 1996;98:2218-27.
5. Ashkar S, Weber GF, Panoutsakopoulou V, Sanchirico ME, Jansson M, Zawaideh S, Rittling SR, Denhardt DT, Glimcher MJ and Cantor H. Eta-1 (osteopontin): an early component of type-1 (cell-mediated) immunity. Science 2000;287:860-4.
6. Atkins K, Berry JE, Zhang WZ, Harris JF, Chambers AF, Simpson RU and Somerman MJ. Coordinate expression of OPN and associated receptors during monocyte/macrophage differentiation of HL-60 cells. J Cell Physiol 1998;175:229-37.
7. Bartelt A and Heeren J. Adipose tissue browning and metabolic health. Nat Rev Endocrinol 2014;10:24-36.
8. Berk PD. Regulatable fatty acid transport mechanisms are central to the pathophysiology of obesity, fatty liver, and metabolic syndrome. Hepatology 2008;48:1362-76.
9. Bertola A, Deveaux V, Bonnafous S, Rousseau D, Anty R, Wakkach A, Dahman M, Tordjman J, Clement K, McQuaid SE, Frayn KN, Huet PM, Gugenheim J, Lotersztajn S, Le Marchand-Brustel Y, Tran A and Gual P. Elevated expression of osteopontin may be related to adipose tissue macrophage accumulation and liver steatosis in morbid obesity. Diabetes 2009;58:125-33.
10. Borkham-Kamphorst E, Drews F and Weiskirchen R. Induction of lipocalin-2 expression in acute and chronic experimental liver injury moderated by pro-inflammatory cytokines interleukin-1β through nuclear factor-κ B activation. Liver Int 2011;31:656-65.

Bibliografía
156
11. Boskey AL, Spevak L, Paschalis E, Doty SB and McKee MD. Osteopontin deficiency increases mineral content and mineral crystallinity in mouse bone. Calcif Tissue Int 2002;71:145-54.
12. Bouloumie A, Sengenes C, Portolan G, Galitzky J and Lafontan M. Adipocyte produces matrix metalloproteinases 2 and 9: involvement in adipose differentiation. Diabetes 2001;50:2080-6.
13. Bruemmer D, Collins AR, Noh G, Wang W, Territo M, Arias-Magallona S, Fishbein MC, Blaschke F, Kintscher U, Graf K, Law RE and Hsueh WA. Angiotensin II-accelerated atherosclerosis and aneurysm formation is attenuated in osteopontin-deficient mice. J Clin Invest 2003;112:1318-31.
14. Buback F, Renkl AC, Schulz G and Weiss JM. Osteopontin and the skin: multiple emerging roles in cutaneous biology and pathology. Exp Dermatol 2009;18:750-9.
15. Bulfone-Paus S and Paus R. Osteopontin as a new player in mast cell biology. Eur J Immunol 2008;38:338-41.
16. Camara Y, Mampel T, Armengol J, Villarroya F and Dejean L. UCP3 expression in liver modulates gene expression and oxidative metabolism in response to fatty acids, and sensitizes mitochondria to permeability transition. Cell Physiol Biochem 2009;24:243-52.
17. Canales BK, Reyes L, Reinhard MK, Khan SR, Goncalves CG and Meguid MM. Renal glomerular and tubular injury after gastric bypass in obese rats. Nutrition 2012;28:76-80.
18. Cannon B and Nedergaard J. Brown adipose tissue thermogenesis in neonatal and cold-adapted animals. Biochem Soc Trans 1986;14:233-6.
19. Cannon B and Nedergaard J. Brown adipose tissue: function and physiological significance. Physiol Rev 2004;84:277-359.
20. Cao DX, Li ZJ, Jiang XO, Lum YL, Khin E, Lee NP, Wu GH and Luk JM. Osteopontin as potential biomarker and therapeutic target in gastric and liver cancers. World J Gastroenterol 2012;18:3923-30.
21. Cao J, Hawkins E, Brozinick J, Liu X, Zhang H, Burn P and Shi Y. A predominant role of acyl-CoA:monoacylglycerol acyltransferase-2 in dietary fat absorption implicated by tissue distribution, subcellular localization, and up-regulation by high fat diet. J Biol Chem 2004;279:18878-86.
22. Catalán V, Gómez-Ambrosi J, Ramírez B, Rotellar F, Pastor C, Silva C, Rodríguez A, Gil MJ, Cienfuegos JA and Frühbeck G. Proinflammatory cytokines in obesity: impact of type 2 diabetes mellitus and gastric bypass. Obes Surg 2007;17:1464-74.
23. Catalán V, Gómez-Ambrosi J, Rodríguez A, Ramírez B, Silva C, Rotellar F, Gil MJ, Cienfuegos JA, Salvador J and Frühbeck G. Increased adipose tissue expression of lipocalin-2 in obesity is related to inflammation and matrix
Bibliografía
157
metalloproteinase-2 and metalloproteinase-9 activities in humans. J Mol Med (Berl) 2009;87:803-13.
24. Catalán V, Gómez-Ambrosi J, Rodríguez A and Frühbeck G. Role of extracellular matrix remodelling in adipose tissue pathophysiology: relevance in the development of obesity. Histol Histopathol 2012;27:1515-28.
25. Chabas D, Baranzini SE, Mitchell D, Bernard CC, Rittling SR, Denhardt DT, Sobel RA, Lock C, Karpuj M, Pedotti R, Heller R, Oksenberg JR and Steinman L. The influence of the proinflammatory cytokine, osteopontin, on autoimmune demyelinating disease. Science 2001;294:1731-5.
26. Chapman J, Miles PD, Ofrecio JM, Neels JG, Yu JG, Resnik JL, Wilkes J, Talukdar S, Thapar D, Johnson K and Sears DD. Osteopontin is required for the early onset of high fat diet-induced insulin resistance in mice. PLoS One 2010;5:e13959.
27. Chavey C, Mari B, Monthouel MN, Bonnafous S, Anglard P, Van Obberghen E and Tartare-Deckert S. Matrix metalloproteinases are differentially expressed in adipose tissue during obesity and modulate adipocyte differentiation. J Biol Chem 2003;278:11888-96.
28. Chellaiah MA, Kizer N, Biswas R, Alvarez U, Strauss-Schoenberger J, Rifas L, Rittling SR, Denhardt DT and Hruska KA. Osteopontin deficiency produces osteoclast dysfunction due to reduced CD44 surface expression. Mol Biol Cell 2003;14:173-89.
29. Cinti S, Mitchell G, Barbatelli G, Murano I, Ceresi E, Faloia E, Wang S, Fortier M, Greenberg AS and Obin MS. Adipocyte death defines macrophage localization and function in adipose tissue of obese mice and humans. J Lipid Res 2005;46:2347-55.
30. Clark JM, Alkhuraishi AR, Solga SF, Alli P, Diehl AM and Magnuson TH. Roux-en-Y gastric bypass improves liver histology in patients with non-alcoholic fatty liver disease. Obes Res 2005;13:1180-6.
31. Coates PS, Fernstrom JD, Fernstrom MH, Schauer PR and Greenspan SL. Gastric bypass surgery for morbid obesity leads to an increase in bone turnover and a decrease in bone mass. J Clin Endocrinol Metab 2004;89:1061-5.
32. Costford SR, Chaudhry SN, Crawford SA, Salkhordeh M and Harper ME. Long-term high-fat feeding induces greater fat storage in mice lacking UCP3. Am J Physiol Endocrinol Metab 2008;295:E1018-24.
33. Cottam DR, Mattar SG, Barinas-Mitchell E, Eid G, Kuller L, Kelley DE and Schauer PR. The chronic inflammatory hypothesis for the morbidity associated with morbid obesity: implications and effects of weight loss. Obes Surg 2004;14:589-600.
34. Cusi K. Role of obesity and lipotoxicity in the development of nonalcoholic steatohepatitis: pathophysiology and clinical implications. Gastroenterology 2012;142:711-725.
Bibliografía
158
35. Cypess AM, Lehman S, Williams G, Tal I, Rodman D, Goldfine AB, Kuo FC, Palmer EL, Tseng YH, Doria A, Kolodny GM and Kahn CR. Identification and importance of brown adipose tissue in adult humans. N Engl J Med 2009;360:1509-17.
36. Cypess AM, White AP, Vernochet C, Schulz TJ, Xue R, Sass CA, Huang TL, Roberts-Toler C, Weiner LS, Sze C, Chacko AT, Deschamps LN, Herder LM, Truchan N, Glasgow AL, Holman AR, Gavrila A, Hasselgren PO, Mori MA, Molla M and Tseng YH. Anatomical localization, gene expression profiling and functional characterization of adult human neck brown fat. Nat Med 2013;19:635-9.
37. Dai N, Bao Q, Lu A and Li J. Protein expression of osteopontin in tumor tissues is an independent prognostic indicator in gastric cancer. Oncology 2007;72:89-96.
38. Deitel M, Crosby RD and Gagner M. The First International Consensus Summit for Sleeve Gastrectomy (SG), New York City, October 25-27, 2007. Obes Surg 2008;18:487-96.
39. Deitel M, Gagner M, Erickson AL and Crosby RD. Third International Summit: Current status of sleeve gastrectomy. Surg Obes Relat Dis 2011;7:749-59.
40. DeMaria EJ. Bariatric surgery for morbid obesity. N Engl J Med 2007;356:2176-83.
41. Denhardt DT and Guo X. Osteopontin: a protein with diverse functions. FASEB J 1993;7:1475-82.
42. Després JP, Lemieux I and Prud'homme D. Treatment of obesity: need to focus on high risk abdominally obese patients. BMJ 2001;322:716-20.
43. Diao H, Kon S, Iwabuchi K, Kimura C, Morimoto J, Ito D, Segawa T, Maeda M, Hamuro J, Nakayama T, Taniguchi M, Yagita H, Van Kaer L, Onoe K, Denhardt D, Rittling S and Uede T. Osteopontin as a mediator of NKT cell function in T cell-mediated liver diseases. Immunity 2004;21:539-50.
44. Dirksen C, Jorgensen NB, Bojsen-Moller KN, Jacobsen SH, Hansen DL, Worm D, Holst JJ and Madsbad S. Mechanisms of improved glycaemic control after Roux-en-Y gastric bypass. Diabetologia 2012;55:1890-901.
45. Dixon JB, Bhathal PS and O'Brien PE. Nonalcoholic fatty liver disease: predictors of nonalcoholic steatohepatitis and liver fibrosis in the severely obese. Gastroenterology 2001;121:91-100.
46. Dixon JB, Straznicky NE, Lambert EA, Schlaich MP and Lambert GW. Laparoscopic adjustable gastric banding and other devices for the management of obesity. Circulation 2012;126:774-85.
47. Donath MY and Shoelson SE. Type 2 diabetes as an inflammatory disease. Nat Rev Immunol 2011;11:98-107.

Bibliografía
159
48. Duval C, Thissen U, Keshtkar S, Accart B, Stienstra R, Boekschoten MV, Roskams T, Kersten S and Muller M. Adipose tissue dysfunction signals progression of hepatic steatosis towards nonalcoholic steatohepatitis in C57BL/6 mice. Diabetes 2010;59:3181-91.
49. Elder KA and Wolfe BM. Bariatric surgery: a review of procedures and outcomes. Gastroenterology 2007;132:2253-71.
50. El-Tanani MK, Campbell FC, Kurisetty V, Jin D, McCann M and Rudland PS. The regulation and role of osteopontin in malignant transformation and cancer. Cytokine Growth Factor Rev 2006;17:463-74.
51. Feldmann HM, Golozoubova V, Cannon B and Nedergaard J. UCP1 ablation induces obesity and abolishes diet-induced thermogenesis in mice exempt from thermal stress by living at thermoneutrality. Cell Metab 2009;9:203-9.
52. Fierabracci A, Biro PA, Yiangou Y, Mennuni C, Luzzago A, Ludvigsson J, Cortese R and Bottazzo GF. Osteopontin is an autoantigen of the somatostatin cells in human islets: identification by screening random peptide libraries with sera of patients with insulin-dependent diabetes mellitus. Vaccine 1999;18:342-54.
53. Flegal KM, Kit BK, Orpana H and Graubard BI. Association of all-cause mortality with overweight and obesity using standard body mass index categories: a systematic review and meta-analysis. JAMA 2013;309:71-82.
54. Folli F, Sabowitz BN, Schwesinger W, Fanti P, Guardado-Mendoza R and Muscogiuri G. Bariatric surgery and bone disease: from clinical perspective to molecular insights. Int J Obes (Lond) 2012;36:1373-9.
55. Forsythe CE, Phinney SD, Fernandez ML, Quann EE, Wood RJ, Bibus DM, Kraemer WJ, Feinman RD and Volek JS. Comparison of low fat and low carbohydrate diets on circulating fatty acid composition and markers of inflammation. Lipids 2008;43:65-77.
56. Foschi D, Corsi F, Colombo F, Vago T, Bevilaqua M, Rizzi A and Trabucchi E. Different effects of vertical banded gastroplasty and Roux-en-Y gastric bypass on meal inhibition of ghrelin secretion in morbidly obese patients. J Invest Surg 2008;21:77-81.
57. Frezza EE, Chiriva-Internati M and Wachtel MS. Analysis of the results of sleeve gastrectomy for morbid obesity and the role of ghrelin. Surg Today 2008;38:481-3.
58. Fried M, Yumuk V, Oppert JM, Scopinaro N, Torres AJ, Weiner R, Yashkov Y and Frühbeck G. Interdisciplinary European Guidelines on metabolic and bariatric surgery. Obes Facts 2013;6:449-68.
59. Fried M, Yumuk V, Oppert JM, Scopinaro N, Torres A, Weiner R, Yashkov Y and Frühbeck G. Interdisciplinary European guidelines on metabolic and bariatric surgery. Obes Surg 2014;24:42-55.

Bibliografía
160
60. Frühbeck G, Gómez-Ambrosi J, Muruzábal FJ and Burrell MA. The adipocyte: a model for integration of endocrine and metabolic signaling in energy metabolism regulation. Am J Physiol Endocrinol Metab 2001;280:E827-47.
61. Frühbeck G, Díez Caballero A and Gil MJ. Fundus functionality and ghrelin concentrations after bariatric surgery. N Engl J Med 2004;350:308-9.
62. Frühbeck G. Overview of adipose tissue and its role in obesity and metabolic disorders. Methods Mol Biol 2008;456:1-22.
63. Frühbeck G, Becerril S, Sáinz N, Garrastachu P and García-Velloso MJ. BAT: a new target for human obesity? Trends Pharmacol Sci 2009;30:387-96.
64. Frühbeck G and Gómez-Ambrosi J. Adipose Tissue: Structure, Function and Metabolism. In: Caballero B. (ed.) Encyclopedia of Human Nutrition, third edition, 2013;Volume 1:1-13. Waltham, MA: Academic Press.
65. Furger KA, Menon RK, Tuck AB, Bramwell VH and Chambers AF. The functional and clinical roles of osteopontin in cancer and metastasis. Curr Mol Med 2001;1:621-32.
66. Furukawa S, Fujita T, Shimabukuro M, Iwaki M, Yamada Y, Nakajima Y, Nakayama O, Makishima M, Matsuda M and Shimomura I. Increased oxidative stress in obesity and its impact on metabolic syndrome. J Clin Invest 2004;114:1752-61.
67. Georgiadou P, Iliodromitis EK, Varounis C, Mavroidis M, Kolokathis F, Andreadou I, Psarras S, Capetanaki Y, Boudoulas H and Kremastinos DT. Relationship between plasma osteopontin and oxidative stress in patients with coronary artery disease. Expert Opin Ther Targets 2008;12:917-20.
68. Gerstenfeld LC. Osteopontin in skeletal tissue homeostasis: An emerging picture of the autocrine/paracrine functions of the extracellular matrix. J Bone Miner Res 1999;14:850-5.
69. Giralt M and Villarroya F. White, brown, beige/brite: different adipose cells for different functions? Endocrinology 2013;154:2992-3000.
70. Gómez JM, Vilarrasa N, Masdevall C, Pujol J, Solano E, Soler J, Elio I, Gallart L and Vendrell J. Regulation of bone mineral density in morbidly obese women: a cross-sectional study in two cohorts before and after bypass surgery. Obes Surg 2009;19:345-50.
71. Gómez-Ambrosi J, Salvador J, Rotellar F, Silva C, Catalán V, Rodríguez A, Jesus Gil M and Frühbeck G. Increased serum amyloid A concentrations in morbid obesity decrease after gastric bypass. Obes Surg 2006;16:262-9.
72. Gómez-Ambrosi J, Catalán V, Ramírez B, Rodríguez A, Colina I, Silva C, Rotellar F, Mugueta C, Gil MJ, Cienfuegos JA, Salvador J and Frühbeck G. Plasma osteopontin levels and expression in adipose tissue are increased in obesity. J Clin Endocrinol Metab 2007;92:3719-27.

Bibliografía
161
73. Gómez-Ambrosi J, Silva C, Galofré JC, Escalada J, Santos S, Millán D, Vila N, Ibanez P, Gil MJ, Valentí V, Rotellar F, Ramírez B, Salvador J and Frühbeck G. Body mass index classification misses subjects with increased cardiometabolic risk factors related to elevated adiposity. Int J Obes (Lond) 2012;36:286-94.
74. Gong Q, Chipitsyna G, Gray CF, Anandanadesan R and Arafat HA. Expression and regulation of osteopontin in type 1 diabetes. Islets 2009;1:34-41.
75. Goossens GH. The role of adipose tissue dysfunction in the pathogenesis of obesity-related insulin resistance. Physiol Behav 2008;94:206-18.
76. Grundy SM, Brewer HB, Jr., Cleeman JI, Smith SC, Jr. and Lenfant C. Definition of metabolic syndrome: Report of the National Heart, Lung, and Blood Institute/American Heart Association conference on scientific issues related to definition. Circulation 2004;109:433-8.
77. Gutiérrez-Fisac JL, Guallar-Castillón P, León-Munoz LM, Graciani A, Banegas JR and Rodríguez-Artalejo F. Prevalence of general and abdominal obesity in the adult population of Spain, 2008-2010: the ENRICA study. Obes Rev 2012;13:388-92.
78. Hagiwara S, Gohda T, Tanimoto M, Ito T, Murakoshi M, Ohara I, Yamazaki T, Matsumoto M, Horikoshi S, Funabiki K and Tomino Y. Effects of pyridoxamine (K-163) on glucose intolerance and obesity in high-fat diet C57BL/6J mice. Metabolism 2009;58:934-45.
79. Halberg N, Khan T, Trujillo ME, Wernstedt-Asterholm I, Attie AD, Sherwani S, Wang ZV, Landskroner-Eiger S, Dineen S, Magalang UJ, Brekken RA and Scherer PE. Hypoxia-inducible factor 1alpha induces fibrosis and insulin resistance in white adipose tissue. Mol Cell Biol 2009;29:4467-83.
80. Hamamoto S, Nomura S, Yasui T, Okada A, Hirose M, Shimizu H, Itoh Y, Tozawa K and Kohri K. Effects of impaired functional domains of osteopontin on renal crystal formation: Analyses of OPN transgenic and OPN knockout mice. J Bone Miner Res 2010;25:2712-23.
81. Helmlinger G, Yuan F, Dellian M and Jain RK. Interstitial pH and pO2 gradients in solid tumors in vivo: high-resolution measurements reveal a lack of correlation. Nat Med 1997;3:177-82.
82. Hotamisligil GS. Inflammation and metabolic disorders. Nature 2006;444:860-7.
83. Hübscher SG. Histological assessment of non-alcoholic fatty liver disease. Histopathology 2006;49:450-65.
84. Hunter GK, Hauschka PV, Poole AR, Rosenberg LC and Goldberg HA. Nucleation and inhibition of hydroxyapatite formation by mineralized tissue proteins. Biochem J 1996;317:59-64.
85. Hurtado del Pozo CH, Calvo RM, Vesperinas-García G, Gómez-Ambrosi J, Frühbeck G, Rubio MA and Obregón MJ. Expression profile in omental and
Bibliografía
162
subcutaneous adipose tissue from lean and obese subjects. Repression of lipolytic and lipogenic genes. Obes Surg 2011;21:633-43.
86. Irita J, Okura T, Jotoku M, Nagao T, Enomoto D, Kurata M, Desilva VR, Miyoshi K, Matsui Y, Uede T, Denhardt DT, Rittiling SR and Higaki J. Osteopontin deficiency protects against aldosterone-induced inflammation, oxidative stress, and interstitial fibrosis in the kidney. Am J Physiol Renal Physiol 2011;301:F833-44.
87. Isa S, Kawaguchi T, Teramukai S, Minato K, Ohsaki Y, Shibata K, Yonei T, Hayashibara K, Fukushima M, Kawahara M, Furuse K and Mack PC. Serum osteopontin levels are highly prognostic for survival in advanced non-small cell lung cancer: results from JMTO LC 0004. J Thorac Oncol 2009;4:1104-10.
88. Isoda K, Nishikawa K, Kamezawa Y, Yoshida M, Kusuhara M, Moroi M, Tada N and Ohsuzu F. Osteopontin plays an important role in the development of medial thickening and neointimal formation. Circ Res 2002;91:77-82.
89. Jespersen NZ, Larsen TJ, Peijs L, Daugaard S, Homoe P, Loft A, de Jong J, Mathur N, Cannon B, Nedergaard J, Pedersen BK, Moller K and Scheele C. A classical brown adipose tissue mRNA signature partly overlaps with brite in the supraclavicular region of adult humans. Cell Metab 2013;17:798-805.
90. Jones JR, Barrick C, Kim KA, Lindner J, Blondeau B, Fujimoto Y, Shiota M, Kesterson RA, Kahn BB and Magnuson MA. Deletion of PPARγ in adipose tissues of mice protects against high fat diet-induced obesity and insulin resistance. Proc Natl Acad Sci U S A 2005;102:6207-12.
91. Jump DB, Botolin D, Wang Y, Xu J, Christian B and Demeure O. Fatty acid regulation of hepatic gene transcription. J Nutr 2005;135:2503-6.
92. Kang HS, Liao G, DeGraff LM, Gerrish K, Bortner CD, Garantziotis S and Jetten AM. CD44 plays a critical role in regulating diet-induced adipose inflammation, hepatic steatosis, and insulin resistance. PLoS One 2013;8:e58417.
93. Katakam AK, Chipitsyna G, Gong Q, Vancha AR, Gabbeta J and Arafat HA. Streptozotocin (STZ) mediates acute upregulation of serum and pancreatic osteopontin (OPN): a novel islet-protective effect of OPN through inhibition of STZ-induced nitric oxide production. J Endocrinol 2005;187:237-47.
94. Katz DP, Lee SR, Nachiappan AC, Willis MH, Bray CD, Farinas CA, Whigham CJ and Spiegel F. Laparoscopic sleeve gastrectomy: a guide to postoperative anatomy and complications. Abdom Imaging 2011;36:363-71.
95. Kavukcuoglu NB, Denhardt DT, Guzelsu N and Mann AB. Osteopontin deficiency and aging on nanomechanics of mouse bone. J Biomed Mater Res A 2007;83:136-44.
96. Kazanecki CC, Uzwiak DJ and Denhardt DT. Control of osteopontin signaling and function by post-translational phosphorylation and protein folding. J Cell Biochem 2007;102:912-24.

Bibliografía
163
97. Kelley DE, McKolanis TM, Hegazi RA, Kuller LH and Kalhan SC. Fatty liver in type 2 diabetes mellitus: relation to regional adiposity, fatty acids, and insulin resistance. Am J Physiol Endocrinol Metab 2003;285:E906-16.
98. Khan T, Muise ES, Iyengar P, Wang ZV, Chandalia M, Abate N, Zhang BB, Bonaldo P, Chua S and Scherer PE. Metabolic dysregulation and adipose tissue fibrosis: role of collagen VI. Mol Cell Biol 2009;29:1575-91.
99. Kiefer FW, Zeyda M, Todoric J, Huber J, Geyeregger R, Weichhart T, Aszmann O, Ludvik B, Silberhumer GR, Prager G and Stulnig TM. Osteopontin expression in human and murine obesity: extensive local up-regulation in adipose tissue but minimal systemic alterations. Endocrinology 2008;149:1350-7.
100. Kiefer FW, Zeyda M, Gollinger K, Pfau B, Neuhofer A, Weichhart T, Saemann MD, Geyeregger R, Schlederer M, Kenner L and Stulnig TM. Neutralization of osteopontin inhibits obesity-induced inflammation and insulin resistance. Diabetes 2010;59:935-46.
101. Kiefer FW, Neschen S, Pfau B, Legerer B, Neuhofer A, Kahle M, Hrabe de Angelis M, Schlederer M, Mair M, Kenner L, Plutzky J, Zeyda M and Stulnig TM. Osteopontin deficiency protects against obesity-induced hepatic steatosis and attenuates glucose production in mice. Diabetologia 2011;54:2132-42.
102. Kim J, Ki SS, Lee SD, Han CJ, Kim YC, Park SH, Cho SY, Hong YJ, Park HY, Lee M, Jung HH, Lee KH and Jeong SH. Elevated plasma osteopontin levels in patients with hepatocellular carcinoma. Am J Gastroenterol 2006;101:2051-9.
103. Kodama K, Horikoshi M, Toda K, Yamada S, Hara K, Irie J, Sirota M, Morgan AA, Chen R, Ohtsu H, Maeda S, Kadowaki T and Butte AJ. Expression-based genome-wide association study links the receptor CD44 in adipose tissue with type 2 diabetes. Proc Natl Acad Sci U S A 2012;109:7049-54.
104. Koh A, da Silva AP, Bansal AK, Bansal M, Sun C, Lee H, Glogauer M, Sodek J and Zohar R. Role of osteopontin in neutrophil function. Immunology 2007;122:466-75.
105. Kohan M, Breuer R and Berkman N. Osteopontin induces airway remodeling and lung fibroblast activation in a murine model of asthma. Am J Respir Cell Mol Biol 2009;41:290-6.
106. Komorowski J, Jankiewicz-Wika J, Kolomecki K, Cywinski J, Piestrzeniewicz K, Swietoslawski J and Stepien H. Systemic blood osteopontin, endostatin, and E-selectin concentrations after vertical banding surgery in severely obese adults. Cytokine 2011;55:56-61.
107. Konno S, Eckman JA, Plunkett B, Li X, Berman JS, Schroeder J and Huang SK. Interleukin-10 and Th2 cytokines differentially regulate osteopontin expression in human monocytes and dendritic cells. J Interferon Cytokine Res 2006;26:562-7.

Bibliografía
164
108. Kwon HJ, Won YS, Yoon WK, Nam KH, Kim DY and Kim HC. The role of osteopontin in d-galactosamine-induced liver injury in genetically obese mice. Toxicol Appl Pharmacol 2010;242:344-51.
109. Lage R, Dieguez C, Vidal-Puig A and Lopez M. AMPK: a metabolic gauge regulating whole-body energy homeostasis. Trends Mol Med 2008;14:539-49.
110. Lai CF, Seshadri V, Huang K, Shao JS, Cai J, Vattikuti R, Schumacher A, Loewy AP, Denhardt DT, Rittling SR and Towler DA. An osteopontin-NADPH oxidase signaling cascade promotes pro-matrix metalloproteinase 9 activation in aortic mesenchymal cells. Circ Res 2006;98:1479-89.
111. Lancha A, Frühbeck G and Gómez-Ambrosi J. Peripheral signalling involved in energy homeostasis control. Nutr Res Rev 2012;25:223-48.
112. Law IK, Xu A, Lam KS, Berger T, Mak TW, Vanhoutte PM, Liu JT, Sweeney G, Zhou M, Yang B and Wang Y. Lipocalin-2 deficiency attenuates insulin resistance associated with aging and obesity. Diabetes 2010;59:872-82.
113. Lenga Y, Koh A, Perera AS, McCulloch CA, Sodek J and Zohar R. Osteopontin expression is required for myofibroblast differentiation. Circ Res 2008;102:319-27.
114. Li GZ, Jiang W, Zhao J, Pan CS, Cao J, Tang CS and Chang L. Ghrelin blunted vascular calcification in vivo and in vitro in rats. Regul Pept 2005;129:167-76.
115. Liaw L, Birk DE, Ballas CB, Whitsitt JS, Davidson JM and Hogan BL. Altered wound healing in mice lacking a functional osteopontin gene (spp1). J Clin Invest 1998;101:1468-78.
116. Lichtinghagen R, Musholt PB, Lein M, Romer A, Rudolph B, Kristiansen G, Hauptmann S, Schnorr D, Loening SA and Jung K. Different mRNA and protein expression of matrix metalloproteinases 2 and 9 and tissue inhibitor of metalloproteinases 1 in benign and malignant prostate tissue. Eur Urol 2002;42:398-406.
117. Lima-Cabello E, García-Mediavilla MV, Miquilena-Colina ME, Vargas-Castrillón J, Lozano-Rodríguez T, Fernández-Bermejo M, Olcoz JL, González-Gallego J, García-Monzón C and Sánchez-Campos S. Enhanced expression of pro-inflammatory mediators and liver X-receptor-regulated lipogenic genes in non-alcoholic fatty liver disease and hepatitis C. Clin Sci (Lond) 2011;120:239-50.
118. Liu H, Chen A, Guo F and Yuan L. A short-hairpin RNA targeting osteopontin downregulates MMP-2 and MMP-9 expressions in prostate cancer PC-3 cells. Cancer Lett 2010;295:27-37.
119. Lo L, McLennan SV, Williams PF, Bonner J, Chowdhury S, McCaughan GW, Gorrell MD, Yue DK and Twigg SM. Diabetes is a progression factor for hepatic fibrosis in a high fat fed mouse obesity model of non-alcoholic steatohepatitis. J Hepatol 2010;55:435-44.

Bibliografía
165
120. Lorenzen J, Kramer R, Kliem V, Bode-Boeger SM, Veldink H, Haller H, Fliser D and Kielstein JT. Circulating levels of osteopontin are closely related to glomerular filtration rate and cardiovascular risk markers in patients with chronic kidney disease. Eur J Clin Invest 2010;40:294-300.
121. Lorenzen JM, Hafer C, Faulhaber-Walter R, Kumpers P, Kielstein JT, Haller H and Fliser D. Osteopontin predicts survival in critically ill patients with acute kidney injury. Nephrol Dial Transplant 2011;26:531-7.
122. Lund SA, Giachelli CM and Scatena M. The role of osteopontin in inflammatory processes. J Cell Commun Signal 2009;3:311-22.
123. Lund SA, Wilson CL, Raines EW, Tang J, Giachelli CM and Scatena M. Osteopontin mediates macrophage chemotaxis via α4 and α9 integrins and survival via the α4 integrin. J Cell Biochem 2013;114:1194-202.
124. Marchesini G, Brizi M, Bianchi G, Tomassetti S, Bugianesi E, Lenzi M, McCullough AJ, Natale S, Forlani G and Melchionda N. Nonalcoholic fatty liver disease: a feature of the metabolic syndrome. Diabetes 2001;50:1844-50.
125. Martín M, Burrell MA, Gómez-Ambrosi J, Valentí V, Bueno A, Ramírez B, Becerril S, Lancha A, del Sol Calderón P, Méndez-Giménez L, Catalán V, Rodríguez A, Fernández S, Muñoz-Navas M, Cienfuegos JA and Frühbeck G. Short- and long-term changes in gastric morphology and histopathology following sleeve gastrectomy in diet-induced obese rats. Obes Surg 2012;22:634-40.
126. Mathurin P, González F, Kerdraon O, Leteurtre E, Arnalsteen L, Hollebecque A, Louvet A, Dharancy S, Cocq P, Jany T, Boitard J, Deltenre P, Romon M and Pattou F. The evolution of severe steatosis after bariatric surgery is related to insulin resistance. Gastroenterology 2006;130:1617-24.
127. Matsui Y, Rittling SR, Okamoto H, Inobe M, Jia N, Shimizu T, Akino M, Sugawara T, Morimoto J, Kimura C, Kon S, Denhardt D, Kitabatake A and Uede T. Osteopontin deficiency attenuates atherosclerosis in female apolipoprotein E-deficient mice. Arterioscler Thromb Vasc Biol 2003;23:1029-34.
128. Matsui Y, Jia N, Okamoto H, Kon S, Onozuka H, Akino M, Liu L, Morimoto J, Rittling SR, Denhardt D, Kitabatake A and Uede T. Role of osteopontin in cardiac fibrosis and remodeling in angiotensin II-induced cardiac hypertrophy. Hypertension 2004;43:1195-201.
129. Matsusue K. A physiological role for fat specific protein 27/cell death-inducing DFF45-like effector C in adipose and liver. Biol Pharm Bull 2010;33:346-50.
130. Matsuzawa-Nagata N, Takamura T, Ando H, Nakamura S, Kurita S, Misu H, Ota T, Yokoyama M, Honda M, Miyamoto K and Kaneko S. Increased oxidative stress precedes the onset of high-fat diet-induced insulin resistance and obesity. Metabolism 2008;57:1071-7.

Bibliografía
166
131. Mazzali M, Kipari T, Ophascharoensuk V, Wesson JA, Johnson R and Hughes J. Osteopontin-a molecule for all seasons. QJM 2002;95:3-13.
132. McKee MD and Nanci A. Osteopontin: an interfacial extracellular matrix protein in mineralized tissues. Connect Tissue Res 1996;35:197-205.
133. Min W, Shiraga H, Chalko C, Goldfarb S, Krishna GG and Hoyer JR. Quantitative studies of human urinary excretion of uropontin. Kidney Int 1998;53:189-93.
134. Mori R, Shaw TJ and Martin P. Molecular mechanisms linking wound inflammation and fibrosis: knockdown of osteopontin leads to rapid repair and reduced scarring. J Exp Med 2008;205:43-51.
135. Nau K, Fromme T, Meyer CW, von Praun C, Heldmaier G and Klingenspor M. Brown adipose tissue specific lack of uncoupling protein 3 is associated with impaired cold tolerance and reduced transcript levels of metabolic genes. J Comp Physiol B 2008;178:269-77.
136. Nishimura S, Manabe I, Nagasaki M, Hosoya Y, Yamashita H, Fujita H, Ohsugi M, Tobe K, Kadowaki T, Nagai R and Sugiura S. Adipogenesis in obesity requires close interplay between differentiating adipocytes, stromal cells, and blood vessels. Diabetes 2007;56:1517-26.
137. Nomiyama T, Perez-Tilve D, Ogawa D, Gizard F, Zhao Y, Heywood EB, Jones KL, Kawamori R, Cassis LA, Tschop MH and Bruemmer D. Osteopontin mediates obesity-induced adipose tissue macrophage infiltration and insulin resistance in mice. J Clin Invest 2007;117:2877-88.
138. Nugent C and Younossi ZM. Evaluation and management of obesity-related nonalcoholic fatty liver disease. Nat Clin Pract Gastroenterol Hepatol 2007;4:432-41.
139. Nystrom T, Duner P and Hultgardh-Nilsson A. A constitutive endogenous osteopontin production is important for macrophage function and differentiation. Exp Cell Res 2007;313:1149-60.
140. Ogawa D, Stone JF, Takata Y, Blaschke F, Chu VH, Towler DA, Law RE, Hsueh WA and Bruemmer D. Liver x receptor agonists inhibit cytokine-induced osteopontin expression in macrophages through interference with activator protein-1 signaling pathways. Circ Res 2005;96:e59-67.
141. Ogden CL, Carroll MD, Kit BK and Flegal KM. Prevalence of childhood and adult obesity in the United States, 2011-2012. JAMA 2014;311:806-14.
142. O'Hara A, Lim FL, Mazzatti DJ and Trayhurn P. Microarray analysis identifies matrix metalloproteinases (MMPs) as key genes whose expression is up-regulated in human adipocytes by macrophage-conditioned medium. Pflugers Arch 2009;458:1103-14.
143. Okamoto H. Osteopontin and cardiovascular system. Mol Cell Biochem 2007;300:1-7.

Bibliografía
167
144. Oliver E, McGillicuddy F, Phillips C, Toomey S and Roche HM. The role of inflammation and macrophage accumulation in the development of obesity-induced type 2 diabetes mellitus and the possible therapeutic effects of long-chain n-3 PUFA. Proc Nutr Soc 2010;69:232-43.
145. Ophascharoensuk V, Giachelli CM, Gordon K, Hughes J, Pichler R, Brown P, Liaw L, Schmidt R, Shankland SJ, Alpers CE, Couser WG and Johnson RJ. Obstructive uropathy in the mouse: role of osteopontin in interstitial fibrosis and apoptosis. Kidney Int 1999;56:571-80.
146. O'Regan A. The role of osteopontin in lung disease. Cytokine Growth Factor Rev 2003;14:479-88.
147. O'Regan AW, Chupp GL, Lowry JA, Goetschkes M, Mulligan N and Berman JS. Osteopontin is associated with T cells in sarcoid granulomas and has T cell adhesive and cytokine-like properties in vitro. J Immunol 1999;162:1024-31.
148. O'Regan AW, Hayden JM, Body S, Liaw L, Mulligan N, Goetschkes M and Berman JS. Abnormal pulmonary granuloma formation in osteopontin-deficient mice. Am J Respir Crit Care Med 2001;164:2243-7.
149. Padwal RS and Majumdar SR. Drug treatments for obesity: orlistat, sibutramine, and rimonabant. Lancet 2007;369:71-7.
150. Pardo A, Gibson K, Cisneros J, Richards TJ, Yang Y, Becerril C, Yousem S, Herrera I, Ruiz V, Selman M and Kaminski N. Up-regulation and profibrotic role of osteopontin in human idiopathic pulmonary fibrosis. PLoS Med 2005;2:e251.
151. Patouraux S, Bonnafous S, Voican CS, Anty R, Saint-Paul MC, Rosenthal-Allieri MA, Agostini H, Njike M, Barri-Ova N, Naveau S, Le Marchand-Brustel Y, Veillon P, Cales P, Perlemuter G, Tran A and Gual P. The osteopontin level in liver, adipose tissue and serum is correlated with fibrosis in patients with alcoholic liver disease. PLoS One 2012;7:e35612.
152. Patsouris D, Li PP, Thapar D, Chapman J, Olefsky JM and Neels JG. Ablation of CD11c-positive cells normalizes insulin sensitivity in obese insulin resistant animals. Cell Metab 2008;8:301-9.
153. Prasse A, Stahl M, Schulz G, Kayser G, Wang L, Ask K, Yalcintepe J, Kirschbaum A, Bargagli E, Zissel G, Kolb M, Muller-Quernheim J, Weiss JM and Renkl AC. Essential role of osteopontin in smoking-related interstitial lung diseases. Am J Pathol 2009;174:1683-91.
154. Rangaswami H, Bulbule A and Kundu GC. Osteopontin: role in cell signaling and cancer progression. Trends Cell Biol 2006;16:79-87.
155. Riedl M, Vila G, Maier C, Handisurya A, Shakeri-Manesch S, Prager G, Wagner O, Kautzky-Willer A, Ludvik B, Clodi M and Luger A. Plasma osteopontin increases after bariatric surgery and correlates with markers of bone turnover but not with insulin resistance. J Clin Endocrinol Metab 2008;93:2307-12.

Bibliografía
168
156. Rittling SR and Chambers AF. Role of osteopontin in tumour progression. Br J Cancer 2004;90:1877-81.
157. Rittling SR. Osteopontin in macrophage function. Expert Rev Mol Med 2011;13:e15.
158. Rodrigues LR, Teixeira JA, Schmitt FL, Paulsson M and Lindmark-Mansson H. The role of osteopontin in tumor progression and metastasis in breast cancer. Cancer Epidemiol Biomarkers Prev 2007;16:1087-97.
159. Rodríguez A, Catalán V, Gómez-Ambrosi J, García-Navarro S, Rotellar F, Valentí V, Silva C, Gil MJ, Salvador J, Burrell MA, Calamita G, Malagón MM and Frühbeck G. Insulin- and leptin-mediated control of aquaglyceroporins in human adipocytes and hepatocytes is mediated via the PI3K/Akt/mTOR signaling cascade. J Clin Endocrinol Metab 2011;96:E586-97.
160. Rodríguez A, Becerril S, Valentí V, Moncada R, Méndez-Giménez L, Ramírez B, Lancha A, Martín M, Burrell MA, Catalán V, Gómez-Ambrosi J and Frühbeck G. Short-term effects of sleeve gastrectomy and caloric restriction on blood pressure in diet-induced obese rats. Obes Surg 2012a;22:1481-90.
161. Rodríguez A, Becerril S, Valentí V, Ramírez B, Martín M, Méndez-Giménez L, Lancha A, del Sol Calderon P, Catalán V, Burrell MA, Gómez-Ambrosi J and Frühbeck G. Sleeve gastrectomy reduces blood pressure in obese (fa/fa) Zucker rats. Obes Surg 2012b;22:309-15.
162. Rollo EE, Laskin DL and Denhardt DT. Osteopontin inhibits nitric oxide production and cytotoxicity by activated RAW264.7 macrophages. J Leukoc Biol 1996;60:397-404.
163. Ross R and Bradshaw AJ. The future of obesity reduction: beyond weight loss. Nat Rev Endocrinol 2009;5:319-25.
164. Rudland PS, Platt-Higgins A, El-Tanani M, De Silva Rudland S, Barraclough R, Winstanley JH, Howitt R and West CR. Prognostic significance of the metastasis-associated protein osteopontin in human breast cancer. Cancer Res 2002;62:3417-27.
165. Sabo-Attwood T, Ramos-Nino ME, Eugenia-Ariza M, Macpherson MB, Butnor KJ, Vacek PC, McGee SP, Clark JC, Steele C and Mossman BT. Osteopontin modulates inflammation, mucin production, and gene expression signatures after inhalation of asbestos in a murine model of fibrosis. Am J Pathol 2011;178:1975-85.
166. Sahai A, Malladi P, Melin-Aldana H, Green RM and Whitington PF. Upregulation of osteopontin expression is involved in the development of nonalcoholic steatohepatitis in a dietary murine model. Am J Physiol Gastrointest Liver Physiol 2004;287:G264-73.
167. Scatena M, Liaw L and Giachelli CM. Osteopontin: a multifunctional molecule regulating chronic inflammation and vascular disease. Arterioscler Thromb Vasc Biol 2007;27:2302-9.
Bibliografía
169
168. Schaller G, Aso Y, Schernthaner GH, Kopp HP, Inukai T, Kriwanek S and Schernthaner G. Increase of osteopontin plasma concentrations after bariatric surgery independent from inflammation and insulin resistance. Obes Surg 2009;19:351-6.
169. Schernthaner G and Morton JM. Bariatric surgery in patients with morbid obesity and type 2 diabetes. Diabetes Care 2008;31 Suppl 2:S297-302.
170. Schindler K, Prager G, Ballaban T, Kretschmer S, Riener R, Buranyi B, Maier C, Luger A and Ludvik B. Impact of laparoscopic adjustable gastric banding on plasma ghrelin, eating behaviour and body weight. Eur J Clin Invest 2004;34:549-54.
171. Schranz DB and Lernmark A. Immunology in diabetes: an update. Diabetes Metab Rev 1998;14:3-29.
172. Scott WR and Batterham RL. Roux-en-Y gastric bypass and laparoscopic sleeve gastrectomy: understanding weight loss and improvements in type 2 diabetes after bariatric surgery. Am J Physiol Regul Integr Comp Physiol 2011;301:R15-27.
173. Senese R, Valli V, Moreno M, Lombardi A, Busiello RA, Cioffi F, Silvestri E, Goglia F, Lanni A and de Lange P. Uncoupling protein 3 expression levels influence insulin sensitivity, fatty acid oxidation, and related signaling pathways. Pflugers Arch 2010;461:153-64.
174. Senger DR, Wirth DF and Hynes RO. Transformed mammalian cells secrete specific proteins and phosphoproteins. Cell 1979;16:885-93.
175. Sharp LZ, Shinoda K, Ohno H, Scheel DW, Tomoda E, Ruiz L, Hu H, Wang L, Pavlova Z, Gilsanz V and Kajimura S. Human BAT possesses molecular signatures that resemble beige/brite cells. PLoS One 2012;7:e49452.
176. Shevde LA, Das S, Clark DW and Samant RS. Osteopontin: an effector and an effect of tumor metastasis. Curr Mol Med 2010;10:71-81.
177. Shi H, Kokoeva MV, Inouye K, Tzameli I, Yin H and Flier JS. TLR4 links innate immunity and fatty acid-induced insulin resistance. J Clin Invest 2006;116:3015-25.
178. Shinohara ML, Jansson M, Hwang ES, Werneck MB, Glimcher LH and Cantor H. T-bet-dependent expression of osteopontin contributes to T cell polarization. Proc Natl Acad Sci U S A 2005;102:17101-6.
179. Shinohara ML, Kim JH, Garcia VA and Cantor H. Engagement of the type I interferon receptor on dendritic cells inhibits T helper 17 cell development: role of intracellular osteopontin. Immunity 2008;29:68-78.
180. Simoes DC, Xanthou G, Petrochilou K, Panoutsakopoulou V, Roussos C and Gratziou C. Osteopontin deficiency protects against airway remodeling and hyperresponsiveness in chronic asthma. Am J Respir Crit Care Med 2009;179:894-902.
Bibliografía
170
181. Skurk T, Alberti-Huber C, Herder C and Hauner H. Relationship between adipocyte size and adipokine expression and secretion. J Clin Endocrinol Metab 2007;92:1023-33.
182. Stemmer K, Bielohuby M, Grayson BE, Begg DP, Chambers AP, Neff C, Woods SC, Erben RG, Tschöp MH, Bidlingmaier M, Clemens TL and Seeley RJ. Roux-en-Y gastric bypass surgery but not vertical sleeve gastrectomy decreases bone mass in male rats. Endocrinology 2013;154:2015-24.
183. Suganami T, Tanimoto-Koyama K, Nishida J, Itoh M, Yuan X, Mizuarai S, Kotani H, Yamaoka S, Miyake K, Aoe S, Kamei Y and Ogawa Y. Role of the Toll-like receptor 4/NF-kappaB pathway in saturated fatty acid-induced inflammatory changes in the interaction between adipocytes and macrophages. Arterioscler Thromb Vasc Biol 2007;27:84-91.
184. Sun K, Kusminski CM and Scherer PE. Adipose tissue remodeling and obesity. J Clin Invest 2011;121:2094-101.
185. Susztak K, Bottinger E, Novetsky A, Liang D, Zhu Y, Ciccone E, Wu D, Dunn S, McCue P and Sharma K. Molecular profiling of diabetic mouse kidney reveals novel genes linked to glomerular disease. Diabetes 2004;53:784-94.
186. Syn WK, Choi SS, Liaskou E, Karaca GF, Agboola KM, Oo YH, Mi Z, Pereira TA, Zdanowicz M, Malladi P, Chen Y, Moylan C, Jung Y, Bhattacharya SD, Teaberry V, Omenetti A, Abdelmalek MF, Guy CD, Adams DH, Kuo PC, Michelotti GA, Whitington PF and Diehl AM. Osteopontin is induced by hedgehog pathway activation and promotes fibrosis progression in nonalcoholic steatohepatitis. Hepatology 2011;53:106-15.
187. Syn WK, Agboola KM, Swiderska M, Michelotti GA, Liaskou E, Pang H, Xie G, Philips G, Chan IS, Karaca GF, Pereira Tde A, Chen Y, Mi Z, Kuo PC, Choi SS, Guy CD, Abdelmalek MF and Diehl AM. NKT-associated hedgehog and osteopontin drive fibrogenesis in non-alcoholic fatty liver disease. Gut 2012;61:1323-9.
188. Tacken PJ, Hofker MH, Havekes LM and van Dijk KW. Living up to a name: the role of the VLDL receptor in lipid metabolism. Curr Opin Lipidol 2001;12:275-9.
189. Takahashi A, Kurokawa M, Konno S, Ito K, Kon S, Ashino S, Nishimura T, Uede T, Hizawa N, Huang SK and Nishimura M. Osteopontin is involved in migration of eosinophils in asthma. Clin Exp Allergy 2009;39:1152-9.
190. Tesauro M and Cardillo C. Obesity, blood vessels and metabolic syndrome. Acta Physiol (Oxf) 2011;203:279-86.
191. Thoms JW, Dal Pra A, Anborgh PH, Christensen E, Fleshner N, Menard C, Chadwick K, Milosevic M, Catton C, Pintilie M, Chambers AF and Bristow RG. Plasma osteopontin as a biomarker of prostate cancer aggression: relationship to risk category and treatment response. Br J Cancer 2012;107:840-6.
Bibliografía
171
192. Thurner PJ, Chen CG, Ionova-Martin S, Sun L, Harman A, Porter A, Ager JW, 3rd, Ritchie RO and Alliston T. Osteopontin deficiency increases bone fragility but preserves bone mass. Bone 2010;46:1564-73.
193. Towler DA, Bidder M, Latifi T, Coleman T and Semenkovich CF. Diet-induced diabetes activates an osteogenic gene regulatory program in the aortas of low density lipoprotein receptor-deficient mice. J Biol Chem 1998;273:30427-34.
194. Trayhurn P and Wood IS. Adipokines: inflammation and the pleiotropic role of white adipose tissue. Br J Nutr 2004;92:347-55.
195. Trayhurn P. Hypoxia and adipose tissue function and dysfunction in obesity. Physiol Rev 2013;93:1-21.
196. Tziomalos K, Dimitroula HV, Katsiki N, Savopoulos C and Hatzitolios AI. Effects of lifestyle measures, antiobesity agents, and bariatric surgery on serological markers of inflammation in obese patients. Mediators Inflamm 2010;2010:364957.
197. Urso ML, Wang R, Zambraski EJ and Liang BT. Adenosine A3 receptor stimulation reduces muscle injury following physical trauma and is associated with alterations in the MMP/TIMP response. J Appl Physiol 2012;112:658-70.
198. Valentí V, Martín M, Ramírez B, Gómez-Ambrosi J, Rodríguez A, Catalán V, Becerril S, Lancha A, Fernández S, Cienfuegos JA, Burrell MA and Frühbeck G. Sleeve gastrectomy induces weight loss in diet-induced obese rats even if high-fat feeding is continued. Obes Surg 2011;21:1438-43.
199. Van Hee RH. Biliopancreatic diversion in the surgical treatment of morbid obesity. World J Surg 2004;28:435-44.
200. Van Hul M and Lijnen HR. Effect of weight loss on gelatinase levels in obese mice. Clin Exp Pharmacol Physiol 2011;38:647-9.
201. Virtanen KA, Lidell ME, Orava J, Heglind M, Westergren R, Niemi T, Taittonen M, Laine J, Savisto NJ, Enerback S and Nuutila P. Functional brown adipose tissue in healthy adults. N Engl J Med 2009;360:1518-25.
202. Wai PY and Kuo PC. The role of osteopontin in tumor metastasis. J Surg Res 2004;121:228-41.
203. Wang F, Jiang T, Tang C, Su Z, Zhang N and Li G. Ghrelin reduces rat myocardial calcification induced by nicotine and vitamin D3 in vivo. Int J Mol Med 2011;28:513-9.
204. Wang X, Cheng M, Zhao M, Ge A, Guo F, Zhang M, Yang Y, Liu L and Yang N. Differential effects of high-fat-diet rich in lard oil or soybean oil on osteopontin expression and inflammation of adipose tissue in diet-induced obese rats. Eur J Nutr 2012;52:1181-9.

Bibliografía
172
205. Weber CE, Li NY, Wai PY and Kuo PC. Epithelial-mesenchymal transition, TGF-β, and osteopontin in wound healing and tissue remodeling after injury. J Burn Care Res 2012;33:311-8.
206. Weber GF, Ashkar S, Glimcher MJ and Cantor H. Receptor-ligand interaction between CD44 and osteopontin (Eta-1). Science 1996;271:509-12.
207. Weber GF, Zawaideh S, Hikita S, Kumar VA, Cantor H and Ashkar S. Phosphorylation-dependent interaction of osteopontin with its receptors regulates macrophage migration and activation. J Leukoc Biol 2002;72:752-61.
208. Weiss JM, Renkl AC, Maier CS, Kimmig M, Liaw L, Ahrens T, Kon S, Maeda M, Hotta H, Uede T and Simon JC. Osteopontin is involved in the initiation of cutaneous contact hypersensitivity by inducing Langerhans and dendritic cell migration to lymph nodes. J Exp Med 2001;194:1219-29.
209. Wolak T, Kim H, Ren Y, Kim J, Vaziri ND and Nicholas SB. Osteopontin modulates angiotensin II-induced inflammation, oxidative stress, and fibrosis of the kidney. Kidney Int 2009;76:32-43.
210. Wood IS, de Heredia FP, Wang B and Trayhurn P. Cellular hypoxia and adipose tissue dysfunction in obesity. Proc Nutr Soc 2009;68:370-7.
211. Wu J, Bostrom P, Sparks LM, Ye L, Choi JH, Giang AH, Khandekar M, Virtanen KA, Nuutila P, Schaart G, Huang K, Tu H, van Marken Lichtenbelt WD, Hoeks J, Enerback S, Schrauwen P and Spiegelman BM. Beige adipocytes are a distinct type of thermogenic fat cell in mouse and human. Cell 2012;150:366-76.
212. Wüthrich RP. The complex role of osteopontin in renal disease. Nephrol Dial Transplant 1998;13:2448-50.
213. Xanthou G, Alissafi T, Semitekolou M, Simoes DC, Economidou E, Gaga M, Lambrecht BN, Lloyd CM and Panoutsakopoulou V. Osteopontin has a crucial role in allergic airway disease through regulation of dendritic cell subsets. Nat Med 2007;13:570-8.
214. Xie Y, Sakatsume M, Nishi S, Narita I, Arakawa M and Gejyo F. Expression, roles, receptors, and regulation of osteopontin in the kidney. Kidney Int 2001;60:1645-57.
215. Xie Z, Singh M and Singh K. Osteopontin modulates myocardial hypertrophy in response to chronic pressure overload in mice. Hypertension 2004;44:826-31.
216. Xu X, Grijalva A, Skowronski A, van Eijk M, Serlie MJ and Ferrante AW, Jr. Obesity activates a program of lysosomal-dependent lipid metabolism in adipose tissue macrophages independently of classic activation. Cell Metab 2013;18:816-30.
217. Xu ZJ, Fan JG, Ding XD, Qiao L and Wang GL. Characterization of high-fat, diet-induced, non-alcoholic steatohepatitis with fibrosis in rats. Dig Dis Sci 2010;55:931-40.

Bibliografía
173
218. Yanovski SZ and Yanovski JA. Long-term drug treatment for obesity: a systematic and clinical review. Jama 2014;311:74-86.
219. Yilmaz Y, Ozturk O, Alahdab YO, Senates E, Colak Y, Doganay HL, Coskunpinar E, Oltulu YM, Eren F, Atug O, Tuncer I and Imeryuz N. Serum osteopontin levels as a predictor of portal inflammation in patients with nonalcoholic fatty liver disease. Dig Liver Dis 2012;45:58-62.
220. Yu W, Cline M, Maxwell LG, Berrigan D, Rodriguez G, Warri A and Hilakivi-Clarke L. Dietary vitamin D exposure prevents obesity-induced increase in endometrial cancer in Pten+/- mice. Cancer Prev Res (Phila) 2010;3:1246-58.
221. Zelber-Sagi S, Ratziu V and Oren R. Nutrition and physical activity in NAFLD: an overview of the epidemiological evidence. World J Gastroenterol 2011;17:3377-89.
222. Zeyda M, Gollinger K, Todoric J, Kiefer FW, Keck M, Aszmann O, Prager G, Zlabinger GJ, Petzelbauer P and Stulnig TM. Osteopontin is an activator of human adipose tissue macrophages and directly affects adipocyte function. Endocrinology 2011;152:2219-27.
223. Zhang A, Liu Y, Shen Y, Xu Y, Li X. Osteopontin silencing by small interfering RNA induces apoptosis and suppresses invasion in human renal carcinoma Caki-1 cells. Med Oncol 2009;27:1179-84.
224. Zhang L, Peng X, Zhang Z, Feng Y, Jia X, Shi Y, Yang H, Zhang X, Liu L, Yin L and Yuan Z. Subcellular proteome analysis unraveled annexin A2 related to immune liver fibrosis. J Cell Biochem 2010;110:219-28.
225. Zhivkova-Galunska M, Adwan H, Eyol E, Kleeff J, Kolb A, Bergmann F and Berger MR. Osteopontin but not osteonectin favors the metastatic growth of pancreatic cancer cell lines. Cancer Biol Ther 2010;10:54-64.


OTRAS PUBLICACIONES
RELACIONADAS


Otras publicaciones relacionadas
177
ARTÍCULO 1: Physiology and pathophysiology
of aquaporins


Otras publicaciones relacionadas
179
En este artículo se realiza una revisión exhaustiva sobre la fisiología de las
acuaporinas, entre ellas la AQP7, una proteína que es analizada en el hígado
en nuestro estudio en ratones, encontrando menores niveles de expresión en
los deficientes en OPN.


Re vie w
Received 2 July 2010, accepted 1 August 2010.Correspondence to: Dr Amaia Rodríguez, Metabolic Research Laboratory, University of Navarra, Irunlarrea 1, 31008 Pamplona, Spain. Tel.: +34 948 42 56 00 (ext. 6544), Fax: +34 948 42 56 52, E-mail: [email protected]
AbstractAquaporins (AQPs) are water channels that facilitate a rapid transport of water, across cell membranes. in some cases, these pores are also permeated by small solutes, par-ticularly glycerol. Thirteen aquaporins (AQP0-12) have been identified so far in mam-malian tissues. The disruption of the genes encoding aquaporins in transgenic mice has revealed their implication in physiological and pathophysiological processes, in-cluding renal water absorption, neural function, digestion, tumour angiogenesis, and reproduction. A subset of aquaporins that transport both water and glycerol, the ‘aqua-glyceroporins’, regulate glycerol content in epidermal, fat and other tissues, and are involved in skin hydration, fat metabolism and gluconeogenesis. Better understanding of the exact mechanisms and regulation of aquaporins might be useful for designing potential drug targets against different metabolic disorders, such as stroke, glaucoma, brain ooedema, cancer, diabetes and obesity.
Adipobiology 2010; 2:9-22
Keywords: water and glycerol transport, transgenic knockout mice, human diseases
AdipobiologyISSN 1313-3705© Bul garian Society for Cell Biology
Physiology And PAthoPhysiology of AquAPorins
Amaia Rodríguez1,4, Victoria Catalán1,4, Sara Becerril1,4, Andoni Lancha1,4, Beatriz Ramírez1,4, Javier Salvador2,4, Javier Gómez-Ambrosi1,4, Giovanna Valenti3, Giuseppe Calamita3, and Gema Frühbeck1,2,4
1Metabolic Research Laboratory and 2Department of endocrinology, Clínica Universidad de Navarra, University of Navarra, Pamplona, Spain; 3Department of General and environmental Physiology, University of Bari Aldo Moro, Bari, italy; 4CiBeR Fisiopatología de la Obesidad y Nutrición, instituto de Salud Carlos iii, Spain.
introductionAquaporins are channel-forming in-tegral membrane proteins that allow the movement of water through cell membranes (1). The secondary struc-ture proposed for aquaporins pre-dicted six bilayer-spanning domains and two asparagine-proline-alanine motifs (NPA boxes) that confer selec-tivity for water and/or other solutes (2) (Fig. 1). The three-dimensional structure of aquaporin resembles an hourglass; within the lipid belayed aq-uaporins usually form tetramers, with each monomer defining a single pore. To date, 13 members of the family of aquaporins (AQP0-12) have been identified in different mammalian tis-sues. According to their permeability characteristics, aquaporins can be di-vided into two subgroups: aquaporins (pure water channels) and aquaglyc-eroporins (channels permeated by wa-ter and small solutes, such as glycerol, urea or nitric oxide [NO]) (3). Since their discovery in the early 1990s (4), the functional importance of plasma membrane water channels in mam-malian tissues has been extensively studied by analysing the phenotype of
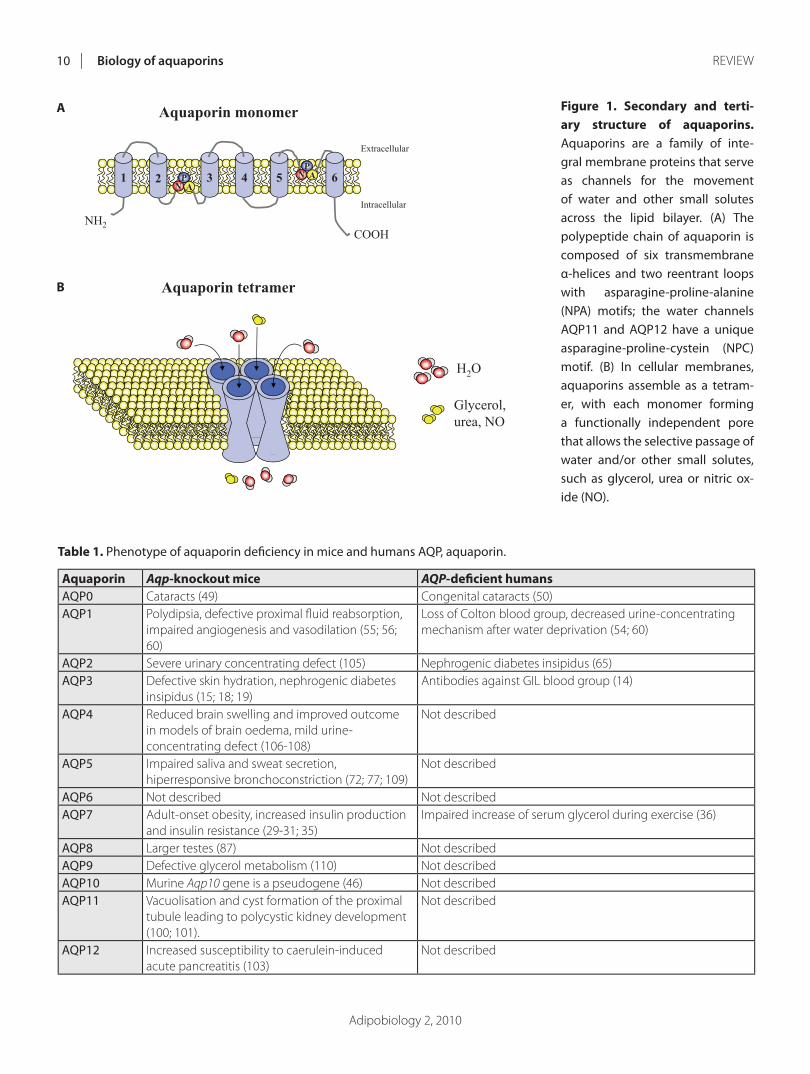
Adipobiology 2, 2010
Biology of aquaporins10 RevIew
Table 1. Phenotype of aquaporin defi ciency in mice and humans AQP, aquaporin.
Aquaporin Aqp-knockout mice AQP-defi cient humansAQP0 Cataracts (49) Congenital cataracts (50)AQP1 Polydipsia, defective proximal fl uid reabsorption,
impaired angiogenesis and vasodilation (55; 56; 60)
Loss of Colton blood group, decreased urine-concentrating mechanism after water deprivation (54; 60)
AQP2 Severe urinary concentrating defect (105) Nephrogenic diabetes insipidus (65)AQP3 Defective skin hydration, nephrogenic diabetes
insipidus (15; 18; 19)Antibodies against GIL blood group (14)
AQP4 Reduced brain swelling and improved outcome in models of brain oedema, mild urine-concentrating defect (106-108)
Not described
AQP5 Impaired saliva and sweat secretion, hiperresponsive bronchoconstriction (72; 77; 109)
Not described
AQP6 Not described Not describedAQP7 Adult-onset obesity, increased insulin production
and insulin resistance (29-31; 35)Impaired increase of serum glycerol during exercise (36)
AQP8 Larger testes (87) Not describedAQP9 Defective glycerol metabolism (110) Not describedAQP10 Murine Aqp10 gene is a pseudogene (46) Not describedAQP11 vacuolisation and cyst formation of the proximal
tubule leading to polycystic kidney development (100; 101).
Not described
AQP12 Increased susceptibility to caerulein-induced acute pancreatitis (103)
Not described
Figure 1. Secondary and terti-ary struc ture of aquaporins. Aquaporins are a family of inte-gral membrane proteins that serve as channels for the movement of water and other small solutes across the lipid bilayer. (A) The polypeptide chain of aquaporin is composed of six transmembrane α-helices and two reentrant loops with asparagine-proline-alanine (NPA) motifs; the water channels AQP11 and AQP12 have a unique asparagine-proline-cystein (NPC) motif. (B) in cellular membranes, aquaporins assemble as a tetram-er, with each monomer forming a functionally independent pore that allows the selective passage of water and/or other small solutes, such as glycerol, urea or nitric ox-ide (NO).
Aquaporin monomer
Aquaporin tetramer
A
B
Fig. 1
H2O
Glycerol,urea, NO
3 4 5
NH2
1 2 6
COOH
Extracellular
Intracellular
NP
AN
PA
A
B
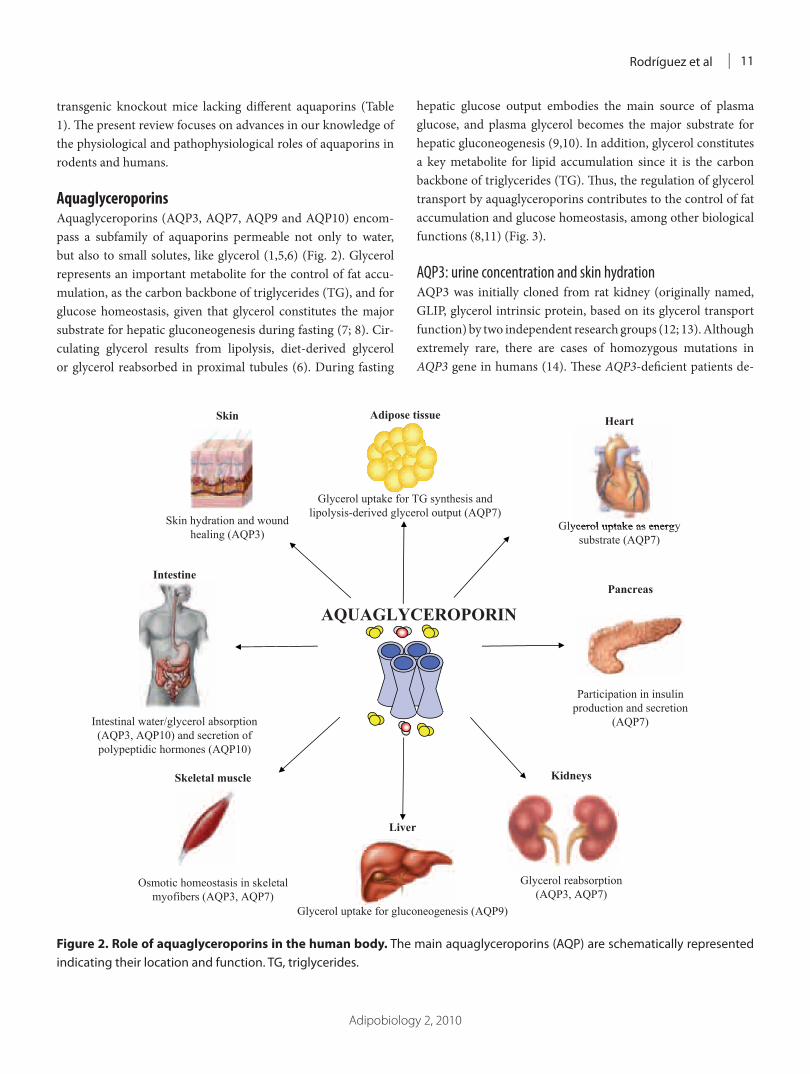
Adipobiology 2, 2010
Rodríguez et al 11
transgenic knockout mice lacking diff erent aquaporins (Table 1). Th e present review focuses on advances in our knowledge of the physiological and pathophysiological roles of aquaporins in rodents and humans.
AquaglyceroporinsAquaglyceroporins (AQP3, AQP7, AQP9 and AQP10) encom-pass a subfamily of aquaporins permeable not only to water, but also to small solutes, like glycerol (1,5,6) (Fig. 2). Glycerol represents an important metabolite for the control of fat accu-mulation, as the carbon backbone of triglycerides (TG), and for glucose homeostasis, given that glycerol constitutes the major substrate for hepatic gluconeogenesis during fasting (7; 8). Cir-culating glycerol results from lipolysis, diet-derived glycerol or glycerol reabsorbed in proximal tubules (6). During fasting
hepatic glucose output embodies the main source of plasma glucose, and plasma glycerol becomes the major substrate for hepatic gluconeogenesis (9,10). In addition, glycerol constitutes a key metabolite for lipid accumulation since it is the carbon backbone of triglycerides (TG). Th us, the regulation of glycerol transport by aquaglyceroporins contributes to the control of fat accumulation and glucose homeostasis, among other biological functions (8,11) (Fig. 3).
AQP3: urine concentration and skin hydrationAQP3 was initially cloned from rat kidney (originally named, GLIP, glycerol intrinsic protein, based on its glycerol transport function) by two independent research groups (12; 13). Although extremely rare, there are cases of homozygous mutations in AQP3 gene in humans (14). Th ese AQP3-defi cient patients de-
Figure 2. Role of aquaglyceroporins in the human body. The main aquaglyceroporins (AQP) are schematically represented indicating their location and function. TG, triglycerides.
Adipose tissue
Glycerol uptake for TG synthesis and lipolysis-derived glycerol output (AQP7)
Skin
Skin hydration and wound healing (AQP3)
Intestine
Intestinal water/glycerol absorption (AQP3, AQP10) and secretion of polypeptidic hormones (AQP10)
Skeletal muscle
Osmotic homeostasis in skeletal myofibers (AQP3, AQP7)
Liver
Glycerol uptake for gluconeogenesis (AQP9)
AQUAGLYCEROPORIN
Heart
Glycerol uptake as energy substrate (AQP7)
Kidneys
Glycerol reabsorption (AQP3, AQP7)
Fig. 2
Pancreas
Participation in insulin production and secretion
(AQP7)
Glycerol uptake as energy

Adipobiology 2, 2010
Biology of aquaporins12 RevIew
veloped antibodies against a new red-blood cell group protein aft er blood transfusion or pregnancy, but the clinical signifi cance of this biological function of AQP3 has not been determined. Until now, most of the studies have been focused on the role of AQP3 in renal water absorption and skin hydration (15,16). In the kidney, AQP3 is expressed in the apical and basolateral membranes of the proximal tubules (12,13). Th is aquaglycero-porin plays a key role in the urinary-concentrating mechanism, since Aqp3 deletion in transgenic mice is associated with neph-rogenic diabetes insipidus development (15). Interestingly, it has been recently reported that a mouse model of type 1 diabetes mellitus shows a decrease in AQP3 in renal inner medulla that serves as a compensatory mechanism to alleviate dehydration in diabetes mellitus (17). In the skin, AQP3 is expressed in kerati-nocytes of the most superfi cial layer, the stratum corneum (16). Mice lacking Aqp3 gene exhibit a reduced skin hydration, and elasticity, together with an impaired reformation of stratum cor-neum and delayed wound healing (18,19). Interestingly, glycerol administration, by topical or systemic routes, has been able to
correct each of the phenotype abnormalities in the skin of Aqp3-defi cient mice (20). Th ese fi ndings suggest that AQP3 plays an important role in skin hydration contributing to glycerol trans-port across the keratinocytes. Th is fact might provide a scientifi c rationale for the long-standing practice of including glycerol in cosmetic and skin medicinal preparations.
AQP7: control of fat accumulationTh e human AQP7 gene, mapped to chromosome 9p13, was cloned from adipose tissue in 1997 (originally named AQPap) (21,22). AQP7 was initially described as an adipose-specifi c glycerol channel, but this pore is also expressed in kidneys, tes-tes, ovaries, heart, gastrointestinal tract, and skeletal muscle (23-28). Th e glycerol channel AQP7 plays a pivotal role in adipose tissue enlargement and function as well as glucose homeostasis, since mice lacking Aqp7 gene have been shown to develop adult-onset obesity and type 2 diabetes mellitus (29-31). Th e main reason for the adipocyte enlargement in Aqp7-defi cient mice is the progressive hypertrophy of fat cells, characterised by larger
Figure 3. Coordinated regulation of adipose AQP7 and hepatic AQP9 in a fasting state. Under circumstances of negative energy balance, triglycerides are hydrolysed by the hormone sensitive lipase (HSL) to glycerol and free fatty acids (FFA) and released to the bloodstream. Glycerol is secreted from the adipose tissue through AQP7, a glycerol channel mainly expressed in adipocytes during late adipogenesis. The hepatic-specifi c AQP9 enables the direct fl ow of glycerol from the portal vein into the liver. in hepatocytes, glycerol is converted to glycerol-3-phosphate by the enzymatic activity of glycerol kinase (GK) for de novo synthesis of glucose. Taken together, the glycerol cascade from adipose tissue to liver is maintained by coordinated regulation of AQP7 and AQP9. PePCK, phosphoenolpyruvate carboxykinase.
bloodstream
AQP7
FFA Glycerol
FABPFATP
CD36
TRIGLYCERIDES
HSL
FFA Glycerol
GK
FFA Glycerol-3-P
Adipocyte
AQP9
Glycerol
Glycerol
GK
Glycerol-3-PPEPCK
Glucose
Glucose
GLUT
Liver
Fig. 3

Adipobiology 2, 2010
Rodríguez et al 13
sized lipid droplets (30,31). In circumstances of negative energy balance, such as fasting or exercise, TG stored in adipocytes are hydrolysed to glycerol and fatty acids by the hormone-sensitive lipase (HSL) and released into the bloodstream (5,32). AQP7 fa-cilitates the secretion of glycerol from adipocytes (Fig. 3). Thus, a defective glycerol exit results in intracellular glycerol accumu-lation. Increased adipocyte glycerol concentrations would then increase TG biosynthesis, resulting in a progressive adipocyte hypertrophy (30).
Insulin represses AQP7 expression in adipocytes through the negative insulin response elements (IRE) in the promoter regions of this gene (33). Insulin-resistant db/db mice states show an increased expression of the fat-specific AQP7 despite their hyperinsulinaemia (34). The increase of this aquaglyc-eroporin in the setting of insulin resistance may be caused by impaired IRS-1-mediated insulin signalling in adipocytes (33; 34). Moreover, it is remarkable that AQP7 is also expressed in pancreatic b cells while mice lacking the Aqp7 gene displayed re-duced b cell mass and insulin content but elevated blood insulin levels (35). Therefore, AQP7 modulates insulin production and secretion, whereas insulin reduces AQP7 expression. This coor-dinated regulation appears to be necessary for the maintenance of insulinemia and glucose homeostasis.
Only a single human case of homozygous mutation in the coding region of the AQP7 gene has been reported up to date (36). This subject was neither obese nor diabetic with the only apparent consequence of this mutation being an impaired glyc-erol increase in response to exercise. Fat depot-specific differ-ences in the gene expression of AQP7 in human obesity have been reported with an overexpression of AQP7 in omental adi-pose tissue suggesting an increase in overall lipolytic capacity, and a repression of AQP7 in subcutaneous fat pointing to the promotion of an intracellular glycerol accumulation and a pro-gressive adipocyte hypertrophy (37-39).
AQP9: regulation of hepatic gluconeogenesisAQP9 was cloned from human peripheral leukocytes, and in the liver, lung and spleen (40). The presence of AQP9 in the liver as well as its negative regulation by insulin opened up a new field of research regarding the role of this aquaglyceroporin in glucose homeostasis (34). During fasting, plasma glycerol is introduced into hepatocytes by the liver-specific aquaglycerop-orin AQP9, where it is converted into glycerol-3-phosphate by the enzymatic activity of glycerol kinase for de novo synthesis of glucose (9) (Fig. 3). After feeding, plasma concentrations of insulin increase and this hormone inhibits the gene expression of Aqp7 in white adipose tissue and that of Aqp9 in liver through the negative insulin response elements (IRE) in the promoter
regions of these genes. Interestingly, the insulin-resistant obese db/db mice exhibit increased transcript levels of the fat-specific Aqp7 and the liver-specific Aqp9, despite their hyperinsulinae-mia. The increase of AQP7 and AQP9 in the setting of insulin resistance may be caused by impaired insulin signalling in adi-pocytes and hepatocytes (33,34). Taken together, under physi-ological conditions, insulin-mediated regulation of AQP7 and AQP9 may account for the increase or decrease of glycerol re-lease from fat and gluconeogenesis in liver, in order to regu-late the glucose production depending on the nutritional state. However, in the context of insulin resistance, the overexpression of AQP7 and AQP9 leads to an increase of plasma glycerol and hepatic glucose production associated with elevated circulating glycerol concentrations, a condition that further aggravates the prevailing hyperglycaemia. It is remarkable that obese patients with type 2 diabetes show a down-regulation of hepatic AQP9 transcript levels that may reflect a reduced glycerol influx into hepatocytes to decrease hepatic gluconeogenesis in an attempt to avoid a further elevation of hyperglycaemia (39,41).
AQP10: intestinal water and glycerol absorptionAQP10 is abundantly expressed in human duodenum, jejunum and ileum, contributing to intestinal water absorption (42,43). For years a paracellular pathway between epithelial cells has been proposed for the transport of water in the intestine. Since the identification of aquaporins in the gastrointestinal tract a transcellular pathway has been suggested, whereby water may pass across the absorptive epithelia via AQP10 (42). Two dif-ferent isoforms of AQP10 have been described to be expressed in human small intestine: AQP10v and AQP10 (44). AQP10v is mainly expressed in the capillary endothelial cells of the small intestinal villi being possibly involved in the transport of water absorbed through the intestinal epithelium into blood. In this sense, it has been shown that AQP10v is down-regulated during acute cholera that may reflect a mechanism to reduce the water permeability of the cell membranes and thus limit the secretory response (45). On the other hand, AQP10 is localised in the cy-toplasm of the gastro-entero-pancreatic (GEP) endocrine cells. In the small intestine, GEP cells secret several hormones, such as somatostatin, gastrin, glucagon, or motilin. The cellular and subcellular localisation of AQP10 suggests that this aquaglyc-eroporin participates in the secretion of polypeptidic hormones from GEP cells. AQP10 exerts an important role in glycerol absorption in the small intestine, due to the fact that Western societies are used to consuming high-fat diets (46). Despite the contribution of AQP10 to intestinal water and glycerol transport in humans, Aqp10 has not been shown to be expressed in mice (46). The murine Aqp10 gene has multiple structure defects lead-
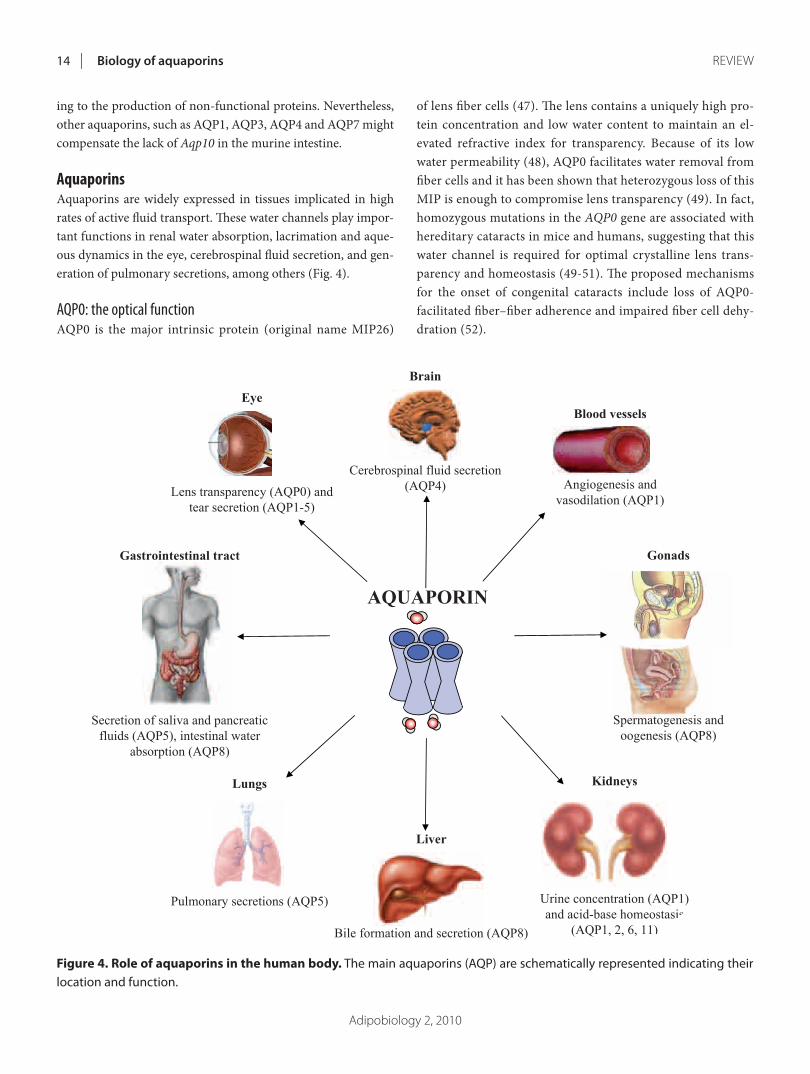
Adipobiology 2, 2010
Biology of aquaporins14 RevIew
ing to the production of non-functional proteins. Nevertheless, other aquaporins, such as AQP1, AQP3, AQP4 and AQP7 might compensate the lack of Aqp10 in the murine intestine.
AquaporinsAquaporins are widely expressed in tissues implicated in high rates of active fl uid transport. Th ese water channels play impor-tant functions in renal water absorption, lacrimation and aque-ous dynamics in the eye, cerebrospinal fl uid secretion, and gen-eration of pulmonary secretions, among others (Fig. 4).
AQP0: the optical functionAQP0 is the major intrinsic protein (original name MIP26)
of lens fi ber cells (47). Th e lens contains a uniquely high pro-tein concentration and low water content to maintain an el-evated refractive index for transparency. Because of its low water permeability (48), AQP0 facilitates water removal from fi ber cells and it has been shown that heterozygous loss of this MIP is enough to compromise lens transparency (49). In fact, homozygous mutations in the AQP0 gene are associated with hereditary cataracts in mice and humans, suggesting that this water channel is required for optimal crystalline lens trans-parency and homeostasis (49-51). Th e proposed mechanisms for the onset of congenital cataracts include loss of AQP0-facilitated fi ber–fi ber adherence and impaired fi ber cell dehy-dration (52).
Figure 4. Role of aquaporins in the human body. The main aquaporins (AQP) are schematically represented indicating their location and function.
Fig. 4
Brain
Cerebrospinal fluid secretion (AQP4)
Eye
Lens transparency (AQP0) and tear secretion (AQP1-5)
Gastrointestinal tract
Secretion of saliva and pancreatic fluids (AQP5), intestinal water
absorption (AQP8)
Lungs
Pulmonary secretions (AQP5)
Liver
Bile formation and secretion (AQP8)
AQUAPORIN
Blood vessels
Angiogenesis and vasodilation (AQP1)
Kidneys
Urine concentration (AQP1) and acid-base homeostasis
(AQP1, 2, 6, 11)
Gonads
Spermatogenesis and oogenesis (AQP8)

Adipobiology 2, 2010
Rodríguez et al 15
AQP1: the fi rst aquaporinTh e identity of aquaporins remained unknown until the dis-covery of a protein associated to the red cell Rh blood group antigens, the AQP1 (originally named CHIP28, channel-like in-tegral protein of 28 kDa) (4,53). AQP1 was described as a water-permeable membrane protein of red blood cells, contributing to the Colton blood group antigen, a minor blood group determi-nant (54). Th e presence of AQP1 in vascular endothelium and its strong expression in proliferating microvessels of human and rat malignant tumours suggested a possible role of this water chan-nel in angiogenesis (55). AQP1 contributes to endothelial cell migration, which is a key process in angiogenesis. In addition, AQP1 participates in NO-dependent relaxation by facilitating NO effl ux from endothelial cells and NO infl ux into vascular smooth muscle cells (56). Th e impaired angiogenesis and en-dothelial-dependent vasodilation in Aqp1 transgenic knockout mice further confi rm these vascular actions of AQP1 (55,56).
Th e high expression of AQP1 at the apical and basolateral membranes of the proximal tubules suggested an essential role in the renal urine-concentrating mechanism (57,58). Transgenic knockout mice lacking the Aqp1 gene had increased urine out-put (polyuria) and decreased urine-concentrating ability (59). Aft er water deprivation for 36 h, Aqp1-defi cient mice became profoundly dehydrated due to their urine-concentrating defect, which further confi rmed that AQP1 is required for the forma-tion of concentrated urine. Humans with a homozygous mu-tation in the AQP1 gene were not polyuric, presenting normal glomerular fi ltration rates, free water clearance, or lithium clear-ance (indices of proximal tubule function) (60). However, it was observed in a controlled clinical study that AQP1-null subjects were unable to concentrate urine aft er 24 h of thirsting. Th us, AQP1-null individuals are at risk for life-threatening clinical problems if they become dehydrated due to renal illness or en-vironmental causes.
AQP2: vasopressin-inducible aquaporinAQP2 was cloned from the apical membrane of kidney-collect-ing tubules (originally named WCH-CD, collecting duct wa-ter channel protein) (61). Renal water reabsorption and urine concentration is an important mechanism to maintain constant plasma osmolarity of the body fl uid compartments. In the kid-ney, AQP2 traffi cking mediates water transport across the api-cal cell membrane in principal cells of the collecting ducts. Th e anti-diuretic hormone vasopressin stimulates its receptors on the principal cells in the collecting ducts of nephron, triggering an increase in cAMP that results in the up-regulation of AQP2, rendering the cell permeable to water and, hence, favouring water reabsorption and urine concentration (62-64). In neph-
rogenic diabetes insipidus, the kidney fails to concentrate urine in response to vasopressin. In this sense, autosomal recessive mutations in the AQP2 human gene has been shown to cause nephrogenic diabetes insipidus (65). Th us, an abnormal up- or down-regulation of the AQP2 water channels in the principal cells seems to be an important pathophysiological factor in the development of concentrating and diluting defects in progres-sive renal disease. In this sense, patients with moderately severe chronic kidney disease have a reduced renal concentrating and diluting capacity compared to patients with milder chronic kid-ney disease as well as healthy control subjects. Th ese phenomena can be attributed, at least partly, to an abnormally decreased re-sponse in the vasopressin-cAMP-AQP2 axis (63).
AQP4: brain functionTh e cloning of AQP4 cDNA from rat brain and lungs (with the original name of the protein being MIWC, mercurial-insensi-tive water channel) was reported by two independent groups (66,67). AQP4 participates in diff erent physiological processes, including the urinary concentrating mechanism or the resolu-tion of alveolar oedema (67). Nonetheless, AQP4 constitutes the predominant water channel in mammalian brain and most of the studies as regards AQP4 have focused on its role in this or-gan (3; 68). Th e brain is composed by two main cell types: neu-rones, which process and transmit information, and glial cells, which maintain the homeostasis of neurones. AQP4 is mainly expressed in glial cells (66). In the blood-brain barrier, AQP4 is present in the astrocyte projections around blood vessels and, at a lower level, in endothelial cells. AQP4 is further expressed at sites of ependymal cells in contact with the brain-cerebros-pinal fl uid barrier. Th is expression pattern indicates that AQP4 is involved in water homeostasis in the brain (69). Phenotype analysis of transgenic mice lacking Aqp4 gene has provided evidence of other roles of this aquaporin, such as the involve-ment in brain oedema, in glial cell migration and in neuronal signal transduction (68). In particular, AQP4 facilitates clini-cally important water movement into and out of the brain in the development and resolution of brain oedema and modulation of AQP4 expression or function is also predicted to modulate glial scar formation, which may be of clinical utility in traumatic injury, tumour and infection. Moreover, recent data suggest an increase in extracellular space volume in AQP4 defi ciency and an impaired K+ reuptake by AQP4-null astrocytes, which may be related to functional signifi cant AQP4-K+ channel interactions (69). It is interesting to note the fi rst case report of a patient with anti-AQP4 antibody who presented with recurrent hypersomnia as the main symptom, symmetrical hypothalamic lesions as well as a reduced orexin (hypocretin) level in the cerebrospinal fl uid

Adipobiology 2, 2010
Biology of aquaporins16 RevIew
(70). Based on the properties of AQP4 in the brain, it has been proposed that regulation of AQP4 might be useful as a novel therapeutic strategy against hydrocephalus, traumatic brain in-jury, epilepsy and stroke (3; 68).
AQP5: saliva, tears and pulmonary secretionsAQP5 was cloned from rat lacrimal, salivary and respiratory tissues (71). AQP5 is implicated in the generation of saliva and tears. In fact, Aqp5 deletion in mice is associated with produc-tion of low volume hypertonic viscous saliva (72). The pres-ence of AQP5 in the acinar cells of lacrimal and salivary glands opened up the hypothesis that abnormalities in AQP5 expres-sion in these secretor glands may occur in patients with pri-mary Sjögren’s syndrome (PSS), an autoimmune disorder that is clinically characterised by dry eyes and mouth (73,74). This hypothesis remains unclear, since other authors discarded a ma-jor role of AQP5 in the pathogenesis of PSS because they did not observe changes in the distribution and expression of AQP5 in patients suffering this disease (75).
The importance of AQP5 to human disease may also include disorders in lung and airways (76). AQP5 is expressed in alveo-lar type I and II cells as well as in the tracheal and bronchial epithelium of mice conferring high osmotic water permeability (71,77). Aqp5-null mice present bronchial hyperactivity after cholinergic stimulation, suggesting a physiological role of AQP5 in modulating airway responsiveness and bronchoconstriction (77). Interestingly, some forms of human asthma have been linked to chromosome 12q close to the site where the AQP5 gene is located. Nevertheless, a role for AQP5 in human asthma has not yet been studied. Moreover, AQP5 has been also implicated in the proliferation and metastasis of lung cancer and its expres-sion is highly increased in human lung adenocarcinomas (78).
AQP6: acid-base homeostasisAQP6 has been cloned from the rat (WCH3) and human (hKID) kidney (79). In glomeruli, AQP6 is present in the mem-brane vesicles within the cell bodies of podocytes, suggesting a possible role in glomerular filtration (80). AQP6 also resides in the intracellular vesicles of acid-secreting α-intercalated cells of the collecting duct of the kidney (80,81). In these vesicles AQP6 colocalizes with the H+-ATPase, a protein that participates in the secretion of acid into the urine. Intercalated cells respond to acid-basic changes by translocating H+-ATPase from the cy-toplasmic vacuoles to the apical plasma membrane, where this ion pump secretes proton from the cells by using ATP supplied by the numerous mitochondria (81). Interestingly, AQP6 per-meates anionic ions, especially nitrate, as well as water (82). In this regard, AQP6 expression in collecting ducts increases in
response to chronic metabolic alkalosis or increased water in-take (83). Thus, AQP6 probably participates in the maintenance of acid-base homeostasis through the regulation of proton ex-cretion by increasing the transport of water through the apical plasma membrane.
AQP8: digestive fluid secretion and reproductive functionThree independent research groups reported the cloning and functional analysis of AQP8 in 1997 (84-86). AQP8 transcript expression has been found in different organs of the digestive system, such as salivary glands, pancreas, liver, gallbladder, small intestine and colon. Several possible functions have been proposed for AQP8, including secretion of saliva and pancre-atic fluid, as well as intestinal fluid absorption/secretion (87). The presence of AQP8 in the hepatobiliary system is important for bile formation and secretion with defective expression of hepatocyte AQP8 contributing to bile secretory dysfunction in cholestasis (88; 89). Bile formation is initiated by hepatocytes and is modified by secretory and absorptive processes in the epi-thelial cells of the intrahepatic ducts and gallbladder. In spite of its intracellular location in hepatocytes, under basal conditions, AQP8 is inserted into the plasma membrane to facilitate the transport of water together with AQP9 in response to hormonal stimuli, such as glucagon (90). The hormone glucagon stimu-lates hepatocyte bile formation and it induces AQP8 vesicle trafficking to the hepatocyte canalicular domain (91). Thus, glu-cagon increases the AQP8-mediated osmotic membrane water permeability, facilitating the movement of a process likely to be relevant to glucagon-induced bile secretion. In the gallbladder, AQP8 and AQP1 also contribute to the water absorption and secretion required for bile formation and secretion (92).
The discovery of AQP8 in testes and ovaries has provided information for better understanding central processes that re-quire water movement in the biology of reproduction (24; 84). In the male reproductive tract AQP8 is uniformly expressed in the Sertoli cells, primary spermatocytes and elongated spermatids of the seminiferous tubules (84; 93). This ontogeny and distribu-tion indicate that AQP8 is involved in the secretion of fluid to form the lumen of seminiferous tubules occurring during testes development and the fluid movements during spermatogenesis and sperm concentration and maturation. On the other hand, several physiological processes need water movement in the female reproductive tract. Oocytogenesis or conversion of the oocyte into the mature ovum requires the formation and expan-sion of the fluid-filled antrum surrounding the cell. The water influx into ovarian antral follicles is mediated by AQP7, 8 and 9 expressed in the granulosa cells (24). Besides its participation in the gametogenesis, AQP8 is also involved in early stages of preg-

Adipobiology 2, 2010
Rodríguez et al 17
nancy (94). The implanting blastocyst expresses both AQP8 and AQP9, probably for fluid/solute transport during the embryo/placental development.
AQP11 and AQP12: the superaquaporinsThe completion of the Human Genome project revealed two more aquaporin-like genes, AQP11 and AQP12 (original names AQPX1 and AQPX2) (95). In contrast to conventional aquapor-ins showing two highly conserved NPA boxes (Fig. 1), AQP11 and AQP12 have a NPA box and a unique asparagine-proline-cystein (NPC) motif (96; 97). AQP11 and AQP12 were grouped as superaquaporins, since they belong to the aquaporin super-family with very low homology to conventional aquaporins.
AQP11 is highly expressed in rat testis while being moderate-ly expressed in the kidney, liver and brain (98). To gain insight into the physiological role of AQP11, a transgenic mice lacking Aqp11 gene was produced by Morishita et al (99). Although Aap11 deletion was not lethal, most knockout mice died be-fore weaning. The cause of death was the advanced renal failure due to vacuolisation and cyst formation of the proximal tubule, leading to polycystic kidney development. To a lesser extent, vacuoles were also observed in other organs (the liver and the small intestine). The vacuoles are mostly originated from the endoplasmic reticulum, suggesting that Aqp11-knockout mice may have intravesicular defects leading to the accumulation of unprocessed substances inside the vacuoles (100,101). Thus, AQP11 seems to play a relevant role in intravesicular homeosta-sis, which is essential for an adequate proximal tubular function.
AQP12 is selectively expressed in the pancreas (95). The exo-crine pancreas has the ability to secrete daily large amounts of fluid into the duodenum (1-2.5 litres of juice containing digestive enzymes in humans). The intracellular localization of AQP12 in pancreatic acinar cells suggests a potential role of this water channel in the maturation and exocytosis of zymogen granules (102). Nevertherless, the deficiency of Aqp12 in transgenic mice did not affect the overall pancreatic exocrine function under a normal breeding environment, but Aqp12-knockout mice showed a more severe pathology resulting from cholecystoki-nin-8 analog-induced pancreatitis than wild type mice (103).
ConclusionThe discovery of aquaporins and the analysis of the phenotype of transgenic mice lacking different aquaporins has led to sub-stantial advances in the life and medical sciences (Table 1) (104). The impaired function of aquaporins has been associated with several human diseases, such as congenital cataracts or neph-rogenic diabetes insipidus. These studies have provided new in-sights into the underlying mechanisms of well-known human
diseases, indicating that pharmacological modulation of water and/or glycerol transport targeting aquaporins may provide novel opportunities for therapeutic interventions in several hu-man disorders. From a clinical point of view, the possibility of regulating the expression of aquaporins in several tissues offers potentially different therapeutic approaches for a number of diseases. In this context, the design of small-molecule modula-tors of aquaporin expression/function may have clinical applica-tions in the therapy of congestive heart failure and hypertension (AQP1 and AQP2 inhibitors), cytotoxic and vasogenic types of brain swelling (AQP4 modulators), obesity (AQP7 up-regula-tors), and tumour angiogenesis (AQP1 inhibitors), among oth-ers. Nonetheless, additional data, related to gene expression and protein stability are needed to better establish a firm mechanistic basis for the involvement of aquaporins in the ethiopathogen-esis of these metabolic disorders. Undoubtedly, aquaporins have broadened our understanding of the implications of water bal-ance as well as water/glycerol transport to mammalian patho-physiology. Given the versatile functions of aquaporins, addi-tional and unexpected roles of these channels are sure to emerge in the coming years.
AcknowledgmentsThis work was funded by the Instituto de Salud Carlos III (FIS PS09/02330 and FIS PI10/01677). CIBER de Fisiopatología de la Obesidad y Nutrición (CIBERobn) is an initiative of the Insti-tuto de Salud Carlos III, Spain.
references1. King LS, Kozono D, Agre P. From structure to disease: the
evolving tale of aquaporin biology. Nat Rev Mol Cell Biol 2004;5:687-698.
2. Jung JS, Preston GM, Smith BL, Guggino WB, Agre P. Molecular structure of the water channel through aquaporin CHIP. The hourglass model. J Biol Chem 1994;269:14648-14654.
3. Benga G. Water channels in membranes. Cell Biol Int 1994;18:829-833.
4. Preston GM, Agre P. Isolation of the cDNA for erythro-cyte integral membrane protein of 28 kilodaltons: mem-ber of an ancient channel family. Proc Natl Acad Sci USA 1991;88:11110-11114.
5. Frühbeck G. Obesity: aquaporin enters the picture. Nature 2005;438:436-437.
6. Rodríguez A, Catalán V, Becerril S, Sáinz N, Salvador J, Gómez-Ambrosi J, Frühbeck G. Aquaporins and their met-abolic implications. Obes Metab 2007;3:58-67.

Adipobiology 2, 2010
Biology of aquaporins18 RevIew
7. Reshef L, Olswang Y, Cassuto H, Blum B, Croniger CM, Kalhan SC, et al. Glyceroneogenesis and the triglyceride/fatty acid cycle. J Biol Chem 2003;278:30413-30416.
8. Rodríguez A, Catalán V, Gómez-Ambrosi J, Frühbeck G. Role of aquaporin-7 in the pathophysiological control of fat accumulation in mice. FEBS Lett 2006;580:4771-4776
9. Reshef L, Olswang Y, Cassuto H, Blum B, Croniger CM, Kalhan SC, Tilghman SM, Hanson RW: Glyceroneogenesis and the triglyceride/fatty acid cycle. J Biol Chem 2003;278:30413-30416
10. MacDougald OA, Burant CF: Obesity and metabolic per-turbations after loss of aquaporin 7, the adipose glycerol transporter. Proc Natl Acad Sci USA 2005;102:10759-10760
11. Maeda N, Funahashi T, Shimomura I: Metabolic impact of adipose and hepatic glycerol channels aquaporin 7 and aq-uaporin 9. Nat Clin Pract Endocrinol Metab 2008;4:627-634
12. Ma T, Frigeri A, Hasegawa H, Verkman AS: Cloning of a wa-ter channel homolog expressed in brain meningeal cells and kidney collecting duct that functions as a stilbene-sensitive glycerol transporter. J Biol Chem 1994;269:21845-21849
13. Echevarria M, Windhager EE, Tate SS, Frindt G: Cloning and expression of AQP3, a water channel from the medul-lary collecting duct of rat kidney. Proc Natl Acad Sci USA 1994;91:10997-11001
14. Roudier N, Ripoche P, Gane P, Le Pennec PY, Daniels G, Cartron JP, Bailly P: AQP3 deficiency in humans and the molecular basis of a novel blood group system, GIL. J Biol Chem 2002;277:45854-45859
15. Ma T, Song Y, Yang B, Gillespie A, Carlson EJ, Epstein CJ, Verkman AS: Nephrogenic diabetes insipidus in mice lack-ing aquaporin-3 water channels. Proc Natl Acad Sci USA 2000;97:4386-4391
16. Hara-Chikuma M, Verkman AS: Aquaporin-3 functions as a glycerol transporter in mammalian skin. Biol Cell 2005;97:479-486
17. Satake M, Ikarashi N, Kagami M, Ogiue N, Toda T, Kobayashi Y, Ochiai W, Sugiyama K: Increases in the ex-pression levels of aquaporin-2 and aquaporin-3 in the re-nal collecting tubules alleviate dehydration associated with polyuria in diabetes mellitus. Biol Pharm Bull 2010;33:1965-1970
18. Ma T, Hara M, Sougrat R, Verbavatz JM, Verkman AS: Impaired stratum corneum hydration in mice lack-ing epidermal water channel aquaporin-3. J Biol Chem 2002;277:17147-17153
19. Hara M, Ma T, Verkman AS: Selectively reduced glycerol in skin of aquaporin-3-deficient mice may account for im-paired skin hydration, elasticity, and barrier recovery. J Biol Chem 2002;277:46616-46621
20. Hara M, Verkman AS: Glycerol replacement corrects de-fective skin hydration, elasticity, and barrier function in aquaporin-3-deficient mice. Proc Natl Acad Sci USA 2003;100:7360-7365
21. Ishibashi K, Kuwahara M, Gu Y, Kageyama Y, Tohsaka A, Suzuki F, et al. Cloning and functional expression of a new water channel abundantly expressed in the testis permeable to water, glycerol, and urea. J Biol Chem 1997;272:20782-20786
22. Ishibashi K, Yamauchi K, Kageyama Y, Saito-Ohara F, Ikeuchi T, Marumo F, et al. Molecular characterization of human Aquaporin-7 gene and its chromosomal mapping. Biochim Biophys Acta 1998;1399:62-66
23. Saito K, Kageyama Y, Okada Y, Kawakami S, Kihara K, Ishibashi K, et al. Localization of aquaporin-7 in human testis and ejaculated sperm: possible involvement in main-tenance of sperm quality. J Urol 2004;172:2073-2076
24. McConnell NA, Yunus RS, Gross SA, Bost KL, Clemens MG, Hughes FM Jr: Water permeability of an ovarian antral follicle is predominantly transcellular and mediated by aq-uaporins. Endocrinology 2002;143:2905-2912
25. Sjöholm K, Palming J, Olofsson LE, Gummesson A, Svensson PA, Lystig TC, et al. A microarray search for genes predominantly expressed in human omental adipocytes: adipose tissue as a major production site of serum amyloid A. J Clin Endocrinol Metab 2005;90:2233-2239
26. Laforenza U, Gastaldi G, Grazioli M, Cova E, Tritto S, Faelli A, et al. Expression and immunolocalization of aquaporin-7 in rat gastrointestinal tract. Biol Cell 2005;97:605-613
27. Wakayama Y, Inoue M, Kojima H, Jimi T, Shibuya S, Hara H, et al. Expression and localization of aquaporin 7 in nor-mal skeletal myofiber. Cell Tissue Res 2004;316:123-129
28. Hibuse T, Maeda N, Nakatsuji H, Tochino Y, Fujita K, Kihara S, et al. The heart requires glycerol as an energy sub-strate through aquaporin 7, a glycerol facilitator. Cardiovasc Res 2009;83:34-41
29. Maeda N, Funahashi T, Hibuse T, Nagasawa A, Kishida K, Kuriyama H, et al: Adaptation to fasting by glycerol trans-port through aquaporin 7 in adipose tissue. Proc Natl Acad Sci USA 2004;101:17801-17806
30. Hara-Chikuma M, Sohara E, Rai T, Ikawa M, Okabe M,

Adipobiology 2, 2010
Rodríguez et al 19
Sasaki S, et al Progressive adipocyte hypertrophy in aq-uaporin-7-deficient mice: adipocyte glycerol permeabil-ity as a novel regulator of fat accumulation. J Biol Chem 2005;280:15493-15496
31. Hibuse T, Maeda N, Funahashi T, Yamamoto K, Nagasawa A, Mizunoya W, et al. Aquaporin 7 deficiency is associated with development of obesity through activation of adipose glycerol kinase. Proc Natl Acad Sci USA 2005;102:10993-10998
32. Frühbeck G, Catalán V, Gómez-Ambrosi J, Rodríguez A: Aquaporin-7 and glycerol permeability as novel obesity drug-target pathways. Trends Pharmacol Sci 2006;27:345-347
33. Kishida K, Shimomura I, Kondo H, Kuriyama H, Makino Y, Nishizawa H, et al. Genomic structure and insulin-mediated repression of the aquaporin adipose (AQPap), adipose-spe-cific glycerol channel. J Biol Chem 2001;276:36251-36260
34. Kuriyama H, Shimomura I, Kishida K, Kondo H, Furuyama N, Nishizawa H, et al. Coordinated regulation of fat-specific and liver-specific glycerol channels, aquaporin adipose and aquaporin 9. Diabetes 2002;51:2915-2921
35. Matsumura K, Chang BH, Fujimiya M, Chen W, Kulkarni RN, Eguchi Y, et al. Aquaporin 7 is a beta-cell protein and regulator of intraislet glycerol content and glycerol kinase activity, beta-cell mass, and insulin production and secre-tion. Mol Cell Biol 2007;27:6026-6037
36. Kondo H, Shimomura I, Kishida K, Kuriyama H, Makino Y, Nishizawa H, et al. Human aquaporin adipose (AQPap) gene. Genomic structure, promoter analysis and functional mutation. Eur J Biochem 2002;269:1814-1826
37. Marrades MP, Milagro FI, Martínez JA, Moreno-Aliaga MJ: Differential expression of aquaporin 7 in adipose tissue of lean and obese high fat consumers. Biochem Biophys Res Commun 2006;339:785-789
38. Prudente S, Flex E, Morini E, Turchi F, Capponi D, De Cosmo S, et al. A functional variant of the adipocyte glyc-erol channel aquaporin 7 gene is associated with obesity and related metabolic abnormalities. Diabetes 2007;56:1468-1474
39. Catalán V, Gómez-Ambrosi J, Pastor C, Rotellar F, Silva C, Rodríguez A, Gil MJ, et al. Influence of morbid obesity and insulin resistance on gene expression levels of AQP7 in visceral adipose tissue and AQP9 in liver. Obes Surg 2008;18:695-701
40. Ishibashi K, Kuwahara M, Gu Y, Tanaka Y, Marumo F, Sasaki
S: Cloning and functional expression of a new aquaporin (AQP9) abundantly expressed in the peripheral leukocytes permeable to water and urea, but not to glycerol. Biochem Biophys Res Commun 1998;244:268-274
41. Miranda M, Ceperuelo-Mallafré V, Lecube A, Hernández C, Chacón MR, Fort JM, et al. Gene expression of paired abdominal adipose AQP7 and liver AQP9 in patients with morbid obesity: relationship with glucose abnormalities. Metabolism 2009;58:1762-1768
42. Hatakeyama S, Yoshida Y, Tani T, Koyama Y, Nihei K, Ohshiro K, et al. Cloning of a new aquaporin (AQP10) abundantly expressed in duodenum and jejunum. Biochem Biophys Res Commun 2001;287:814-819
43. Mobasheri A, Shakibaei M, Marples D: Immunohistochemical localization of aquaporin 10 in the apical membranes of the human ileum: a potential pathway for luminal water and small solute absorption. Histochem Cell Biol 2004;121:463-471
44. Li H, Kamiie J, Morishita Y, Yoshida Y, Yaoita E, Ishibashi K, Yamamoto T: Expression and localization of two isoforms of AQP10 in human small intestine. Biol Cell 2005;97:823-829
45. Flach CF, Qadri F, Bhuiyan TR, Alam NH, Jennische E, Holmgren J, Lonnroth I: Differential expression of intesti-nal membrane transporters in cholera patients. FEBS Lett 2007;581:3183-3188
46. Morinaga T, Nakakoshi M, Hirao A, Imai M, Ishibashi K: Mouse aquaporin 10 gene (AQP10) is a pseudogene. Biochem Biophys Res Commun 2002;294:630-634
47. Gorin MB, Yancey SB, Cline J, Revel JP, Horwitz J: The major intrinsic protein (MIP) of the bovine lens fiber membrane: characterization and structure based on cDNA cloning. Cell 1984;39:49-59
48. Oliva R, Calamita G, Thornton JM, Pellegrini-Calace M: Electrostatics of aquaporin and aquaglyceroporin channels correlates with their transport selectivity. Proc Natl Acad Sci U S A 2010;107:4135-4140
49. Shiels A, Bassnett S, Varadaraj K, Mathias R, Al-Ghoul K, Kuszak J, et al. Optical dysfunction of the crystalline lens in aquaporin-0-deficient mice. Physiol Genomics 2001;7:179-186
50. Francis P, Berry V, Bhattacharya S, Moore A: Congenital progressive polymorphic cataract caused by a mutation in the major intrinsic protein of the lens, MIP (AQP0). Br J Ophthalmol 2000;84:1376-1379
51. Varadaraj K, Kumari SS, Patil R, Wax MB, Mathias RT:

Adipobiology 2, 2010
Biology of aquaporins20 RevIew
Functional characterization of a human aquaporin 0 muta-tion that leads to a congenital dominant lens cataract. Exp Eye Res 2008;87:9-21
52. Verkman AS, Ruiz-Ederra J, Levin MH: Functions of aq-uaporins in the eye. Prog Retin Eye Res 2008;27:420-433
53. Agre P, Saboori AM, Asimos A, Smith BL: Purification and partial characterization of the Mr 30,000 integral membrane protein associated with the erythrocyte Rh(D) antigen. J Biol Chem 1987;262:17497-17503
54. Preston GM, Smith BL, Zeidel ML, Moulds JJ, Agre P: Mutations in aquaporin-1 in phenotypically normal hu-mans without functional CHIP water channels. Science 1994;265:1585-1587
55. Saadoun S, Papadopoulos MC, Hara-Chikuma M, Verkman AS: Impairment of angiogenesis and cell migration by tar-geted aquaporin-1 gene disruption. Nature 2005;434:786-792
56. Herrera M, Garvin JL: Novel role of AQP-1 in NO-dependent vasorelaxation. Am J Physiol Renal Physiol 2007;292:F1443-1451
57. Deen PM, Dempster JA, Wieringa B, Van Os CH: Isolation of a cDNA for rat CHIP28 water channel: high mRNA expression in kidney cortex and inner medulla. Biochem Biophys Res Commun 1992;188:1267-1273.
58. Sabolic I, Valenti G, Verbavatz JM, Verkman AS, Ausiello DA, Brown D: Localization of the CHIP28 water channel in rat kidney. Am J Physiol 1992;263:C1225-C1233
59. Ma T, Yang B, Gillespie A, Carlson EJ, Epstein CJ, Verkman AS: Severely impaired urinary concentrating ability in transgenic mice lacking aquaporin-1 water channels. J Biol Chem 1998;273:4296-4299
60. King LS, Choi M, Fernández PC, Cartron JP, Agre P: Defective urinary-concentrating ability due to a complete deficiency of aquaporin-1. N Engl J Med 2001;345:175-179
61. Fushimi K, Uchida S, Hara Y, Hirata Y, Marumo F, Sasaki S: Cloning and expression of apical membrane water channel of rat kidney collecting tubule. Nature 1993;361:549-552
62. Valenti G, Procino G, Tamma G, Carmosino M, Svelto M: Minireview: aquaporin 2 trafficking. Endocrinology 2005;146:5063-5070
63. Pedersen EB, Thomsen IM, Lauridsen TG: Abnormal func-tion of the vasopressin-cyclic-AMP-aquaporin2 axis dur-ing urine concentrating and diluting in patients with re-duced renal function. A case control study. BMC Nephrol 2010;11:26
64. Noda Y, Sasaki S: Trafficking mechanism of water channel aquaporin-2. Biol Cell 2005;97:885-892
65. Deen PM, Verdijk MA, Knoers NV, Wieringa B, Monnens LA, van Os CH, van Oost BA: Requirement of human renal water channel aquaporin-2 for vasopressin-dependent con-centration of urine. Science 1994;264:92-95
66. Jung JS, Bhat RV, Preston GM, Guggino WB, Baraban JM, Agre P: Molecular characterization of an aquaporin cDNA from brain: candidate osmoreceptor and regulator of water balance. Proc Natl Acad Sci USA 1994;91:13052-13056
67. Hasegawa H, Ma T, Skach W, Matthay MA, Verkman AS: Molecular cloning of a mercurial-insensitive water chan-nel expressed in selected water-transporting tissues. J Biol Chem 1994;269:5497-5500
68. Verkman AS, Binder DK, Bloch O, Auguste K, Papadopoulos MC: Three distinct roles of aquaporin-4 in brain function re-vealed by knockout mice. Biochim Biophys Acta 2006:[Epub ahead of print]
69. Barbara B: Aquaporin biology and nervous system. Curr Neuropharmacol 2010;8:97-104
70. Nozaki H, Shimohata T, Kanbayashi T, Sagawa Y, Katada S, Satoh M, et al. A patient with anti-aquaporin 4 antibody who presented with recurrent hypersomnia, reduced orexin (hypocretin) level, and symmetrical hypothalamic lesions. Sleep Med 2009;10:253-255
71. Raina S, Preston GM, Guggino WB, Agre P: Molecular cloning and characterization of an aquaporin cDNA from salivary, lacrimal, and respiratory tissues. J Biol Chem 1995;270:1908-1912
72. Ma T, Song Y, Gillespie A, Carlson EJ, Epstein CJ, Verkman AS: Defective secretion of saliva in transgenic mice lacking aquaporin-5 water channels. J Biol Chem 1999;274:20071-20074
73. Tsubota K, Hirai S, King LS, Agre P, Ishida N: Defective cel-lular trafficking of lacrimal gland aquaporin-5 in Sjogren’s syndrome. Lancet 2001;357:688-689
74. Steinfeld S, Cogan E, King LS, Agre P, Kiss R, Delporte C: Abnormal distribution of aquaporin-5 water channel pro-tein in salivary glands from Sjogren’s syndrome patients. Lab Invest 2001;81:143-148
75. Beroukas D, Hiscock J, Jonsson R, Waterman SA, Gordon TP: Subcellular distribution of aquaporin 5 in salivary glands in primary Sjogren’s syndrome. Lancet 2001;358:1875-1876
76. Agre P, Kozono D: Aquaporin water channels: molecular mechanisms for human diseases. FEBS Lett 2003;555:72-78

Adipobiology 2, 2010
Rodríguez et al 21
77. Krane CM, Fortner CN, Hand AR, McGraw DW, Lorenz JN, Wert SE, Towne JE, Paul RJ, Whitsett JA, Menon AG: Aquaporin 5-deficient mouse lungs are hyperrespon-sive to cholinergic stimulation. Proc Natl Acad Sci USA 2001;98:14114-14119
78. Zhang Z, Chen Z, Song Y, Zhang P, Hu J, Bai C: Expression of aquaporin 5 increases proliferation and metastasis poten-tial of lung cancer. J Pathol 2010;221:210-220
79. Ma T, Yang B, Kuo WL, Verkman AS: cDNA cloning and gene structure of a novel water channel expressed exclusive-ly in human kidney: evidence for a gene cluster of aquapor-ins at chromosome locus 12q13. Genomics 1996;35:543-550
80. Yasui M, Kwon TH, Knepper MA, Nielsen S, Agre P: Aquaporin-6: An intracellular vesicle water channel protein in renal epithelia. Proc Natl Acad Sci USA 1999;96:5808-5813
81. Ohshiro K, Yaoita E, Yoshida Y, Fujinaka H, Matsuki A, Kamiie J, et al. Expression and immunolocalization of AQP6 in intercalated cells of the rat kidney collecting duct. Arch Histol Cytol 2001;64:329-338
82. Ikeda M, Beitz E, Kozono D, Guggino WB, Agre P, Yasui M. Characterization of aquaporin-6 as a nitrate channel in mammalian cells. Requirement of pore-lining residue thre-onine 63. J Biol Chem 2002;277:39873-39879
83. Promeneur D, Kwon TH, Yasui M, Kim GH, Frokiaer J, Knepper MA, et al. Regulation of AQP6 mRNA and protein expression in rats in response to altered acid-base or water balance. Am J Physiol Renal Physiol 2000;279:F1014-F1026
84. Ishibashi K, Kuwahara M, Kageyama Y, Tohsaka A, Marumo F, Sasaki S: Cloning and functional expression of a second new aquaporin abundantly expressed in testis. Biochem Biophys Res Commun 1997;237:714-718
85. Koyama Y, Yamamoto T, Kondo D, Funaki H, Yaoita E, Kawasaki K, Sato N, Hatakeyama K, Kihara I: Molecular cloning of a new aquaporin from rat pancreas and liver. J Biol Chem 1997;272:30329-30333
86. Ma T, Yang B, Verkman AS: Cloning of a novel water and urea-permeable aquaporin from mouse expressed strongly in colon, placenta, liver, and heart. Biochem Biophys Res Commun 1997;240:324-328
87. Yang B, Song Y, Zhao D, Verkman AS: Phenotype analy-sis of aquaporin-8 null mice. Am J Physiol Cell Physiol 2005;288:C1161-C1170
88. Masyuk AI, LaRusso NF: Aquaporins in the hepatobiliary system. Hepatology 2006;43:S75-S81
89. Larocca MC, Soria LR, Espelt MV, Lehmann GL, Marinelli RA: Knockdown of hepatocyte aquaporin-8 by RNA inter-ference induces defective bile canalicular water transport. Am J Physiol Gastrointest Liver Physiol 2009;296:G93-100
90. Mazzone A, Tietz P, Jefferson J, Pagano R, LaRusso NF: Isolation and characterization of lipid microdomains from apical and basolateral plasma membranes of rat hepato-cytes. Hepatology 2006;43:287-296
91. Soria LR, Gradilone SA, Larocca MC, Marinelli RA: Glucagon induces the gene expression of aquaporin-8 but not that of aq-uaporin-9 water channels in the rat hepatocyte. Am J Physiol Regul Integr Comp Physiol 2009;296:R1274-1281
92. Calamita G, Ferri D, Bazzini C, Mazzone A, Botta G, Liquori GE, Paulmichl M, Portincasa p, Meyer G, Svelto M: Expression and subcellular localization of the AQP8 and AQP1 water channels in the mouse gall-bladder epithelium. Biol Cell 2005;97:415-423
93. Calamita G, Mazzone A, Bizzoca A, Svelto M: Possible involvement of aquaporin-7 and -8 in rat testis develop-ment and spermatogenesis. Biochem Biophys Res Commun 2001;288:619-625
94. Richard C, Gao J, Brown N, Reese J: Aquaporin water channel genes are differentially expressed and regulated by ovarian steroids during the periimplantation period in the mouse. Endocrinology 2003;144:1533-1541
95. Ishibashi K, Kuwahara M, Kageyama Y, Sasaki S, Suzuki M, Imai M: Molecular cloning of a new aquaporin superfamily in mammals: AQPX1 and AQPX2. In Holman S, Nielsen S eds. Molecular biology and physiology of water and sol-ute transport. New York: Ed. Kluwer Academic/Plenum Publishers, 2000: 123-126.
96. Morishita Y, Sakube Y, Sasaki S, Ishibashi K: Molecular mechanisms and drug development in aquaporin water channel diseases: aquaporin superfamily (superaquapor-ins): expansion of aquaporins restricted to multicellular or-ganisms. J Pharmacol Sci 2004;96:276-279
97. Ikeda M, Andoo A, Shimono M, Takamatsu N, Taki A, Muta K, et al. The NPC motif of aquaporin-11, unlike the NPA motif of known aquaporins, is essential for full expres-sion of molecular function. J Biol Chem 2010:doi: 10.1074/jbc.M1110.180968
98. Gorelick DA, Praetorius J, Tsunenari T, Nielsen S, Agre P: Aquaporin-11: a channel protein lacking apparent transport function expressed in brain. BMC Biochem 2006;7:14
99. Morishita Y, Matsuzaki T, Hara-chikuma M, Andoo A,
Adipobiology 2, 2010
Biology of aquaporins22 RevIew
Shimono M, Matsuki A, et al. Disruption of aquaporin-11 produces polycystic kidneys following vacuolization of the proximal tubule. Mol Cell Biol 2005;25:7770-7779
100. Ishibashi K: Aquaporin subfamily with unusual NPA box-es. Biochim Biophys Acta 2006;1758:989-993
101. Okada S, Misaka T, Tanaka Y, Matsumoto I, Ishibashi K, Sasaki S, Abe K: Aquaporin-11 knockout mice and poly-cystic kidney disease animals share a common mechanism of cyst formation. Faseb J 2008;22:3672-3684
102. Itoh T, Rai T, Kuwahara M, Ko SB, Uchida S, Sasaki S, Ishibashi K: Identification of a novel aquaporin, AQP12, expressed in pancreatic acinar cells. Biochem Biophys Res Commun 2005;330:832-838
103. Ohta E, Itoh T, Nemoto T, Kumagai J, Ko SB, Ishibashi K, et al. Pancreas-specific aquaporin 12 null mice showed in-creased susceptibility to caerulein-induced acute pancrea-titis. Am J Physiol Cell Physiol 2009;297:C1368-1378
104. Wasson K: Phenotypes of aquaporin mutants in genetically altered mice. Comp Med 2006;56:96-104
105. Rojek A, Füchtbauer EM, Kwon TH, Frokiaer J, Nielsen S: Severe urinary concentrating defect in renal collecting
duct-selective AQP2 conditional-knockout mice. Proc Natl Acad Sci U S A 2006;103:6037-6042
106. Ma T, Yang B, Gillespie A, Carlson EJ, Epstein CJ, Verkman AS: Generation and phenotype of a transgenic knockout mouse lacking the mercurial-insensitive water channel aq-uaporin-4. J Clin Invest 1997;100:957-962
107. Papadopoulos MC, Manley GT, Krishna S, Verkman AS: Aquaporin-4 facilitates reabsorption of excess fluid in va-sogenic brain edema. FASEB J 2004;18:1291-1293.
108. Manley GT, Fujimura M, Ma T, Noshita N, Filiz F, Bollen AW, et al. Aquaporin-4 deletion in mice reduces brain ede-ma after acute water intoxication and ischemic stroke. Nat Med 2000;6:159-163.
109. Nejsum LN, Kwon TH, Jensen UB, Fumagalli O, Frokiaer J, Krane CM, et al. Functional requirement of aquaporin-5 in plasma membranes of sweat glands. Proc Natl Acad Sci USA 2002;99:511-516.
110. Rojek AM, Skowronski MT, Fuchtbauer EM, Fuchtbauer AC, Fenton RA, Agre P, et al. Defective glycerol metabo-lism in aquaporin 9 (AQP9) knockout mice. Proc Natl Acad Sci USA 2007;104:3609-3614.

Otras publicaciones relacionadas
195
ARTÍCULO 2: Sleeve gastrectomy induces
weight loss in diet-induced obese rats even if
high-fat feeding is continued


Otras publicaciones relacionadas
197
Este artículo demuestra que la SG es una técnica efectiva para la
pérdida de peso en ratas, de igual modo que se pone de manifiesto,
posteriormente, en los artículos incluidos en la tesis doctoral realizados en
ratas y humanos.

Valenti V, Martin M, Fruhbeck G, et al. Sleeve Gastrectomy Induces Weight Loss in Diet-
Induced Obese Rats Even if High-Fat Feeding Is Continued. Obesity Surgery [serial online].
2011;(9):1438. Available from: Academic OneFile, Ipswich, MA. Accessed January 21, 2015.


Otras publicaciones relacionadas
205
ARTÍCULO 3: Sleeve gastrectomy reduces blood
pressure in obese (fa/fa) Zucker rats


Otras publicaciones relacionadas
207
El presente trabajo muestra que la SG es una técnica muy efectiva para
la pérdida de peso incluso en ratas genéticamente obesas, lo cual está en
consonancia con lo observado para la SG en ratas cuya obesidad está inducida
por una HFD, así como por lo observado en humanos en los artículos incluidos
en la tesis doctoral.


Rodriguez, A., Becerril, S., Valenti, V., Ramirez, B., Martin, M., Mendez-Gimenez, L., & ...
Fruhbeck, G. (2012). Sleeve Gastrectomy Reduces Blood Pressure in Obese (fa/fa) Zucker Rats.
Obesity Surgery, (2), 309.

Otras publicaciones relacionadas
217
ARTÍCULO 4: Short- and long-term changes in
gastric morphology and histopathology following
sleeve gastrectomy in diet-induced obese rats


Otras publicaciones relacionadas
219
En este artículo demuestra que los efectos de la SG son más complejos
que una simple reducción de la ingesta, al producir cambios macro y
microscópicos en el estómago de las ratas, lo cual podría ayudar a explicar el
diferente comportamiento en los niveles séricos de OPN tras SG, en
comparación con los efectos de la restricción calórica.

Martin, M., Burrell, M. A., Gomez-Ambrosi, J., Valenti, V., Bueno, A., Ramirez, B., & ... Fruhbeck,
G. (2012). Short- and Long-Term Changes in Gastric Morphology and Histopathology Following
Sleeve Gastrectomy in Diet-Induced Obese Rats. Obesity Surgery, (4), 634.