HECHO RELEVANTE - Hispanidad...HECHO RELEVANTE . De conformidad con lo previsto en el artículo 227...
56
HECHO RELEVANTE De conformidad con lo previsto en el artículo 227 del texto refundido de la Ley del Mercado de Valores, aprobado por el Real Decreto Legislativo 4/2015, de 23 de octubre, y disposiciones concordantes, eDreams ODIGEO (la “Sociedad”) informa de los resultados financieros trimestrales correspondientes al período del ejercicio finalizado el 30 de junio de 2019, que estarán disponibles en la página web de la Sociedad a partir de hoy (http://www.edreamsodigeo.com/). Se adjunta a continuación el informe de resultados y la presentación corporativa preparada por la Sociedad para conocimiento de sus accionistas. En Luxemburgo, a 29 de agosto de 2019 eDreams ODIGEO
Transcript of HECHO RELEVANTE - Hispanidad...HECHO RELEVANTE . De conformidad con lo previsto en el artículo 227...

HECHO RELEVANTE
De conformidad con lo previsto en el artículo 227 del texto refundido de la Ley del Mercado
de Valores, aprobado por el Real Decreto Legislativo 4/2015, de 23 de octubre, y disposiciones
concordantes, eDreams ODIGEO (la “Sociedad”) informa de los resultados financieros
trimestrales correspondientes al período del ejercicio finalizado el 30 de junio de 2019, que
estarán disponibles en la página web de la Sociedad a partir de hoy
(http://www.edreamsodigeo.com/).
Se adjunta a continuación el informe de resultados y la presentación corporativa preparada
por la Sociedad para conocimiento de sus accionistas.
En Luxemburgo, a 29 de agosto de 2019
eDreams ODIGEO
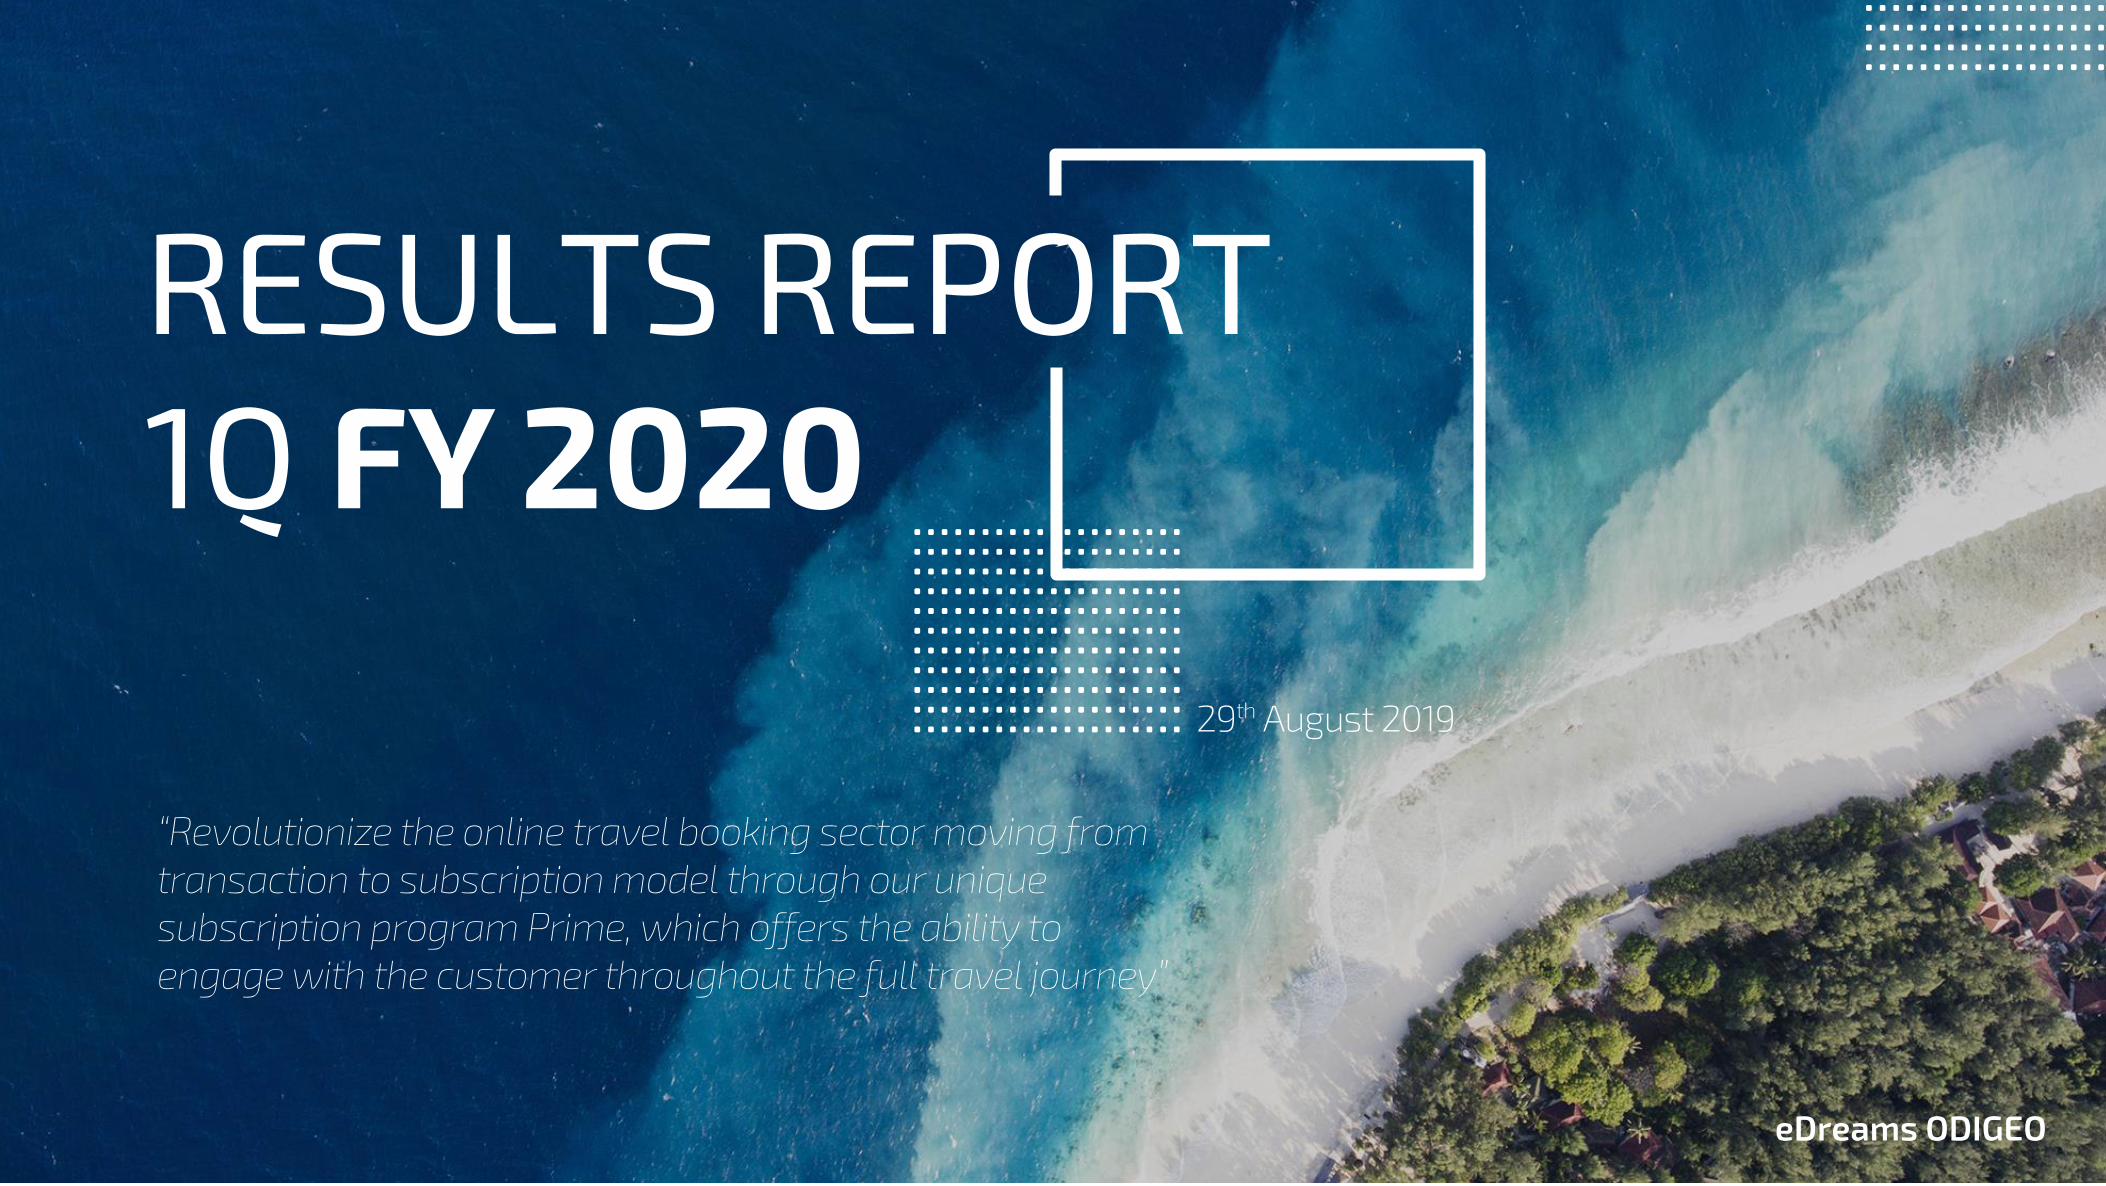
RESULTS REPORT
1Q FY 2020
eDreams ODIGEO
29th August 2019
“Revolutionize the online travel booking sector moving from
transaction to subscription model through our unique
subscription program Prime, which offers the ability to
engage with the customer throughout the full travel journey”

eDreams ODIGEO
2
INDEX
1. A brief look at eDreams ODIGEO and KPIs
2. Business Performance
3. Financial Review
4. Other information
5. Consolidated Financial Statements and Notes
6. Glossary
7. Reconciliation
eDreams ODIGEO

eDreams ODIGEO
3
1. A brief look at eDreams
ODIGEO and KPIs
1.1 KPIs
1.2 Results Highlights
1.3 CEO’s Quote
1.4 Outlook
eDreams ODIGEO
4
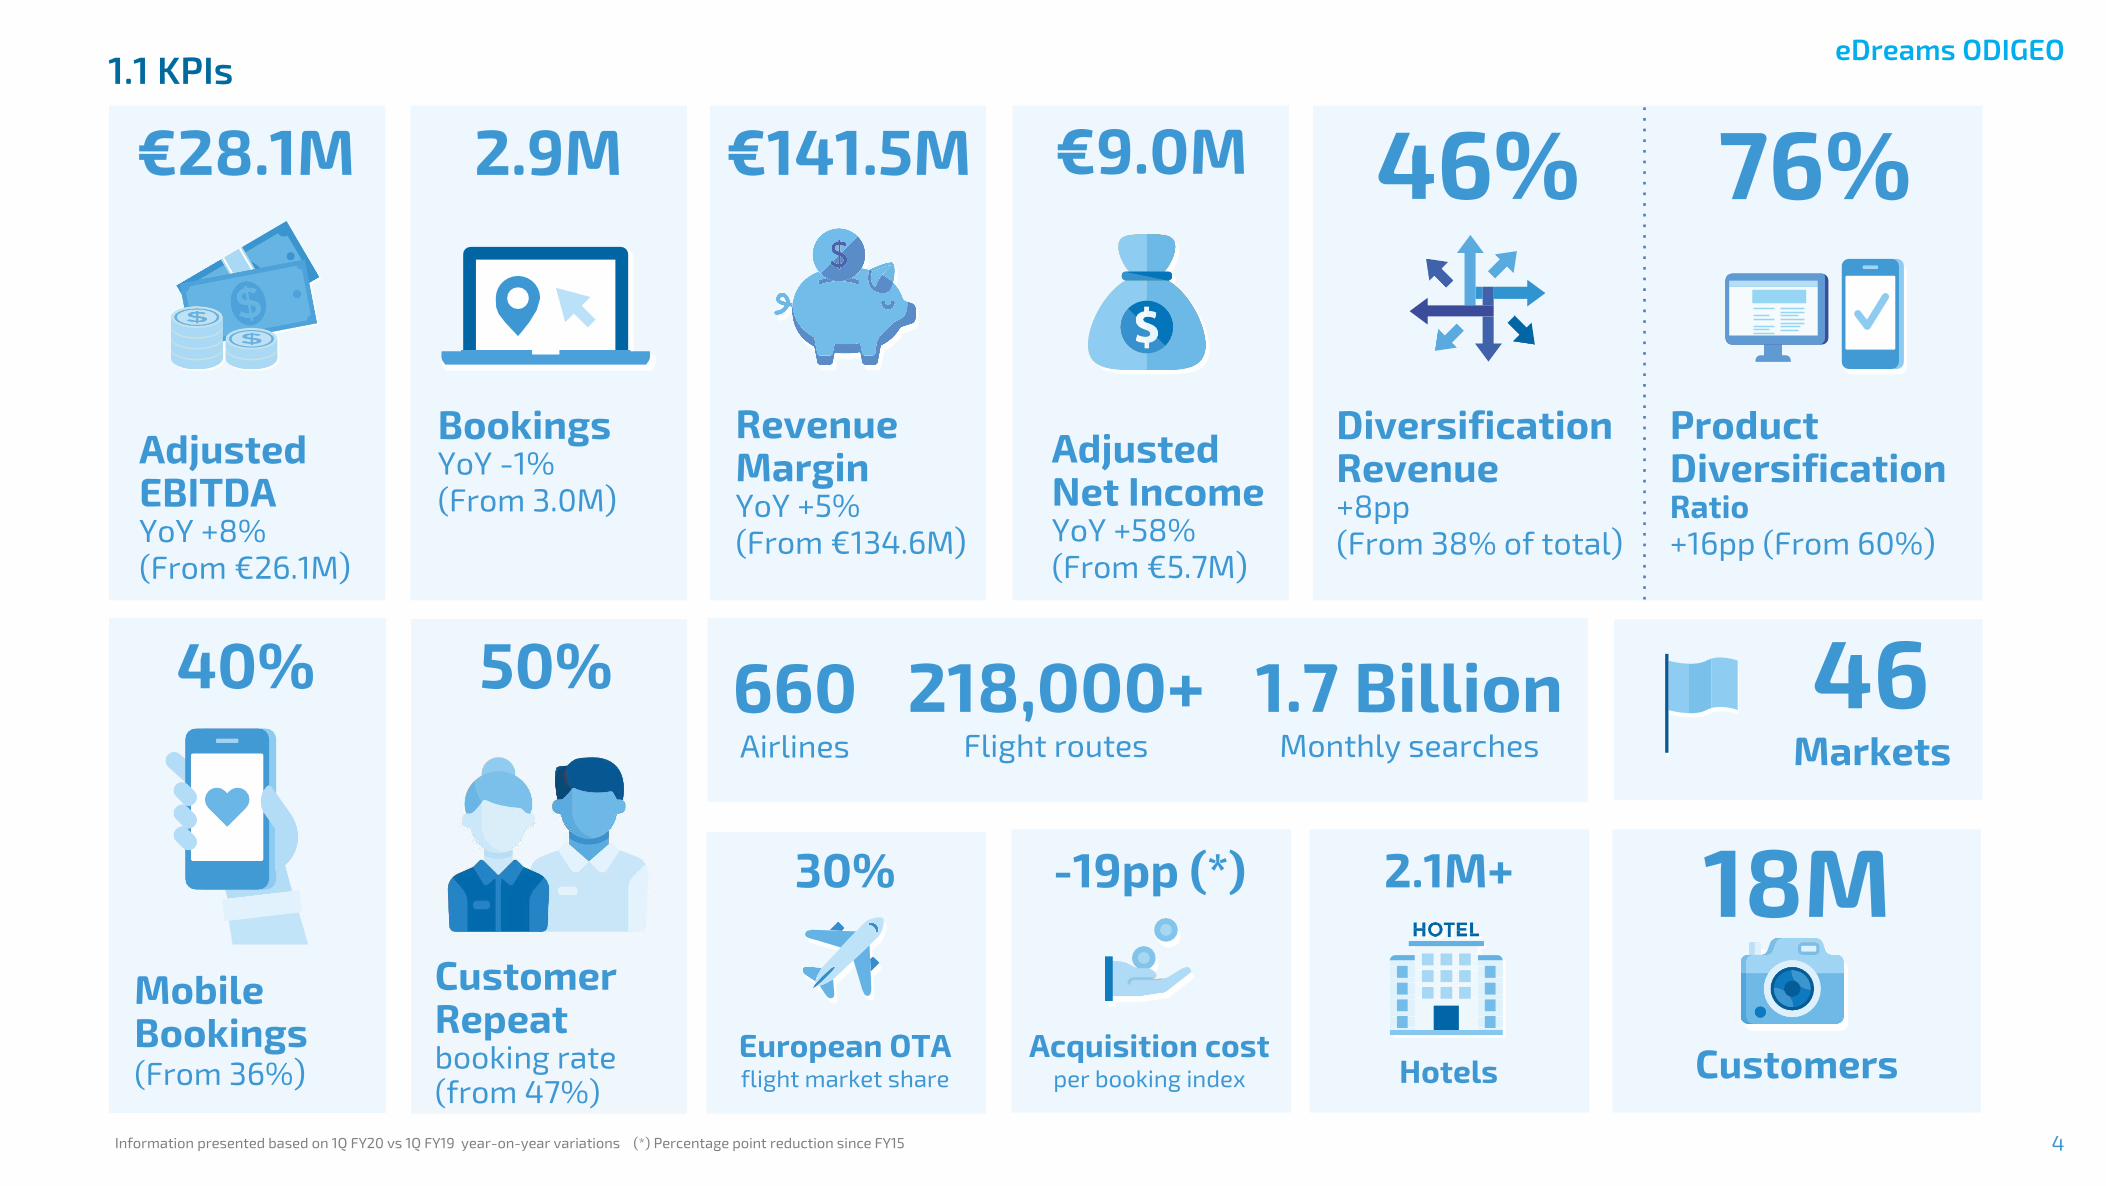
1.1 KPIs
€28.1M 2.9M €141.5M €9.0M 46% 76%
Adjusted Net Income YoY +58%
(From €5.7M)
Bookings YoY -1%
(From 3.0M)
Revenue Margin YoY +5%
(From €134.6M)
Adjusted EBITDA YoY +8%
(From €26.1M)
Diversification Revenue +8pp
(From 38% of total)
Product Diversification Ratio
+16pp (From 60%)
40%
Mobile Bookings (From 36%)
50%
Customer Repeat booking rate (from 47%)
46 Markets
18M Customers
660 Airlines
218,000+ Flight routes
1.7 Billion Monthly searches
30%
European OTA flight market share
-19pp (*)
Acquisition cost per booking index
2.1M+
Hotels
Information presented based on 1Q FY20 vs 1Q FY19 year-on-year variations (*) Percentage point reduction since FY15

eDreams ODIGEO
5
1.2 RESULTS HIGHLIGHTS
Performance in line with our guidance
Bookings were 2.9 million (-1% year-on-year), in line with strategic revenue model shift
and guidance
Revenue Margin was €141.5 million (+5% year-on-year), due to an increase in Revenue
Margin per booking of 7%
Adjusted EBITDA was €28.1 million (+8% year-on-year)
Cash position (net of overdrafts) stood at €137.1 million, up 10% versus €124.9 million in
1Q FY19
Revenue diversification initiatives delivering results
Diversification Revenue up 25% year-on-year, continue with strong growth and 57%
larger than our Classic Customer Revenue
Revenue diversification ratio up to 46% (from 38%)
Product diversification ratio up to 76% (from 60%)
Mobile bookings up to 40% of total flight bookings versus 36% in 1Q FY19
Industry-leading subscription programme (Prime) is proving very successful
Number of subscribers continue to increase and reached 325,000
4 of our largest markets already in Prime
FY20 Outlook Unchanged
On track to meet full year guidance targets
1.3 CEO QUOTE
Dana Dunne, CEO, commented; “We have delivered a solid set of 1Q results in line with our
guidance. Also our revenue diversification is paying off well, growing at 25% and is now 57%
larger than our Classic Customer Revenue. In addition, our industry-leading subscription
programme is proving very successful."
1.4 OUTLOOK
We expect FY20 to be a much better year than FY19, but it will still not reflect all our underlying
potential as we have major markets with less than 12 months with the new revenue model.
In 1Q, reflecting the seasonality and investments we made to complete successfully the shift in
the revenue model in FY19, we guided for low single digit revenue margin growth, reduction in
bookings and solid adjusted EBITDA growth rates. Results have been in line with the guidance,
except for revenue margin, which has been better than expected.
From 2Q onwards we expect growth in Bookings, Revenue Margin and Adjusted EBITDA, in line
with our full year guidance. There will be quarterly variations, due to the timing of changes we
made in the last fiscal year.
Outlook FY 2020
Revenue
Margin 4% to 7%
vs FY19
Adjusted
EBITDA €130 to €134 million
Bookings 4% to 7% vs FY19

eDreams ODIGEO
6
2. Business Performance
2.1 Business Review
2.2 Product
2.3 Geography
2.4 Financial KPIs
eDreams ODIGEO
7
2.1 BUSINESS REVIEW
Key financial KPIs 1Q 1Q 1Q
FY15 FY19 FY20 CAGR
Bookings ('000) 2,509.6 2,970.2 2,926.6 3%
Revenue Margin
(in € Million) 107.3 134.6 141.5 6%
Adjusted EBITDA
(in € Million) 22.2 26.1 28.1 5%
Adjusted Net Income
(in € Million) 3.1 5.7 9.0 24%
CAGR presented based on 1Q FY15-1Q FY20
Reflecting the completion of the shift in the revenue model, with some markets still within the
first 12 months of the shift, and our focus on high quality sustainable business, Bookings were
down 1% while Revenue Margin increased 5%, outperforming our 1Q Revenue guidance of low
single digit Revenue growth, as we achieved higher revenues on fewer bookings for a total
amount of €141.5 million. Adjusted EBITDA was up 8% to €28.1 million in 1Q FY20, in line with
guidance.
Our revenue diversification initiatives are delivering results. Diversification revenues continue to
grow, up 25% year-on-year, and are now 57% larger than Classic Customer Revenue. As an
intended consequence of our revenue model shift, Product Diversification Ratio and Revenue
Diversification Ratio have increased to 76% and 46% in the first quarter, up from 60% and 38%
in Q1 last year, rising a remarkable 16 and 8 percentage points in just one year.
Overall, we are delighted by progress made in revenue diversification and product
diversification which are continuing to grow rapidly. We are particularly pleased with dynamic
packages and ancillaries as revenues increased over 30% year-on-year in both categories. In
contrast, other products are not showing a satisfactory performance, for example we recently
changed our car provider and we are not pleased with the performance, being one of the
reasons why Non-Flight revenue is down year-on-year. Our industry-leading subscription
programme Prime, which we launched two years ago, continues to be successful. The number of
subscribers have increased to 325,000, and the programme currently operates in four of our
largest markets. Additionally, mobile bookings continue to grow and account for 40% of our
total flight bookings in 1Q FY20, rising 4 percentage points from 1Q last year.
Adjusted Net Income stood at €9.0 million, up 58%. We believe that Adjusted Net Income better
reflects the real ongoing operational performance of the business and full disclosure of the
Adjusted Net Income can be found in section 5 within the Condensed Consolidated Interim
Financial Statements and Notes.
Cash position (net of overdrafts) stood at €137.2 million, up 10% versus €124.9 million in 1Q FY19.
The solid cash performance was driven by a) net cash from operating activities, which increased
by €35.1 million, mainly reflecting lower outflow in working capital, a reduction on income tax
paid, increase in adjusted EBITDA and higher non-cash items, b) cash for investments of €7.2
million, broadly in line with the same period last year, and c) cash used in financing,
which amounted to €1.7 million, also broadly in line with same period last year.
As a result, Net Leverage ratio was reduced from 2.7x in June 2018 to 2.5x in 2019. In 1Q FY 2020
Gross Leverage ratio remained relatively flat at 3.7x in June 2019 vs 3.8x in 2018, which gives us
ample headroom vs our covenant ratio.
46% 76% €72M
Revenue Revenue Product Diversification Diversification Diversification growth Ratio (from 38%) Ratio (from 60%)
Diversification Revenue From €57.7M
+0.3% +25% Rest of
the World
40%
%
Mobile flight Bookings (From 36%)
Interest Expense YoY -31%
Net
leverage: From 2.7 to 2.5x
MO
BIL
E
PRODUCT
GEOGRAPHY
DE
BT
Top 6
+25%
Information presented based on 1Q FY20 vs 1Q FY19 year-on-year variations

eDreams ODIGEO
8
2.2 PRODUCT
Diversification Revenue continues strong growth, now 57% larger than our Classic Customer Revenue
56.252.2
46.0
1Q
FY15
1Q
FY19
1Q
FY20
1Q 1Q 1Q
FY15 FY19 FY20 CAGR
Diversification 30.7 57.7 72.2 19%
Classic Customer 56.2 52.2 46.0 -4%
Classic Supplier 15.2 18.0 16.8 2%
Advertising & Meta 5.2 6.7 6.5 4%
Total 107.3 134.6 141.5 6%
Flilght 85.8 107.2 115.3 6%
Non-Flight 21.5 27.4 26.2 4%
Total 107.3 134.6 141.5 6%
51%
33%
12%
5%
43%
39%
13%
5%
29%
52%
14%
5%
1Q
FY15
1Q
FY19
1Q
FY20
30.7
57.7
72.2
1Q
FY15
1Q
FY19
1Q
FY20
+25%
CAGR
+19%
Diversification
CAGR
-4%
-12%Classic Customer
CAGR presented based on 1Q FY15-1Q FY20
eDreams ODIGEO
9
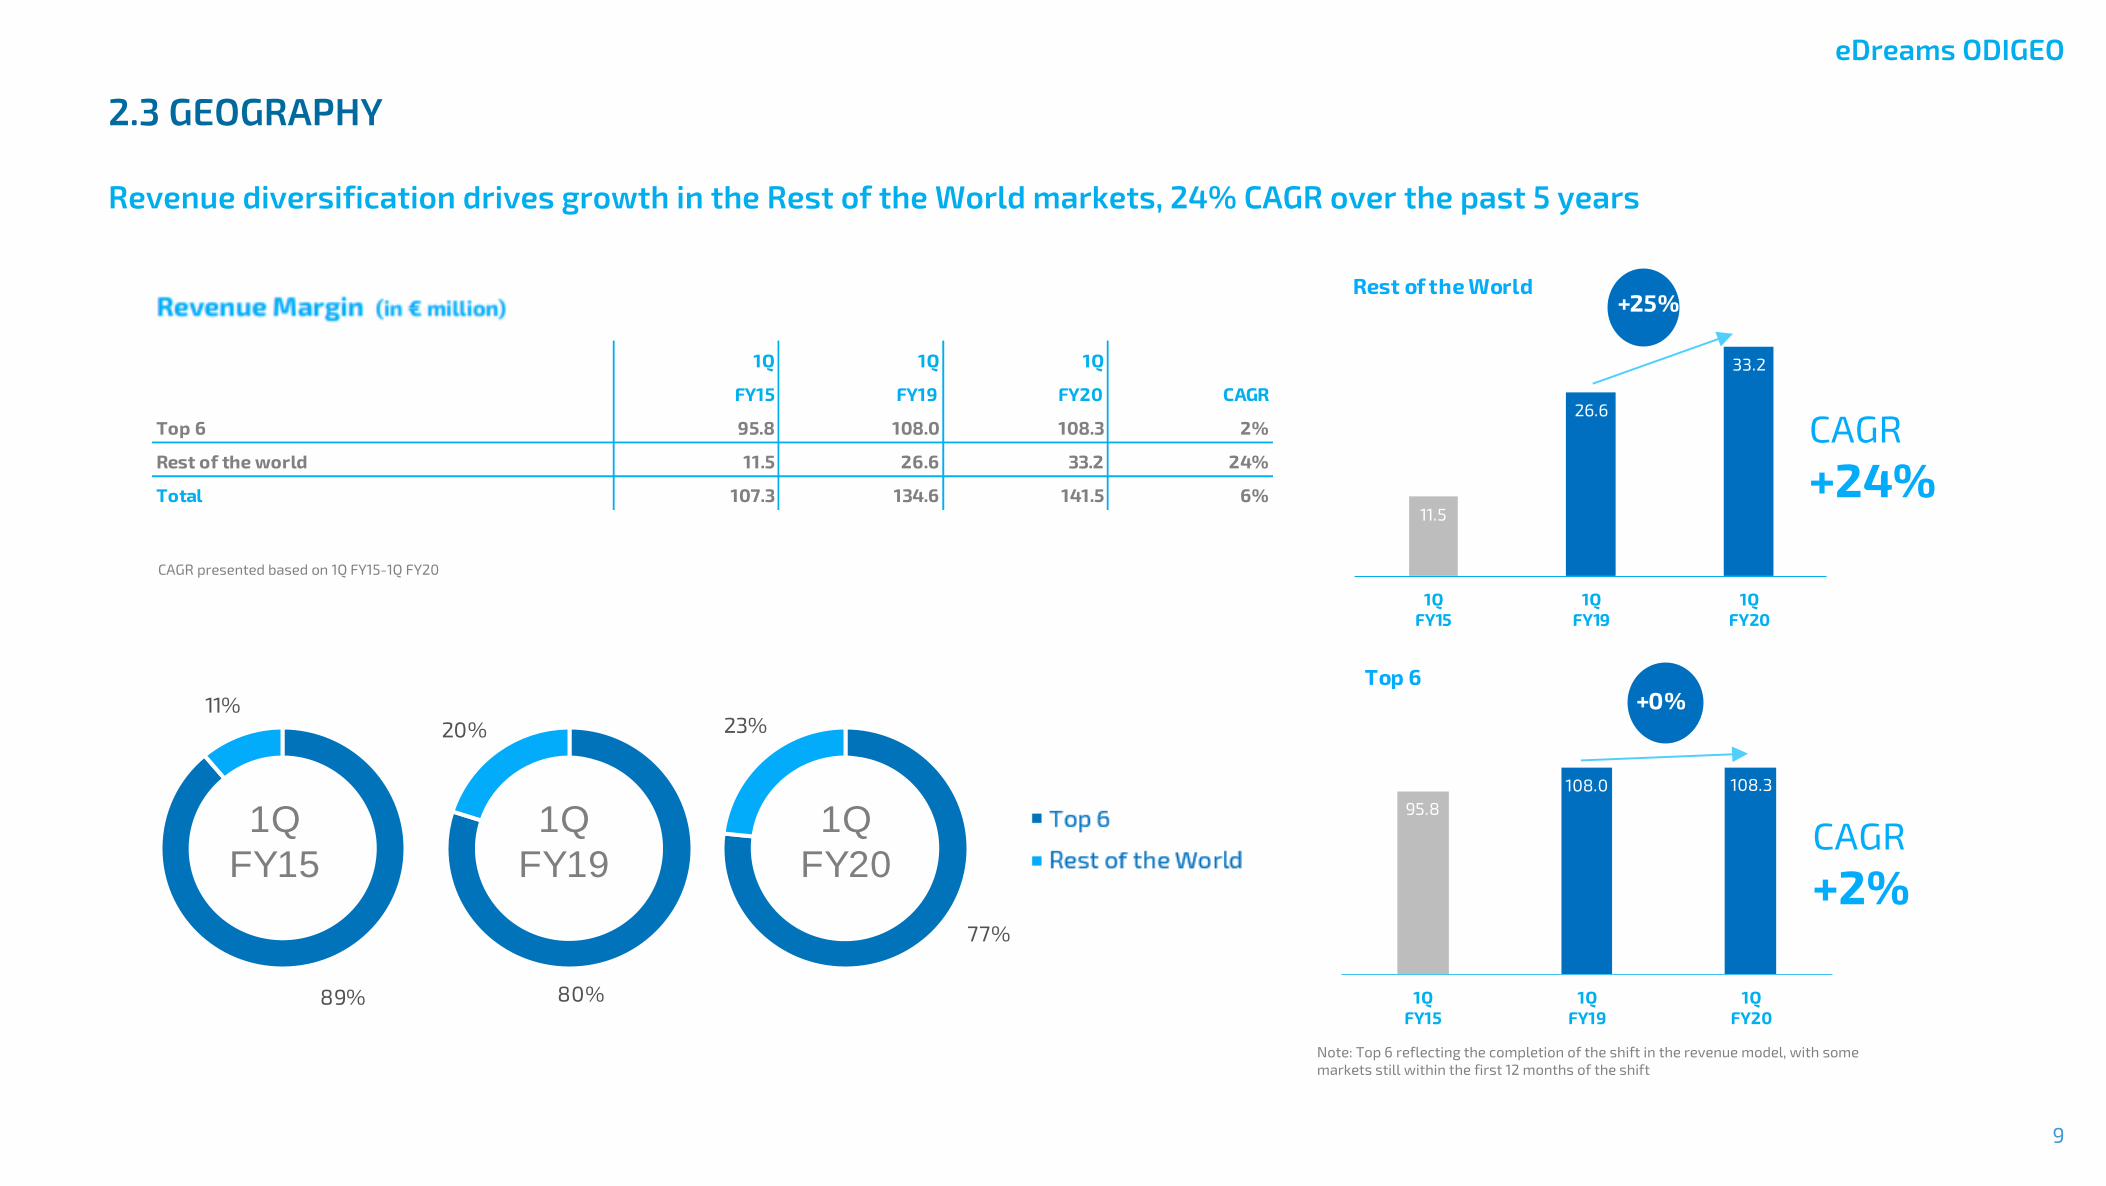
2.3 GEOGRAPHY
Revenue diversification drives growth in the Rest of the World markets, 24% CAGR over the past 5 years
11.5
26.6
33.2
1Q
FY15
1Q
FY19
1Q
FY20
95.8
108.0 108.3
1Q
FY15
1Q
FY19
1Q
FY20
77%
23%
80%
20%
89%
11%
1Q
FY15
1Q
FY19
1Q
FY20
+25%
CAGR
+24%
Rest of the World
CAGR
+2%
+0%Top 6
1Q 1Q 1Q
FY151Q FY191Q FY20 CAGR
Top 6 95.8 108.0 108.3 2%
Rest of the world 11.5 26.6 33.2 24%
Total 107.3 134.6 141.5 6%
CAGR presented based on 1Q FY15-1Q FY20
Note: Top 6 reflecting the completion of the shift in the revenue model, with some
markets still within the first 12 months of the shift
eDreams ODIGEO
10
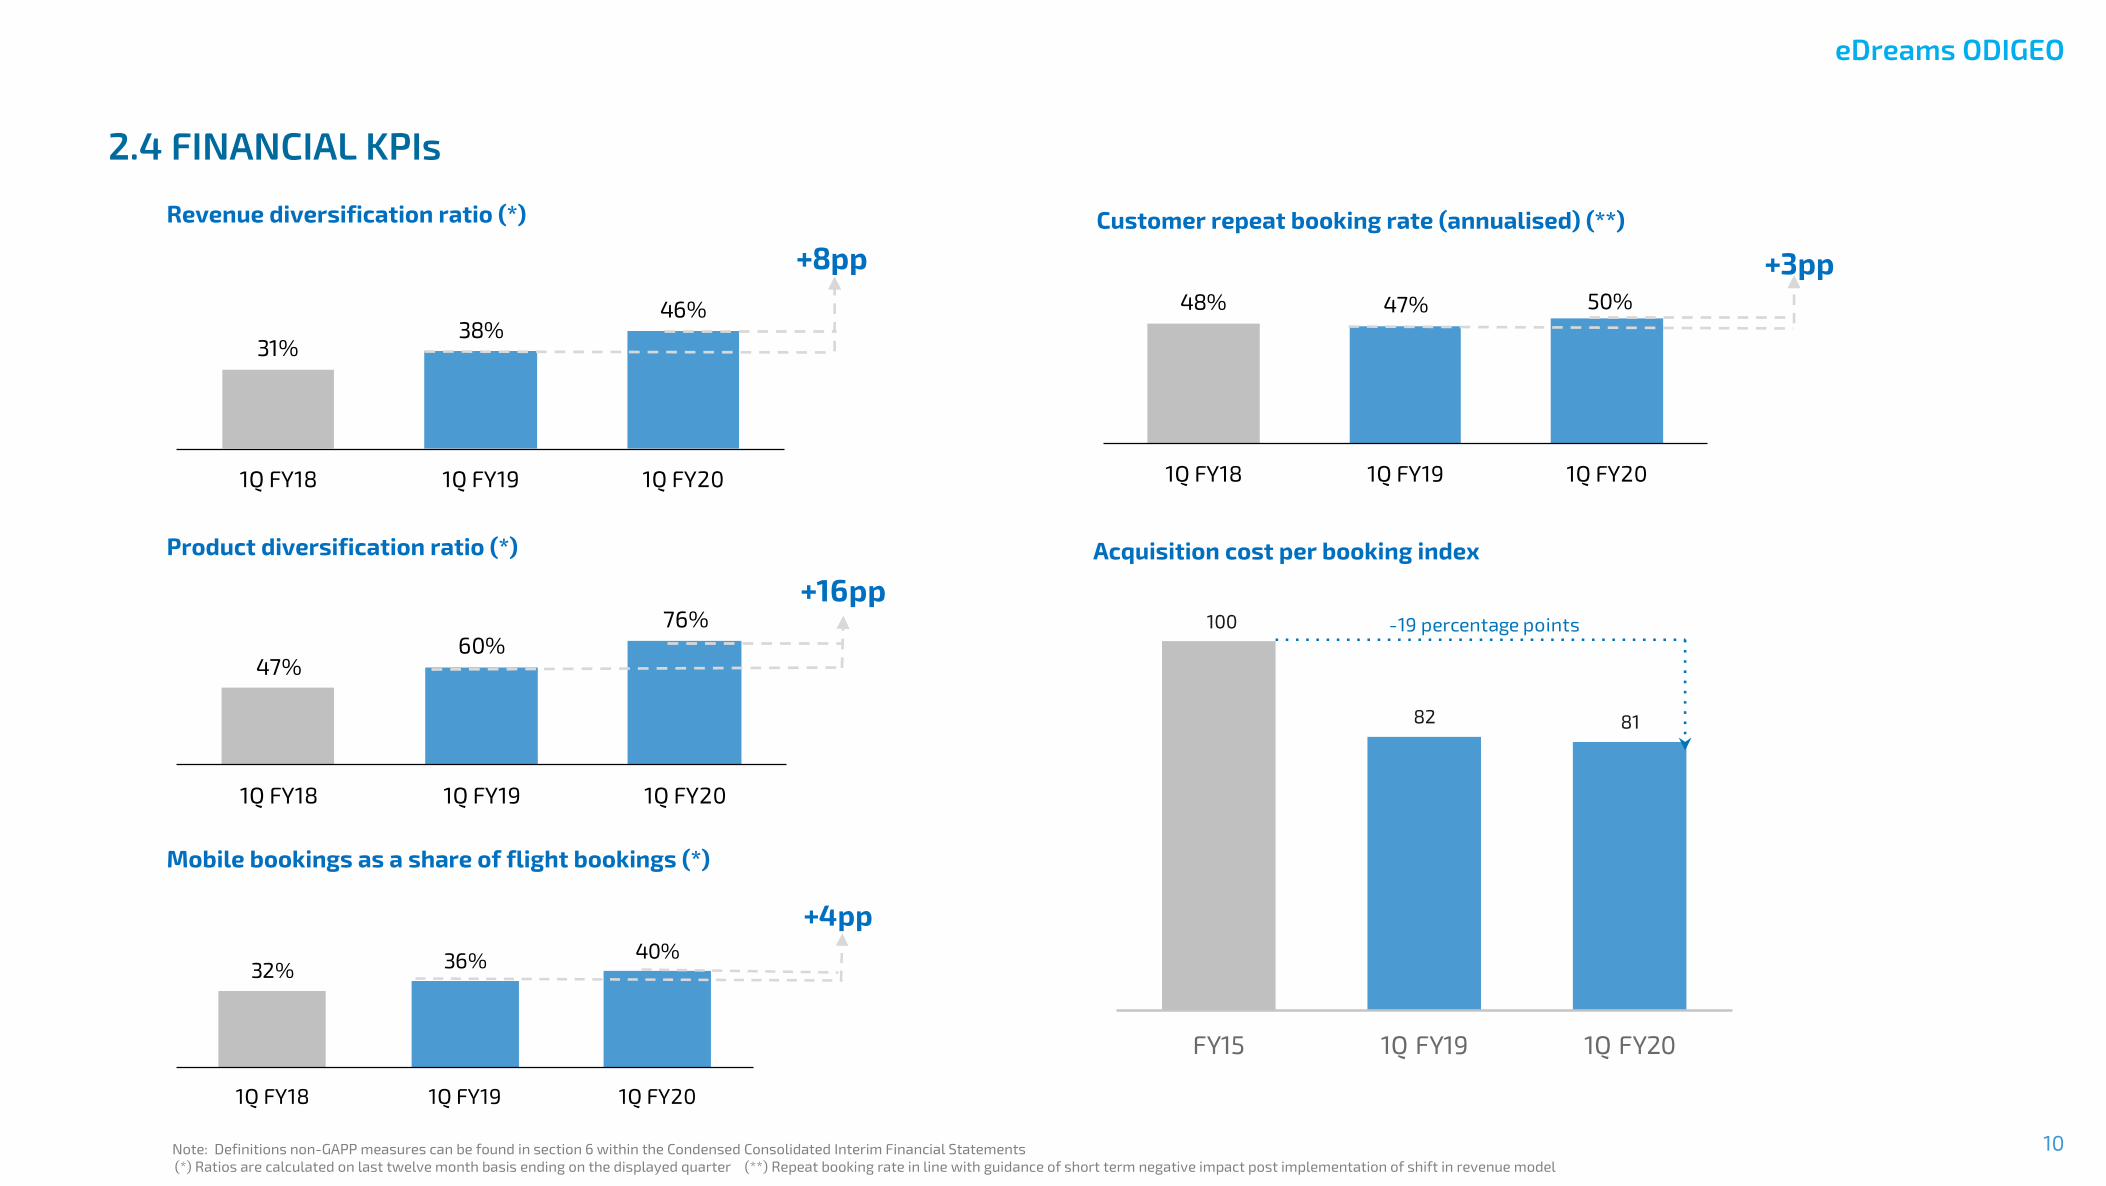
2.4 FINANCIAL KPIs
Revenue diversification ratio (*)
Product diversification ratio (*)
Mobile bookings as a share of flight bookings (*)
31%38%
46%
1Q FY18 1Q FY19 1Q FY20
+8pp
47%60%
76%
1Q FY18 1Q FY19 1Q FY20
+16pp
32% 36%40%
1Q FY18 1Q FY19 1Q FY20
+4pp
Customer repeat booking rate (annualised) (**)
Acquisition cost per booking index
48% 47% 50%
1Q FY18 1Q FY19 1Q FY20
+3pp
100
82 81
FY15 1Q FY19 1Q FY20
-19 percentage points
Note: Definitions non-GAPP measures can be found in section 6 within the Condensed Consolidated Interim Financial Statements
(*) Ratios are calculated on last twelve month basis ending on the displayed quarter (**) Repeat booking rate in line with guidance of short term negative impact post implementation of shift in revenue model

3. Financial Review
3.1 Summary Income Statement
3.2 Summary Balance Sheet
3.3 Summary Cash Flow Statement
3.4 Efficient Debt Management
eDreams ODIGEO
12
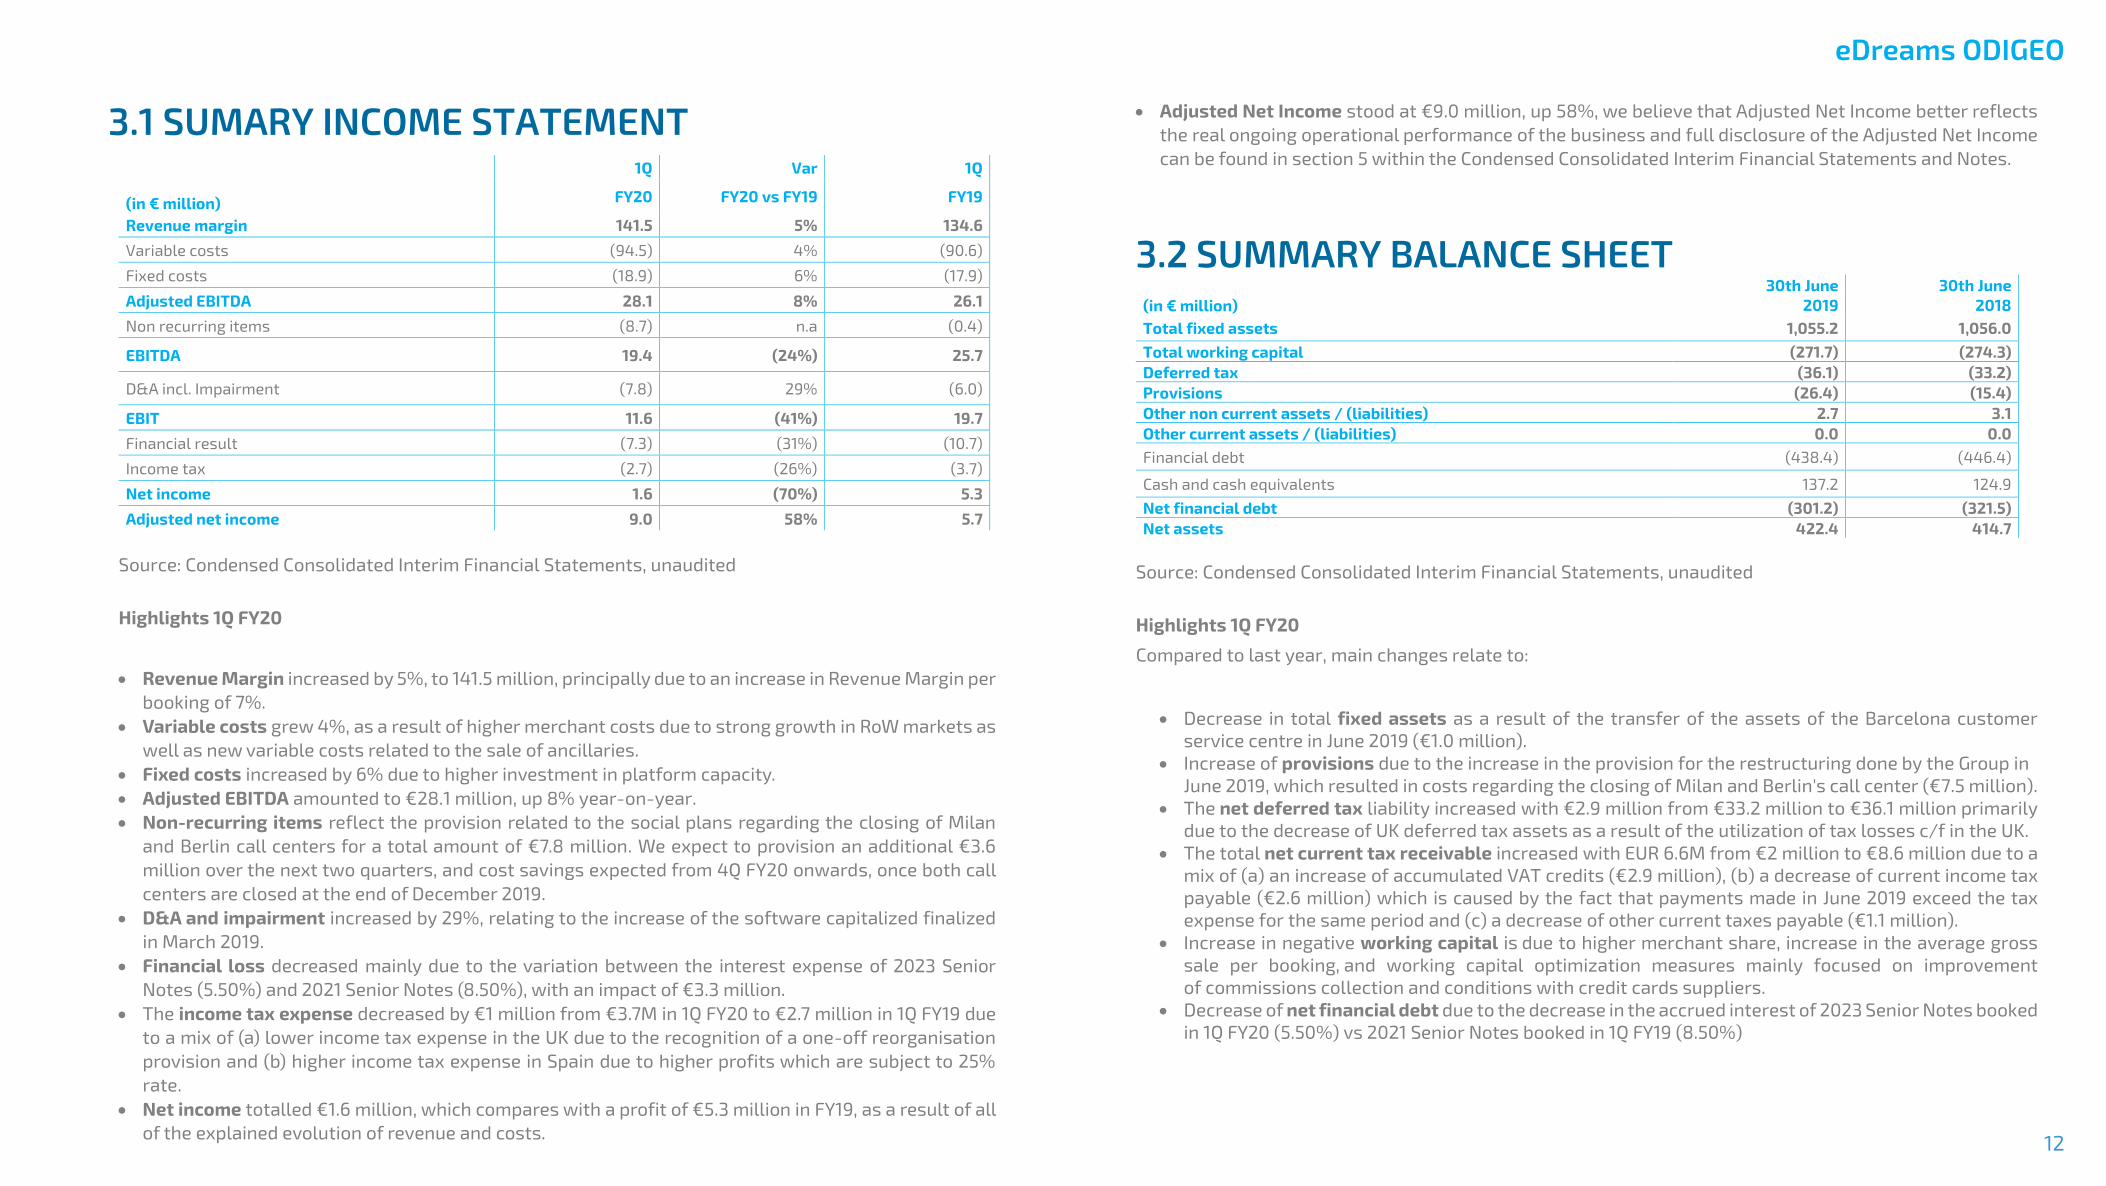
3.1 SUMARY INCOME STATEMENT
1Q Var 1Q
(in € million) FY20 FY20 vs FY19 FY19
Revenue margin 141.5 5% 134.6
Variable costs (94.5) 4% (90.6)
Fixed costs (18.9) 6% (17.9)
Adjusted EBITDA 28.1 8% 26.1
Non recurring items (8.7) n.a (0.4)
EBITDA 19.4 (24%) 25.7
D&A incl. Impairment (7.8) 29% (6.0)
EBIT 11.6 (41%) 19.7
Financial result (7.3) (31%) (10.7)
Income tax (2.7) (26%) (3.7)
Net income 1.6 (70%) 5.3
Adjusted net income 9.0 58% 5.7
Source: Condensed Consolidated Interim Financial Statements, unaudited
Highlights 1Q FY20
Revenue Margin increased by 5%, to 141.5 million, principally due to an increase in Revenue Margin per
booking of 7%.
Variable costs grew 4%, as a result of higher merchant costs due to strong growth in RoW markets as
well as new variable costs related to the sale of ancillaries.
Fixed costs increased by 6% due to higher investment in platform capacity.
Adjusted EBITDA amounted to €28.1 million, up 8% year-on-year.
Non-recurring items reflect the provision related to the social plans regarding the closing of Milan
and Berlin call centers for a total amount of €7.8 million. We expect to provision an additional €3.6
million over the next two quarters, and cost savings expected from 4Q FY20 onwards, once both call
centers are closed at the end of December 2019.
D&A and impairment increased by 29%, relating to the increase of the software capitalized finalized
in March 2019.
Financial loss decreased mainly due to the variation between the interest expense of 2023 Senior
Notes (5.50%) and 2021 Senior Notes (8.50%), with an impact of €3.3 million.
The income tax expense decreased by €1 million from €3.7M in 1Q FY20 to €2.7 million in 1Q FY19 due
to a mix of (a) lower income tax expense in the UK due to the recognition of a one-off reorganisation
provision and (b) higher income tax expense in Spain due to higher profits which are subject to 25%
rate.
Net income totalled €1.6 million, which compares with a profit of €5.3 million in FY19, as a result of all
of the explained evolution of revenue and costs.
Adjusted Net Income stood at €9.0 million, up 58%, we believe that Adjusted Net Income better reflects
the real ongoing operational performance of the business and full disclosure of the Adjusted Net Income
can be found in section 5 within the Condensed Consolidated Interim Financial Statements and Notes.
3.2 SUMMARY BALANCE SHEET 30th June 30th June
(in € million) 2019 2018
Total fixed assets 1,055.2 1,056.0
Total working capital (271.7) (274.3)
Deferred tax (36.1) (33.2)
Provisions (26.4) (15.4)
Other non current assets / (liabilities) 2.7 3.1
Other current assets / (liabilities) 0.0 0.0
Financial debt (438.4) (446.4)
Cash and cash equivalents 137.2 124.9
Net financial debt (301.2) (321.5)
Net assets 422.4 414.7
Source: Condensed Consolidated Interim Financial Statements, unaudited
Highlights 1Q FY20
Compared to last year, main changes relate to:
Decrease in total fixed assets as a result of the transfer of the assets of the Barcelona customer
service centre in June 2019 (€1.0 million).
Increase of provisions due to the increase in the provision for the restructuring done by the Group in
June 2019, which resulted in costs regarding the closing of Milan and Berlin's call center (€7.5 million).
The net deferred tax liability increased with €2.9 million from €33.2 million to €36.1 million primarily
due to the decrease of UK deferred tax assets as a result of the utilization of tax losses c/f in the UK.
The total net current tax receivable increased with EUR 6.6M from €2 million to €8.6 million due to a
mix of (a) an increase of accumulated VAT credits (€2.9 million), (b) a decrease of current income tax
payable (€2.6 million) which is caused by the fact that payments made in June 2019 exceed the tax
expense for the same period and (c) a decrease of other current taxes payable (€1.1 million).
Increase in negative working capital is due to higher merchant share, increase in the average gross
sale per booking, and working capital optimization measures mainly focused on improvement
of commissions collection and conditions with credit cards suppliers.
Decrease of net financial debt due to the decrease in the accrued interest of 2023 Senior Notes booked
in 1Q FY20 (5.50%) vs 2021 Senior Notes booked in 1Q FY19 (8.50%)

eDreams ODIGEO
13
3.3 SUMMARY CASH FLOW STATEMENT
1Q 1Q
(in € million) FY20 FY19
Adjusted EBITDA 28.1 26.1
Non recurring items (8.7) (0.4)
Non cash items 7.7 (1.6)
Change in working capital (24.6) (53.6)
Income tax paid (4.7) (7.8)
Cash flow from operating activities (2.1) (37.2)
Cash flow from investing activities (7.2) (7.7)
Cash flow before financing (9.3) (45.0)
Acquisition of treasury shares (0.2) 0.0
Other debt issuance/ (repayment) (0.9) (0.9)
Financial expenses (net) (0.7) (0.5)
Cash flow from financing (1.7) (1.4)
Net increase / (decrease) in cash and cash equivalents (11.1) (46.4)
Cash and cash equivalents at end of period (net of bank overdrafts) 137.2 124.9
Source: Condensed Consolidated Interim Financial Statements, unaudited
Highlights 1Q FY20
Net cash from operating activities increased by €35.1 million, mainly reflecting:
▪ In 1Q, the better outflow in working capital is due to higher merchant share (+2 p.p. vs 1Q FY19),
increase in the average gross sale per booking (+6% YoY), and working capital optimization
measures mainly focused on improvement of commissions collection and conditions with
credit cards suppliers.
▪ Income tax paid decreased €3.1 million from €7.8 million to €4.7 million due to a mix of (a) lower
advance payments in Spain relating to 2018/19 compared with 2017/18, (b) higher advance
payments in the UK relating to FY 2018/19 compared with 2017/18 and (c) no one-off advance
payment in Spain in June 2019 relating to a pending tax audit.
▪ Increase in Adj. EBITDA by €2.0 million
▪ Higher non cash items: non-recurring items accrued but not yet paid
We have used cash for investments of €7.2 million in FY20, broadly in line with the same period last
year.
Cash used in financing amounted to €1.7 million, compared to €1.4 million in the same period of last
year. The increase by €0.3 million in financing activities mainly relates to the net acquisition of treasury
shares.
3.4 EFFICIENT DEBT MANAGEMENT
Benefits from the refinancing coming through. Financial loss decreased by 31% compared to the same
period last year, a reduction of €3.3 million in financial expenses, as a result of our reduction on the debt
coupon by 300 bps from the 2021 Senior Notes at 8.50% to the 2023 Senior Notes at 5.50%.
Gross Leverage ratio (*) remained relatively flat at 3.7x in June 2019 vs 3.8x in 2018, which gives us ample
headroom vs our covenant ratio.
Net leverage ratio (*) was also down and went from 2.7x in June 2018 to 2.5x in 2019
Debt details
Principal
(€ Million) Rating Maturity
Moodys: B1
Corporate Family Rating S&P: B
Outlook: Stable
2023 Notes 425
Moodys: B2
S&P: B 01/09/2023
0
1
2
3
4
5
6
7
Jun-19 Headroom Ratio-cap
Gross Leverage Ratio(Total Gross Financial Debt / LTM Adjusted EBITDA)
+2.3x
6.0x
3.7x
(*) Definitions non-GAPP measures can be found in section 6 within the Condensed Consolidated Interim Financial Statements
Successful Refinancing 80 basis points below average market yields for B2 rated bonds
Source: Bloomberg Note: Covenant figures unaudited

eDreams ODIGEO
14
4. Other information
4.1 Shareholder Information
4.2 Branches of the Company
4.3 Important events that have occurred
since 30th June 2019
4.1 SHAREHOLDER INFORMATION The subscribed share capital of eDreams ODIGEO at June 2019 is €10,972 thousand divided into
109,719,052 shares with a par value of ten euros cents (€0.10) each, all of which are fully paid.
As at 30th June 2019, the Group had 48,464 treasury shares under the liquidity contract.
4.2 BRANCHES OF THE COMPANY The Company has no direct branches.
4.3 IMPORTANT EVENTS THAT HAVE OCURRED
SINCE 30TH JUNE, 2019 See a description of the Subsequent events in Note 21 in section 5 within the Condensed
Consolidated Interim Financial Statements and Notes attached.

5. Condensed Consolidated
Interim Financial
Statements and Notes
for the three-months period ended 30th June 2019
eDreams ODIGEO
eDreams ODIGEO
16
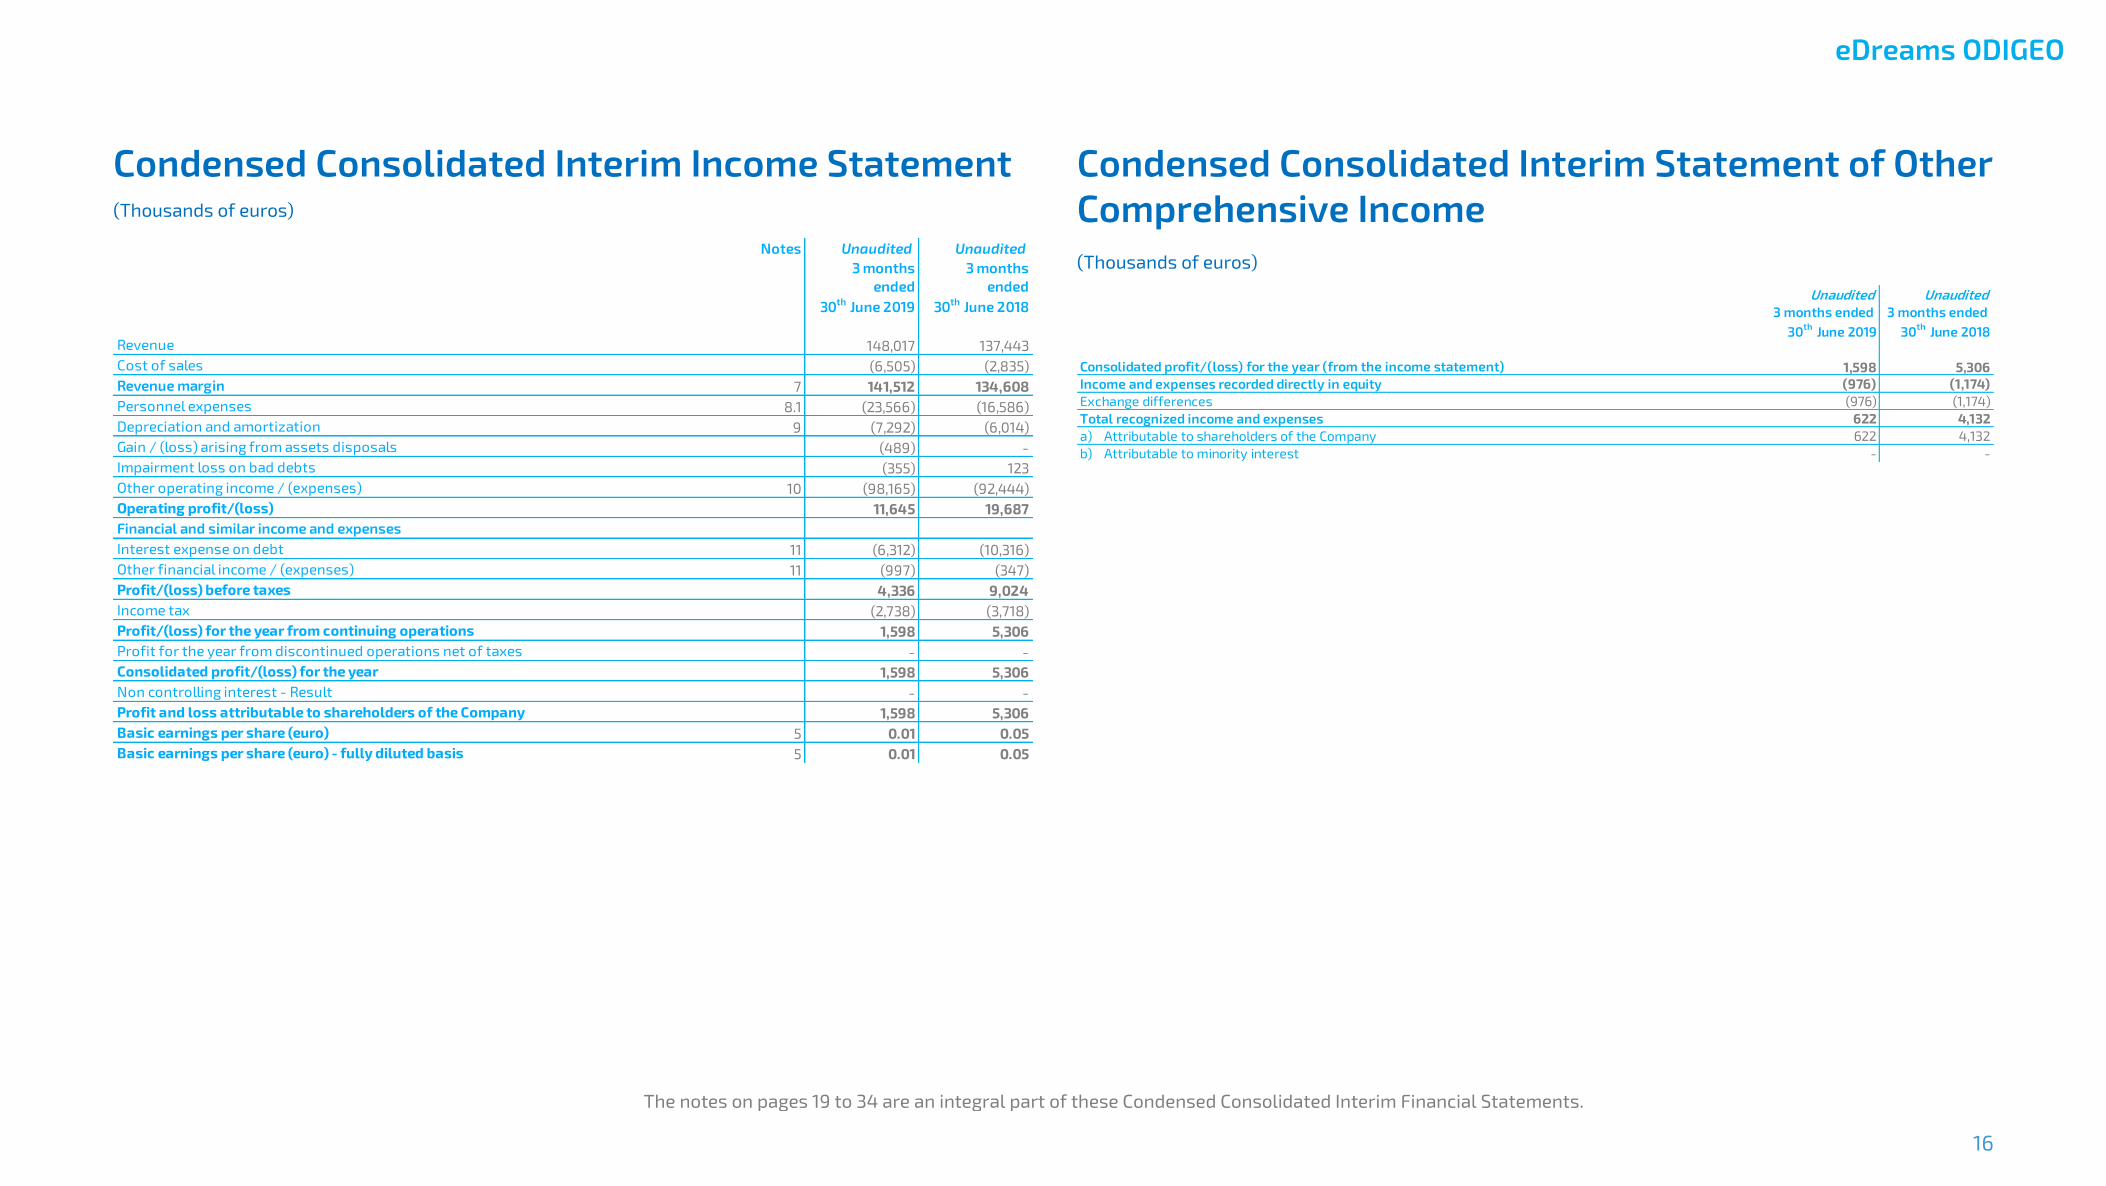
Condensed Consolidated Interim Income Statement
(Thousands of euros)
Condensed Consolidated Interim Statement of Other
Comprehensive Income
(Thousands of euros)
Notes Unaudited Unaudited
3 months
ended
30th
June 2019
3 months
ended
30th
June 2018
Revenue 148,017 137,443
Cost of sales (6,505) (2,835)
Revenue margin 7 141,512 134,608
Personnel expenses 8.1 (23,566) (16,586)
Depreciation and amortization 9 (7,292) (6,014)
Gain / (loss) arising from assets disposals (489) -
Impairment loss on bad debts (355) 123
Other operating income / (expenses) 10 (98,165) (92,444)
Operating profit/(loss) 11,645 19,687
Financial and similar income and expenses
Interest expense on debt 11 (6,312) (10,316)
Other financial income / (expenses) 11 (997) (347)
Profit/(loss) before taxes 4,336 9,024
Income tax (2,738) (3,718)
Profit/(loss) for the year from continuing operations 1,598 5,306
Profit for the year from discontinued operations net of taxes - -
Consolidated profit/(loss) for the year 1,598 5,306
Non controlling interest - Result - -
Profit and loss attributable to shareholders of the Company 1,598 5,306
Basic earnings per share (euro) 5 0.01 0.05
Basic earnings per share (euro) - fully diluted basis 5 0.01 0.05
Unaudited Unaudited
3 months ended
30th
June 2019
3 months ended
30th
June 2018
Consolidated profit/(loss) for the year (from the income statement) 1,598 5,306
Income and expenses recorded directly in equity (976) (1,174)
Exchange differences (976) (1,174)
622 4,132
a) Attributable to shareholders of the Company 622 4,132
b) Attributable to minority interest - -
Total recognized income and expenses
The notes on pages 19 to 34 are an integral part of these Condensed Consolidated Interim Financial Statements.
eDreams ODIGEO
17
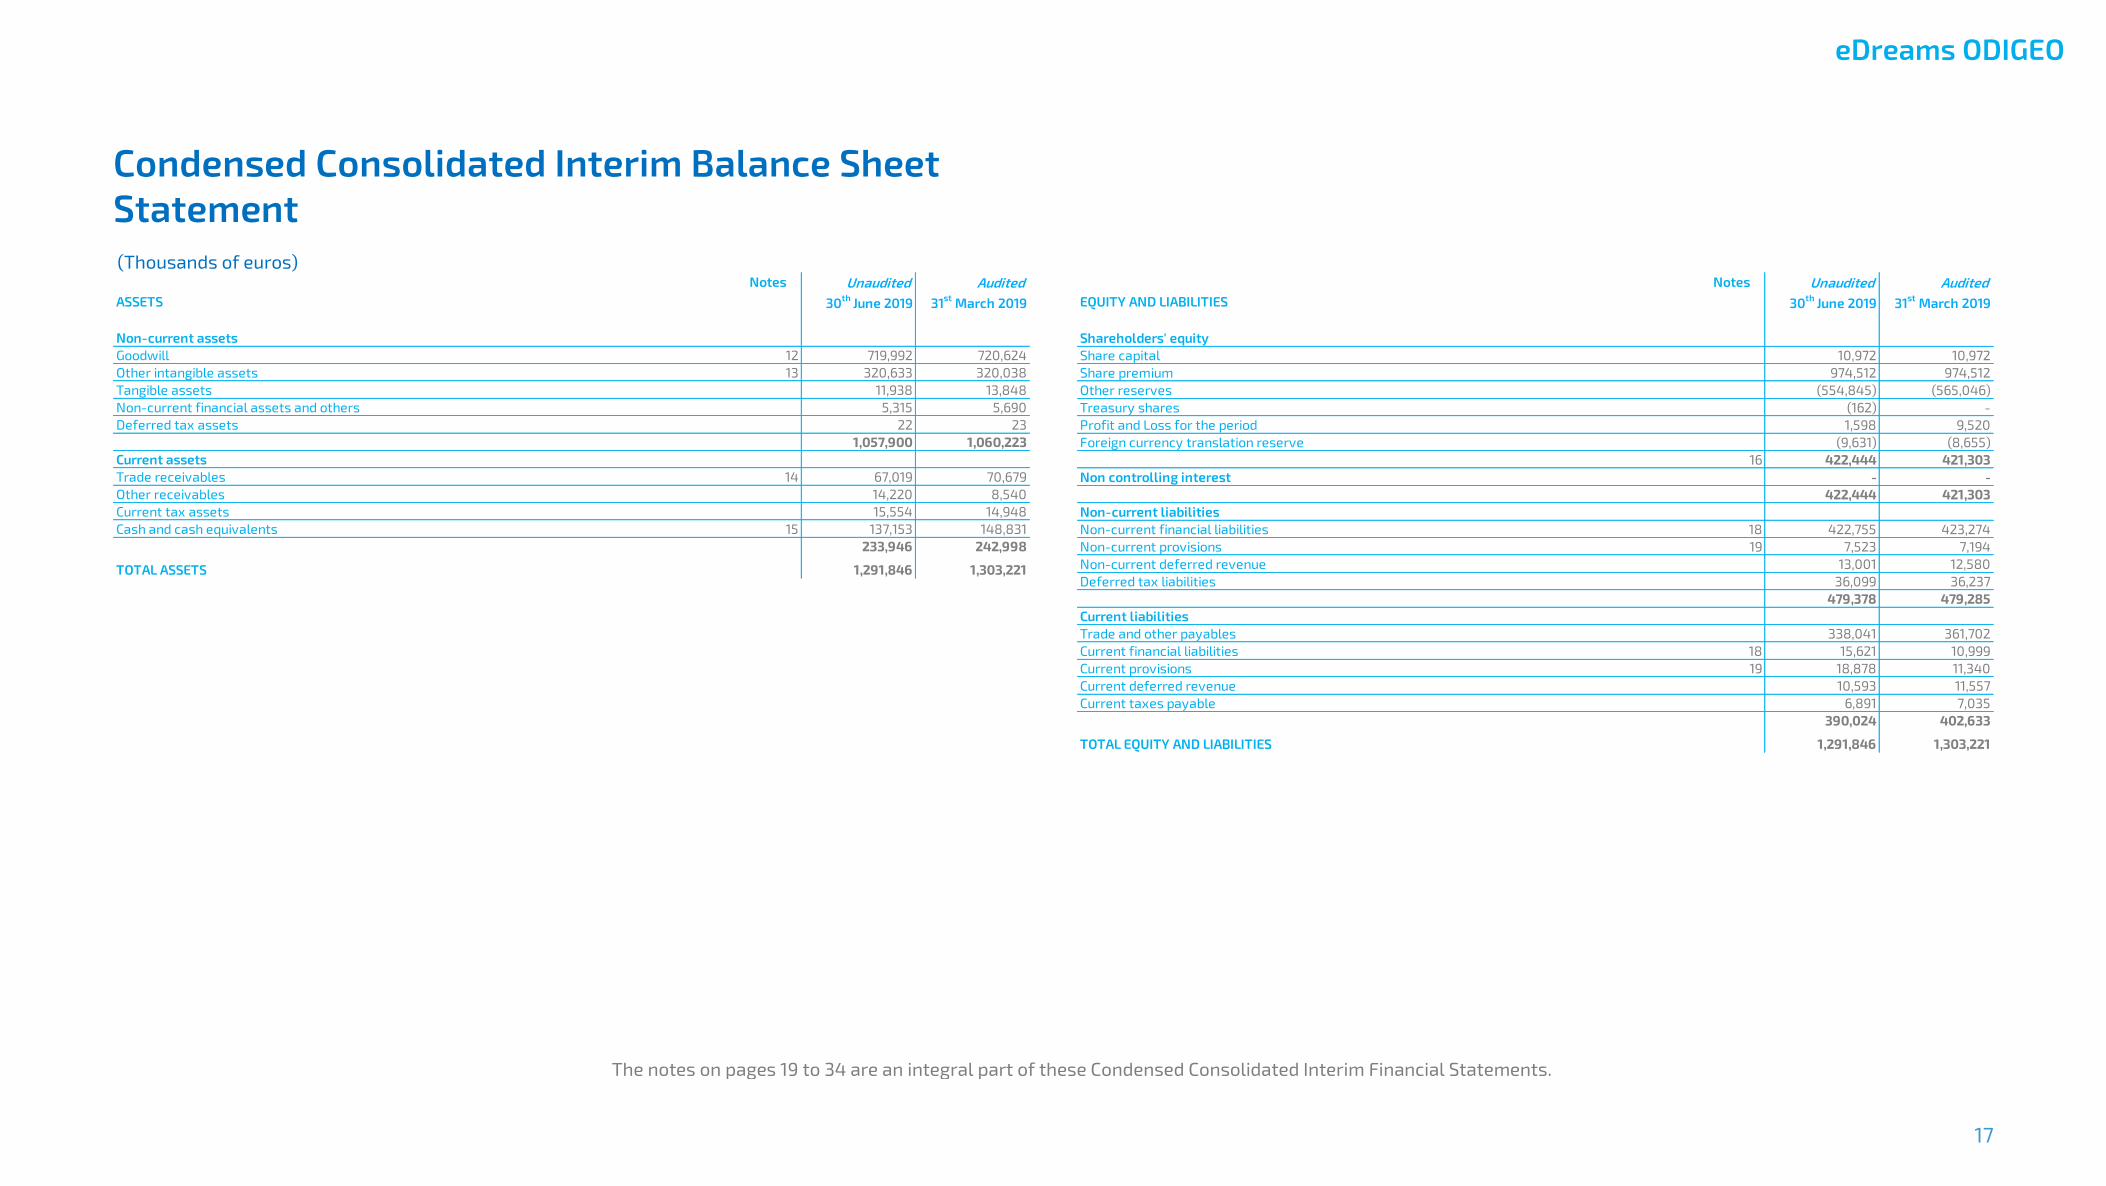
Condensed Consolidated Interim Balance Sheet
Statement
(Thousands of euros)
Unaudited Audited
ASSETS 30th
June 2019 31st
March 2019
Non-current assets
Goodwill 12 719,992 720,624
Other intangible assets 13 320,633 320,038
Tangible assets 11,938 13,848
Non-current financial assets and others 5,315 5,690
Deferred tax assets 22 23
1,057,900 1,060,223
Current assets
Trade receivables 14 67,019 70,679
Other receivables 14,220 8,540
Current tax assets 15,554 14,948
Cash and cash equivalents 15 137,153 148,831
233,946 242,998
TOTAL ASSETS 1,291,846 1,303,221
Notes Unaudited Audited
EQUITY AND LIABILITIES 30th
June 2019 31st
March 2019
Shareholders' equity
Share capital 10,972 10,972
Share premium 974,512 974,512
Other reserves (554,845) (565,046)
Treasury shares (162) -
Profit and Loss for the period 1,598 9,520
Foreign currency translation reserve (9,631) (8,655)
16 422,444 421,303
Non controlling interest - -
422,444 421,303
Non-current liabilities
Non-current financial liabilities 18 422,755 423,274
Non-current provisions 19 7,523 7,194
Non-current deferred revenue 13,001 12,580
Deferred tax liabilities 36,099 36,237
479,378 479,285
Current liabilities
Trade and other payables 338,041 361,702
Current financial liabilities 18 15,621 10,999
Current provisions 19 18,878 11,340
Current deferred revenue 10,593 11,557
Current taxes payable 6,891 7,035
390,024 402,633
TOTAL EQUITY AND LIABILITIES 1,291,846 1,303,221
Notes
The notes on pages 19 to 34 are an integral part of these Condensed Consolidated Interim Financial Statements.
eDreams ODIGEO
18
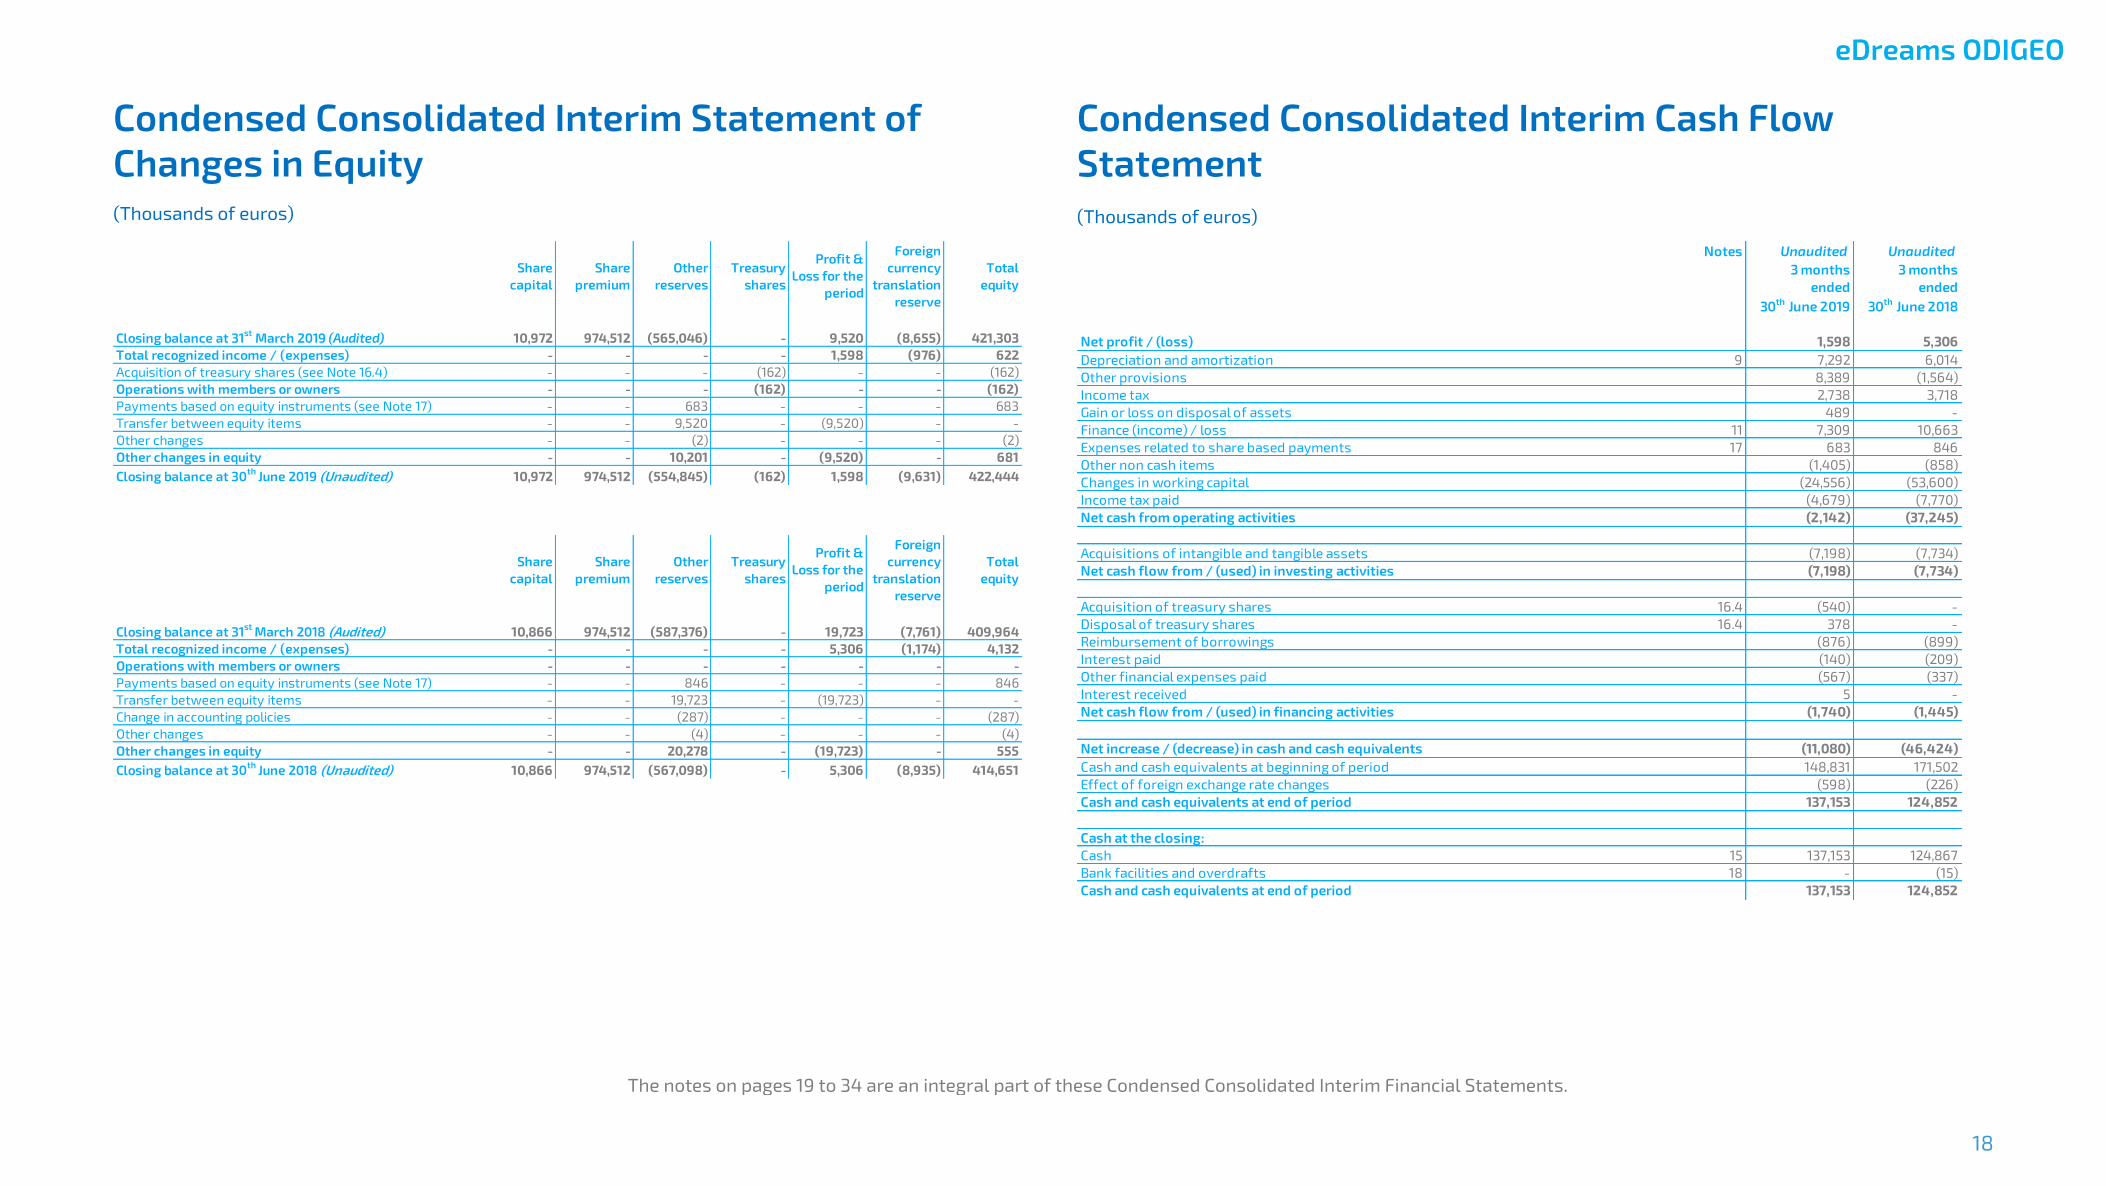
Condensed Consolidated Interim Statement of
Changes in Equity
(Thousands of euros)
Condensed Consolidated Interim Cash Flow
Statement
(Thousands of euros)
Share
capital
Share
premium
Other
reserves
Treasury
shares
Profit &
Loss for the
period
Foreign
currency
translation
reserve
Total
equity
Closing balance at 31st
March 2019 (Audited) 10,972 974,512 (565,046) - 9,520 (8,655) 421,303
Total recognized income / (expenses) - - - - 1,598 (976) 622
Acquisition of treasury shares (see Note 16.4) - - - (162) - - (162)
Operations with members or owners - - - (162) - - (162)
Payments based on equity instruments (see Note 17) - - 683 - - - 683
Transfer between equity items - - 9,520 - (9,520) - -
Other changes - - (2) - - - (2)
Other changes in equity - - 10,201 - (9,520) - 681
Closing balance at 30th
June 2019 (Unaudited) 10,972 974,512 (554,845) (162) 1,598 (9,631) 422,444
Share
capital
Share
premium
Other
reserves
Treasury
shares
Profit &
Loss for the
period
Foreign
currency
translation
reserve
Total
equity
Closing balance at 31st
March 2018 (Audited) 10,866 974,512 (587,376) - 19,723 (7,761) 409,964
Total recognized income / (expenses) - - - - 5,306 (1,174) 4,132
Operations with members or owners - - - - - - -
Payments based on equity instruments (see Note 17) - - 846 - - - 846
Transfer between equity items - - 19,723 - (19,723) - -
Change in accounting policies - - (287) - - - (287)
Other changes - - (4) - - - (4)
Other changes in equity - - 20,278 - (19,723) - 555
Closing balance at 30th
June 2018 (Unaudited) 10,866 974,512 (567,098) - 5,306 (8,935) 414,651
Notes Unaudited Unaudited
3 months
ended
30th
June 2019
3 months
ended
30th
June 2018
Net profit / (loss) 1,598 5,306
Depreciation and amortization 9 7,292 6,014
Other provisions 8,389 (1,564)
Income tax 2,738 3,718
Gain or loss on disposal of assets 489 -
Finance (income) / loss 11 7,309 10,663
Expenses related to share based payments 17 683 846
Other non cash items (1,405) (858)
Changes in working capital (24,556) (53,600)
Income tax paid (4,679) (7,770)
Net cash from operating activities (2,142) (37,245)
Acquisitions of intangible and tangible assets (7,198) (7,734)
Net cash flow from / (used) in investing activities (7,198) (7,734)
Acquisition of treasury shares 16.4 (540) -
Disposal of treasury shares 16.4 378 -
Reimbursement of borrowings (876) (899)
Interest paid (140) (209)
Other financial expenses paid (567) (337)
Interest received 5 -
Net cash flow from / (used) in financing activities (1,740) (1,445)
Net increase / (decrease) in cash and cash equivalents (11,080) (46,424)
Cash and cash equivalents at beginning of period 148,831 171,502
Effect of foreign exchange rate changes (598) (226)
Cash and cash equivalents at end of period 137,153 124,852
Cash at the closing:
Cash 15 137,153 124,867
Bank facilities and overdrafts 18 - (15)
Cash and cash equivalents at end of period 137,153 124,852
The notes on pages 19 to 34 are an integral part of these Condensed Consolidated Interim Financial Statements.

eDreams ODIGEO
19
Notes to the Condensed Consolidated Interim
Financial Statements
1. GENERAL INFORMATION
eDreams ODIGEO (formerly LuxGEO Parent S.à r.l.) was set up as a limited liability company (société à
responsabilité limitée) formed under the Laws of Luxembourg on Commercial Companies on 14th February
2011, for an unlimited period, with its registered office located at 4, rue du Fort Wallis, L-2714 Luxembourg
(the “Company” and, together with its subsidiaries, the “Group”). In January 2014, the denomination of the
Company changed to eDreams ODIGEO and its corporate form from S.à r.l. to S.A. (“Société Anonyme”).
eDreams ODIGEO and its direct and indirect subsidiaries (collectively the “Group”) headed by eDreams
ODIGEO, as detailed in Note 22, is a leading online travel company that uses innovative technology and
builds on relationships with suppliers, product know-how and marketing expertise to attract and enable
customers to search, plan and book a broad range of travel products and services.
2. SIGNIFICANT EVENTS DURING THE PERIOD ENDED 30 TH JUNE
2019
2.1 The 2019 Long-term incentive plan
The Board of Directors of the Company approved a new long-term incentive plan ("2019 LTIP") on 24th June
2019 to ensure that it continues to attract and retain high-quality management and better align the interests
of management and shareholders.
The 2019 LTIP is split equally between performance shares and restricted stock units subject to continued
service. Based on operational performance, the new scheme will be linked to stringent financial and
strategic objectives, which will be assessed in cumulative periods.
Total maximum dilution of the performance stock rights (“PSRs”) and restricted stock units (“RSUs”) would
represent, if fully vested, 4.72% of the total issued share capital of the Company, over a period of 4 years,
and therefore 1.20% yearly average on a fully diluted basis.
The new LTIP will last for four years and is designed to vest around financial results publications between
August 2022 and February 2026.
At 30th June 2019, no Incentive Shares have been granted under this Plan, so there has been no impact in the
Financial Statements.
On 16th July 2019, the Group granted to certain employees 1,566,500 rights under the 2019 LTIP. The total
value of these rights is €3.3 million.
2.2 Operational Optimisation Plan
On 28th May 2019, the Company announced an operational optimisation plan to streamline operations to
focus its efforts on its innovation and technology expertise. In line with the new operational structure, the
Company’s traditional customer service activities will be managed by best-in-class partner companies.
This organisational change that eDreams ODIGEO is appropriately structured and better positioned to
continue innovating and providing customers with a seamless travel experience as the leading one-stop-
shop for travel in Europe.
In Barcelona, the Group has reached an agreement with an international leader specialized in customer
service solutions, to operate its customer service activities. As part of the agreement, all customer service
team members that currently serve the Company’s customers from this contact centre will have their roles
preserved. The transfer of the assets to the new customer service activities operator has given rise to a
loss on disposal of assets of €0.5 million.
The Company has also made a proposal, subject to consultation, to restructure its customer service
functions currently being performed in Berlin and Milan. The Group seeks to carry out this process in close
collaboration with employees in order to find the most suitable solution.
A charge of €7.8 million has been taken as a provision for the estimated restructuring costs.
3. BASIS OF PRESENTATION
3.1 Accounting principles
The accounting policies used in the preparation of these Condensed Interim Consolidated Financial
Statements as of and for the three months period ended 30th June 2019 are the same as those applied in the
Group’s consolidated annual accounts for the year ended 31st March 2019, except for the following:
- New IFRS or IFRIC issued, or amendments to existing ones that came into effect as of 1st April 2019, the
adoption of which did not had a significant impact on the Group’s financial situation in the period of
application;
- Income tax is recorded in interim periods on a best estimate basis;
- The Impairment test performed at 31st March 2019 has not been updated as of 30th June 2019, as no
impairment indicator has been identified and therefore the Condensed Consolidated Interim Financial
Statements have not reflected any adjustment related to the impairment analysis, as at 30th June 2019.

eDreams ODIGEO
20
There is no accounting principle or policy which would have a significant effect and has not been applied in
drawing up these financial statements.
3.2 New and revised International Financial Reporting Standards
The accounting policies adopted in the preparation of the interim condensed consolidated financial
statements as of 30th June 2019 are consistent with those followed in the preparation of the Group’s annual
consolidated financial statements for the year ended 31st March 2019.
The Group has not early adopted standards and interpretations that were issued but were not yet effective
as at 1st April 2019.
3.3 Use of estimates and judgements
In the application of the Group’s accounting policies, the Board of Directors is required to make judgements,
estimates and assumptions about the carrying amounts of assets and liabilities that are not readily
apparent from other sources. The estimates and associated assumptions are based on historical
experience and other factors that are considered relevant. Actual results may differ from these estimates.
These estimates and assumptions mainly concern the measurement of intangible assets other than
goodwill, the measurement of the useful life of fixed assets, the measurement of internally generated
assets, purchase price allocation and allocation of goodwill, impairment testing of the recoverable amount,
accounting for income tax, analysis of recoverability of deferred tax assets, and accounting for provisions
and contingent liabilities.
3.4 Changes in consolidation perimeter
There have been no changes in the consolidation perimeter since 31st March 2019.
3.5 Comparative information
The Directors present, for comparison, the figures for the three months period ended 30th June 2019, along
with comparatives for each of the items on the annual consolidated statement of financial position (31st
March 2019), condensed consolidated interim income statement, condensed consolidated interim
statement of other comprehensive income, condensed consolidated interim statement of changes in equity
and condensed consolidated interim cash flow statement (30th June 2018), as well as the quantitative
information required to be disclosed in the condensed consolidated interim financial statements.
3.6 Working capital
The Group had negative working capital as of 30th June 2019 and 31st March 2019, which is usual in the
business in which the Group operates and considering its financial structure. It does not present any
impediment to its normal business.
The Group’s Super Senior Revolving Credit Facility (“SSRCF”) is available to fund its working capital needs
and Guarantees (see Note 18).
4. SEASONALITY OF BUSINESS
We experience seasonal fluctuations in the demand for travel services and products offered by us. Because
we generate the largest portion of our revenue margin from flight bookings, and most of that revenue for
flight is recognized at the time of booking, we tend to experience higher revenues in the periods during
which travellers book their vacations, i.e., during the first and second calendar quarters of the year,
corresponding to bookings for the busy spring and summer travel seasons. Consequently, comparisons
between subsequent quarters may not be meaningful.
5. EARNINGS PER SHARE
The basic earnings per share are calculated by dividing the profit attributable to equity holders of the
Company by the average number of shares.
In the earning per share calculation as of 30th June 2019 and 2018 dilutive instruments are considered for
the Incentive Shares granted (see Note 17).
The calculation of basic earnings per share and fully diluted earnings per share (rounded to two digits) for
the three months periods ended 30th June 2019 and 2018, is as follows:
Profit
attributable to
the owners of
the parent
(€ thousand)
Average
Number of
shares
Basic Earnings
per Share (€)
Profit
attributable to
the owners of
the parent
(€ thousand)
Average
Number of
shares
Basic Earnings
per Share (€)
Basic earnings per share 1,598 109,677,192 0.01 5,306 108,656,998 0.05
Basic earnings per share - fully diluted basis 1,598 115,161,902 0.01 5,306 113,689,799 0.05
3 months ended
30th
June 2019
3 months ended
30th
June 2018
Unaudited Unaudited
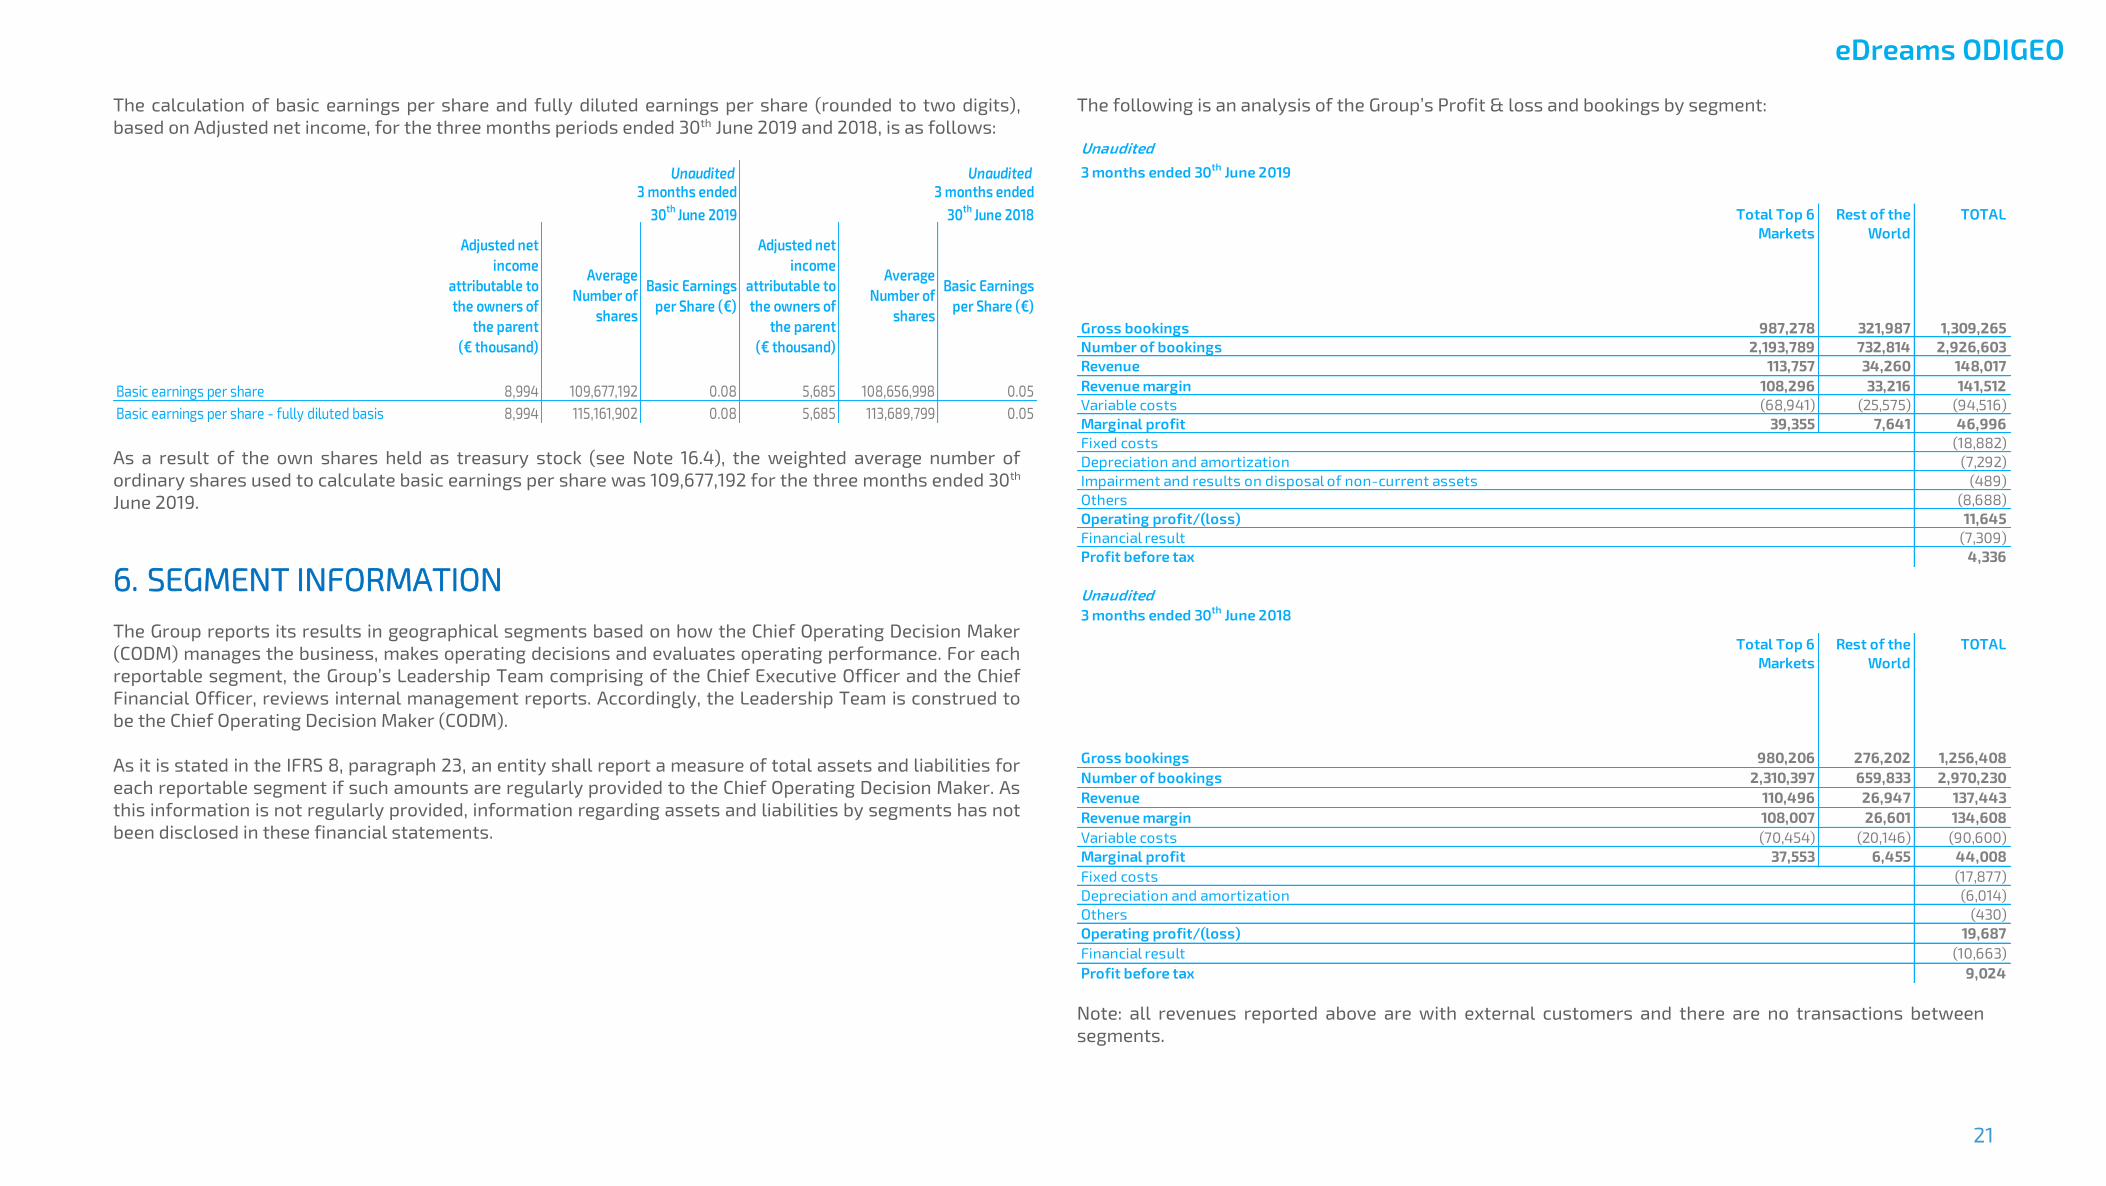
eDreams ODIGEO
21
The calculation of basic earnings per share and fully diluted earnings per share (rounded to two digits),
based on Adjusted net income, for the three months periods ended 30th June 2019 and 2018, is as follows:
As a result of the own shares held as treasury stock (see Note 16.4), the weighted average number of
ordinary shares used to calculate basic earnings per share was 109,677,192 for the three months ended 30th
June 2019.
6. SEGMENT INFORMATION
The Group reports its results in geographical segments based on how the Chief Operating Decision Maker
(CODM) manages the business, makes operating decisions and evaluates operating performance. For each
reportable segment, the Group’s Leadership Team comprising of the Chief Executive Officer and the Chief
Financial Officer, reviews internal management reports. Accordingly, the Leadership Team is construed to
be the Chief Operating Decision Maker (CODM).
As it is stated in the IFRS 8, paragraph 23, an entity shall report a measure of total assets and liabilities for
each reportable segment if such amounts are regularly provided to the Chief Operating Decision Maker. As
this information is not regularly provided, information regarding assets and liabilities by segments has not
been disclosed in these financial statements.
The following is an analysis of the Group’s Profit & loss and bookings by segment:
Note: all revenues reported above are with external customers and there are no transactions between
segments.
Adjusted net
income
attributable to
the owners of
the parent
(€ thousand)
Average
Number of
shares
Basic Earnings
per Share (€)
Adjusted net
income
attributable to
the owners of
the parent
(€ thousand)
Average
Number of
shares
Basic Earnings
per Share (€)
Basic earnings per share 8,994 109,677,192 0.08 5,685 108,656,998 0.05
Basic earnings per share - fully diluted basis 8,994 115,161,902 0.08 5,685 113,689,799 0.05
Unaudited Unaudited
3 months ended
30th
June 2019
3 months ended
30th
June 2018
Unaudited
3 months ended 30th
June 2019
Total Top 6
Markets
Rest of the
World
TOTAL
Gross bookings 987,278 321,987 1,309,265
Number of bookings 2,193,789 732,814 2,926,603
Revenue 113,757 34,260 148,017
Revenue margin 108,296 33,216 141,512
Variable costs (68,941) (25,575) (94,516)
Marginal profit 39,355 7,641 46,996
Fixed costs (18,882)
Depreciation and amortization (7,292)
Impairment and results on disposal of non-current assets (489)
Others (8,688)
Operating profit/(loss) 11,645
Financial result (7,309)
Profit before tax 4,336
Unaudited
3 months ended 30th
June 2018
Total Top 6
Markets
Rest of the
World
TOTAL
Gross bookings 980,206 276,202 1,256,408
Number of bookings 2,310,397 659,833 2,970,230
Revenue 110,496 26,947 137,443
Revenue margin 108,007 26,601 134,608
Variable costs (70,454) (20,146) (90,600)
Marginal profit 37,553 6,455 44,008
Fixed costs (17,877)
Depreciation and amortization (6,014)
Others (430)
Operating profit/(loss) 19,687
Financial result (10,663)
Profit before tax 9,024
eDreams ODIGEO
22
No single customer contributed 10% or more to the Group’s revenue.
See definitions of Alternative Performance Measures in the “Glossary of definitions” annex.
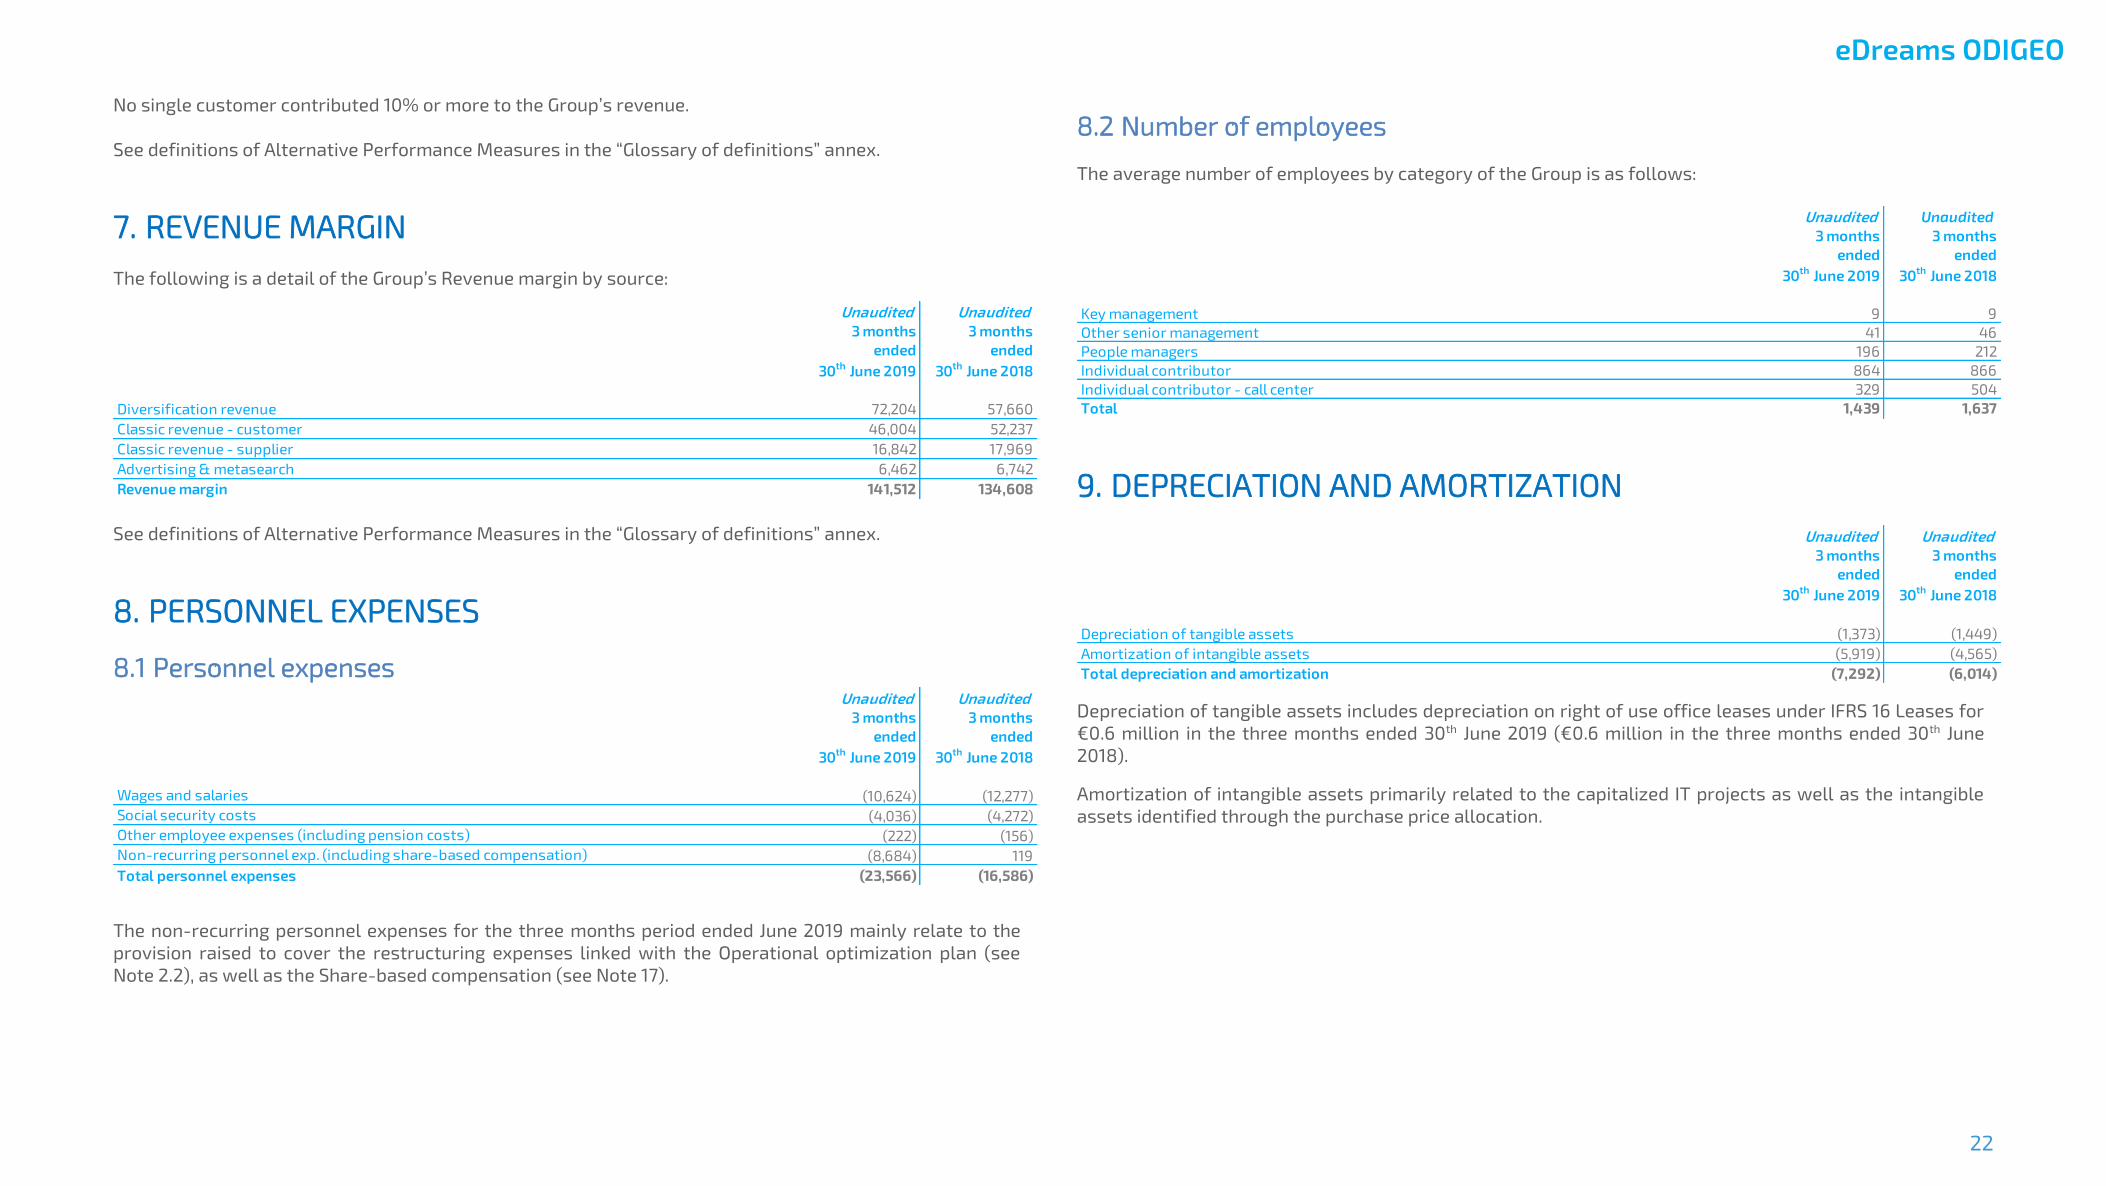
7. REVENUE MARGIN
The following is a detail of the Group’s Revenue margin by source:
See definitions of Alternative Performance Measures in the “Glossary of definitions” annex.
8. PERSONNEL EXPENSES
8.1 Personnel expenses
The non-recurring personnel expenses for the three months period ended June 2019 mainly relate to the
provision raised to cover the restructuring expenses linked with the Operational optimization plan (see
Note 2.2), as well as the Share-based compensation (see Note 17).
8.2 Number of employees
The average number of employees by category of the Group is as follows:
9. DEPRECIATION AND AMORTIZATION
Depreciation of tangible assets includes depreciation on right of use office leases under IFRS 16 Leases for
€0.6 million in the three months ended 30th June 2019 (€0.6 million in the three months ended 30th June
2018).
Amortization of intangible assets primarily related to the capitalized IT projects as well as the intangible
assets identified through the purchase price allocation.
Unaudited Unaudited
3 months
ended
30th
June 2019
3 months
ended
30th
June 2018
Diversification revenue 72,204 57,660
Classic revenue - customer 46,004 52,237
Classic revenue - supplier 16,842 17,969
Advertising & metasearch 6,462 6,742
Revenue margin 141,512 134,608
Unaudited Unaudited
3 months
ended
30th
June 2019
3 months
ended
30th
June 2018
Wages and salaries (10,624) (12,277)
Social security costs (4,036) (4,272)
Other employee expenses (including pension costs) (222) (156)
Non-recurring personnel exp. (including share-based compensation) (8,684) 119
Total personnel expenses (23,566) (16,586)
Unaudited Unaudited
3 months
ended
30th
June 2019
3 months
ended
30th
June 2018
Key management 9 9
Other senior management 41 46
People managers 196 212
Individual contributor 864 866
Individual contributor - call center 329 504
Total 1,439 1,637
Unaudited Unaudited
3 months
ended
30th
June 2019
3 months
ended
30th
June 2018
Depreciation of tangible assets (1,373) (1,449)
Amortization of intangible assets (5,919) (4,565)
Total depreciation and amortization (7,292) (6,014)

eDreams ODIGEO
23
10. OTHER OPERATING INCOME/(EXPENSES)
Marketing expenses consist of customer acquisition costs (such as paid search costs, metasearch costs
and other promotional campaigns), commissions due to agents and white label partners.
Other operating expenses primarily consist of credit card processing costs (incurred only under the
merchant model), chargebacks on fraudulent transactions, GDS search costs and fees paid to our
outsourcing service providers, such as call centers.
A large portion of the other operating expenses is variable costs, directly related to volume of bookings or
transactions processed.
IT expenses mainly consist of technology maintenance charges and hosting expenses.
11. FINANCIAL INCOME AND EXPENSE
In September 2018, the Group refinanced its debt repaying the 2021 Notes, and obtaining the new 2023
Notes. The 2023 Notes bear interest at 5.5% (3pp lower than the 2021 Notes), which explain the decrease in
the interest expense on debt.
12. GOODWILL
A detail of the goodwill movement by markets for the three months period ended 30th June 2019 is set out
below:
As at 30th June 2019, the amount of the goodwill corresponding to the Nordic markets decreased due to the
evolution of the euro compared to the functional currency of these countries, with a balancing entry under
“Foreign currency translation reserve”.
Unaudited Unaudited
3 months
ended
30th
June 2019
3 months
ended
30th
June 2018
Marketing and other operating expenses (91,342) (87,953)
Professional fees (2,095) (1,803)
IT expenses (3,969) (1,493)
Rent charges (392) (441)
Taxes (226) (71)
Foreign exchange losses / (gains) (137) (134)
Non-recurring expenses (4) (549)
(98,165) (92,444)Total other operating income and expenses
Unaudited Unaudited
3 months
ended
30th
June 2019
3 months
ended
30th
June 2018
Interest expense on 2023 Notes (5,844) -
Interest expense on 2021 Notes - (9,111)
Interest expense on SSRCF (18) (218)
Effective interest rate impact on debt (450) (987)
Interest expense on debt (6,312) (10,316)
Foreign exchange differences (364) 180
Interest expense on lease liabilities (56) (78)
Other financial expense (582) (449)
Other financial income 5 -
Other financial income / (expense) (997) (347)
Total financial result (7,309) (10,663)
Audited Unaudited
Net Goodwil at
31st
March 2019
Exchange rate
Diferences
Net Goodwil at
30th
June 2019
Markets
France 326,522 - 326,522
Spain 49,073 - 49,073
UK 39,033 - 39,033
Italy 44,087 - 44,087
Germany 155,718 - 155,718
Nordics 40,399 (632) 39,767
Metasearch 8,608 - 8,608
Other markets 54,710 - 54,710
Connect (Budgetplaces) 2,474 - 2,474
Total 720,624 (632) 719,992
eDreams ODIGEO
24
A detail of the goodwill movement by markets for the three months period ended 30th June 2018 is set out
below:
As at 30th June 2018, the amount of the goodwill corresponding to the Nordic markets decreased due to the
fluctuation of the euro compared to the functional currency of these countries, with a balancing entry
under “Foreign currency translation reserve”.
13. OTHER INTANGIBLE ASSETS
The other intangible assets at 30th June 2019 movement breakdown as follows:
The other intangible assets at 30th June 2018 movement breakdown as follows:
“Acquisitions” mainly correspond to the capitalization of the technology developed by the Group which, due
to its functional benefits, contributes towards attracting new customers and retaining the existing ones.
14. TRADE RECEIVABLES
Trade receivables from contracts with customers at 30th June 2019, and 31st March 2019:
15. CASH AND CASH EQUIVALENTS
16. EQUITY
16.1 Share capital
The Company’s share capital amounts to €10,971,905.20 and is represented by 109,719,052 shares with a
face value of €0.10 per share.
Audited Unaudited
Net Goodwil at
31st
March 2018
Exchange rate
Diferences
Net Goodwil at
30th
June 2018
Markets
France 326,522 - 326,522
Spain 49,073 - 49,073
UK 39,033 - 39,033
Italy 44,087 - 44,087
Germany 155,718 - 155,718
Nordics 40,846 (660) 40,186
Metasearch 8,608 - 8,608
Other markets 54,710 - 54,710
Connect (Budgetplaces) 2,474 - 2,474
Total 721,071 (660) 720,411
Balance at 31st
March 2019 (Audited) 320,038
Acquisitions 6,514
Amortization (see note 9) (5,919)
Balance at 30th
June 2019 (Unaudited) 320,633
Balance at 31st
March 2018 (Audited) 313,145
Acquisitions 7,168
Amortization (see note 9) (4,565)
Balance at 30th
June 2018 (Unaudited) 315,748
Unaudited Audited
30th
June 2019 31st
March 2019
Trade receivables 24,808 24,429
Accrued income 47,146 50,168
Impairment loss on trade receivables and accrued income (6,387) (6,014)
Provision for booking cancellation (1,153) (982)
Trade related deferred expenses 2,605 3,078
Trade receivables 67,019 70,679
Unaudited Audited
30th
June 2019 31st
March 2019
Cash and other cash equivalents 137,153 148,831
Cash and cash equivalents 137,153 148,831
Unaudited Audited
30th
June 2019 31st
March 2019
Share capital 10,972 10,972
Share premium 974,512 974,512
Treasury shares (162) -
Equity-settled share based payments 7,988 7,305
Retained earnings & others (562,833) (572,351)
Profit & Loss atributable to the parent company 1,598 9,520
Foreign currency translation reserve (9,631) (8,655)
Total equity 422,444 421,303
eDreams ODIGEO
25
16.2 Share premium
The share premium account may be used to provide for the payment of any shares, which the Company
may repurchase from its shareholders, to offset any net realized losses, to make distributions to the
shareholders in the form of a dividend or to allocate funds to the legal reserve.
16.3 Equity-settled share-based payments
The amount recognized under “equity-settled share-based payments” in the consolidated balance sheet at
30th June 2019 and 2018 arose as a result of the Long Term Incentive plans given to the employees.
As at 30th June 2019, the only Long Term Incentive plan currently granted to employees is the 2016 LTIP
detailed in Note 17.
16.4 Treasury shares
On 29t th April 2019, the Company entered into a liquidity contract with GVC Gaesco Beka, Sociedad de
Valores, S.A. (the “Financial Intermediary”) with the purpose of favoring the liquidity and regularity of the
Company’s shares quotation, within the limits established by the Company’s Shareholders General Meeting
and the applicable regulation, in particular, Circular 1/2017, of 26t th April of the Spanish National Securities
Market Regulator (Comisión Nacional del Mercado de Valores) on liquidity contracts (“Circular 1/2017”) .
The Financial Intermediary performs the operation regulated by the liquidity contract in the Spanish
regulated markets, through the market of orders, according to the contracting rules, within the usual
trading hours of these and as established in Rule 3 of Circular 1/2017.
The contract entered into effect on 29th April 2019 and it has a duration of 12 months, tacitly renewable for
a similar term.
As at 30th June 2019, the Group had 48,464 treasury shares under the liquidity contract, carried in equity at
€162 thousand. These shares corresponded to acquisitions for €540 thousands and disposals of €378
thousands, at an average price of €3.344 per share. The treasury shares have been fully paid.
16.5 Foreign currency translation reserve
The foreign currency translation reserve corresponds to the net amount of the exchange differences
arising from the translation of the financial statements of eDreams LLC, Liligo Hungary Kft, Findworks
Technologies Bt, Geo Travel Pacific Ltd and Travellink AB since they are denominated in currencies other
than the euro.
17. SHARE-BASED COMPENSATION
On 12th September 2016, the Extraordinary Shareholders Meeting, upon proposal from the Board of
Directors, approved amendments to the Articles of Incorporation of the Company, necessary to execute an
LTIP: the 2016 LTIP (“Long Term Incentive Plan”) for Managers, to ensure that it continues to attract and
retain high quality management and better align the interest of management and shareholders.
The 2016 LTIP is split equally between performance shares and half restricted stock units’ subject to
continued service. Based on operational performance, the new scheme will be linked to stringent financial
and strategic objectives.
The 2016 LTIP will last for four years and will vest between August 2018 and February 2022 based on
financial results.
As at 30th June 2019 5,387,145 rights have been granted since the beginning of the plan under the 2016 LTIP,
of which 385,575 shares (The First Tranche – First Delivery), 377,546 shares (The First Tranche –Second
Delivery) and 377,546 shares (The First Tranche – Third Delivery) had been delivered as shares in August
2018, November 2018 and February 2019, respectively.
Total maximum dilution of the performance stock rights (“PSRs”) and restricted stock units (“RSUs”) would
represent, if fully vested, 6.32% of the total issued share capital of the Group, over a period of 4 years, and
therefore 1.58% yearly average on a fully diluted basis.
Expected dilution (which takes into account attrition and actual expected achievement of stringent
financial and strategic objectives) for all PSRs and RSUs since the IPO is a 1.1% yearly average over an 8-
year period.
The cost of the 2016 LTIP has been recorded in the Income Statement (Personnel expenses) (see Note 8.1)
and against Equity (included in Equity-settled share based payments, see Note 16.3), amounting to €0.7
million and €0.8 million in 30th June 2019 and 2018 respectively.

eDreams ODIGEO
26
18. FINANCIAL LIABILITIES
The Group debt and other Financial Liabilities at 30th June 2019 and 31st March 2019 are as follows:
Senior Notes – 2023 Notes
On 25th September 2018, eDreams ODIGEO issued €425 million 5.50% Senior Secured Notes with a maturity
date of 1st September 2023 (“the 2023 Notes”).
Interest on the 2023 Notes is payable semi-annually in arrears on the 1st of March and 1st of September each
year.
Revolving Credit Facility
On 4th October 2016, the Group also refinanced its Super Senior Revolving Credit Facility (“the SSRCF”),
increasing the size to €147 million from the previous €130 million, and gaining significant flexibility as well
versus the previous terms.
On May 2017, the Group obtained the modification of the SSRCF from 4th October 2016 increasing the
commitment in €10 million to a total of €157 million.
On September 2018, the Group obtained another modification of the SSRCF increasing the commitment to
€175 million, and extending its maturity until September 2023.
The interest rate of the SSRCF is the benchmark rate (such as EURIBOR for euro transactions) plus a margin
of 3.00%. Though at any time after 30th September 2018, and subject to certain conditions, the margin may
decrease to be between 3.00% and 2.00%.
The SSRCF Agreement includes a financial covenant, the Consolidated Total Gross Debt Cover ratio,
calculated as follows:
Total Gross Debt Cover ratio = Gross Financial Debt / Last Twelve Month Adjusted EBITDA.
The Gross Debt Cover ratio is calculated quarterly and may not exceed 6.
As at 30th June 2019 and 31st March 2019, the Gross Debt Cover ratio was 3.7 and 3.7 respectively, so the
Company was in compliance with ample headroom.
At the end of June 2019 and March 2019, the Group had not drawn under the SSRCF.
19. PROVISIONS
As at 30th June 2019 there is a provision of €6.5 million for tax risks (€6.2 million on 31st March 2019), which
is a mix of indirect tax and income tax risks. In certain cases, the Company applied a tax treatment, which, if
challenged by the tax authorities, may probably result in a cash outflow.
As at 30th June 2019, the caption “Provisions for other employee benefits” has increased significantly due to
the provision for the restructuring linked with the Operational Optimization Plan (see Note 2.2).
The caption “Provisions for operating risks and others” mainly includes €6.9 million on the provisions for
Cancellation for any reason and Flexiticket (€6.4 million on 31st March 2019). This is the provision related to
the services of Cancellation and Modification available at any time to the customer.
20. CONTINGENCIES AND PROVISIONS
20.1 Insurance premium tax
The Group considers that there is a possible risk of reassessment of insurance premium tax in certain
jurisdictions where the Group renders mediation services to its customers regarding the supply of travel
Current Non Current Total Current Non Current Total
2023 Notes - 419,078 419,078 - 418,767 418,767Total principal - 419,078 419,078 - 418,767 418,767Accrued interest - 2023 Notes 7,792 - 7,792 1,948 - 1,948Total interest 7,792 - 7,792 1,948 - 1,948Total borrowing 7,792 419,078 426,870 1,948 418,767 420,715
Bank facilities and bank overdrafts - - - - - -Lease liabilities 2,961 3,677 6,638 3,366 4,507 7,873Other financial liabilities 4,868 - 4,868 5,685 - 5,685Total other financial liabilities 7,829 3,677 11,506 9,051 4,507 13,558
Total financial liabilities 15,621 422,755 438,376 10,999 423,274 434,273
31st
March 201930th
June 2019
Unaudited Audited
Unaudited Audited
30th
June 2019 31st
March 2019
Provision for tax risks 6,532 6,244
Provision for pensions and other post employment benefits 991 950
Total non-current provisions 7,523 7,194
Provision for litigation risks 1,972 2,195
Provision for pensions and other post employment benefits 35 35
Provision for other employee benefits 7,829 303
Provision for operating risks and others 9,042 8,807
Total current provisions 18,878 11,340

eDreams ODIGEO
27
insurance by insurers. This risk is relating to the possible view of local tax authorities that part of the
remuneration received by the Group for the mediation of the travel insurance to its customers in certain
countries should be considered basis for the levy of insurance premium tax. This risk is estimated at €1.6
million. The Group takes the view that it has sufficient grounds to successfully defend its position in case of
an assessment by local tax authorities. As this risk is considered unlikely to result in a cash outflow, no
liability has been recognized in the balance sheet.
20.2 Dispute with UK tax authorities
The Group has been assessed by the UK tax authorities for an amount of €0.4 million. This concerns a
dispute regarding the qualification for VAT purposes of the contractual relationship between the UK entity
and a UK bed bank. The Group disputes the UK tax authorities’ view that the UK entity should have paid UK
VAT on the margin which it has generated in respect of this contractual relationship relating to hotel
accommodation that is located outside the UK. The Group has appealed against the assessment with the
UK First Tier Tribunal, which has ruled in our favor concerning the interpretation under English law.The U.K.
tax authorities have requested the First Tier Tribunal to raise preliminary questions to the CJEU regarding
the interpretation of the VAT Directive. The First Tier Tribunal has rejected this request. The U.K. tax
authorities have requested permission to appeal with the Upper Tribunal on this matter on which the First
Tier Tribunal has not yet taken a decision. As the risk is considered only possible, no liability has been
recognized in the balance sheet.
20.3 License fees
The Group considers that there is a possible risk of reassessment by tax authorities in respect of license
fees charged between entities of the Group for the use of certain self-developed software. Tax authorities
may take the view that there was an undercharge of such license fees to the users. This risk is estimated at
a maximum amount of €2.8 million. The Group believes that it has made the appropriate charges of license
fees. As the risk is considered only possible, no liability has been recognized in the balance sheet.
20.4 Payroll tax
The Group considers that there is a possible risk of assessment by tax authorities in respect of salary tax
(“taxe sur les salaires”) due by the French entity. This tax is due on salary cost in case less than 90% of the
French entity’s turnover (including dividends received) is subject to VAT. The Company considers that only
the salary cost of part of the French entity’s employees are subject to this salary tax, whereas the French
tax authorities may take the view that the salary cost of all employees should be included in the taxable
basis. This risk is estimated at €0.6 million. The Group believes that it has paid payroll taxes in accordance
with tax laws and regulations. As the risk is considered only possible, no liability has been recognized in the
balance sheet.
20.5 Tax contingencies
The Group companies may be subject to audit by the tax authorities in respect of the taxes applicable to
them for the years that are not statute-barred.
As a result of different interpretations of tax legislation, additional liabilities may arise as a result of a tax
audit. However, the Group considers that any such liabilities would not materially affect the consolidated
financial statements.
20.6 Investigation by the Italian consumer protection authority (AGCM)
On 18 th January 2018, the Italian consumer protection authority (AGCM) rendered three decisions against Go
Voyages SAS, eDreams Srl and Opodo Italia Srl in relation to alleged unfair commercial practices based on
the three following grounds (i) Lack of transparency, (ii) surcharging practice, and (iii) non-authorized use
of premium-rate numbers.
The amounts of fines issued by the AGCM are as follows: Go Voyages SAS (€0.8 million), eDream Srl (€0.7
million) and Opodo Srl (€0.1 million). A provision for this was booked on the balance sheet for €1.6 million at
31st March 2018, of which the main part has been already paid.
An appeal was lodged before the TAR Lazio in order to challenge the legal grounds invoked by the AGCM
and the amount of fines. In April and May 2019, the appeal judgments were notified. The TAR reduced the
amount of fines as follows: Go Voyages SAS (€0.2 million), eDreams Srl (€0.3 million) and Opodo Srl (€0.1
million). The TAR Lazio judgments will become final 3 months after their adoption, or can be subject to an
appeal from the AGCM before the Consiglio di Stato.
The Group expects to collect the amount corresponding to fines paid in excess within 1 year, so an account
receivable has been recognized for €0.3 million.
21. SUBSEQUENT EVENTS
21.1 Capital increase
On 22nd August 2019, the Board of Directors resolved issue share capital of €37,954.80 represented by
379,548 ordinary shares, of €0.10 each.
As a result of the news shares’ issuance, the Company’s share capital amounts to €11,009,860 and is
represented by 110,098,600 shares with a face value of €0.10 per share.
eDreams ODIGEO
28
21.2 Change in composition of Board of Directors
On 26th August 2019, the Board of Directors appointed Thomas Vollmoeller as new Chairman and
Independent Director, effective 1st January 2020, subject to the shareholder’s approval of his nomination as
Independent Director during the Company’s next Annual General Meeting.
This new appointment to the Board follows the resignation of Phillip C. Wolf, who currently serves as
Chairman and Independent Director since 2015 and 2014, respectively.
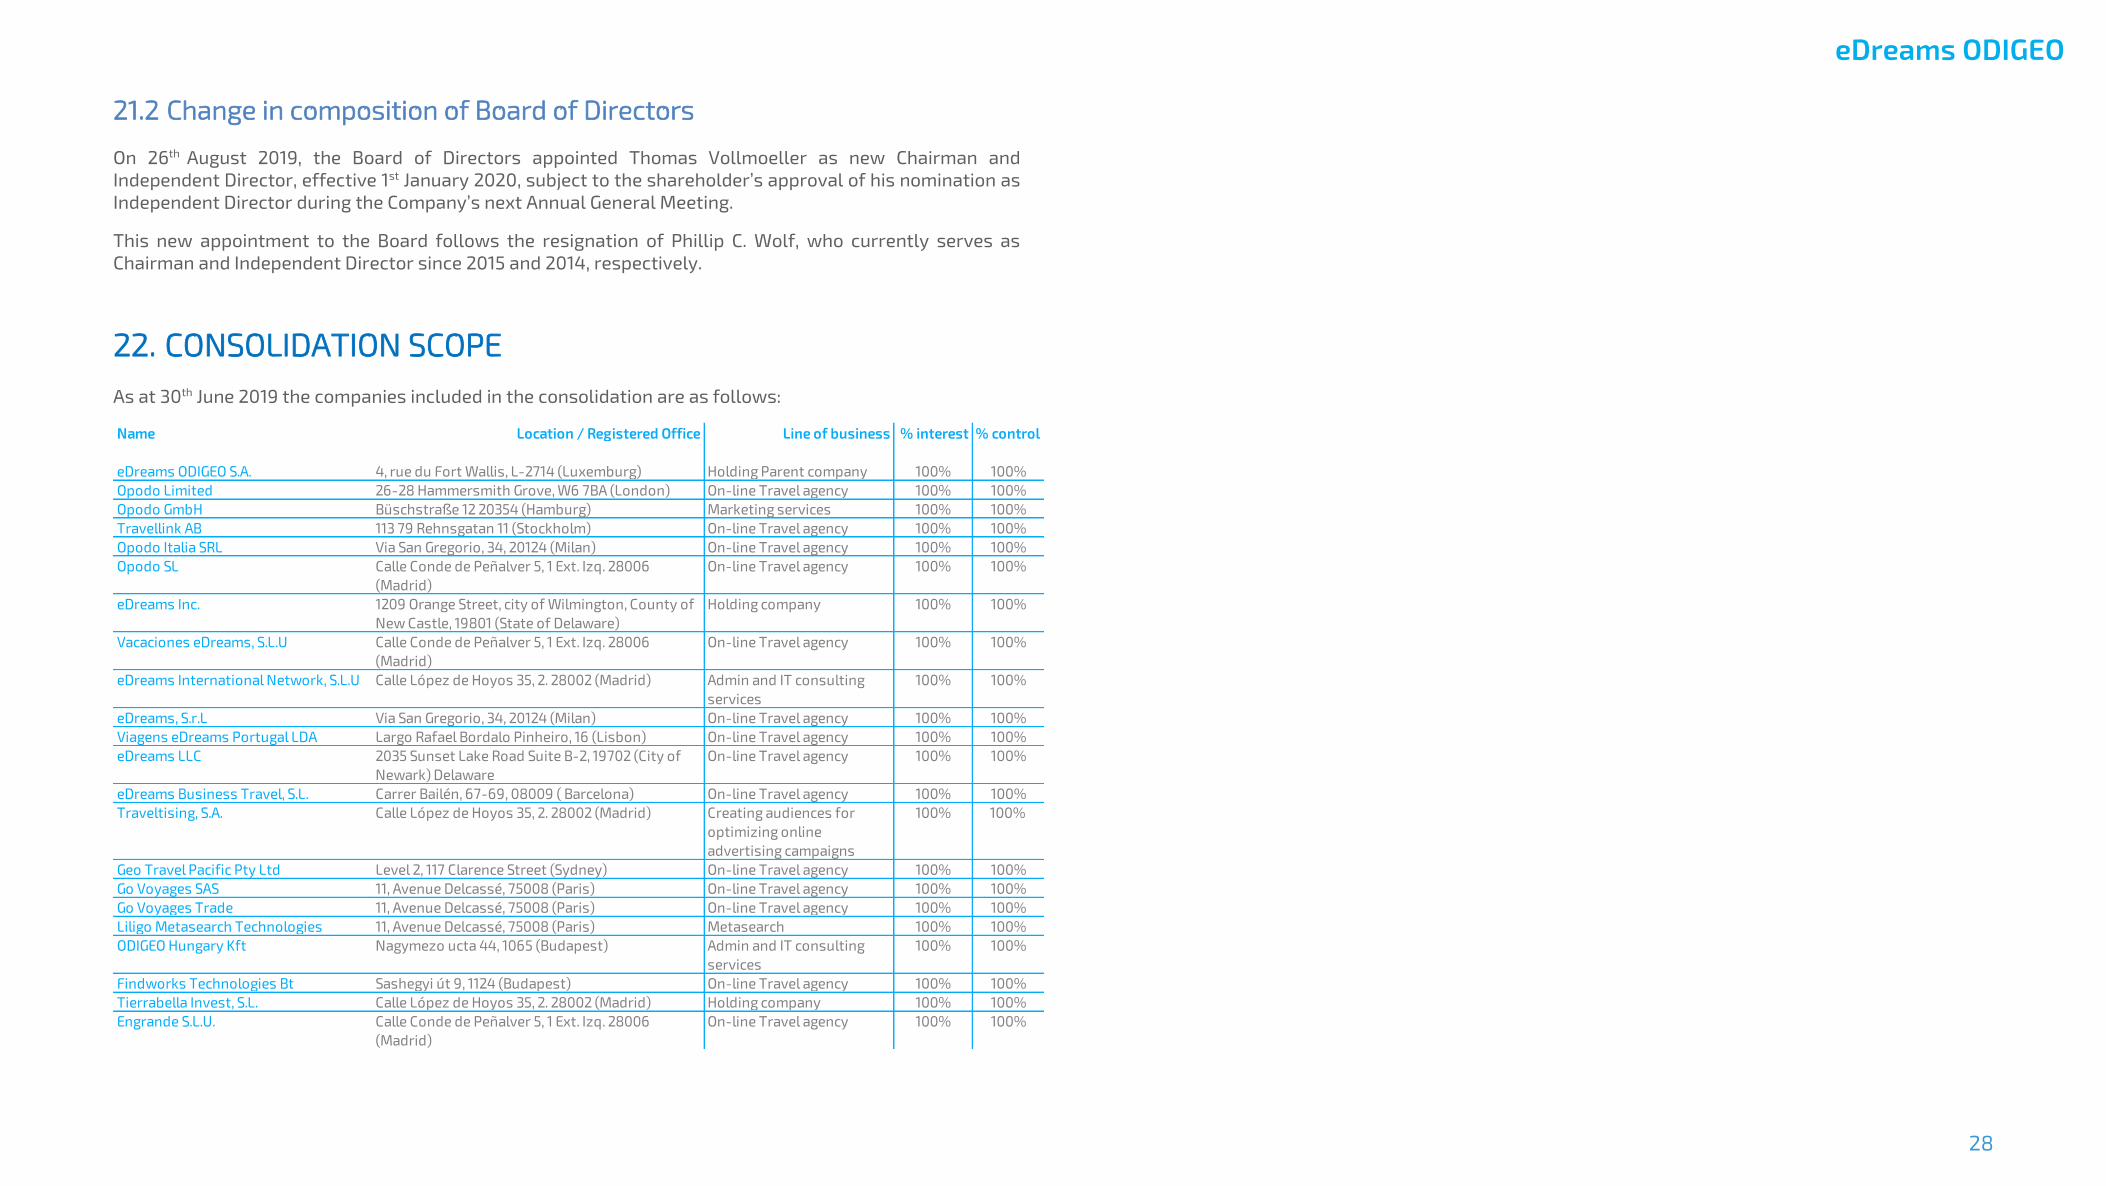
22. CONSOLIDATION SCOPE
As at 30th June 2019 the companies included in the consolidation are as follows:
Name Location / Registered Office Line of business % interest % control
eDreams ODIGEO S.A. 4, rue du Fort Wallis, L-2714 (Luxemburg) Holding Parent company 100% 100%
Opodo Limited 26-28 Hammersmith Grove, W6 7BA (London) On-line Travel agency 100% 100%
Opodo GmbH Büschstraße 12 20354 (Hamburg) Marketing services 100% 100%
Travellink AB 113 79 Rehnsgatan 11 (Stockholm) On-line Travel agency 100% 100%
Opodo Italia SRL Via San Gregorio, 34, 20124 (Milan) On-line Travel agency 100% 100%
Opodo SL Calle Conde de Peñalver 5, 1 Ext. Izq. 28006
(Madrid)
On-line Travel agency 100% 100%
eDreams Inc. 1209 Orange Street, city of Wilmington, County of
New Castle, 19801 (State of Delaware)
Holding company 100% 100%
Vacaciones eDreams, S.L.U Calle Conde de Peñalver 5, 1 Ext. Izq. 28006
(Madrid)
On-line Travel agency 100% 100%
eDreams International Network, S.L.U Calle López de Hoyos 35, 2. 28002 (Madrid) Admin and IT consulting
services
100% 100%
eDreams, S.r.L Via San Gregorio, 34, 20124 (Milan) On-line Travel agency 100% 100%
Viagens eDreams Portugal LDA Largo Rafael Bordalo Pinheiro, 16 (Lisbon) On-line Travel agency 100% 100%
eDreams LLC 2035 Sunset Lake Road Suite B-2, 19702 (City of
Newark) Delaware
On-line Travel agency 100% 100%
eDreams Business Travel, S.L. Carrer Bailén, 67-69, 08009 ( Barcelona) On-line Travel agency 100% 100%
Traveltising, S.A. Calle López de Hoyos 35, 2. 28002 (Madrid) Creating audiences for
optimizing online
advertising campaigns
100% 100%
Geo Travel Pacific Pty Ltd Level 2, 117 Clarence Street (Sydney) On-line Travel agency 100% 100%
Go Voyages SAS 11, Avenue Delcassé, 75008 (Paris) On-line Travel agency 100% 100%
Go Voyages Trade 11, Avenue Delcassé, 75008 (Paris) On-line Travel agency 100% 100%
Liligo Metasearch Technologies 11, Avenue Delcassé, 75008 (Paris) Metasearch 100% 100%
ODIGEO Hungary Kft Nagymezo ucta 44, 1065 (Budapest) Admin and IT consulting
services
100% 100%
Findworks Technologies Bt Sashegyi út 9, 1124 (Budapest) On-line Travel agency 100% 100%
Tierrabella Invest, S.L. Calle López de Hoyos 35, 2. 28002 (Madrid) Holding company 100% 100%
Engrande S.L.U. Calle Conde de Peñalver 5, 1 Ext. Izq. 28006
(Madrid)
On-line Travel agency 100% 100%

eDreams ODIGEO
29
6. GLOSSARY
eDreams ODIGEO
30
Glossary of definitions
Alternative Performance Measure
Non-reconcilable to GAAP measures
Acquisition Cost per Booking Index refers to the most relevant marketing expenses incurred to acquire
new customers (encompassing Paid search, Metasearch and Affiliates), divided by the total number of
Bookings. For any given period, the ratio is expressed as an index 100, in which 100 is the value of
Acquisition Cost per Booking for the 3 months ended on December 2015. The acquisition cost per booking
index provides to the reader a view of the trend of one of the main variable cost (marketing cost) of the
business.
Gross Bookings refers to the total amount paid by our customers for travel products and services booked
through or with us (including the part that is passed on to, or transacted by, the travel supplier), including
taxes, service fees and other charges and excluding VAT. Gross Bookings include the gross value of
transactions booked under both agency and principal models as well as transactions made under white
label arrangements and transactions where we act as a ‘‘pure’’ intermediary whereby we serve as a click-
through and pass the reservations made by the customer to the relevant travel supplier. Gross Bookings
provide to the reader a view about the economic value of the services that the Group mediates.
Reconcilable to GAAP measures
Adjusted EBITDA means operating profit/loss before depreciation and amortization, impairment and
profit/(loss) on disposals of non-current assets, certain share-based compensation, restructuring
expenses and other income and expense items which are considered by management to not be reflective of
our ongoing operations. Adjusted EBITDA provide to the reader a better view about the ongoing EBITDA
generated by the Group.
Adjusted Net Income means our IFRS net income less certain share-based compensation, restructuring
expenses and other income and expense items which are considered by management to not be reflective of
our ongoing operations. Adjusted Net Income provides to the reader a better view about the ongoing
results generated by the Group.
EBIT means operating profit/loss. This measure, although it is not specifically defined in IFRS, is generally
used in the financial markets and is intended to facilitate analysis and comparability.
EBITDA means operating profit/loss before depreciation and amortization, impairment and profit/loss on
disposals of non-current assets. This measure, although it is not specifically defined in IFRS, is generally
used in the financial markets and is intended to facilitate analysis and comparability.
(Free) Cash Flow before financing means cash flow from operating activities plus cash flow from investing
activities.
Gross Financial Debt means total financial liabilities considering financing cost capitalized plus accrued
interests and overdraft. It includes both non-current and current financial liabilities. This measure offers to
the reader a global view of the Financial Debt without considering the payment terms.
Gross Leverage Ratio means the total amount of outstanding Gross Financial Debt on a consolidated basis
divided by “Adjusted EBITDA”. This measure offers to the reader a view about the capacity of the Group to
generate enough resources to repay the Gross Financial Debt.
Net Financial Debt means “Gross Financial Debt” less “cash and cash equivalents”. This measure offers to
the reader a global view of the Financial Debt without considering the payment terms and reduced by the
effects of the available cash and cash equivalents to face these future payments.
Net Income means Consolidated profit/loss for the year.
Net Leverage Ratio means the total amount of outstanding Net Financial Debt on a consolidated basis
divided by “Adjusted EBITDA”. This measure offers to the reader a view about the capacity of the Group to
generate enough resources to repay the Gross Financial Debt, also considering the available cash in the
Group.
Revenue Diversification Ratio is a ratio representing the amount of Diversification Revenue earned in a
twelve-month period as a percentage of our total revenue. Our management believes that the presentation
of the Revenue Diversification Ratio measure may be useful to readers to help understand the results of
our revenue diversification strategy.
Revenue Margin means our IFRS revenue less cost of supplies. Our management uses Revenue Margin to
provide a measure of our revenue after reflecting the deduction of amounts we pay to our suppliers in
connection with the revenue recognition criteria used for products sold under the principal model (gross
value basis). Accordingly, Revenue Margin provides a comparable revenue measure for products, whether
sold under the agency or principal model

eDreams ODIGEO
31
Other Defined Terms
Advertising and Metasearch Revenue represents revenue from other ancillary sources, such as advertising
on our websites and revenue from our metasearch activities. Our management believes that the
presentation of the Advertising and Metasearch Revenue measure may be useful to readers to help
understand the results of our revenue diversification strategy.
Bookings refers to the number of transactions under the agency model and the principal model as well as
transactions made under white label arrangements. One Booking can encompass one or more products and
one or more passengers.
Classic Customer Revenue represents customer revenue other than Diversification Revenues earned
through flight service fees, cancellation and modification fees, tax refunds and mobile application revenue.
Our management believes that the presentation of the Classic Customer Revenues measure may be useful
to readers to help understand the results of our revenue diversification strategy.
Classic Supplier Revenue represents supplier revenue earned through GDS incentives for Bookings
mediated by us through GDSs and incentives received from payment service providers. Our management
believes that the presentation of the Classic Supplier Revenues measure may be useful to readers to help
understand the results of our revenue diversification strategy.
Customer Repeat Booking Rate (%) refers to the ratio, expressed on a percentage basis, of Bookings made
in a quarter by customers who made a prior Booking in the 12 months prior to that quarter divided by the
total number of Bookings. The ratio is annualized, multiplying by four and by the ratio of the quarter over
the average of last 4 quarters, to eliminate seasonality effects.
Customer Relationship Management (CRM) represents the set of activities that will encourage our
customers to repeat business with us: visit our site again and make another booking. To be successful we
need to understand our customers' behaviours and needs: we collect, analyse and use data to make each of
those interactions with customers as personalised and relevant as possible.
Diversification Revenue represents revenue other than Classic Customer Revenue, Classic Supplier
Revenues or Advertising and Metasearch Revenue, earned through vacation products (including car rentals,
hotels and Dynamic Packages), flight ancillaries (including reserved seats, additional check-in luggage,
travel insurance and additional service options), travel insurance, as well as certain commissions, over-
commissions and incentives directly received from airlines. Our management believes that the
presentation of the Diversification Revenues measure may be useful to readers to help understand the
results of our revenue diversification strategy.
Fixed Costs includes IT expenses net of capitalization write-off, personnel expenses which are not Variable
Costs, external fees, building rentals and other expenses of fixed nature. Our management believes the
presentation of Fixed Costs may be useful to readers to help understand our cost structure and the
magnitude of certain costs we have the ability to reduce in response to changes affecting the number of
transactions processed.
Fixed Costs per Booking means fixed costs divided by the number of bookings. See definitions of "Fixed
costs" and "Bookings".
Flight Business refers to our operations relating to the supply of flight mediation services.
Non-flight Business refers to our operations relating to the supply of non-flight mediation services, as well
as other non-travel activities such as advertising on our websites, incentives we receive from payment
processors, charges on toll calls and Liligo’s metasearch activity.
Non-recurring Items refers to share-based compensation, restructuring expenses and other income and
expense items which are considered by management to not be reflective of our ongoing operations.
Product Diversification Ratio (%) is a ratio expressed on a percentage basis and calculated by dividing the
number of flight ancillary products and non-flight products linked to Bookings (such as insurance,
additional check-in luggage, reserved seats, certain additional service options, Dynamic Packages and car
rental) by the total number of Bookings for a given period.
Top 6 Markets and Top 6 Segments refers to our operations in France, Spain, Italy, Germany, UK and
Nordics.
Variable Costs includes all expenses which depend on the number of transactions processed. These
include acquisition costs, merchant costs and other costs of a variable nature, as well as personnel costs
related to call centers as well as corporate sales personnel. Our management believes the presentation of
Variable Costs may be useful to readers to help understand our cost structure and the magnitude of certain
costs. We have the ability to reduce certain costs in response to changes affecting the number of
transactions processed.
Variable Costs per Booking means variable costs divided by the number of bookings. See definitions of
"Variable costs" and "Bookings".

eDreams ODIGEO
32
7. RECONCILIATION
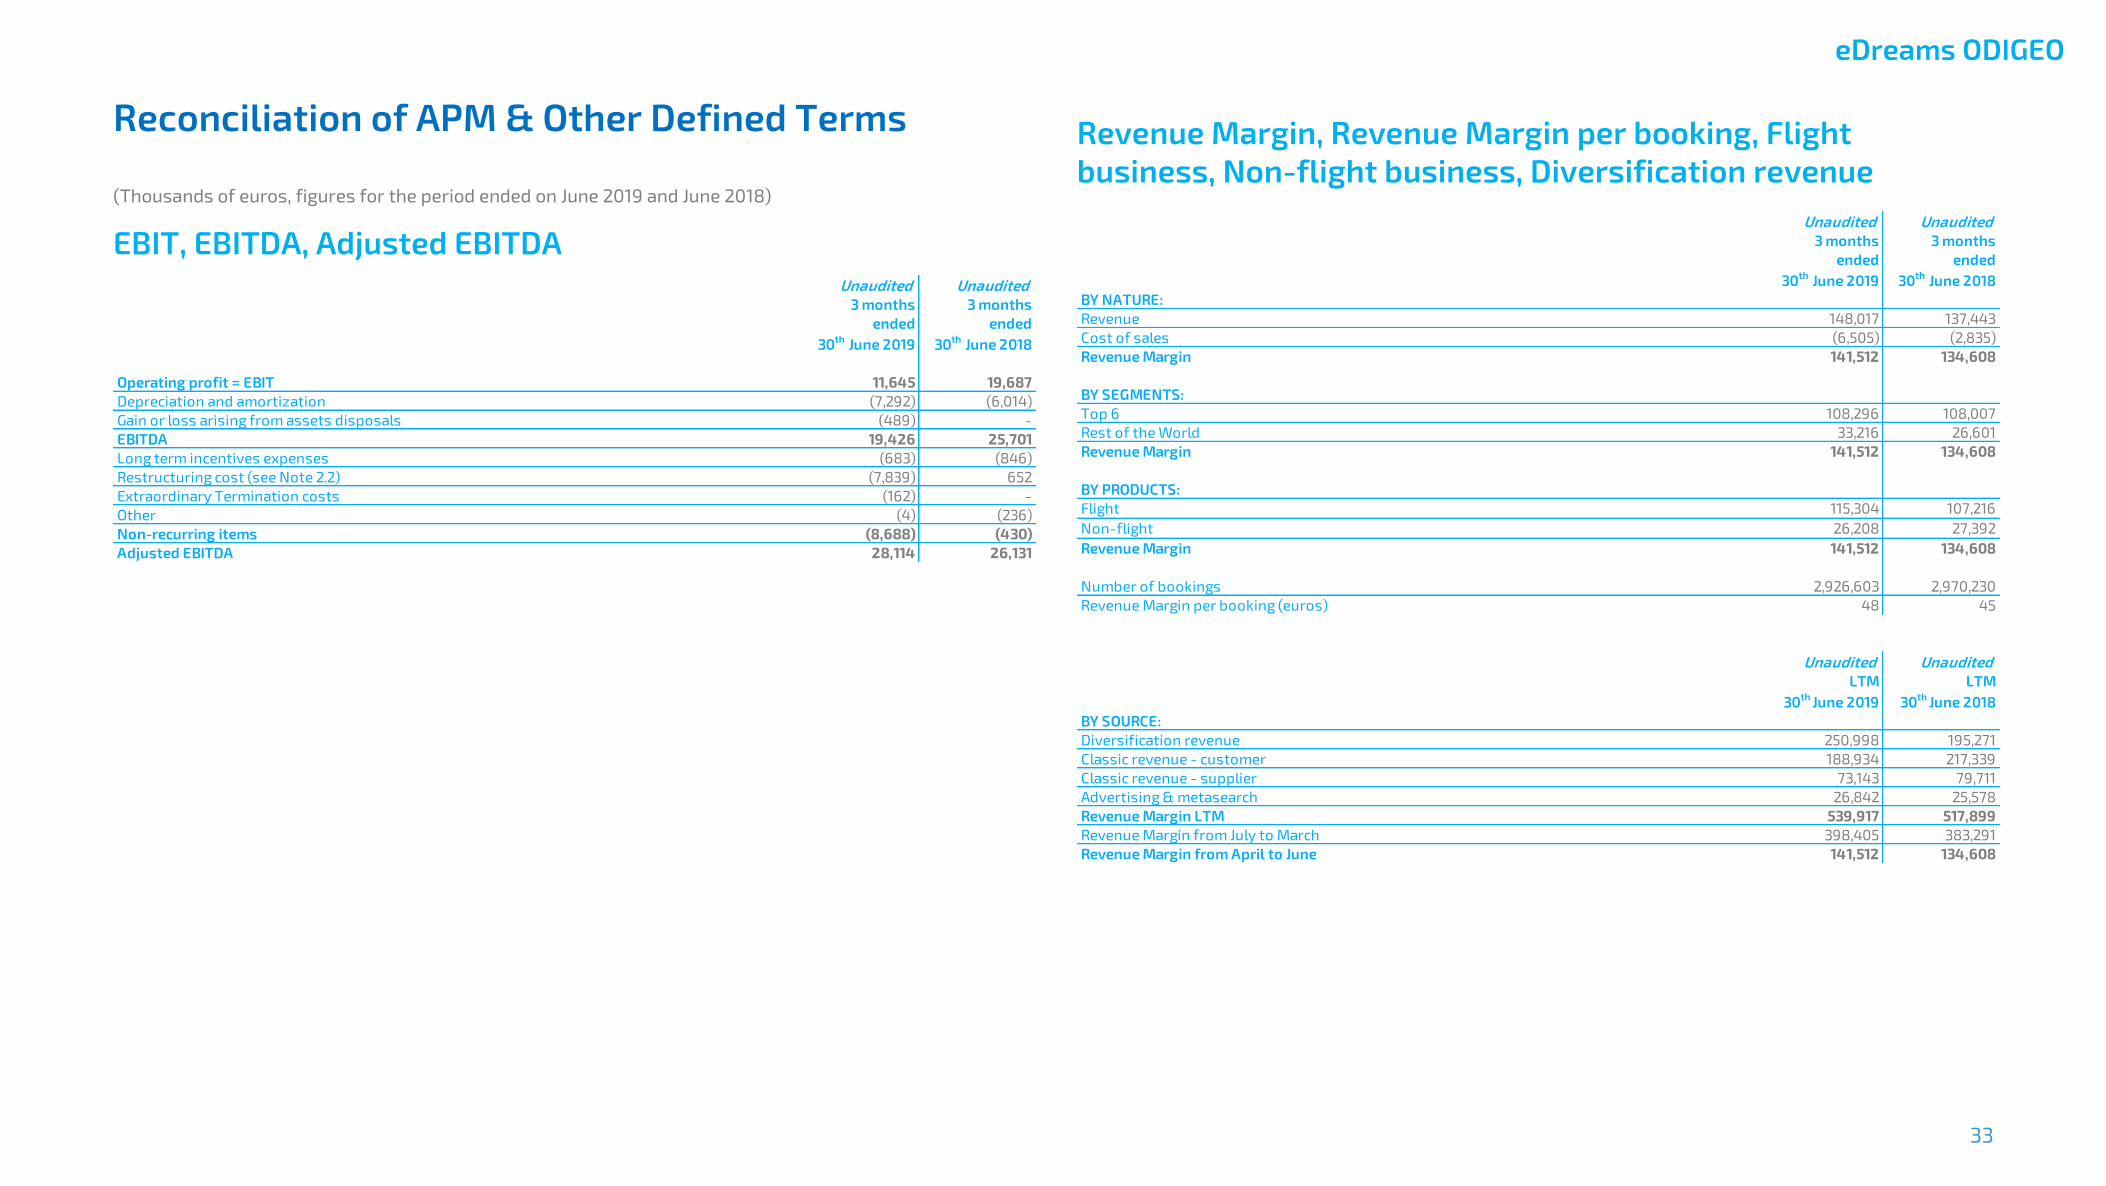
eDreams ODIGEO
33
Reconciliation of APM & Other Defined Terms
(Thousands of euros, figures for the period ended on June 2019 and June 2018)
EBIT, EBITDA, Adjusted EBITDA
Revenue Margin, Revenue Margin per booking, Flight
business, Non-flight business, Diversification revenue
Unaudited Unaudited
3 months
ended
30th
June 2019
3 months
ended
30th
June 2018
Operating profit = EBIT 11,645 19,687
Depreciation and amortization (7,292) (6,014)
Gain or loss arising from assets disposals (489) -
EBITDA 19,426 25,701
Long term incentives expenses (683) (846)
Restructuring cost (see Note 2.2) (7,839) 652
Extraordinary Termination costs (162) -
Other (4) (236)
Non-recurring items (8,688) (430)
Adjusted EBITDA 28,114 26,131
Unaudited Unaudited
3 months
ended
30th
June 2019
3 months
ended
30th
June 2018
BY NATURE:
Revenue 148,017 137,443
Cost of sales (6,505) (2,835)
Revenue Margin 141,512 134,608
BY SEGMENTS:
Top 6 108,296 108,007
Rest of the World 33,216 26,601
Revenue Margin 141,512 134,608
BY PRODUCTS:
Flight 115,304 107,216
Non-flight 26,208 27,392
Revenue Margin 141,512 134,608
Number of bookings 2,926,603 2,970,230
Revenue Margin per booking (euros) 48 45
Unaudited Unaudited
LTM LTM
30th
June 2019 30th
June 2018
BY SOURCE:
Diversification revenue 250,998 195,271
Classic revenue - customer 188,934 217,339
Classic revenue - supplier 73,143 79,711
Advertising & metasearch 26,842 25,578
Revenue Margin LTM 539,917 517,899
Revenue Margin from July to March 398,405 383,291
Revenue Margin from April to June 141,512 134,608

eDreams ODIGEO
34
Gross Financial Debt, Net Financial Debt
Fixed Cost, Variable Cost, Non-recurring items
(Free) Cash Flow before Financing
Adjusted Net Income
Unaudited Audited
30th
June 2019 31st
March 2019
Non-current financial liabilities 422,755 423,274
Current financial liabilities 15,621 10,999
Gross Financial Debt 438,376 434,273
(-) Cash and cash equivalents (137,153) (148,831)
Net Financial Debt 301,223 285,442
Unaudited Unaudited
3 months
ended
30th
June 2019
3 months
ended
30th
June 2018
Fixed cost (18,882) (17,877)
Variable cost (94,516) (90,600)
Non-recurring items (8,688) (430)
Operating cost (122,086) (108,907)
Personnel expenses (23,566) (16,586)
Impairment loss on bad debts (355) 123
Other operating income / (expenses) (98,165) (92,444)
Operating cost (122,086) (108,907)
Unaudited Unaudited
3 months
ended
30th
June 2019
3 months
ended
30th
June 2018
Net cash from operating activities (2,142) (37,245)
Net cash flow from / (used) in investing activities (7,198) (7,734)
Free Cash Flow before financing activities (9,340) (44,979)
Unaudited Unaudited
3 months ended
30th
June 2019
3 months ended
30th
June 2018
Net Income 1,598 5,306
Non-recurring items (included in EBITDA) 8,688 430
Loss on transfer of Barcelona customer service assets (Note 2.2) 489 -
Tax effect of the above adjustments (1,781) (51)
Adjusted net income 8,994 5,685
Adjusted net income per share (€) 0.08 0.05
Adjusted net income per share - fully diluted basis 0.08 0.05

RESULTS PRESENTATION
1Q FY2020
eDreams ODIGEO
29th August 2019
“Revolutionize the online travel booking sector moving from
transaction to subscription model through our unique
subscription program Prime, which offers the ability to engage
with the customer throughout the full travel journey”

Disclaimer▶ This presentation is to be read as an introduction to the unaudited condensed consolidated interim financial statements of the Group and contains key information presented in a concise manner
on the Group and its financial condition. The information contained in this presentations is extracted from the unaudited condensed consolidated interim financial statements of the Group and is
qualified in its entirety by the additional information contained in the unaudited condensed consolidated interim financial statements of the Group. This presentation should only be read in
conjunction with the condensed consolidated interim financial statements of the Group. Copies of the condensed consolidated interim financial statements of the Group are available under
http://www.edreamsodigeo.com/category/investors/quarterly-edreams-odigeo/.
▶ Certain statements included or incorporated by reference within this presentation may constitute “forward-looking statements” in respect of the Group’s operations, performance, prospects
and/or financial condition and the industry in which the Group operates. By their nature, forward-looking statements involve a number of risks, uncertainties and assumptions and actual results or
events may differ materially from those expressed or implied by those statements. Accordingly, no assurance can be given that any particular expectation will be met and reliance should not be
placed on any forward-looking statement. Additionally, forward-looking statements regarding past trends or activities should not be taken as a representation that such trends or activities will
continue in the future. Statements in this presentation reflect the knowledge and information available at the time of its preparation. The Group does not undertake any responsibility or obligation
to update the information in this presentation, including any forward-looking statement resulting from new information, future events or otherwise. Nothing in this presentation should be
construed as a profit forecast.
▶ This presentation does not constitute or form part of, and should not be construed as, an offer or invitation to sell, or a solicitation of any offer to purchase or acquire any securities or related
financial instruments of the company, nor shall it or any part of it or the fact of its distribution form the basis of, or be relied on in connection with, any contract or commitment or investment
decisions relating thereto, nor does it constitute a recommendation regarding the securities of the company. No securities of eDreams ODIGEO have been or will be registered under the U.S.
Securities Act of 1933, as amended (the “Securities Act”) and may not be offered or sold in the United States absent registration or an exemption from registration under the Securities Act. Past
performance cannot be relied upon as a guide to future performance and persons needing advice should consult an independent financial adviser.
▶ This presentation has been sent to you in an electronic form. You are reminded that documents transmitted via this medium may be altered or changed during the process of transmission and,
consequently, neither eDreams ODIGEO nor any of its subsidiaries, nor any director, officer, employer, employee or agent of theirs, or affiliate of any such person, accepts any liability or
responsibility whatsoever in respect of any difference between the presentation distributed to you in electronic format and the hard copy version available to you on request.
▶ In the United Kingdom, this presentation is directed only at persons who (i) fall within Article 43(2) of the Financial Services and Markets Act 2000 (Financial Promotion) Order 2005, as amended
(the “Order”), (ii) are persons having professional experience in matters relating to investments who fall within the definition of “investment professionals” in Article 19(5) of the Order, or (iii) are
persons who are high net worth entities falling within Article 49(2)(a) to (d) of the Order, and other persons to whom it may lawfully be communicated (together “Relevant Persons”). Under no
circumstances should persons who are not Relevant Persons rely or act upon the contents of this presentation. Any investment or investment activity to which this presentation relates in the
United Kingdom is available only to, and will be engaged only with, Relevant Persons.
▶ The financial information included in this presentation includes certain non-GAAP measures, including “Bookings”, “Gross Bookings”, “EBITDA”, “Adjusted EBITDA”, “Revenue Margin” and “Variable
Costs”, which are not accounting measures as defined by IFRS. We have presented these measures because we believe that they are useful indicators of our financial performance and our ability to
incur and service our indebtedness and can assist analysts, investors and other parties to evaluate our business. However, these measures should not be used instead of, or considered as
alternatives to, the condensed consolidated interim financial statements for the Group based on IFRS. Further, these measures may not be comparable to similarly titled measures disclosed by
other companies.

Overview
• Overview
• 1Q Results FY20
• Outlook
• Appendix

4
Performance in line with guidance
o Bookings 2.9 million in Q1 FY20, (-1% year-on-year), in line with strategic revenue model shift and
guidance
o Revenue up 5% to €141.5 million in 1Q FY20
o Adjusted EBITDA growth of 8% to €28.1 million in 1Q FY20
o Cash position (net of overdrafts) stood at €137.1 million, up 10% versus €124.9 million in 1Q FY19
Revenue diversification initiatives delivering results
o Diversification revenues up 25% year-on-year, continue with strong growth and 57% larger than our
Classic Customer Revenue
o Revenue diversification ratio up to 46% (from 38%)
o Product diversification ratio up to 76% (from 60%)
o Mobile bookings up to 40% of total flight bookings versus 36% in Q1 fiscal year 2019
Industry-leading subscription programme (Prime) is proving very successful
o Number of subscribers continue to increase and reached 325,000
o 4 of our largest markets already in Prime
Solid results, 1Q as guided
Overview
RESULTS 1Q FY20 - OVERVIEW
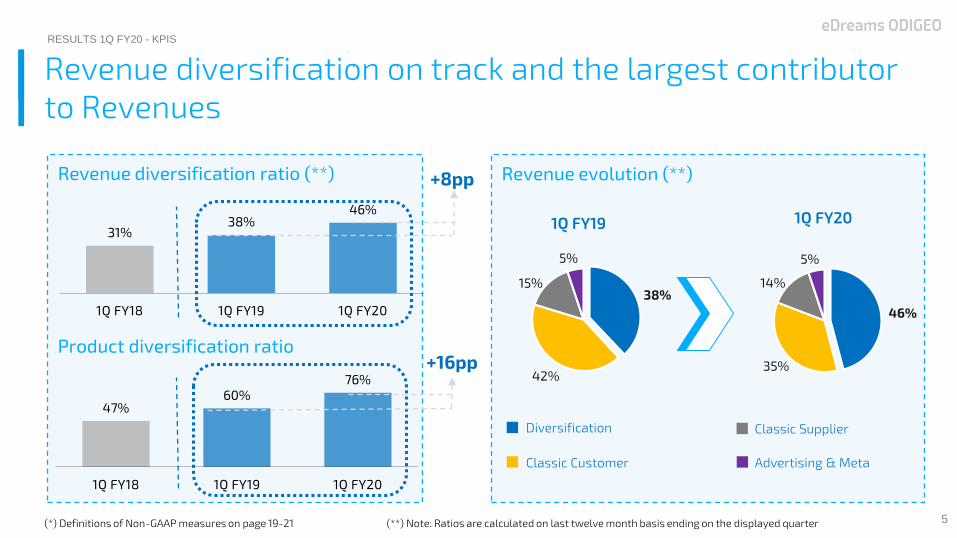
Revenue diversification on track and the largest contributor
to Revenues
(*) Definitions of Non-GAAP measures on page 19-21 (**) Note: Ratios are calculated on last twelve month basis ending on the displayed quarter
RESULTS 1Q FY20 - KPIS
5
38%
42%
15%
5%
1Q FY19 1Q FY20
Diversification
Classic Customer
Classic Supplier
Advertising & Meta
Revenue evolution (**)Revenue diversification ratio (**)
Product diversification ratio
31%38%
46%
1Q FY18 1Q FY19 1Q FY20
47%60%
76%
1Q FY18 1Q FY19 1Q FY20
+8pp
+16pp
46%
35%
14%
5%

Continued strategic progress as evidenced by our KPIs
(*) Definitions of Non-GAAP measures on page 19-21 (**) Repeat booking rate in line with guidance of short term negative impact post implementation of shift in revenue model
RESULTS 1Q FY20 - KPIS
6
100
82 81
FY15 1Q FY19 1Q FY20
Customer repeat booking rate (Annualised)(***)
-19 percentage points
Mobile bookings as share of flight bookings (**) Acquisition cost per booking index
48% 47% 50%
1Q FY18 1Q FY19 1Q FY20
32%36%
40%
1Q FY18 1Q FY19 1Q FY20
+3pp
+4pp

Results 1Q FY20
• Overview
• Results 1Q FY20
• Outlook
• Appendix
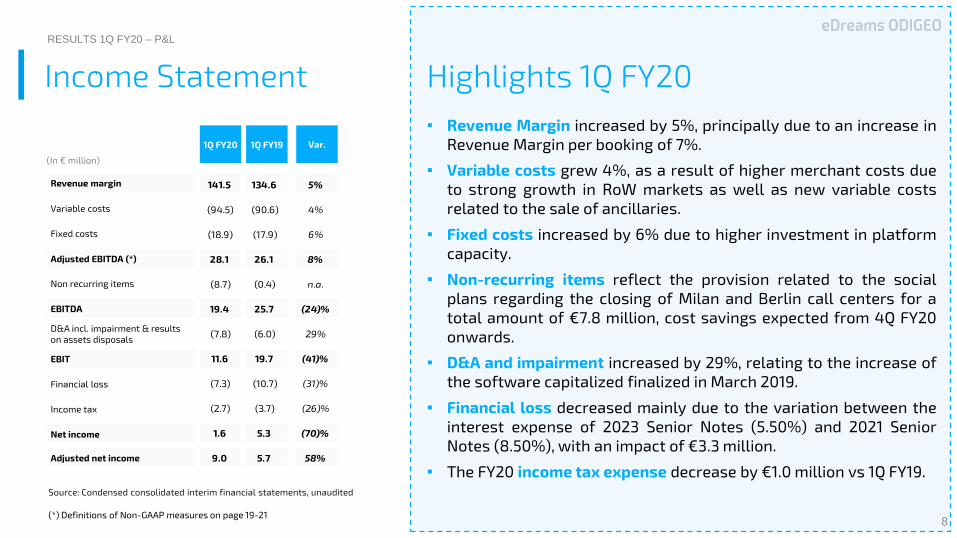
Income Statement
Source: Condensed consolidated interim financial statements, unaudited
EBIT
Financial loss
Adjusted net income
Net income
Revenue margin
Variable costs
Fixed costs
Adjusted EBITDA (*)
Non recurring items
EBITDA
D&A incl. impairment & results
on assets disposals
Income tax
(In € million)
RESULTS 1Q FY20 – P&L
8(*) Definitions of Non-GAAP measures on page 19-21
Highlights 1Q FY20
▪ Revenue Margin increased by 5%, principally due to an increase in
Revenue Margin per booking of 7%.
▪ Variable costs grew 4%, as a result of higher merchant costs due
to strong growth in RoW markets as well as new variable costs
related to the sale of ancillaries.
▪ Fixed costs increased by 6% due to higher investment in platform
capacity.
▪ Non-recurring items reflect the provision related to the social
plans regarding the closing of Milan and Berlin call centers for a
total amount of €7.8 million, cost savings expected from 4Q FY20
onwards.
▪ D&A and impairment increased by 29%, relating to the increase of
the software capitalized finalized in March 2019.
▪ Financial loss decreased mainly due to the variation between the
interest expense of 2023 Senior Notes (5.50%) and 2021 Senior
Notes (8.50%), with an impact of €3.3 million.
▪ The FY20 income tax expense decrease by €1.0 million vs 1Q FY19.
Var.1Q FY191Q FY20
141.5 134.6 5%
(94.5) (90.6) 4%
(18.9) (17.9) 6%
28.1 26.1 8%
(8.7) (0.4) n.a.
19.4 25.7 (24)%
(7.8) (6.0) 29%
11.6 19.7 (41)%
(7.3) (10.7) (31)%
(2.7) (3.7) (26)%
1.6 5.3 (70)%
9.0 5.7 58%
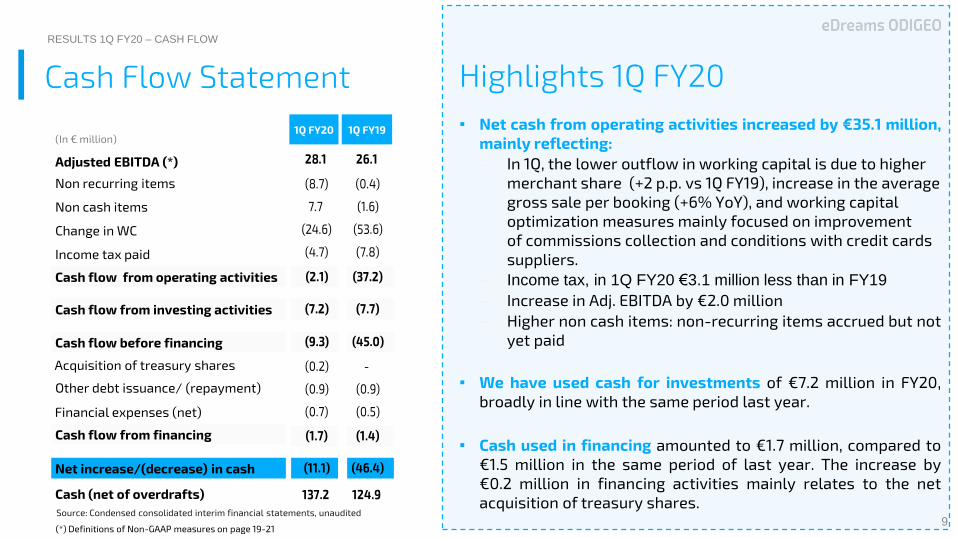
Cash Flow Statement Highlights 1Q FY20
▪ Net cash from operating activities increased by €35.1 million,
mainly reflecting:
– In 1Q, the lower outflow in working capital is due to higher
merchant share (+2 p.p. vs 1Q FY19), increase in the average
gross sale per booking (+6% YoY), and working capital
optimization measures mainly focused on improvement
of commissions collection and conditions with credit cards
suppliers.
– Income tax, in 1Q FY20 €3.1 million less than in FY19
– Increase in Adj. EBITDA by €2.0 million
– Higher non cash items: non-recurring items accrued but not
yet paid
▪ We have used cash for investments of €7.2 million in FY20,
broadly in line with the same period last year.
▪ Cash used in financing amounted to €1.7 million, compared to
€1.5 million in the same period of last year. The increase by
€0.2 million in financing activities mainly relates to the net
acquisition of treasury shares.Source: Condensed consolidated interim financial statements, unaudited
(*) Definitions of Non-GAAP measures on page 19-21
(In € million)1Q FY20 1Q FY19
Net increase/(decrease) in cash
Income tax paid
Cash flow from operating activities
Cash flow from investing activities
Adjusted EBITDA (*)
Non recurring items
Non cash items
Other debt issuance/ (repayment)
Cash (net of overdrafts)
Change in WC
Cash flow from financing
Cash flow before financing
Financial expenses (net)
RESULTS 1Q FY20 – CASH FLOW
9
Acquisition of treasury shares
28.1 26.1
(8.7) (0.4)
7.7 (1.6)
(24.6) (53.6)
(4.7) (7.8)
(2.1) (37.2)
(7.2) (7.7)
(9.3) (45.0)
(0.2) -
(0.9) (0.9)
(0.7) (0.5)
(1.7) (1.4)
(11.1) (46.4)
137.2 124.9

Debt
Principal
(€ Million) Rating Maturity
Corporate Family
Rating
Moodys:B1
S&P: B
Outlook: Stable
2023 Notes 425 Moodys:B2
S&P: B
01/09/23
Debt Details
Gross Leverage Ratio (*)
(Total Gross Financial Debt / LTM Adjusted EBITDA )
▪ Benefits from the refinancing coming through. Financial loss
decreased by 31% compared to the same period last year, a
reduction of €3.3 million in financial expenses, as a result of our
reduction on the debt coupon by 300 bps from the 2021 Senior
Notes at 8.50% to the 2023 Senior Notes at 5.50%.
▪ Gross Leverage ratio (*) remained relatively flat at 3.7x in June
2019 vs 3.8x in 2018, which gives us ample headroom vs our
covenant ratio.
▪ Net leverage ratio (*) was also down and went from 2.7x in June
2018 to 2.5x in 2019NOTES: Covenant figures unaudited
(*) Definitions of Non-GAAP measures on page 19-21
Successful Refinancing80 basis points below average market yields for B2 rated bonds
Source: Bloomberg 10
RESULTS 1Q FY20 – DEBT
3.7x
2.3x
6.0x
-
1
2
3
4
5
6
7
Jun-19 Headroom Ratio cap
x L
TM
Ad
j. E
BIT
DA

Outlook
• Overview
• Results 1Q FY20
• Outlook
• Appendix
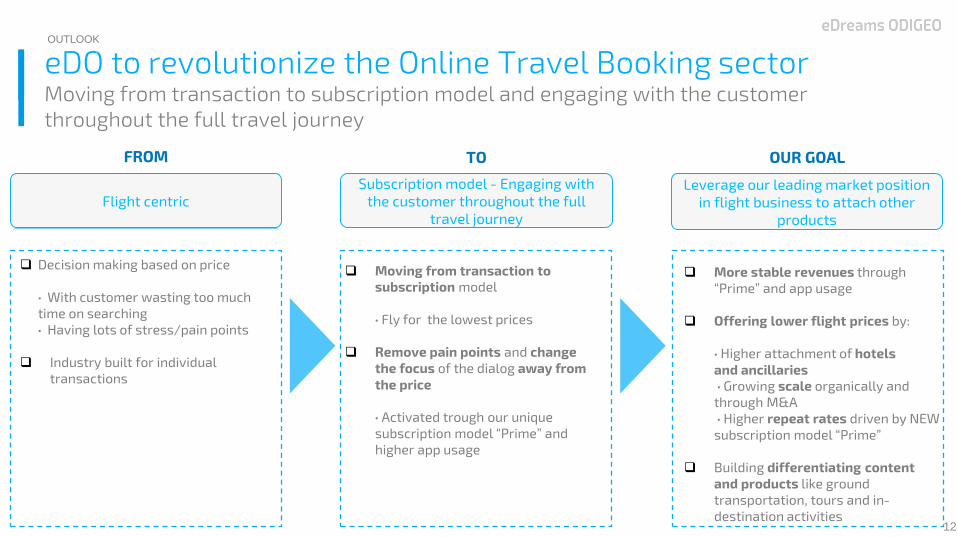
More stable revenues through
“Prime” and app usage
Offering lower flight prices by:
· Higher attachment of hotels
and ancillaries
· Growing scale organically and
through M&A
· Higher repeat rates driven by NEW
subscription model “Prime”
Building differentiating content
and products like ground
transportation, tours and in-
destination activities
Moving from transaction to
subscription model
· Fly for the lowest prices
Remove pain points and change
the focus of the dialog away from
the price
· Activated trough our unique
subscription model “Prime” and
higher app usage
eDO to revolutionize the Online Travel Booking sector Moving from transaction to subscription model and engaging with the customer
throughout the full travel journey
Flight centric
Subscription model - Engaging with
the customer throughout the full
travel journey
FROM TO OUR GOAL
Leverage our leading market position
in flight business to attach other
products
Decision making based on price
· With customer wasting too much
time on searching
· Having lots of stress/pain points
Industry built for individual
transactions
12
OUTLOOK
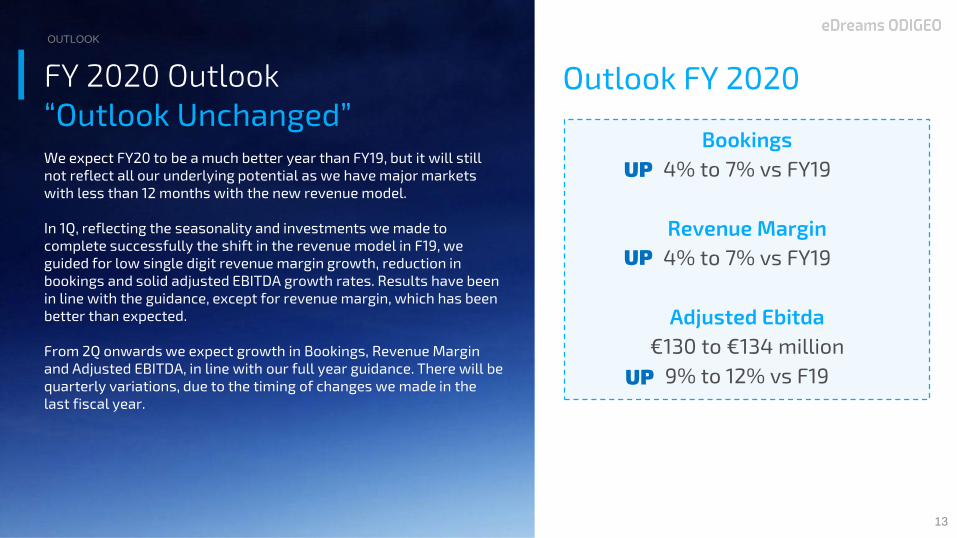
FY 2020 Outlook
Bookings
4% to 7% vs FY19
Revenue Margin
4% to 7% vs FY19
Adjusted Ebitda
€130 to €134 million
9% to 12% vs F19
Outlook FY 2020
“Outlook Unchanged”
We expect FY20 to be a much better year than FY19, but it will still
not reflect all our underlying potential as we have major markets
with less than 12 months with the new revenue model.
In 1Q, reflecting the seasonality and investments we made to
complete successfully the shift in the revenue model in F19, we
guided for low single digit revenue margin growth, reduction in
bookings and solid adjusted EBITDA growth rates. Results have been
in line with the guidance, except for revenue margin, which has been
better than expected.
From 2Q onwards we expect growth in Bookings, Revenue Margin
and Adjusted EBITDA, in line with our full year guidance. There will be
quarterly variations, due to the timing of changes we made in the
last fiscal year.
OUTLOOK
13
UP
UP
UP

Winner in Europe
European OTA
flight market
share
30%
2
2
1
1 1
1
2
1
Significant revenue diversification
World leading capabilities
SOURCE: Internal analysis; Amadeus bookings data;
Phocuswright European Travel Overview 2018
30%
Why
eDreams ODIGEO?
Appendix
• Overview
• Results 1Q FY20
• Outlook
• Appendix
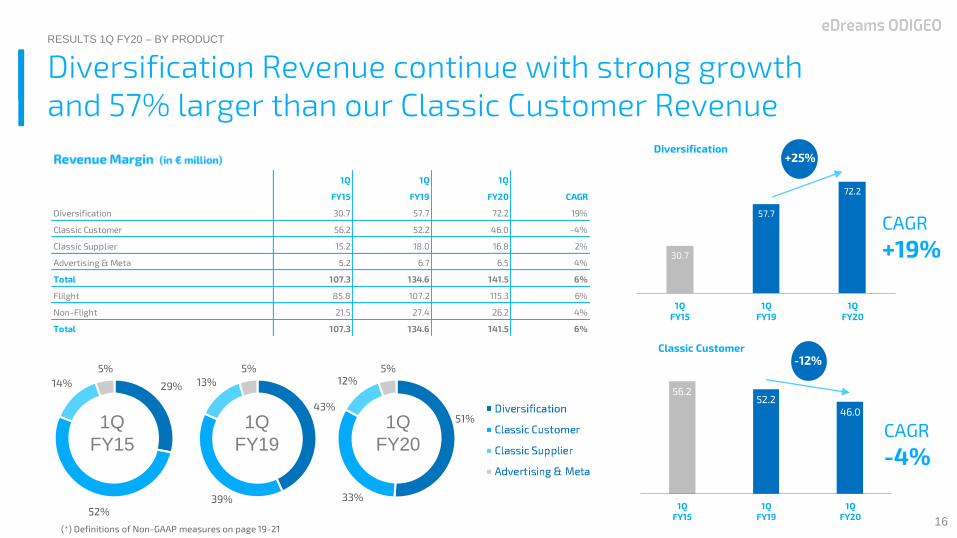
56.252.2
46.0
1Q
FY15
1Q
FY19
1Q
FY20
Diversification Revenue continue with strong growth
and 57% larger than our Classic Customer Revenue
(*) Definitions of Non-GAAP measures on page 19-21
RESULTS 1Q FY20 – BY PRODUCT
16
1Q 1Q 1Q
FY15 FY19 FY20 CAGR
Diversification 30.7 57.7 72.2 19%
Classic Customer 56.2 52.2 46.0 -4%
Classic Supplier 15.2 18.0 16.8 2%
Advertising & Meta 5.2 6.7 6.5 4%
Total 107.3 134.6 141.5 6%
Flilght 85.8 107.2 115.3 6%
Non-Flight 21.5 27.4 26.2 4%
Total 107.3 134.6 141.5 6%
51%
33%
12%
5%
43%
39%
13%
5%
29%
52%
14%
5%
1Q
FY15
1Q
FY19
1Q
FY20
30.7
57.7
72.2
1Q
FY15
1Q
FY19
1Q
FY20
+25%
CAGR
+19%
Diversification
CAGR
-4%
-12%Classic Customer
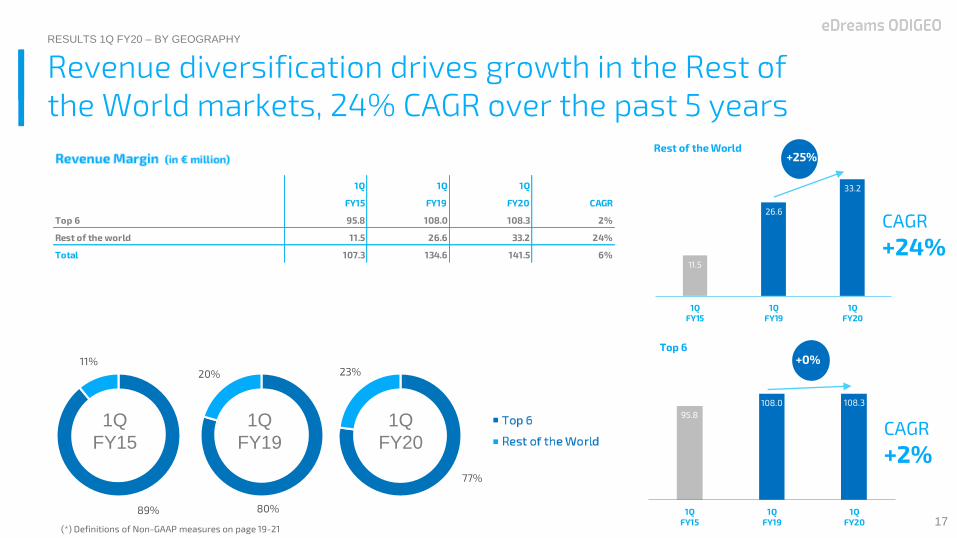
11.5
26.6
33.2
1Q
FY15
1Q
FY19
1Q
FY20
95.8
108.0 108.3
1Q
FY15
1Q
FY19
1Q
FY20
Revenue diversification drives growth in the Rest of
the World markets, 24% CAGR over the past 5 years
(*) Definitions of Non-GAAP measures on page 19-21
RESULTS 1Q FY20 – BY GEOGRAPHY
17
77%
23%
80%
20%
89%
11%
1Q
FY15
1Q
FY19
1Q
FY20
+25%
CAGR
+24%
Rest of the World
CAGR
+2%
+0%Top 6
1Q 1Q 1Q
FY151Q FY191Q FY20 CAGR
Top 6 95.8 108.0 108.3 2%
Rest of the world 11.5 26.6 33.2 24%
Total 107.3 134.6 141.5 6%


Glossary of DefinitionsNon-reconcilable to GAAP measures
▶ Acquisition Cost per Booking Index refers to the most relevant marketing expenses incurred to acquire new customers (encompassing Paid search, Metasearch and Affiliates), divided
by the total number of Bookings. For any given period, the ratio is expressed as an index 100, in which 100 is the value of Acquisition Cost per Booking for the 3 months ended on
December 2015. The acquisition cost per booking index provides to the reader a view of the trend of one of the main variable cost (marketing cost) of the business.
▶ Gross Bookings refers to the total amount paid by our customers for travel products and services booked through or with us (including the part that is passed on to, or transacted by,
the travel supplier), including taxes, service fees and other charges and excluding VAT. Gross Bookings include the gross value of transactions booked under both agency and principal
models as well as transactions made under white label arrangements and transactions where we act as a ‘‘pure’’ intermediary whereby we serve as a click-through and pass the
reservations made by the customer to the relevant travel supplier. Gross Bookings provide to the reader a view about the economic value of the services that the Group mediates.
Reconcilable to GAAP measure
▶ Adjusted EBITDA means operating profit/loss before depreciation and amortization, impairment and profit/(loss) on disposals of non-current assets, certain share-based
compensation, restructuring expenses and other income and expense items which are considered by management to not be reflective of our ongoing operations. Adjusted EBITDA
provides to the reader a better view about the ongoing EBITDA generated by the Group.
▶ Adjusted Net Income means our IFRS net income less certain share-based compensation, restructuring expenses and other income and expense items which are considered by
management to not be reflective of our ongoing operations. Adjusted Net Income provides to the reader a better view about the ongoing results generated by the Group.
▶ EBIT means operating profit/loss. This measure, although it is not specifically defined in IFRS, is generally used in the financial markets and is intended to facilitate analysis and
comparability.
▶ EBITDA means operating profit/loss before depreciation and amortization, impairment and profit/loss on disposals of non-current assets. This measure, although it is not specifically
defined in IFRS, is generally used in the financial markets and is intended to facilitate analysis and comparability.
▶ (Free) Cash Flow before financing means cash flow from operating activities plus cash flow from investing activities.
▶ Gross Financial Debt means total financial liabilities considering financing cost capitalized plus accrued interests and overdraft. It includes both non-current and current financial
liabilities. This measure offers to the reader a global view of the Financial Debt without considering the payment terms.
▶ Gross Leverage Ratio means the total amount of outstanding Gross Financial Debt on a consolidated basis divided by “Adjusted EBITDA”. This measure offers to the reader a view about
the capacity of the Group to generate enough resources to repay the Gross Financial Debt.
▶ Net Financial Debt means “Gross Financial Debt” less “cash and cash equivalents”. This measure offers to the reader a global view of the Financial Debt without considering the
payment terms and reduced by the effects of the available cash and cash equivalents to face these future payments.
▶ Net Income means Consolidated profit/loss for the year.
▶ Net Leverage Ratio means the total amount of outstanding Net Financial Debt on a consolidated basis divided by “Adjusted EBITDA”. This measure offers to the reader a view about the
capacity of the Group to generate enough resources to repay the Gross Financial Debt, also considering the available cash in the Group.
▶ Revenue Diversification Ratio is a ratio representing the amount of Diversification Revenue earned in a twelve-month period as a percentage of our total revenue. Our management
believes that the presentation of the Revenue Diversification Ratio measure may be useful to readers to help understand the results of our revenue diversification strategy.
▶ Revenue Margin means our IFRS revenue less cost of supplies. Our management uses Revenue Margin to provide a measure of our revenue after reflecting the deduction of amounts
we pay to our suppliers in connection with the revenue recognition criteria used for products sold under the principal model (gross value basis). Accordingly, Revenue Margin provides a
comparable revenue measure for products, whether sold under the agency or principal model.19
Glossary of DefinitionsOther Defined Terms
▶ Advertising and Metasearch Revenue represents revenue from other ancillary sources, such as advertising on our websites and revenue from our metasearch activities. Our
management believes that the presentation of the Advertising and Metasearch Revenue measure may be useful to readers to help understand the results of our revenue diversification
strategy.
▶ Booking refers to the number of transactions under the agency model and the principal model as well as transactions made under white label arrangements. One Booking can
encompass one or more products and one or more passengers.
▶ Classic Customer Revenue represents customer revenue other than Diversification Revenues earned through flight service fees, cancellation and modification fees, tax refunds and
mobile application revenue. Our management believes that the presentation of the Classic Customer Revenues measure may be useful to readers to help understand the results of our
revenue diversification strategy.
▶ Classic Supplier Revenue represents supplier revenue earned through GDS incentives for Bookings mediated by us through GDSs and incentives received from payment service
providers. Our management believes that the presentation of the Classic Supplier Revenues measure may be useful to readers to help understand the results of our revenue
diversification strategy.
▶ Top 6 Markets and Top 6 Segments refers to our operations in France, Spain, Italy Germany, UK and Nordics.
▶ Customer Repeat Booking Rate (%) refers to the ratio, expressed on a percentage basis, of Bookings made in a quarter by customers who made a prior Booking in the 12 months prior to
that quarter divided by the total number of Bookings. The ratio is annualized, multiplying by four and by the ratio of the quarter over the average of last 4 quarters, to eliminate
seasonality effects
▶ Customer Relationship Management (CRM) represents the set of activities that will encourage our customers to repeat business with us: visit our site again and make another booking.
To be successful we need to understand our customers' behaviours and needs: we collect, analyse and use data to make each of those interactions with customers as personalised and
relevant as possible.
▶ Diversification Revenue represents revenue other than Classic Customer Revenue, Classic Supplier Revenues or Advertising and Metasearch Revenue, earned through vacation
products (including car rentals, hotels and Dynamic Packages), flight ancillaries (including reserved seats, additional check-in luggage, travel insurance and additional service options),
travel insurance, as well as certain commissions, over-commissions and incentives directly received from airlines. Our management believes that the presentation of the Diversification
Revenues measure may be useful to readers to help understand the results of our revenue diversification strategy.
▶ Rest of the World Markets and RoW segment refers to other countries in which we operate.
▶ Fixed Costs includes IT expenses net of capitalization write-off, personnel expenses which are not Variable Costs, external fees, building rentals and other expenses of fixed nature. Our
management believes the presentation of Fixed Costs may be useful to readers to help understand our cost structure and the magnitude of certain costs we have the ability to reduce in
response to changes affecting the number of transactions processed.
▶ Fixed Costs per Booking means fixed costs divided by the number of bookings. See definitions of "Fixed costs" and "Bookings".
▶ Flight Business refers to our operations relating to the supply of flight mediation services.
▶ Non-flight Business refers to our operations relating to the supply of non-flight mediation services, as well as other non-travel activities such as advertising on our websites, incentives
we receive from payment processors, charges on toll calls and Liligo’s metasearch activity.
▶ Non-recurring Items refers to share-based compensation, restructuring expenses and other income and expense items which are considered by management to not be reflective of our
ongoing operations.
20

Glossary of DefinitionsOther defined terms
▶ Product Diversification Ratio (%) is a ratio expressed on a percentage basis and calculated by dividing the number of flight ancillary products and non-flight products linked to a
Booking (such as insurance, additional check-in luggage, reserved seats, certain additional service options, Dynamic Packages and car rental) by the total number of Bookings for a
given period.
▶ Variable Costs includes all expenses which depend on the number of transactions processed. These include acquisition costs, merchant costs and other costs of a variable nature, as
well as personnel costs related to call centers as well as corporate sales personnel. Our management believes the presentation of Variable Costs may be useful to readers to help
understand our cost structure and the magnitude of certain costs. We have the ability to reduce certain costs in response to changes affecting the number of transactions processed.
▶ Variable Costs per Booking means variable costs divided by the number of bookings. See definitions of "Variable costs" and "Bookings".
21