Redalyc.Numerical simulation of the sucker-rod pumping system
Upload
skittichungchitCategory
view
220download
0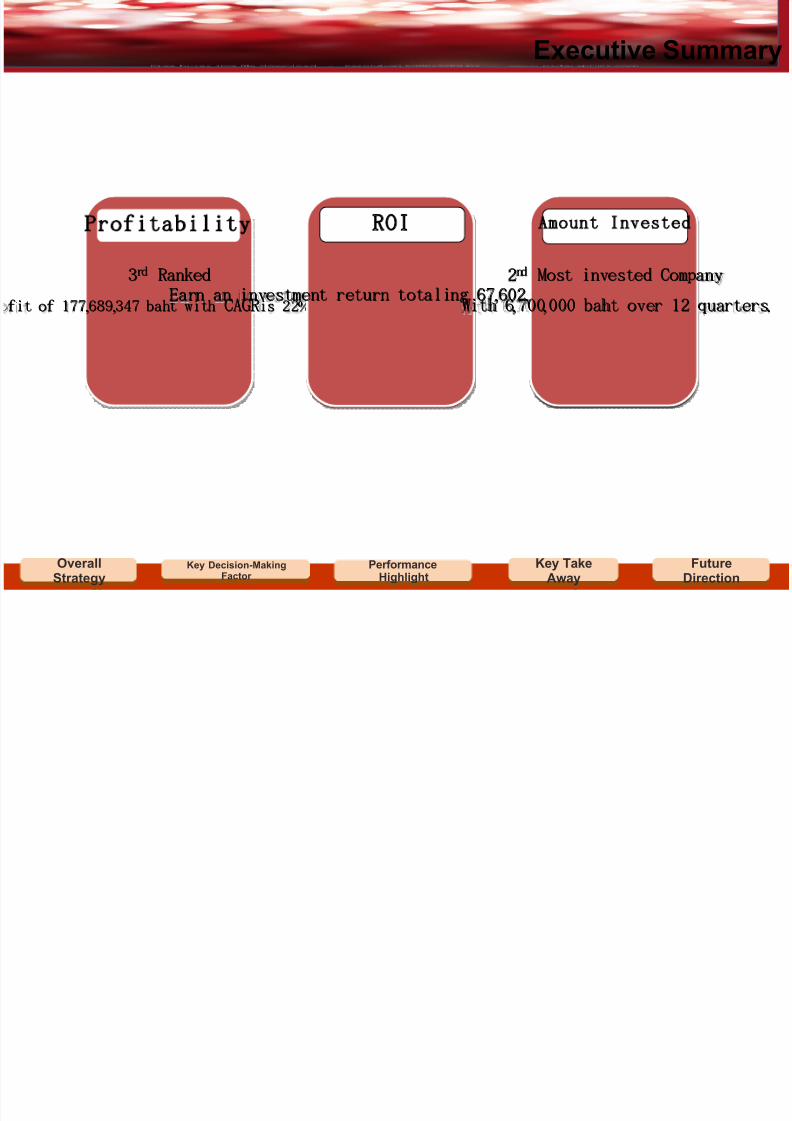
8/8/2019 IM443 Simulation Presentation
http://slidepdf.com/reader/full/im443-simulation-presentation 1/16
Key TakeAway
Key TakeAway
FutureDirection
FutureDirection
PerformanceHighlight
PerformanceHighlight
Key Decision-MakingFactor
Key Decision-MakingFactor
OverallStrategy
OverallStrategy
Executive Summary
33rdrd RankedRanked
, ,fit of 177 689 347 baht with, ,fit of 177 689 347 baht with CAGRCAGR % .is 22 over 12 quarters% .is 22 over 12 quarters
Profitability
11stst RankedRanked
, ,Earn an investment return totaling 67 602 016 baht, ,Earn an investment return totaling 67 602 016 baht..
ROI
22ndnd Most invested Company Most invested Company
, , . With 6 700 000 baht over 12 quarters, , . With 6 700 000 baht over 12 quarters
mount Invested
8/8/2019 IM443 Simulation Presentation
http://slidepdf.com/reader/full/im443-simulation-presentation 2/16
OverallStrategy Key Decision-Making
Factor
Key Decision-MakingFactor
FutureDirection
FutureDirection
KeyTakeaway
KeyTakeaway
PerformanceHighlight
PerformanceHighlight
Short Term Strategy
enting and taking short-cut to focus on factors that have direct link t
- Will put graph and r square here
8/8/2019 IM443 Simulation Presentation
http://slidepdf.com/reader/full/im443-simulation-presentation 3/16
OverallStrategy Key Decision-Making
Factor
Key Decision-MakingFactor
FutureDirection
FutureDirection
KeyTakeaway
KeyTakeaway
PerformanceHighlight
PerformanceHighlight
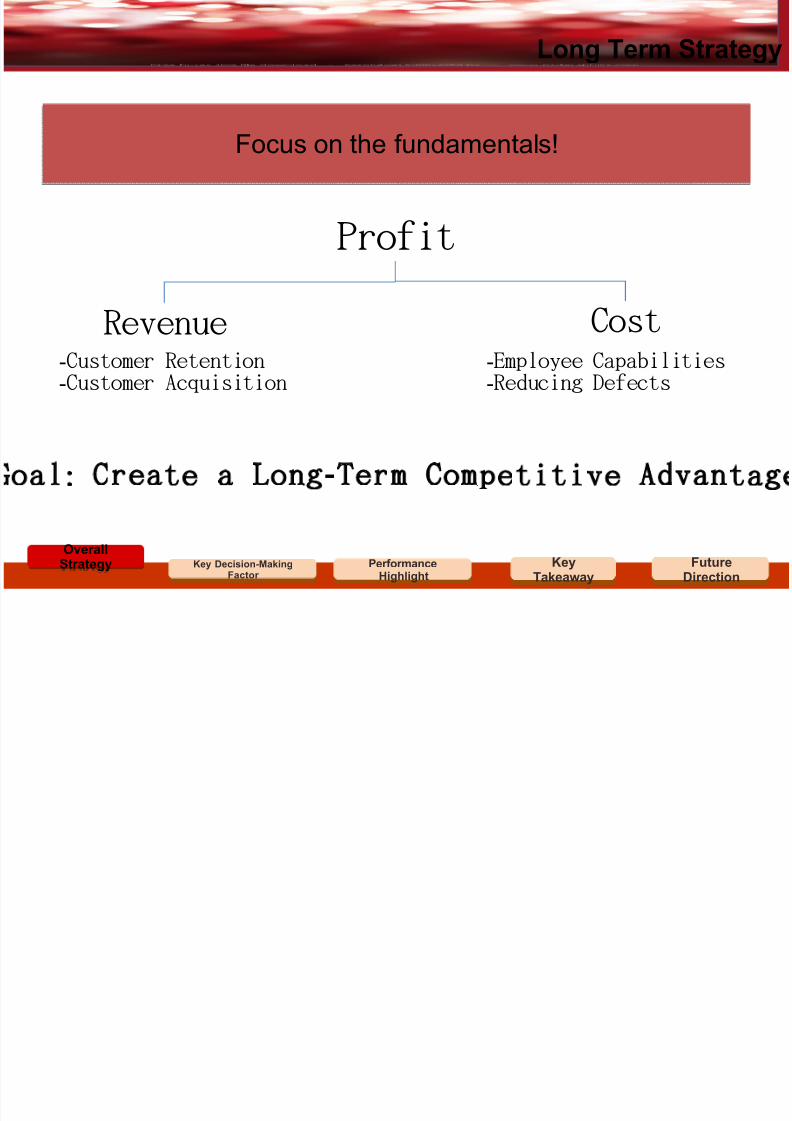
Long Term Strategy
Focus on the fundamentals!
Profit
Revenue Cost- Customer Retention- Customer Acquisition
- Employee Capabilities- Reducing Defects
: -al Create a Long Term Competitive Advantag
8/8/2019 IM443 Simulation Presentation
http://slidepdf.com/reader/full/im443-simulation-presentation 4/16
OverallStrategy
OverallStrategy
Key Decision MakingFactor Performance
Highlight
PerformanceHighlight
KeyTakeaway
KeyTakeaway
FutureDirection
FutureDirection
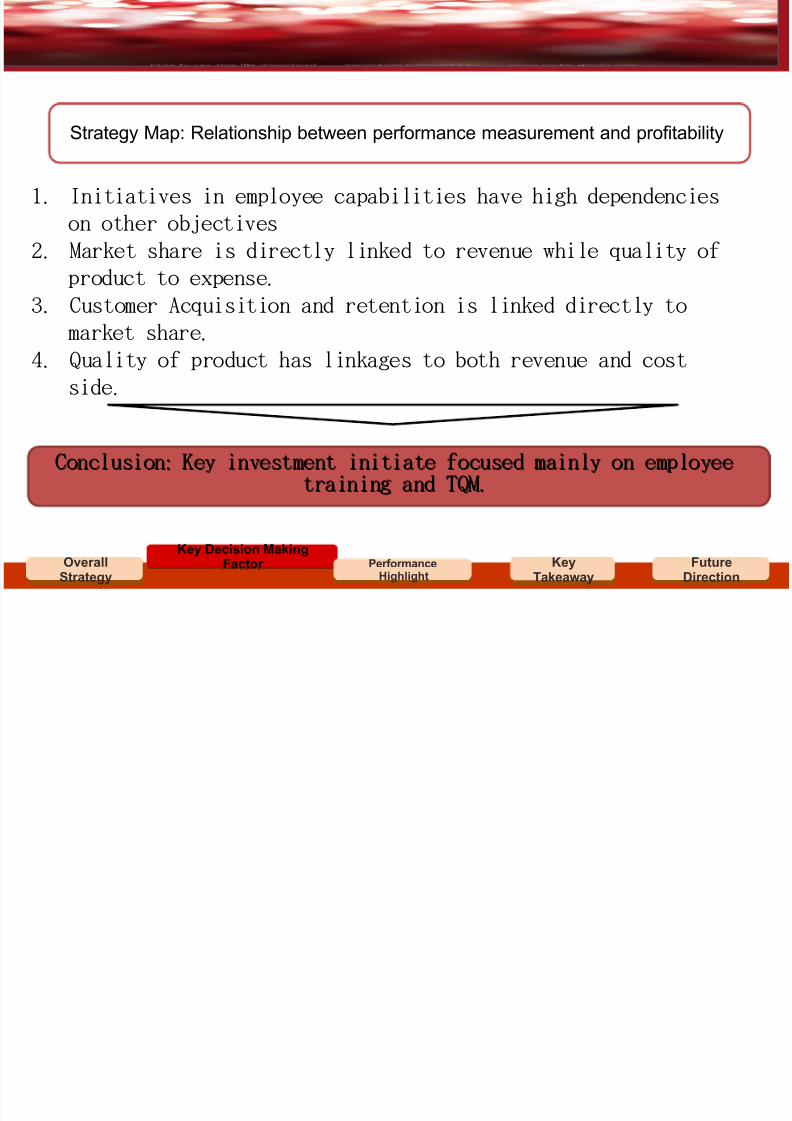
Strategy Map: Relationship between performance measurement and profitability
.1 Initiatives in employee capabilities have high dependencies
on other objectives
.2 Market share is directly linked to revenue while quality of
.product to expense.3 Customer Acquisition and retention is linked directly to
.market share
.4 Quality of product has linkages to both revenue and cost
.side
:Conclusion Key investment initiate focused mainly on employee:Conclusion Key investment initiate focused mainly on employee.training and TQM.training and TQM
8/8/2019 IM443 Simulation Presentation
http://slidepdf.com/reader/full/im443-simulation-presentation 5/16
OverallStrategy
OverallStrategy
Key Decision MakingFactor Performance
Highlight
PerformanceHighlight
KeyTakeaway
KeyTakeaway
FutureDirection
FutureDirection
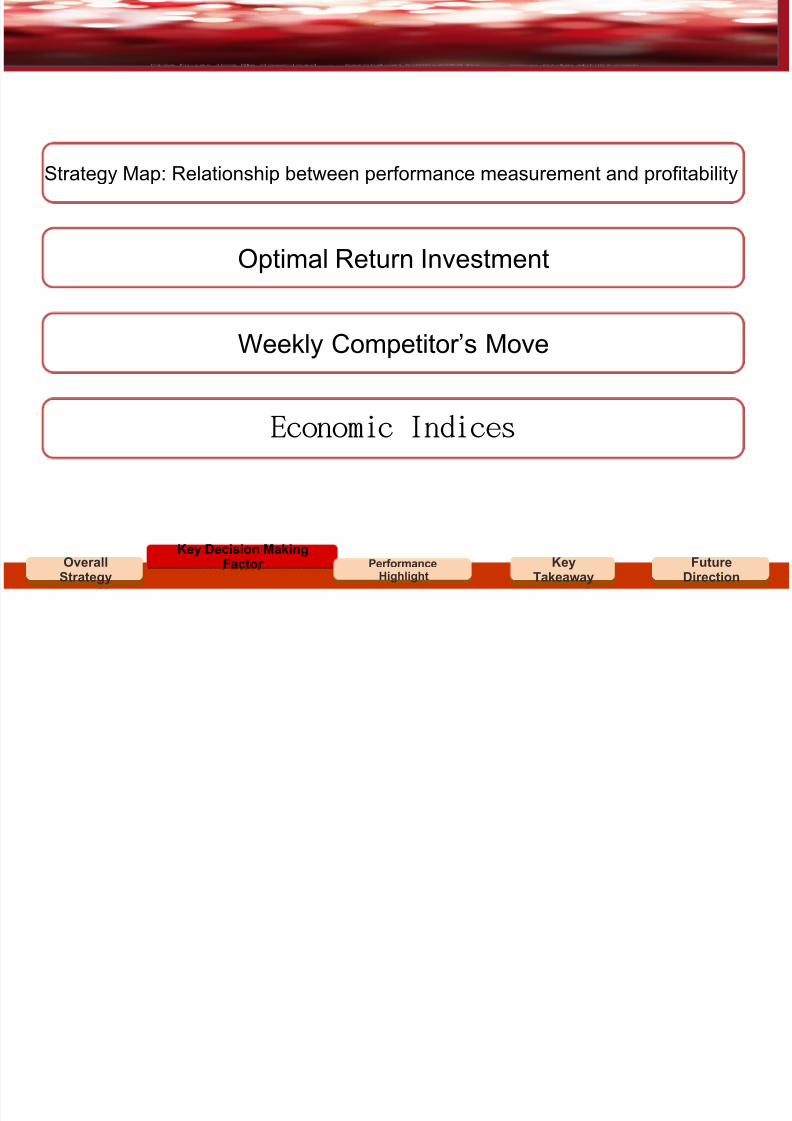
Optimal Return Investment
Weekly Competitor’s Move
Economic Indices
Strategy Map: Relationship between performance measurement and profitability
8/8/2019 IM443 Simulation Presentation
http://slidepdf.com/reader/full/im443-simulation-presentation 6/16
Conclusions
Conclusions
Performance
HighlightKey
Takeaway
KeyTakeaway
Key Decision-MakingFactor
Key Decision-MakingFactor
OverallStrategy
OverallStrategy
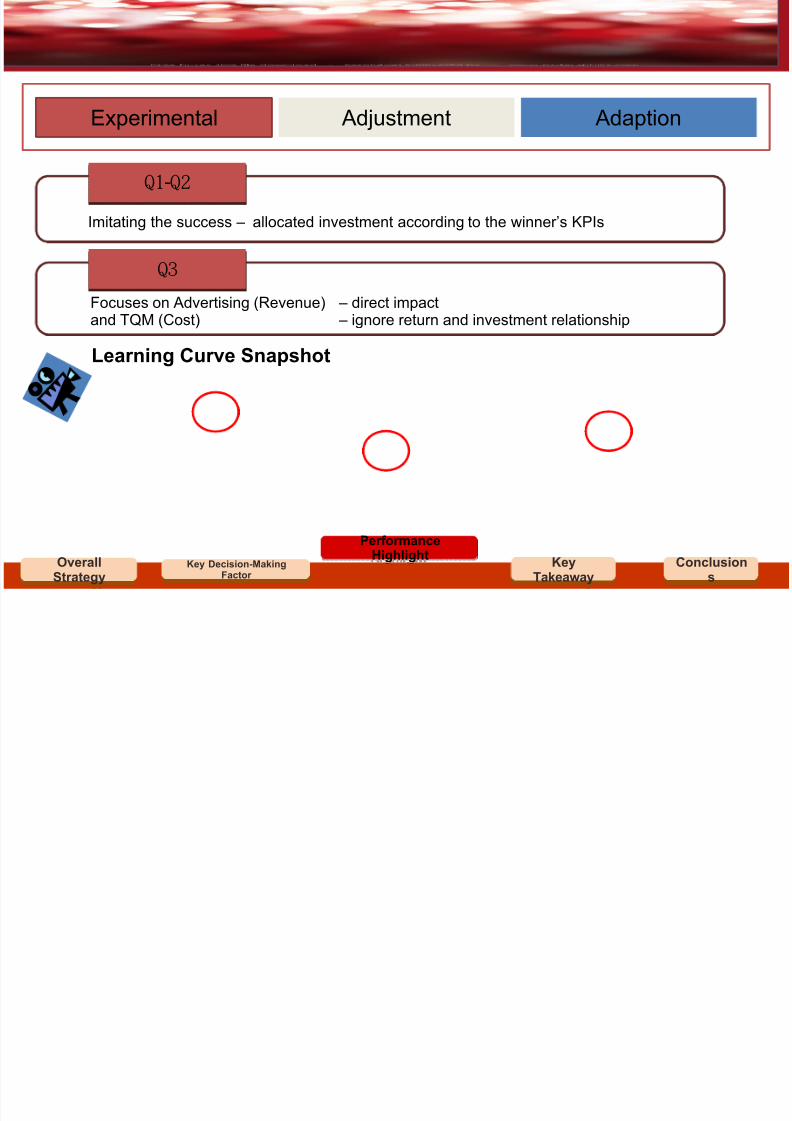
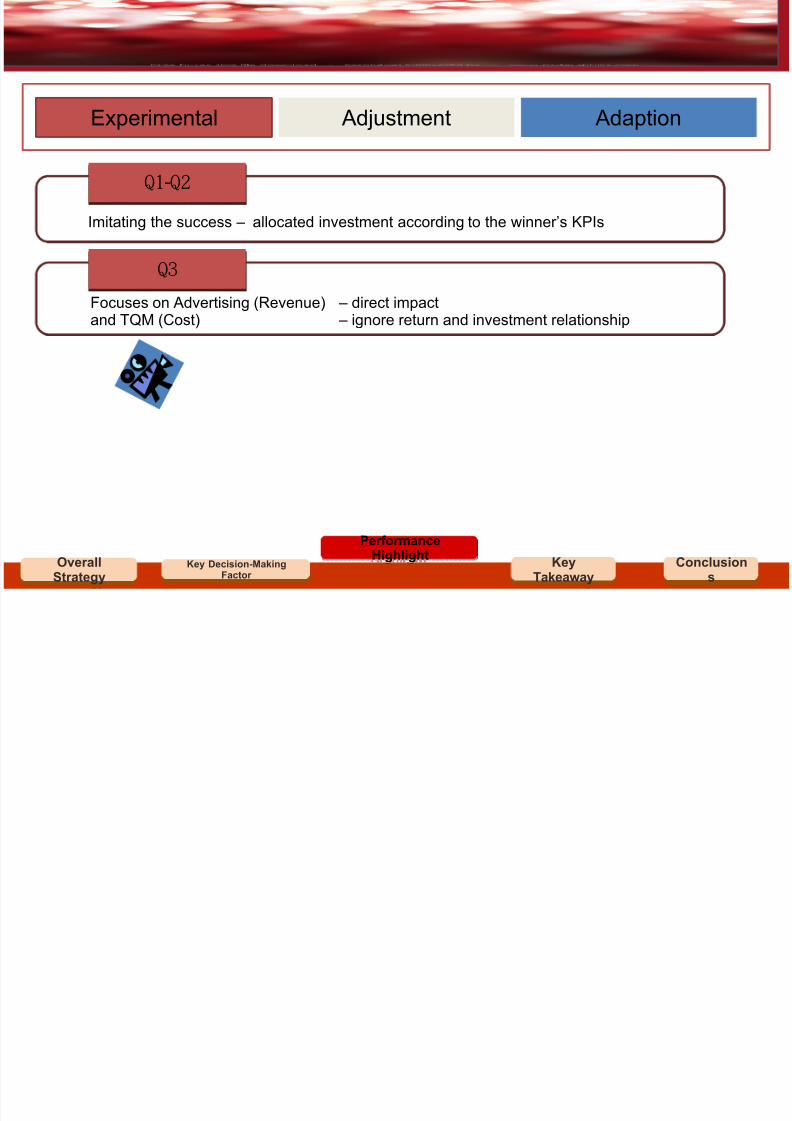
Experimental Adjustment Adaption
-Q1 Q2
Q3
Imitating the success – allocated investment according to the winner’s KPIs
Focuses on Advertising (Revenue)and TQM (Cost)
Learning Curve Snapshot
– direct impact – ignore return and investment relationship
8/8/2019 IM443 Simulation Presentation
http://slidepdf.com/reader/full/im443-simulation-presentation 7/16
Conclusions
Conclusions
Performance
HighlightKey
Takeaway
KeyTakeaway
Key Decision-MakingFactor
Key Decision-MakingFactor
OverallStrategy
OverallStrategy
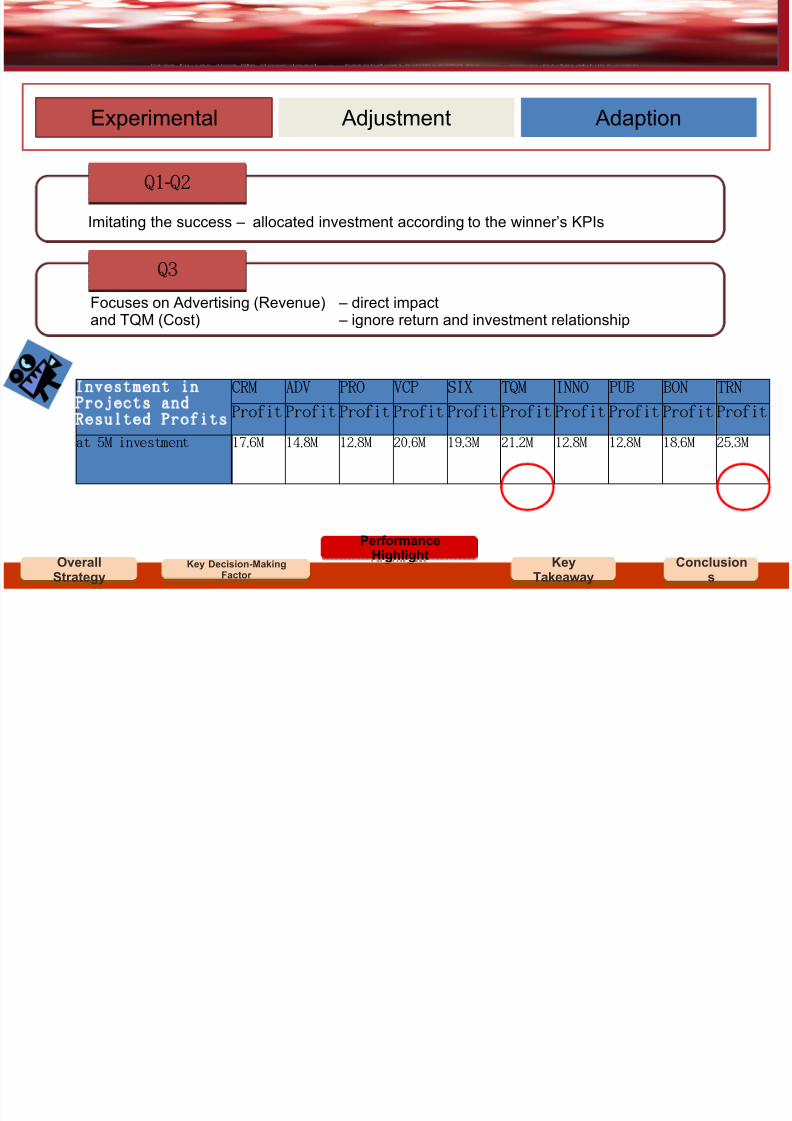
Experimental Adjustment Adaption
-Q1 Q2
Q3
Imitating the success – allocated investment according to the winner’s KPIs
Focuses on Advertising (Revenue)and TQM (Cost)
– direct impact – ignore return and investment relationship
nvestment in rojects and esulted Profits
CRM ADV PRO VCP SIX TQM INNO PUB BON TRN
Profit Profit Profit Profit Profit Profit Profit Profit Profit Profit
at 5M investment .17 6M .14 8M .12 8M .20 6M .19 3M .21 2M .12 8M .12 8M .18 6M .25 3M
8/8/2019 IM443 Simulation Presentation
http://slidepdf.com/reader/full/im443-simulation-presentation 8/16
Conclusions
Conclusions
Performance
HighlightKey
Takeaway
KeyTakeaway
Key Decision-MakingFactor
Key Decision-MakingFactor
OverallStrategy
OverallStrategy
Experimental Adjustment Adaption
-Q1 Q2
Q3
Imitating the success – allocated investment according to the winner’s KPIs
Focuses on Advertising (Revenue)and TQM (Cost)
– direct impact – ignore return and investment relationship
8/8/2019 IM443 Simulation Presentation
http://slidepdf.com/reader/full/im443-simulation-presentation 9/16
Conclusions
Conclusions
Performance
HighlightKey
Takeaway
KeyTakeaway
Key Decision-MakingFactor
Key Decision-MakingFactor
OverallStrategy
OverallStrategy
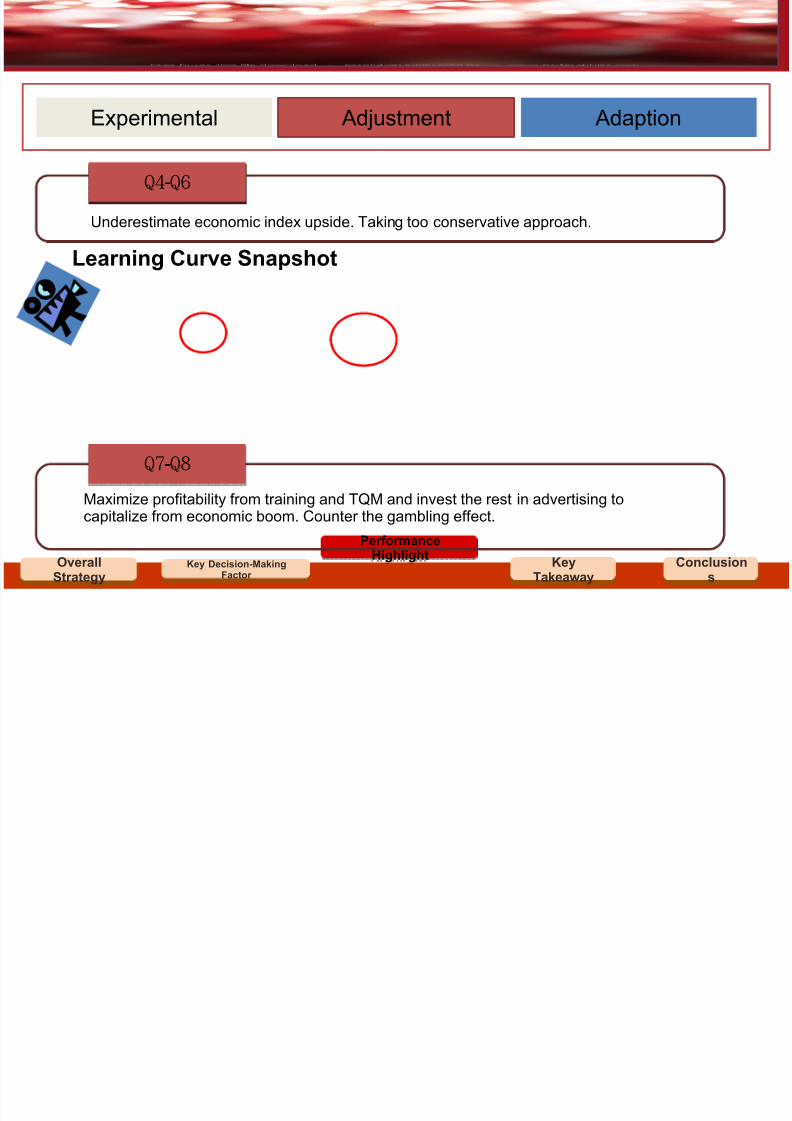
Experimental Adjustment Adaption
-Q4 Q6
-Q7 Q8
Underestimate economic index upside. Taking too conservative approach.
Maximize profitability from training and TQM and invest the rest in advertising tocapitalize from economic boom. Counter the gambling effect.
Learning Curve Snapshot
8/8/2019 IM443 Simulation Presentation
http://slidepdf.com/reader/full/im443-simulation-presentation 10/16
Conclusions
Conclusions
Performance
HighlightKey
Takeaway
KeyTakeaway
Key Decision-MakingFactor
Key Decision-MakingFactor
OverallStrategy
OverallStrategy
Experimental Adjustment Adaption
-Q4 Q6
-Q7 Q8
Underestimate economic index upside. Taking too conservative approach.
Maximize profitability from training and TQM and invest the rest in advertising tocapitalize from economic boom. Counter the gambling effect.
8/8/2019 IM443 Simulation Presentation
http://slidepdf.com/reader/full/im443-simulation-presentation 11/16
Conclusions
Conclusions
Performance
HighlightKey
Takeaway
KeyTakeaway
Key Decision-MakingFactor
Key Decision-MakingFactor
OverallStrategy
OverallStrategy
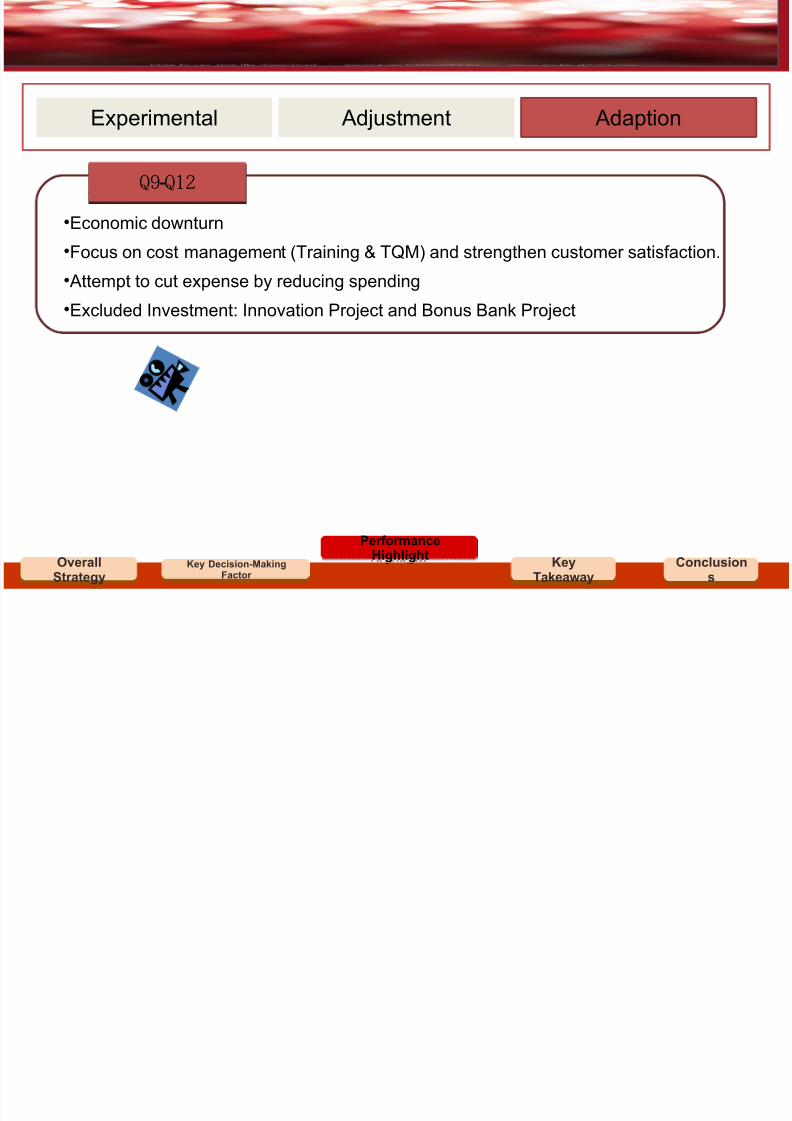
Experimental Adjustment Adaption
-Q9 Q12
•Economic downturn
•Focus on cost management (Training & TQM) and strengthen customer satisfaction.
•Attempt to cut expense by reducing spending
•Excluded Investment: Innovation Project and Bonus Bank Project
8/8/2019 IM443 Simulation Presentation
http://slidepdf.com/reader/full/im443-simulation-presentation 12/16
Conclusions
Conclusions
Performance
HighlightKey
Takeaway
KeyTakeaway
Key Decision-MakingFactor
Key Decision-MakingFactor
OverallStrategy
OverallStrategy
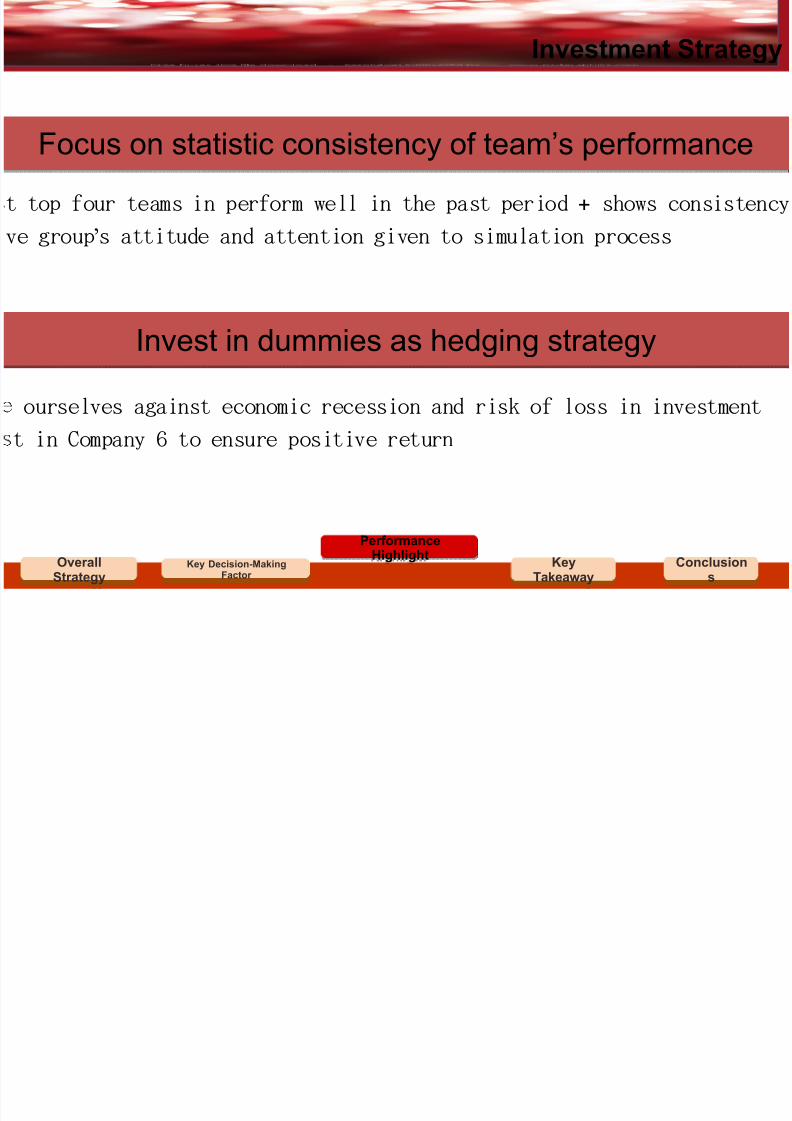
Investment Strategy
Focus on statistic consistency of team’s performance
Invest in dummies as hedging strategy
+t top four teams in perform well in the past period shows consistency
’ve group s attitude and attention given to simulation process
ourselves against economic recession and risk of loss in investment t in Company 6 to ensure positive return

8/8/2019 IM443 Simulation Presentation
http://slidepdf.com/reader/full/im443-simulation-presentation 13/16
Key TakeAway FutureDirection
FutureDirection
Key Decision-MakingFactor
Key Decision-MakingFactor
PerformanceHighlight
PerformanceHighlight
OverallStrategy
OverallStrategy
Key Takeaway
1. Applying performance measurement to a visual statistical tool to make
better decision in the future
8/8/2019 IM443 Simulation Presentation
http://slidepdf.com/reader/full/im443-simulation-presentation 14/16
Key TakeAway FutureDirection
FutureDirection
Key Decision-MakingFactor
Key Decision-MakingFactor
PerformanceHighlight
PerformanceHighlight
OverallStrategy
OverallStrategy
Key Takeaway
2. In forecasting competitors’ next move, we conclude that it’s better to
make investment decision by looking at their short-term past decisions,
but not long-term.
Rationaleq ,Long term performance speaks very little and is subject to a lot of speculation
qq Economy condition is different over the long
.run causing volatility
8/8/2019 IM443 Simulation Presentation
http://slidepdf.com/reader/full/im443-simulation-presentation 15/16
Key TakeAway FutureDirection
FutureDirection
Key Decision-MakingFactor
Key Decision-MakingFactor
PerformanceHighlight
PerformanceHighlight
OverallStrategy
OverallStrategy
Key Takeaway
3. In reality, more long-term initiatives should never be overlooked
thus more initiative should be focus towards long term investment
8/8/2019 IM443 Simulation Presentation
http://slidepdf.com/reader/full/im443-simulation-presentation 16/16
FutureDirectionKey TakeA
Key TakeAway
OverallSt t
OverallStrategy
Key Decision-MakingFactor
Key Decision-MakingFactor
PerformanceHi hli ht
PerformanceHighlight
Future Direction
• Don’t compromise long-term growth sustainability with short-term
gains; allocation of budgets need be balanced.
• Continuously revise investment plan by forecasting future
economic situation and considering other external factors such as
changing customer expectations.