(LETyE), Instituto de Investigaciones e Ingeniería ambiental … P... · 1 Laboratorio de...
22
Monitoring Spartina Marshes in the Argentine Coast: integrating Biophysical Parameters, Hyperspectral Field Data and Satellite Observations. Gabriela González-Trilla 1,2 , Patricia Kandus 1 and Jorge Marcovecchio 2,3 [email protected] 1 Laboratorio de Ecología Teledetección y Ecoinformática. (LETyE), Instituto de Investigaciones e Ingeniería ambiental (3iA), Universidad Nacional de San Martín (UNSAM) 2 Consejo Nacional de Investigaciones Científicas y Técnicas (CONICET) 3 Instituto Argentino de Oceanografía (IADO) Argentina
Transcript of (LETyE), Instituto de Investigaciones e Ingeniería ambiental … P... · 1 Laboratorio de...

Monitoring Spartina Marshes in the Argentine Coast: integrating Biophysical Parameters, Hyperspectral Field Data and
Satellite Observations.
Gabriela González-Trilla1,2, Patricia Kandus1 and Jorge Marcovecchio2,3
1 Laboratorio de Ecología Teledetección y Ecoinformática. (LETyE), Instituto de Investigaciones e Ingeniería ambiental (3iA), Universidad Nacional de San Martín (UNSAM) 2 Consejo Nacional de Investigaciones Científicas y Técnicas (CONICET) 3 Instituto Argentino de Oceanografía (IADO)
Argentina

Salt marshes of the Southamerican Atlantic Coast
Salt marshes extend from the southern portion of Brazil up to Tierra del Fuego, Argentina. This low energy intertidal environments are dominated by Spartina densiflora, S. alterniflora and Sarcocornia perennis
Idaszkin, Y.L., Bortolus, A., and Bouza, P.J., 2010. Ecological processes shaping central Patagonian salt marsh landscapes. Austral Ecology, 36(1), 59-67

• Native to the temperate Atlantic Coast of the American Continent
• It occupies lower intertidal zones while in the higer zones S. densiflora is found in South America.
• Primarily maintained by vegetative reproduction
Spartina alterniflora (Smooth cordgrass )

In order to develop procedures to map and monitor Spartina alterniflora marshes, we attempt to integrate Leaf Area Index (LAI ) and Biomass (Bio) acquired at field local scale, with satellite remote sensing data.
OBJECTIVE
This work took place at Bahia Blanca Estuary, Argentina.

Bahía Blanca Estuary One of the most important salt marsh in Argentina, where S. alterniflora form Monospecific stands It extends between 38°45' and 39°25' S Northern limit of the Patagonian desert The estuary covers 2500 Km2 : 410 km2 of marshes and more than 1150 km2 of mudflats. Mesotidal (up to 4m) Low freshwater inflow (3 m3 s-1)

Up scaling
Time series, 2005-2007 period
Down/Up scaling
Satellite data.
Regression models between Biomass and LAI and Field radiometer data
(Eqrad).
Biomass and LAI estimation based on
satellite data (LAIsat Biosat).
Field Biomass and LAI data of S. alterniflora.
(LAIfield Biofield).
DEVELOPMENT

Up scaling
Time series, 2005-2007 period
Down/Up scaling
Satellite data.
Regression models between Biomass and LAI and Field radiometer data
(Eqrad).
Biomass and LAI estimation based on
satellite data (LAIsat Biosat).
Field Biomass and LAI data of S. alterniflora.
(LAIfield Biofield) Measured in permanent sample plots
(10 cm side), based on allometric equations (2005-2007)
DEVELOPMENT

Spartina alterniflora
Spartina alterniflora marshes
Field Biomass and LAI data of S. alterniflora. (LAIfield Biofield).
• Measured in permanent sample plots (10 cm side)

Tagging and following tillers in permanent sample plots Use of allometric regressions Measurements every 2 months. Study period: 2005-2007: 2 growing seasons.
Field Biomass and LAI data of S. alterniflora. (LAIfield Biofield).
•González Trilla G, Schivo F, Borro M, Morandeira N, Kandus P, Marcovecchio J. Allometric scaling of dry weight and leaf area for Spartina densiflora and Spartina alterniflora in two south-west Atlantic saltmarshes.
Journal of Coastal Research. In press.
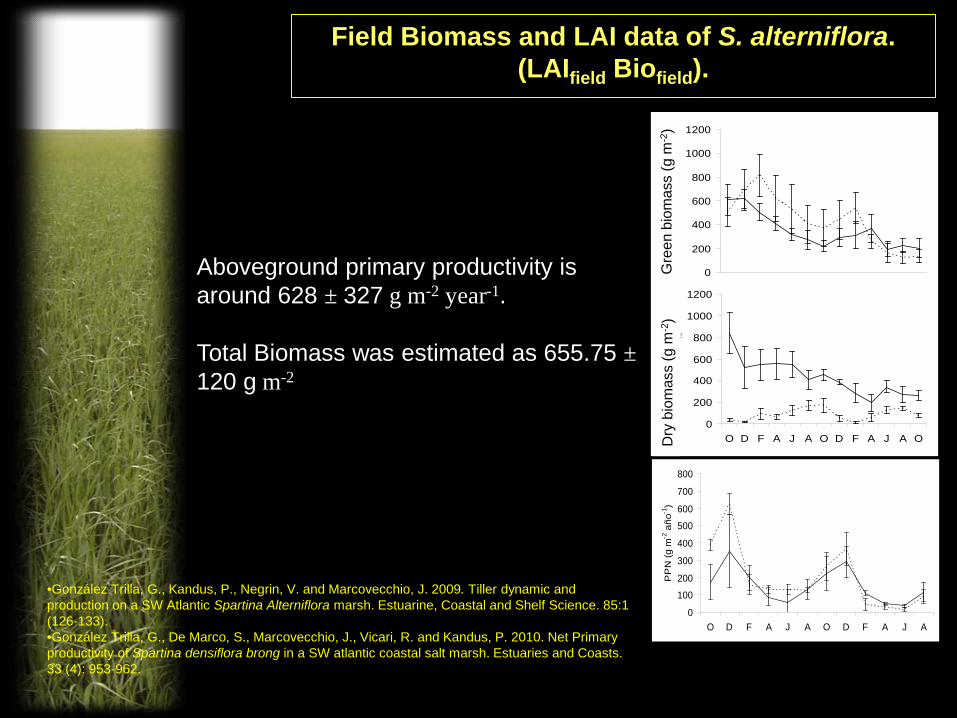
•González Trilla, G., Kandus, P., Negrin, V. and Marcovecchio, J. 2009. Tiller dynamic and production on a SW Atlantic Spartina Alterniflora marsh. Estuarine, Coastal and Shelf Science. 85:1 (126-133). •González Trilla, G., De Marco, S., Marcovecchio, J., Vicari, R. and Kandus, P. 2010. Net Primary productivity of Spartina densiflora brong in a SW atlantic coastal salt marsh. Estuaries and Coasts. 33 (4): 953-962.
Field Biomass and LAI data of S. alterniflora. (LAIfield Biofield).
Aboveground primary productivity is around 628 ± 327 g m-2 year-1. Total Biomass was estimated as 655.75 ± 120 g m-2
0
200
400
600
800
1000
1200
O D F A J A O D F A J A O
Biom
asa
seca
(g m
-2)
b
0
200
400
600
800
1000
1200
Biom
asa
verd
e (g
m-2
)G
reen
bio
mas
s (g
m-2
) D
ry b
iom
ass
(g m
-2)
0
100
200
300
400
500
600
700
800
O D F A J A O D F A J A
PP
N (g
m-2
año
-1)

Up scaling
Time series, 2005-2007 period
Down/Up scaling
Satellite data.
Regression models between Biomass and LAI and Field radiometer data
(Eqrad). Reflectance measured in circular plots (40 cm diameter). Biomass and LAI between NDVIrad and MSAVIrad regression equations were
generated.
Biomass and LAI estimation based on
satellite data (LAIsat Biosat).
Field Biomass and LAI data of S. alterniflora.
(LAIfield Biofield).
DEVELOPMENT
T4 T3 T2 T1 T5
S4 S3 S2 S1
Optic Fiber
50 cm 40 cm
80 cm
Scene 1 Scene 2 Scene 3 Scene 4
Biomass
S5
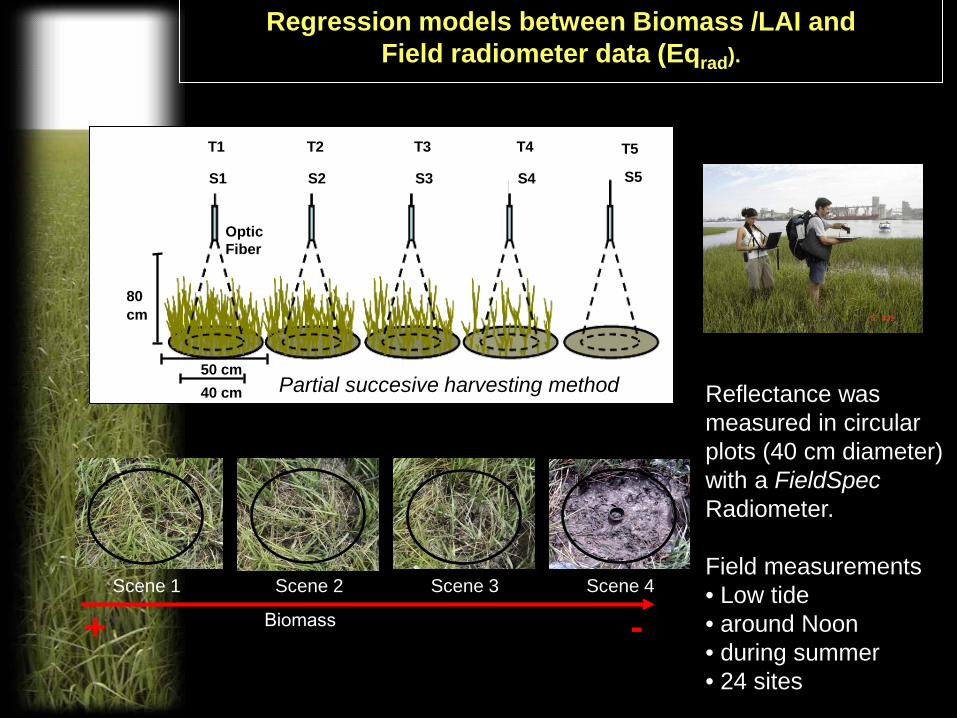
Partial succesive harvesting method
Regression models between Biomass /LAI and Field radiometer data (Eqrad).
+ -
Reflectance was measured in circular plots (40 cm diameter) with a FieldSpec Radiometer. Field measurements • Low tide • around Noon • during summer • 24 sites

Spectral signatures for different partial succesive harvesting biomass levels
Plots biomass were highly correlated with LAI (r=0.91) and cover (r=0.82).
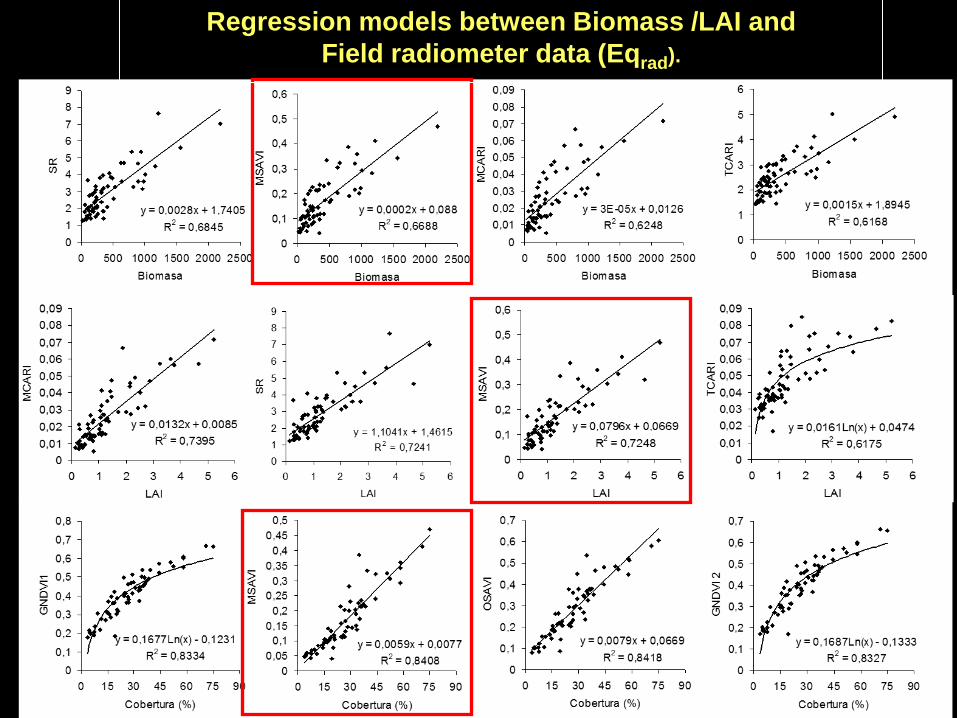
Regression models between Biomass /LAI and Field radiometer data (Eqrad).
Spectral signatures for all sites and harvesting
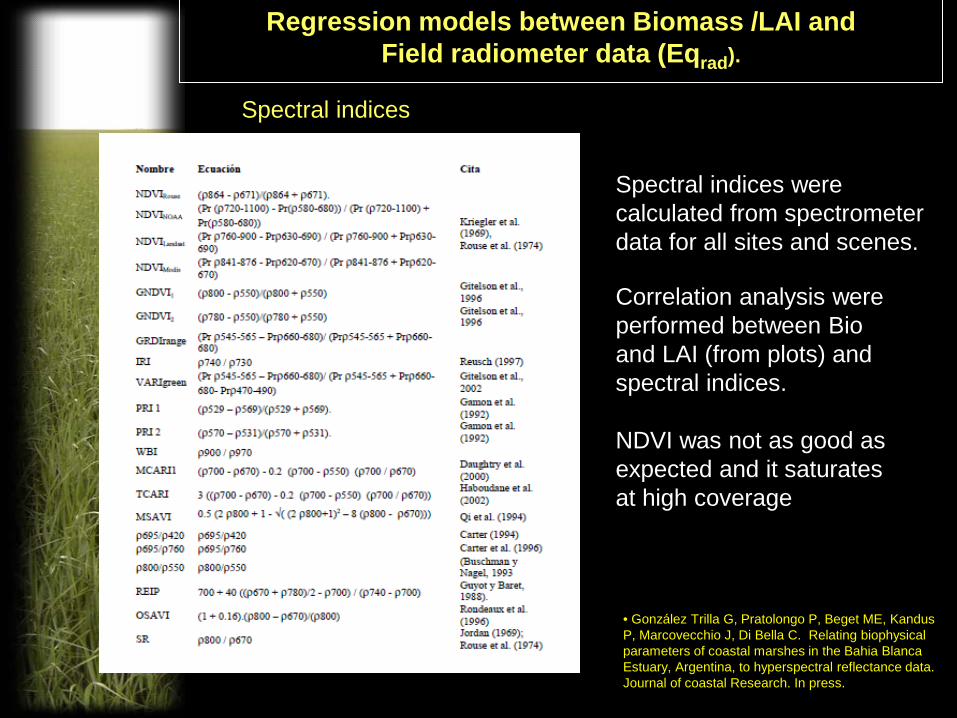
Spectral indices
Spectral indices were calculated from spectrometer data for all sites and scenes.
Correlation analysis were performed between Bio and LAI (from plots) and spectral indices. NDVI was not as good as expected and it saturates at high coverage
Regression models between Biomass /LAI and Field radiometer data (Eqrad).
• González Trilla G, Pratolongo P, Beget ME, Kandus P, Marcovecchio J, Di Bella C. Relating biophysical parameters of coastal marshes in the Bahia Blanca Estuary, Argentina, to hyperspectral reflectance data. Journal of coastal Research. In press.
Regression models between Biomass /LAI and Field radiometer data (Eqrad).

Up scaling
Down/Up scaling
Satellite data. 14 Landsat TM 2005-2007. The NDVIsat and MSAVISat indexes were calculated.
Regression models between Biomass and LAI and Field radiometer data
(Eqrad).
Biomass and LAI estimation based on
satellite data (LAIsat Biosat).
Field Biomass and LAI data of S. alterniflora.
(LAIfield Biofield).
DEVELOPMENT
Satellite data.
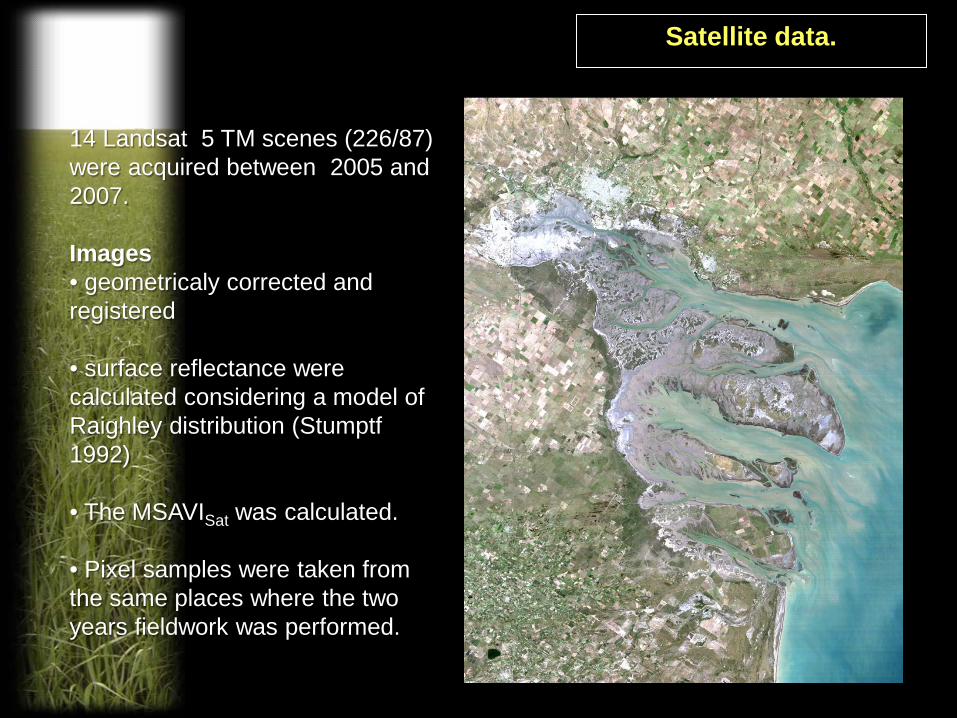
14 Landsat 5 TM scenes (226/87) were acquired between 2005 and 2007. Images • geometricaly corrected and registered • surface reflectance were calculated considering a model of Raighley distribution (Stumptf 1992) • The MSAVISat was calculated. • Pixel samples were taken from the same places where the two years fieldwork was performed.

Up scaling
Time series, 2005-2007 period
Down/Up scaling
Satellite data.
Regression models between Biomass and LAI and Field radiometer data
(Eqrad).
Biomass and LAI estimation based on
satellite data (LAIsat Biosat).
MSAVIsat data were transformed using Ecurad
Field Biomass and LAI data.
(LAIfield Biofield).
DEVELOPMENT

LAIsat-LAIfield
correlations between series r2 = 0.79.
• Satellite and field time series data were comapred.
BIOsat-BIOfield
correlations between series r2 = 0.43.
Underestimated 70 (42- 96) %
Overestimated 114 (108 – 118) %
Underestimated 72.83 (44- 97) %
Overestimated 160 (104 – 212) %
LAI showed better estimations
00,20,40,60,8
11,21,41,61,8
2
200 400 600 800 1000Día Juliano
LA
I
0
100
200
300
400
500
600
200 400 600 800 1000
Bio
ma
sa (
g m
-2)
Biomass and LAI (Biosat LAIsat) estimations based on satellite data
• Biosat and LAIsat were estimated from MSAVIsat using Eqrad
Field Satellite
95% Confidence interval

Biomass (Biosat) estimation based on satellite data
Biomass sat Biomass field 654 (591 - 718) 639 (416-833.3) 102.3 NS 345 (11 - 679) 469.5 (303.5-635.5) 73.4 NS
707 (501 – 913) 647 (403.3-890.3) 91.5 NS 787 (159 – 1416) 920 (430.5 - 1410) 116.8 NS 794 (613 – 976) 856.5 (406 - 1307) 107.87 NS
Biomass map made from Landsat 5 TM (226/87) February 2008

Field data of Biomass and LAI of Spartina alterniflora show high variability at site scale, and seasonal and interannual as well. Additional source of variability is the tide condition (we only consider low tide situations). Field radiometer observations were faithful in identifying changes in biomass and LAI. In order to monitoring Spartina alterniflora biomass and LAI, MSAVI show a good performance, much better than NDVI: We obtained a fitting model (RM) between biomass and LAI (field) and MSAVI (radiometer) data. The aplication of RM model (Eq rad) on MSAVI derived from a time series of Landsat observations, brings a quite accurate estimation of biomass and LAI mean values. We obtained a map of biomass distribution for Bahia Blanca marshes which shows a good fit between observed and field values.
Final Remarks

Muchas gracias!!