Nota para los representantes en la Junta Ejecutiva · iv) entrevistas sostenidas en el FIDA con...
170
Nota para los representantes en la Junta Ejecutiva Funcionarios de contacto: Preguntas técnicas: Envío de documentación: Oscar A. Garcia Director Oficina de Evaluación Independiente del FIDA Tel.: (+39) 06 5459 2274 Correo electrónico: [email protected] Fabrizio Felloni Director Adjunto Tel.: (+39) 06 5459 2361 Correo electrónico: [email protected] William Skinner Jefe Oficina de los Órganos Rectores Tel.: (+39) 06 5459 2974 Correo electrónico: [email protected] Junta Ejecutiva — 119º período de sesiones Roma, 14 y 15 de diciembre de 2016 Para examen Signatura: EB 2016/119/R.10 S Tema: 7 d) Fecha: 2 de noviembre de 2016 Distribución: Pública Original: Inglés Evaluación a nivel institucional de la experiencia del FIDA en materia de descentralización
Transcript of Nota para los representantes en la Junta Ejecutiva · iv) entrevistas sostenidas en el FIDA con...

Nota para los representantes en la Junta Ejecutiva
Funcionarios de contacto:
Preguntas técnicas: Envío de documentación:
Oscar A. GarciaDirectorOficina de Evaluación Independiente del FIDATel.: (+39) 06 5459 2274Correo electrónico: [email protected]
Fabrizio FelloniDirector AdjuntoTel.: (+39) 06 5459 2361Correo electrónico: [email protected]
William SkinnerJefeOficina de los Órganos RectoresTel.: (+39) 06 5459 2974Correo electrónico: [email protected]
Junta Ejecutiva — 119º período de sesionesRoma, 14 y 15 de diciembre de 2016
Para examen
Signatura: EB 2016/119/R.10
STema: 7 d)Fecha: 2 de noviembre de 2016Distribución: PúblicaOriginal: Inglés
Evaluación a nivel institucional de laexperiencia del FIDA en materia dedescentralización

EB 2016/119/R.10
i
Índice
Resumen 1
Apéndice 1Corporate-level evaluation of IFAD's decentralization experience

EB 2016/119/R.10
1
Resumen
I. Antecedentes1. La Oficina de Evaluación Independiente del FIDA (IOE) realizó este año una
evaluación a nivel institucional de la experiencia de descentralización del FIDA, deconformidad con la decisión adoptada por la Junta Ejecutiva en diciembre de 2015.La evaluación se llevó a cabo en el marco de la Política de evaluación del FIDA(2011) y de acuerdo con los conceptos metodológicos establecidos en la segundaedición del Manual de evaluación (2015). Esta evaluación servirá de base paraelaborar el plan de descentralización institucional que la dirección del FIDApresentará a la Junta Ejecutiva en diciembre de 2016.
2. Los objetivos generales de la evaluación, que se establecieron a fin de reforzar lasestrategias y los planes futuros, fueron valorar y generar enseñanzas sobre: i) laexperiencia y la labor del FIDA en materia de descentralización, incluidos lossupuestos subyacentes, ii) la contribución de la descentralización del FIDA a lamejora del desempeño operativo y los resultados de desarrollo, y iii) los costos delproceso de descentralización en relación con los resultados obtenidos.
3. Metodología de evaluación. En la evaluación se han tenido en cuentaaspectos formativos y sumativos debido a que la estrategia de descentralizacióndel FIDA no se ha aplicado integralmente. Una característica distintiva de laevaluación formativa fue la atención dispensada al aprendizaje y la promocióndel diálogo con la dirección del FIDA y otras partes interesadas en instanciasclave del proceso de evaluación, especialmente mediante talleres de consultaregionales. En lo que respecta a la parte sumativa de la evaluación, algunasoficinas del FIDA en los países se encuentran operativas desde hace más de unadécada, por lo que se dispone de suficientes datos sobre el desempeñooperativo y los resultados de desarrollo como para evaluar la medida en que sehan obtenido los productos y efectos directos previstos y alcanzado losresultados esperados. Estos datos proporcionaron la base para realizar unaevaluación general de la labor del FIDA en materia de descentralización ypermitieron generar enseñanzas para el futuro.
4. La evaluación abarcó el período comprendido entre inicios de 2003 y mediados de2016, y se fundó en tres criterios de evaluación internacionalmente reconocidos: lapertinencia, la eficacia y la eficiencia. Asimismo, se utilizó una metodología mixta yse recabaron información y datos cuantitativos y cualitativos de diversas fuentes,entre ellas:
i) un examen preliminar de documentos pertinentes elaborados por el FIDA yorganizaciones que se utilizaron como base de referencia (bancosmultilaterales de desarrollo y organismos de las Naciones Unidas con sede enRoma);
ii) un análisis de datos cuantitativos provenientes de la base de datos del Informeanual sobre los resultados y el impacto de las actividades del FIDA (ARRI) y deotras bases de datos del Fondo;
iii) cuestionarios electrónicos dirigidos al personal del FIDA y partes interesadas:se encuestó a 1 987 personas entre funcionarios del FIDA y participantesexternos, de las cuales respondieron el 62 %;
iv) entrevistas sostenidas en el FIDA con informantes clave: representantes de losórganos rectores, personal directivo y otros miembros del personal;
v) cuatro talleres de consulta regionales celebrados entre mayo y julio de 2016 enlos siguientes sitios: sede regional del FIDA (región de Cercano Oriente, Áfricadel Norte y Europa); Lima (región de América Latina y el Caribe); Nairobi(región de África Oriental y Meridional y región de África Occidental y Central),
EB 2016/119/R.10
2
y Hanoi (región de Asia y el Pacífico); a los talleres asistieron gerentes deproyectos, representantes gubernamentales, organizaciones internacionales ymiembros de la dirección y el personal del FIDA, y
vi) estudios de caso seleccionados en 13 países (con oficinas del FIDA en el país ysin ellas): Burkina Faso, China, el Ecuador, Egipto, Filipinas, Georgia, la India,Kenya, Nicaragua, el Perú, la República Democrática del Congo, la RepúblicaUnida de Tanzanía y Viet Nam.
5. Calendario. La evaluación se llevó a cabo en tiempo récord. El Comité deEvaluación examinó el documento conceptual en marzo de 2016 y los hallazgospreliminares se remitieron a la dirección en julio de 2016. El borrador del informese puso a disposición de la dirección a principios de septiembre de 2016 y sefinalizó a comienzos de octubre de 2016. El informe final se somete a laconsideración del Comité de Evaluación en noviembre, tras lo cual se presentará ala Junta Ejecutiva en su 119o período de sesiones, en diciembre de 2016. Estecalendario obedece a la necesidad de aportar datos que sirvan a la dirección paraelaborar el plan de descentralización institucional que se presentará a la JuntaEjecutiva en diciembre de 2016.
6. Contexto de descentralización del FIDA. Cuando en 1974 se decidió constituirel FIDA, la estructura que se concibió era sumamente centralizada. El Fondo noiba a establecer oficinas en los países, sino que operaría sobre la base deacuerdos concertados con organismos internacionales. No fue sino hasta despuésde la Consulta sobre la Quinta Reposición de los Recursos del FIDA que la JuntaEjecutiva aprobó, en 2003, el programa piloto relativo a la presencia sobre elterreno para el período 2004-2006, del cual resultó el establecimiento de 15oficinas en los países. Tras una evaluación a nivel institucional del programapiloto y la ampliación ulterior del programa, la Junta aprobó la Política yestrategia del FIDA de presencia en los países (2011-2013), limitando a 40 elnúmero de oficinas presentes en ellos. Posteriormente, la Estrategia del FIDA depresencia en los países (2014-2015) aumentó el número máximo a 50. Amediados de 2016, de las 41 oficinas establecidas en los países, 39 seencontraban en funcionamiento.
7. La presencia del FIDA en los países se constituyó sobre la base de cuatroconfiguraciones principales. La primera consistía en una oficina dirigida por unmiembro del personal de contratación nacional —el oficial del programa en el país(OPP)— bajo la supervisión de uno de contratación internacional basado en Roma.La segunda consistía en un miembro del personal de contratación internacional —elgerente del programa en el país— adscrito en un país y apoyado por personal decontratación nacional. La tercera opción era una oficina subregional dirigida por unmiembro del personal de contratación internacional que también prestaba serviciosa países vecinos. La cuarta se trataba de una oficina regional (establecidaúnicamente en Kenya) dirigida por un miembro del personal de contratacióninternacional y con algunas competencias financieras descentralizadas queabarcaban la región de África Oriental y Meridional y parte de la región de ÁfricaOccidental y Central.
II. Principales hallazgosA. Pertinencia8. Los objetivos del proceso de descentralización eran en general válidos. Los
objetivos no variaron de manera significativa tras el plan de actividades relativo ala presencia del FIDA en los países (2007), en el cual se señalaba que estapresencia mejoraría la eficacia del FIDA para impulsar el proceso de desarrollo, enparticular porque le permitiría: i) adaptar mejor los diseños de los proyectos alcontexto del país y proporcionar un apoyo a la ejecución eficaz en función de loscostos; ii) desempeñar un papel catalizador en las actividades no crediticias

EB 2016/119/R.10
3
(diálogo sobre políticas, creación de asociaciones y gestión de los conocimientos);iii) adecuarse mejor a las estrategias de los países y los mecanismos decoordinación de donantes, y iv) participar en la iniciativa “Una ONU”.
9. Algunos supuestos no eran realistas. Se plantearon tres supuestosinterrelacionados de carácter esencial: i) la no incidencia en los costos; ii) laexperimentación con modalidades de presencia en el país sin un enfoqueinstitucional normalizado claro, y iii) la ampliación de la presencia en los países sinrealizar reformas en la Sede.
10. El primer supuesto (la descentralización no incidiría en los costos) no fuerespaldado por la experiencia de muchas otras instituciones financierasinternacionales y organismos de las Naciones Unidas, la cual ponía en evidenciauna mayor eficacia institucional y de las actividades de desarrollo, pero también unaumento de los gastos. Con este supuesto estaba vinculado el enfoque “blando” depresencia en el país (esto es, oficinas muy pequeñas con una dotación escasa derecursos humanos y financieros), pese a que las expectativas en cuanto a lasfunciones que desempeñarían esas oficinas (por ejemplo, apoyo a la ejecución dela cartera, participación en actividades no crediticias y contribución a la iniciativa“Una ONU”) eran grandes. Cabe señalar que los proyectos financiados por el FIDAsuelen ejecutarse en áreas remotas. Eso significa que una parte significativa deltiempo del personal de la oficina en el país se destina a realizar viajes y visitas aesas zonas, lo cual reduce su disponibilidad para dedicarse a actividades nocrediticias y de otro tipo. En síntesis, había un desequilibrio entre las expectativasy los recursos a disposición de las oficinas en los países.
11. El segundo supuesto era que cada división regional podía experimentar condiferentes modalidades de presencia en los países sin necesidad de examinar lasventajas y los inconvenientes de opciones alternativas o adoptar un enfoqueinstitucional estructurado. De haberse contado con un enfoque institucional másnítido y un análisis de las necesidades de recursos y los beneficios previstos de lasdiferentes modalidades de presencia en los países, se podrían haber establecidomucho antes enseñanzas comunes y buenas prácticas.
12. El tercer supuesto era que los cambios debían centrarse en la ampliación de lapresencia en los países sin necesidad de realizar grandes ajustes y reformas en laSede. La experiencia de las organizaciones tomadas como referencia muestra quela descentralización requiere cambios tanto en el centro como en la periferia. Lasoficinas en los países requieren distintos tipos de apoyo (por ejemplo,administrativo, operativo, técnico y financiero). Sus centros de gravedad yenfoques necesitan revisarse mediante un análisis funcional del cual podría resultarun traslado de personal y una delegación de facultades de la Sede al terreno. Esteaspecto fue reconocido en una etapa avanzada del proceso de descentralización.
13. El contexto propicio interno. Durante el proceso de descentralización la JuntaEjecutiva ha recibido por lo menos una actualización al año sobre la evolución delmismo y ha adoptado las principales decisiones. No obstante, la Junta no hacontado con el respaldo de un sistema adecuado para hacer un seguimiento deldesempeño operativo, los resultados y la eficiencia en función de los costos de lapresencia en los países, ni elaborar informes al respecto. Los indicadores deseguimiento para las oficinas del FIDA en los países no estaban definidosadecuadamente, carecían de indicadores de gastos y eficiencia y no estaban bienintegrados en los sistemas de gestión de la información y presentación de informesdel FIDA.
14. En un principio, el personal de la Sede fue reacio a trasladarse o ver sus funcionesreducidas, y los directores de las divisiones regionales se opusieron a unadisminución de su capacidad de control directo. Más recientemente se hacomenzado a ver una actitud más favorable por parte de los cuadros directivosintermedios y el resto del personal. Aunque en la planificación estratégica de la

EB 2016/119/R.10
4
fuerza de trabajo se ha tenido en cuenta la descentralización, la dirección se hamostrado poco dispuesta a llevar a cabo un ajuste importante del personal en laSede o a volver a examinar el modelo institucional general de la organización.
15. No se aprovecharon al máximo las enseñanzas extraídas de evaluaciones yexperiencias anteriores de otros organismos. La evaluación del programapiloto de 2007 había revelado que sin una reestructuración institucional de fondolos costos de la descentralización se incrementarían gradualmente. En un principioeste aspecto recibió poca atención debido a que, en ese momento, la prioridad eraaumentar la presencia en los países. La evaluación de 2007 también indicó que losmodelos subregionales podían reportar importantes beneficios a partir de unamayor eficiencia en función de los costos, y que deberían ponerse a prueba. Si bienen ese momento la recomendación no convenció por completo a la dirección, en laactualidad se está considerando el modelo con gran interés.
16. La experiencia de otras organizaciones internacionales también mostró lanecesidad de reestructurar la Sede así como de reorganizar algunas actividadesentre aquella y el terreno. En 2013, utilizando su propia experiencia y potencialpara lograr economías de escala, el FIDA podría haber realizado un análisisfuncional más estructurado de las actividades que se hacían mejor desde la Sede ylas que se hacían mejor en los países, lo cual podría haber dado lugar a un enfoquemás informado.
B. EficaciaContribución a la mejora del desempeño operativo
17. El establecimiento de oficinas en los países contribuyó a mejorar el diseñoy los resultados de los programas sobre oportunidades estratégicasnacionales (COSOP). El análisis de las evaluaciones de los programas en lospaíses revela que la presencia de oficinas del FIDA coincide con los COSOP demayor pertinencia, que responden mejor a las prioridades nacionales y lasnecesidades locales. La presencia en el país trajo aparejado un mayor conocimientodel contexto institucional y normativo de los países, y ha llevado a que se realicenconsultas con los asociados de manera más frecuente y sustanciosa.
18. La presencia en los países ha contribuido notablemente al apoyo a laejecución de los proyectos, lo que a su vez ha mejorado la eficacia de losproyectos. Incluso en los proyectos bien diseñados y gestionados, la ejecuciónpueden verse afectada por distintos obstáculos. La presencia de personal del FIDAque puede interactuar con las partes interesadas cuando estas lo necesitan permiteuna mayor capacidad de respuesta y resolución de problemas, a la vez que agilizael intercambio de correspondencia y evita los retrasos.
19. En los países con oficinas del FIDA (en funcionamiento al menos dos años antes dela finalización del proyecto) las calificaciones otorgadas a la eficacia de losproyectos fueron considerablemente mejores que en los que no había una oficina.Aunque en los resultados del proyecto influyen muchos factores además de lasactividades que desarrollan las oficinas del FIDA en el país, las entrevistas y losestudios de caso utilizados para la evaluación que nos ocupa ilustraron de modoconvincente cómo estas oficinas, a través del apoyo a la ejecución, facilitaron laobtención de esos resultados.
20. En la esfera de las actividades no crediticias, la presencia en los paísescontribuyó notablemente a la creación de asociaciones, pero de maneramás limitada en lo que respecta a la gestión de los conocimientos y eldiálogo sobre políticas. En lo que se refiere a las asociaciones con los gobiernos,la frecuencia y la calidad del diálogo con las contrapartes nacionales registraronmejoras considerables. Se observó una correlación positiva entre la presencia enlos países y el aumento de la financiación proveniente de fuentes internas. Lapresencia en el país contribuyó también a mejorar el intercambio de información y
EB 2016/119/R.10
5
a facilitar la participación del FIDA en los grupos sectoriales de coordinación entredonantes. Para un conjunto seleccionado de donantes multilaterales (por ejemplo,la Unión Europea y el Banco Africano de Desarrollo), las oficinas del FIDA en lospaíses contribuyeron a movilizar financiación internacional suplementaria.
21. La presencia en los países ayudó a establecer contactos más frecuentes con losorganismos con sede en Roma y otros organismos de las Naciones Unidas, aunqueno reforzó la colaboración programática y sobre cuestiones de fondo. El personaldel FIDA consideró menos prioritaria su participación en iniciativas de las NacionesUnidas debido a que el modelo operativo del Fondo es diferente y se parece más alde los bancos multilaterales de desarrollo.
22. En lo que respecta a la gestión de los conocimientos, la contribución fue másreducida. Los equipos de proyectos y las oficinas en los países han organizadoalgunas iniciativas y productos relacionados con los conocimientos, no obstante,estos no fluyen como deberían fluir debido a una serie de factores: i) lasdeficiencias de los sistemas de seguimiento y evaluación (SyE); ii) la ausencia deuna plataforma que simplifique la búsqueda y recuperación de productos deconocimiento elaborados por las oficinas en los países y los equipos de proyectos, yiii) la escasa disponibilidad de recursos financieros y humanos a nivel de lasoficinas en los países.
23. Si bien algunos casos ejemplifican el papel positivo que han desempeñado lasoficinas en los países para promover el diálogo sobre políticas en la esfera nacional,esto no ha ocurrido de manera sistemática. Debido al tamaño de las oficinas en lospaíses y a las distintas prioridades que estas enfrentan, es relativamente poco eltiempo que los miembros de su personal han dedicado al diálogo sobre políticas. Engeneral, estos interpretan que la mitad del tiempo debería destinarse a cuestionesoperativas, pero cada vez más se espera que se ocupen de la labor normativa, lagestión de los conocimientos y el diálogo en las instancias nacionales.
24. La elección de las cuestiones relacionadas con el diálogo sobre políticas incluidas enlos COSOP y los documentos de diseño de los proyectos estuvo en gran medidadeterminada por los intereses, la experiencia y las iniciativas de los gerentes de losprogramas en los países (GPP). En las evaluaciones del desempeño profesional delpersonal se tienen más en cuenta la cantidad de proyectos aprobados, la ejecuciónsatisfactoria y la garantía de una sólida gestión fiduciaria que las actividades nocrediticias. Esa es una de las razones por las que el personal de las oficinas en lospaíses, que trabaja al límite de sus posibilidades, destina relativamente pocotiempo al diálogo sobre políticas. Además, no hay una diferenciación clara de lasexpectativas en las distintas categorías de oficinas en los países. Las oficinasdirigidas por OPP cuentan con menos recursos humanos y financieros que lasdirigidas por GPP, y no se puede esperar que participen en las misma gama deactividades.
Contribución a los resultados de desarrollo25. Existen algunos indicios de que la presencia en los países apoyó los
esfuerzos del FIDA para reducir la pobreza rural y mejorar la igualdad degénero. Las calificaciones de los proyectos otorgadas por la IOE al evaluar los“ingresos y activos de los hogares” y la “seguridad alimentaria y productividadagrícola” fueron significativamente más elevadas en los países con oficinas delFIDA. Si bien intervinieron muchos otros factores externos, es posible que existacierta relación entre estos resultados de desarrollo y la labor de las oficinas en lospaíses en la esfera del apoyo a la ejecución, la resolución de problemas y lafacilitación de contactos con las contrapartes nacionales.
26. Por otra parte, las evaluaciones independientes de los proyectos constataron quelos resultados en materia de igualdad de género fueron mejores en los países conoficinas del FIDA, y esto se vio reflejado en calificaciones significativamente másaltas que las calificaciones promedio para la “igualdad de género y el
EB 2016/119/R.10
6
empoderamiento de la mujer”. Las oficinas en los países ayudaron a obtener estosresultados mediante labores de sensibilización con gerentes de proyectos yfuncionarios gubernamentales respecto de los objetivos de igualdad de género delFIDA y, en un sentido más amplio, sobre la importancia de la igualdad de géneropara intensificar el desarrollo rural y el impacto de los proyectos.
27. También se pudo establecer una vinculación entre la presencia en lospaíses y mejores perspectivas en cuanto a la sostenibilidad de losbeneficios, la innovación y la ampliación de escala. El análisis de evaluacionesindependientes de proyectos sugiere una vinculación entre la presencia en el país ycalificaciones más altas para la “sostenibilidad de los beneficios”. Asimismo, lapresencia en los países se relacionaba con dos factores impulsores de lasostenibilidad identificados en el ARRI de 2015: la integración de los objetivos delos proyectos en las estrategias nacionales de desarrollo y el establecimiento deestrategias claras y realistas para la incorporación sistemática de la perspectiva degénero. Las calificaciones de las evaluaciones de proyectos para la “innovación yampliación de escala” fueron significativamente superiores en los países conoficinas del FIDA. Esto podría deberse en parte a las mejores oportunidades queofrecen las asociaciones sólidas con los gobiernos y otras organizacionesinternacionales, en particular con los donantes.
28. Diferencias entre las oficinas en los países dirigidas por personal decontratación internacional y nacional. Contrario a lo que se esperabainicialmente, si bien hubo ocasiones en que se obtuvieron mejores resultados enoficinas dirigidas por personal de contratación internacional, en muchos de losindicadores no se observaron diferencias entre los dos modelos. Es precisoreconocer que solo unas pocas oficinas dirigidas por personal de contratacióninternacional han estado en funcionamiento durante un número considerable deaños, y que en algunas oficinas ha habido rotación del personal internacional. Porotra parte, el personal de categoría superior de origen nacional, que tiene másexperiencia, podría estar más familiarizado con los antecedentes de los proyectos ycon cuestiones específicas relacionadas con el gobierno y el contexto local,mientras que el personal de origen internacional debe superar una etapa deaprendizaje.
29. No obstante, esta evaluación a nivel institucional reconoce que el personalinternacional adscrito en los países tiene responsabilidades que no pueden serasumidas por personal nacional y que con frecuencia, a diferencia de este, tienemás posibilidades formales de acceder al gobierno y la comunidad internacional. Detodas maneras, de los hallazgos expuestos anteriormente se concluye que elpersonal de contratación nacional contribuye de manera importante a mejorar eldesempeño operativo y los resultados del FIDA en materia de desarrollo.
C. EficienciaCostos de gestión
30. Aunque la apertura de oficinas en los países entraña costos adicionales,no ha dado lugar a una escalada de los gastos administrativos. Entre2007 y 2011, un factor importante que debe tenerse en cuenta fue laterminación del convenio con la Oficina de las Naciones Unidas de Servicios paraProyectos (UNOPS) para la supervisión de proyectos y la decisión adoptada porel FIDA en 2007 de supervisar directamente los proyectos. Esa importantetransición permitió al Fondo utilizar el presupuesto que se destinabapreviamente a la supervisión dirigida por la UNOPS (y a los gastos generalesrelacionados) para financiar la supervisión directa del FIDA y los costos deampliación de la presencia en los países. La ampliación ulterior de la presenciaen los países se financió con cargo a un presupuesto fijo del Departamento deAdministración de Programas (PMD) entre 2011 y 2015, hasta que en 2016 el

EB 2016/119/R.10
7
FIDA reconoció que la descentralización entrañaba costos más elevados. Entérminos generales, el FIDA ha sido capaz de contener los costos asociados conla descentralización.
31. Sin embargo, se pueden hacer dos salvedades. En primer lugar, no se explorarontodas las opciones disponibles para la reorganización y reducción de costos de laSede, y se podrían haber liberado recursos para afianzar la presencia en los países.En segundo lugar, una de las consecuencias de mantener un presupuesto fijomientras se ampliaba la presencia en los países fue que la dotación de personal ylos recursos de las oficinas en los países no alcanzaban para llevar a cabo toda lagama de actividades previstas. Los hallazgos constatados por esta evaluación anivel institucional en la esfera de la eficacia sugieren que las oficinas en los paísestenían la capacidad suficiente para participar tanto en el diseño de los programasen los países y los proyectos como en el apoyo a la ejecución, pero en menormedida en las actividades no crediticias.
32. La dotación de personal del PMD en la Sede se ha mantenido casi en losmismos niveles desde 2008. El número total de puestos en el presupuesto delPMD aumentó de 194 en 2008 a 305 en 2016, mientras que el número deempleados de las oficinas en los países aumentó durante el mismo período de 5 a107: esto refleja un ligero aumento del personal de la Sede. Reajustar lasfunciones y la dotación de personal de la Sede era una posibilidad paraproporcionar más recursos a las oficinas en los países y obtener una mayoreficiencia en función de los costos, pero el FIDA no la puso en práctica en gradosignificativo, con excepción de la adscripción de gerentes de programas en lospaíses de contratación internacional.
33. Una evaluación de los costos que implica la gestión de un programa en elpaís con una modalidad de presencia distinta podría haber proporcionadoal FIDA información más oportuna sobre las opciones más eficientes paraampliar la presencia en los países. A fin de maximizar los beneficios de ladescentralización ante un presupuesto limitado, se llevó a cabo un ejercicio, comoparte de un análisis funcional general, que consistió en evaluar los costos degestión de un programa en el país bajo diferentes modalidades (por ejemplo, lagestión por la Sede, como se hace tradicionalmente; la gestión por parte de unaoficina en el país y la gestión bajo distintas configuraciones de oficinas en lospaíses).
34. Los costos de gestionar un programa en el país son mayores que los de administraruna oficina en el país (es decir, costos de personal y costos no relacionados con elpersonal), ya que incluyen gastos por concepto de viajes y, sobre todo, gastos porel tiempo que el personal en la Sede destina a brindar apoyo al programa en elpaís. Nunca antes se había hecho en el FIDA este tipo de evaluación de costos, quepor primera vez se introduce en esta evaluación a nivel institucional. Una de laslimitaciones fue la fragmentación de los costos en diversas categorías (por ejemplo,gastos de personal, gastos administrativos no relacionados con el personal, viajesdel personal) y en diferentes bases de datos. Por otra parte, la imputación de loscostos de la Sede tuvo que calcularse mediante supuestos en función de lasdistintas configuraciones de presencia en el país. En el informe principal (cuadros 5y 6) se presenta un cálculo estimativo de los costos promedio de gestión por país ypor proyecto, desglosados por modalidad de configuración de la presencia en elpaís.
35. La configuración en forma de centro subregional es competitiva encomparación con otras modalidades de presencia en el país en cuanto a loscostos promedio por país y por proyecto, y presenta ventajas desde elpunto de vista institucional. La ventaja con respecto a los costos es que loscentros subregionales pueden prestar servicios a varios países (normalmente 3 o4) sin tener que reproducir la estructura de oficina en el país en cada uno de ellos.

EB 2016/119/R.10
8
En otras palabras, aunque un centro subregional tenga una mayor dotación depersonal y gastos administrativos más elevados en comparación con una oficinadirigida por un miembro del personal de contratación nacional o internacional concompetencia en un solo país, el centro subregional genera economías de escala ytiene un alcance más amplio, lo que se traduce en una mayor eficiencia de costoscuando estos se calculan por país o por proyecto.
36. Como se ha podido constatar en esta evaluación a partir de los estudios en lospaíses y las conversaciones mantenidas con representantes gubernamentales,gerentes de proyectos y personal del FIDA durante los talleres regionales, loscentros subregionales también presentan ventajas institucionales. Desde el puntode vista estratégico, posibilitan los enfoques transfronterizos y la participación enforos e iniciativas subregionales. Proporcionan una mayor continuidad y flexibilidaden la prestación de los servicios a los países, pese a la rotación del personal.Mejoran la racionalización de la dotación de personal y consultores, y podríanacoger a asesores técnicos regionales o subregionales. Sin embargo, existe ciertoriesgo de una desviación hacia centros constituidos sobre la base de la actualestructura sin que medie un análisis funcional de las tareas que deben realizar loscentros y de aquellas de competencia de la Sede.
37. Por tanto, hay posibilidades de reforzar la presencia en los países desde unaperspectiva institucional y operativa, al tiempo que se logra una mayor eficiencia.Los hallazgos descritos anteriormente se han sometido a una validación adicionalpor medio de un ejercicio de modelización (véase el anexo VII del informeprincipal). En este ejercicio se simuló una reorganización de la configuración actualde la oficina en el país que se apoya en gran medida en los centros subregionales yentraña una cierta reorganización en la Sede (por ejemplo, traslado sobre elterreno de personal subalterno de contratación internacional, reducción delpersonal del cuadro de servicios generales en la Sede y aumento del personal decontratación nacional del cuadro de servicios generales). El ejercicio demodelización ilustra los posibles ahorros en el presupuesto de gastos de personal.
38. La apertura de más oficinas en los países requiere una mejor justificación.A julio de 2016, las 39 oficinas en los países en funcionamiento abarcaban el 76 %de los proyectos activos del FIDA. Si a ello se agregasen 10 oficinas más (deacuerdo con los planes descritos en la actualización presentada a la Junta en abrilde 2016), las oficinas en los países abarcarían el 83 % de la cartera activa delFIDA, lo que representa un incremento de tan solo el 7 %, mientras que los costosadicionales rondarían los USD 2,5 millones (cerca del 15 % de los costos ordinariosde las oficinas en los países).
Estructura institucional y disposiciones organizativas39. Se han observado marcadas diferencias entre las regiones en las
modalidades de descentralización. Cada división regional se encuentra ante uncontexto diferente en lo que se refiere al tamaño y distribución de la cartera depréstamos, las situaciones de fragilidad, la infraestructura de las comunicaciones,la accesibilidad aérea y la disponibilidad de personal de contratación nacionalcualificado. Sin embargo, cada una ha creado sus propias modalidades y no se hareflexionado, colectivamente, sobre cuáles eran las opciones para fortalecer lapresencia en el país, contener los costos y delegar facultades sobre el terreno. Másrecientemente, todas las divisiones se han interesado en la modalidad del centrosubregional, aunque con distintas interpretaciones de lo que implica en la práctica.
40. El FIDA no ha llevado a la práctica una reorganización significativa delpersonal de la Sede, incluidos, sobre todo, ajustes de la dotación del personal delcuadro de servicios generales. En la actualidad, la División de Asia y el Pacífico, laDivisión de África Oriental y Meridional y la División de África Occidental y Centralcuentan con un presupuesto de personal de plantilla sobre el terreno levementesuperior que el de personal en la Sede. Sin embargo, existe la posibilidad de
EB 2016/119/R.10
9
realizar más ajustes: el 68 % del personal del cuadro orgánico aún se encuentra enla Sede. La División de África Occidental y Central es la única que cuenta con máspersonal de contratación internacional sobre el terreno que en Roma. Dos terciosdel personal del cuadro de servicios generales aún se encuentra en la Sede. Lospotenciales ahorros derivados de una mayor reestructuración aún no se hanmaterializado.
41. La mayoría de los bancos multilaterales de desarrollo y gran parte del sistema delas Naciones Unidas han emprendido programas de reorganización ydescentralización. Las medidas incluían con frecuencia una combinación deincentivos (la jubilación anticipada y la indemnización por despido), así como lavoluntad de rescindir los contratos y ajustar el perfil de los puestos. Está previstoque el personal de contratación internacional de programas de la mayoría de losorganismos operativos de las Naciones Unidas cambie de destino al menos una vezcada cinco años, y algunas instituciones financieras internacionales tienenrequisitos similares. En 2016, la Dirección de Recursos Humanos y el PMD pusieronen práctica un programa piloto de movilidad dentro del PMD para evaluar laaplicabilidad de un enfoque estructurado y presentarán un informe a la direccióndel FIDA a finales de año.
42. El FIDA ha introducido una serie de mejoras en las funciones de apoyo alas oficinas en los países. Sin embargo, el proceso de delegación deautoridad previsto ha avanzado con lentitud. La Dependencia de Apoyo sobreel Terreno del Departamento de Servicios Institucionales ha desempeñado unvalioso papel, y las oficinas en los países aprecian su apoyo. Esta dependenciaadministra los costos de capital vinculados con la apertura de oficinas, losconvenios de prestación de servicios con el organismo de acogida y los acuerdoscon el país anfitrión, y es responsable de la seguridad y las inversiones de capitalpara la seguridad en las oficinas del FIDA en los países. Asimismo, tuvo a su cargola elaboración del Manual de procedimientos administrativos para las oficinas en lospaíses, que es una guía de las políticas y los procedimientos institucionales máspertinentes para estas oficinas.
43. La tecnología de la información y las comunicaciones ha mejorado de manerasignificativa en lo que respecta a la conectividad a Internet, los servicios de voz yvideoconferencia y los sistemas institucionales. Los principales problemas parasacar provecho de estos avances están relacionados con la infraestructura local delos países en cuestión y con aspectos prácticos y organizativos del FIDA (como laprogramación de los seminarios y talleres teniendo en cuenta las diferenciashorarias).
44. La Política y estrategia del FIDA de presencia en los países de 2011 se concibió conuna mayor delegación de autoridad en mente. En los últimos cinco años, el avanceha sido lento. A modo de ejemplo, la responsabilidad del presupuesto recae en losdirectores regionales. En 2016 se puso en marcha una iniciativa piloto de seismeses para descentralizar la responsabilidad presupuestaria y otras tareasadministrativas hacia el centro de Viet Nam. La oficina de Viet Nam se mostró engeneral satisfecha, y la evaluación de la iniciativa piloto será un factor importantepara tener en cuenta antes de ampliar esta modalidad a otras oficinas. Los GPP derango superior adscritos fuera de la Sede conocen el volumen del presupuestodestinado a la supervisión y lo utilizan de manera eficaz. Sin embargo, debennegociar con la oficina de coordinación de su división, lo que lleva a un usoineficiente del tiempo. La delegación de autoridad para las tareas de comunicaciónconstituye otro motivo de preocupación para muchos GPP a cargo de oficinas en lospaíses, ya que consideran que ha dado lugar a demoras, pérdida de oportunidadesy tiempo desperdiciado en tratativas con la Sede.
EB 2016/119/R.10
10
III. Conclusiones45. Los objetivos generales y el diseño del proceso de descentralización
según fue evolucionando han sido pertinentes para la consecución demejores resultados de desarrollo, pero hay aspectos importantes que sedeben mejorar. Muchos de los supuestos estaban bien justificados. Sinembargo, algunos casos como el enfoque “blando” y la no incidencia en los costosno eran del todo válidos, como ya había ocurrido en las organizaciones dereferencia. La adhesión a rajatabla a esos supuestos creó un desajuste entre lasexpectativas del FIDA y sus clientes respecto de las oficinas en los países y lacapacidad de las oficinas pequeñas de prestar todos los servicios deseados, enparticular, las actividades no crediticias. Por otra parte, la ampliación de lapresencia en los países no se había basado en un análisis funcional paradeterminar las opciones que pudieran maximizar el apoyo al programa en el paísy contener los gastos de la oficina, y no hubo un esfuerzo proporcional para hacerreformas o ajustar las disposiciones en la Sede, que es un elemento clave en todoproceso de descentralización.
46. Los hallazgos constatados sobre el desempeño operativo y los resultadosde desarrollo dan fe de importantes mejoras a nivel de la cartera. Hayindicios de que las oficinas en los países contribuyeron de manera importante aadaptar mejor los programas y las estrategias nacionales del FIDA a lasnecesidades y prioridades locales. El personal destacado en las oficinas en lospaíses garantizó el seguimiento, la continuidad del apoyo y la capacidad resolutivade los equipos de proyecto, lo que ayudó a mejorar la calidad de la ejecución. En loque respecta a los resultados de desarrollo, la presencia de oficinas en los paísescoincidió con mejoras en el impacto en la seguridad alimentaria y los ingresos delos hogares, la productividad agrícola, la igualdad de género y el empoderamientode la mujer. También se observaron mejoras en la sostenibilidad de los beneficios,la innovación y la ampliación de escala y los logros generales de los proyectos.
47. Sin embargo, las actividades no crediticias, que también forman parte delprograma en el país, recibieron un apoyo menor. Se espera que con el tiempolas actividades no crediticias traigan beneficios para la cartera de proyectosfinanciados por el FIDA y el programa en el país en su conjunto. Existen indicios deimportantes mejoras en lo que respecta a las asociaciones con los gobiernos y unamayor participación en grupos de coordinación de donantes. Los contactos con losorganismos con sede en Roma y las organizaciones de las Naciones Unidas se hanvuelto más frecuentes, aunque esto no se ha visto reflejado en un aumentosignificativo de la colaboración programática en general.
48. Las mejoras en la gestión de los conocimientos y el diálogo sobre políticas han sidomás limitadas, debido principalmente a los escasos recursos adicionales adisposición de las oficinas en los países para llevar a cabo esas actividades y a laausencia de una plataforma que facilite el acceso a productos de conocimientoespecíficos del proyecto o país. Debido a la escasez de recursos y a la existencia deotras prioridades, es relativamente poco el tiempo que los miembros del personalde las oficinas en los países han dedicado a la gestión de los conocimientos, y nohubo una línea presupuestaria administrativa específica asignada a actividades nocrediticias. La atención dispensada a esas esferas dependió en gran medida delinterés del personal de las oficinas en los países, y la experiencia en materia dediálogo sobre políticas no fue uno de los criterios adoptados para su selección.
49. El FIDA logró ampliar la presencia en los países y evitar una escalada delos costos. Sin embargo, no se exploraron todas las oportunidades paraobtener una mayor eficiencia en función de los costos. En particular, de 2011a 2015 el PMD sufragó el aumento de los costos con un presupuesto fijo en valoresnominales. Eso no parece haber comprometido la estrategia en los países ni lagestión de los programas, pero limitó las actividades no crediticias. Como se ha

EB 2016/119/R.10
11
señalado, no se analizó en detalle la mejor manera de asignar tareas entre la Sede,las oficinas en los países y los profesionales de contratación internacional ynacional a nivel de países y subregiones.
50. Aunque la dotación de personal de las oficinas en los países ha aumentadoconsiderablemente, los niveles del PMD en la Sede no se han reducido. Por otraparte, en determinadas condiciones, el doble objetivo de reforzar la presencia enlos países y aumentar la eficiencia podría lograrse a través de la modalidad delcentro subregional, pero ello debería basarse en un análisis funcional e iracompañado de una reorganización en la Sede.
51. Inicialmente, el nuevo modelo operativo del FIDA hacía hincapié en la ampliaciónde la presencia en los países, y el énfasis en la descentralización es un hechoreciente. La prioridad ha cambiado: ya no se trata de explicar los beneficios de ladescentralización, sino de justificar el mantenimiento de una organización, unasfacultades y unos procesos centralizados. Pese a las expectativas establecidas en laPolítica y estrategia del FIDA de presencia en los países de 2011, la evaluaciónconstató una limitada delegación de autoridad a los GPP de categoría superior en loque respecta a la responsabilidad del presupuesto y la comunicación.
52. Si el volumen del programa de préstamos y donaciones del FIDA experimenta unaumento sostenido en los próximos años, será necesario intensificar y reforzar ladescentralización para poder responder a las crecientes demandas y desafíos, ymantener/mejorar la calidad del desempeño operativo y los resultados dedesarrollo.
IV. Recomendaciones53. Recomendación 1. Consolidar la presencia del FIDA en los países
aumentando al mismo tiempo la eficiencia en función de los costos. Laevaluación a nivel institucional de 2013 sobre la eficiencia institucional del FIDA y laeficiencia de las operaciones financiadas por el FIDA ya había puesto de manifiesto lanecesidad de aumentar la eficacia y la eficiencia del proceso de descentralización. ElFIDA deberá reforzar su presencia en los países/subregiones y su capacidad sobre elterreno consolidando una “masa crítica” y concentrando recursos humanos yfinancieros, en lugar de distribuirlos en un número cada vez mayor de oficinas. Elmodelo de centro subregional tiene la capacidad para apoyar este tipo deconcentración y lograr economías de escala, si se aplica correctamente.
54. Como esfuerzo complementario para aumentar la eficacia y la eficiencia, el FIDAnecesita ejecutar un plan, basado en el análisis funcional, para reducir el personalen la Sede y aumentar el número de personas que trabajan cerca de los programasen los países, es decir, personal de las oficinas en los países, en particular allídonde los programas sean relativamente grandes.
55. Recomendación 2. Aumentar el apoyo a las actividades no crediticias através de la descentralización para obtener resultados de desarrollo másfirmes. El FIDA necesita incluir un programa más selectivo de actividades nocrediticias en sus estrategias en los países, basándose en consultas con losasociados nacionales en el desarrollo. Deberá distinguir las actividades nocrediticias según el tipo de oficina en el país y su capacidad en materia derecursos, y fijar una partida presupuestaria específica.
56. Recomendación 3. Aumentar la delegación de autoridad. Sobre la base de laevaluación de la experiencia de la iniciativa piloto llevada a cabo en Viet Nam, elFIDA deberá elaborar un plan para delegar autoridad presupuestaria a losdirectores en los países, que incluya actividades de capacitación. Asimismo, deberádefinir un marco con miras a una ulterior delegación de autoridad en la esfera de lacomunicación, y para crear una plataforma que facilite el acceso a los productos deanálisis y conocimiento elaborados por las oficinas en los países y los equipos delos proyectos.

EB 2016/119/R.10
12
57. Recomendación 4. Mejorar los incentivos y la capacidad del personal paradesarrollar sus actividades en un entorno descentralizado. Existe lanecesidad de fortalecer los incentivos del personal adscrito en los países, enparticular si se traslada más personal de la Sede. Será importante ampliar yestructurar mejor el programa de orientación y tutoría, especialmente para elpersonal con poca experiencia en el FIDA. Los miembros del personal decontratación nacional necesitan más reconocimiento y empoderamiento, y en elcaso del personal del cuadro orgánico, criterios más claros de clasificación de lospuestos.
58. Recomendación 5. Mejorar la calidad de los datos, el seguimiento y laautoevaluación. Es necesario ajustar el sistema contable del FIDA a fin de hacerun seguimiento más integral de los costos de gestión de los programas en lospaíses con diferentes configuraciones de oficinas. Deberán simplificarse losindicadores para el seguimiento de las oficinas en los países e integrarse en lossistemas de gestión de la información y presentación de informes del FIDA. Porúltimo, el nuevo plan de descentralización institucional deberá facilitar el examen yla presentación de informes a la Junta Ejecutiva de manera regular para que estaproporcione orientación adicional.
Appendix EB 2016/119/R.10
1
Contents
Acknowledgements 3
Abbreviations and acronyms 4
I. Introduction and background 5
A. Introduction 5 B. Evolution of decentralization in IFAD 7 C. Progress to date 10 D. Structure of the report 12
II. Evaluation objectives and methodology 14
A. Objectives of the evaluation 14 B. Evaluation methodology 14 C. Data collection and information sources 17 D. Evaluation process 19
III. Relevance of IFAD’s decentralization 21
A. The objectives and design of the strategy for country presence 21 B. Internal enabling context, governance and monitoring of the
strategy for decentralization 27
IV. Effectiveness of IFAD's decentralization 31
A. Contributing to improved operational performance 31 B. Contribution to achieving better development results 45 C. Overall findings about the effectiveness of ICOs 49
V. Efficiency of IFAD's decentralization 53
A. Decentralization and management of costs 53 B. Institutional structure and organizational arrangements 59 C. Human Resources aspects 71 D. Administrative and technical support functions and decentralization
of approval authorities 74
VI. Conclusions and recommendations 80
A. Conclusions 80 B. Recommendations 82

Appendix EB 2016/119/R.10
2
Annexes
I. Evaluation framework 85
II. Definition of the evaluation criteria used by IOE 89
III. Evolution of IFAD’s decentralization 90
IV. Effectiveness data analysis 91
V. Evaluation Electronic Survey Results 122
VI. IFAD country offices 132
VII. Modelling Exercise of Alternative Organization Arrangements for Regional
Divisions 135
VIII. Report of the Senior Independent Advisor Richard Manning 140
IX. Selected References 143
X. List of key persons met 147

Appendix EB 2016/119/R.10
3
Acknowledgements
This corporate-level evaluation was finalised under the overall strategic guidance of
Oscar A. Garcia, Director of the Independent Office of Evaluation of IFAD (IOE). It was
prepared under the responsibility of Fabrizio Felloni, Deputy Director, IOE, with
contributions from Bruce Murray, John Markie and Barun Chatterjee, senior advisors.
Adolfo Patron Martinez, Abdoulaye Sy and Xiaozhe Zhang, Evaluation Research Analysts,
provided crucial support in desk review, data analysis and country case studies. Ashwani
Muthoo, former IOE Deputy Director, contributed to the approach paper and to the
conceptualization of the evaluation. José Pineda provided further analytical support to
the statistical analysis of IFAD quantitative databases. Giulia Santarelli, Evaluation
Assistant, provided valuable administrative support.
The report benefits from a peer review conducted within IOE. In addition, the
report benefits from comments of Richard Manning, Senior Independent Advisor, and
former Chair of the Development Assistance Committee of the Organization for Economic
Co-operation. Comments are also gratefully acknowledged from the Independent
Evaluation Department of European Bank for Reconstruction and Development and of the
Asian Development Bank.
IOE is grateful to the Executive Board representatives and Evaluation Committee
members for supporting this corporate-level Evaluation. IOE also thanks IFAD
Management and staff for their input and comments at various stages and in particular
those staff members that supported the conduct of country case studies and of regional
consultation workshops.
Finally IOE would like to convey appreciation to the governments and development
partners in many countries for supporting the conduct of case studies and regional
consultation workshops.

Appendix EB 2016/119/R.10
4
Abbreviations and acronyms
ACD Loan Administration and Disbursement Division
ADB Asian Development Bank
ADM Administrative Service Division
AfDB African Development Bank
APR Regional Division for Asia and the Pacific
AVP Assistant Vice President
BOD Budget and Organizational Development Unit
CFS Controller’s and Financial Services Division
CGIAR Consultative Group on International Agricultural Research
CLE Corporate-level Evaluation
COSOP Country Strategic Opportunities Programme
CPCG Country Presence Coordination Group
CPE Country Programme Evaluation
CPM Country programme manager
CPO Country Programme Officer
CSD Corporate Service Department
EB Executive Board
ESA Regional Division for East and Southern Africa
FAO Food and Agriculture Organization of the United Nations
FMD Financial Management Division
FPPP Field Presence Pilot Programme
FSU Field Support Unit
HRD Human Resources Division
ICO IFAD Country Office
ICT Information and Communication Technology Division
ILRI International Livestock Research Institute
IOE Independent Office of Evaluation of IFAD
LAC Regional Division for Latin America and the Caribbean
MDB Multilateral Development Bank
MOPAN Multilateral Organization Performance Assessment Network
NEN Regional Division for Near East, North Africa and Europe
OPV Office of the President and Vice-President
PCRV Project Completion Report Validation
PDFF Programme Development Financing Facility
PES Performance Evaluation System
PMD Programme Management Department
PPA/PPE Project Performance Evaluation Assessment / Evaluation
SKD Strategy and Knowledge Department
UNDP United Nations Development Programme
WCA Regional Division for West and Central Africa
WFP World Food Programme

Appendix EB 2016/119/R.10
5
Corporate-level evaluation of IFAD's decentralization experience
I. Introduction and background
A. Introduction
1. Background and definitions. The term "decentralization" is generally understood
as a process that involves the transfer of the authority and power to plan, make
decisions and manage resources from higher to lower levels of an organizational
hierarchy, to facilitate efficient and effective service delivery.1 International
Financial Institutions (IFIs) such as the World Bank, Asian Development Bank
(ADB) and African Development Bank (AfDB), the European Bank for
Reconstruction and Development (EBRD) and the Rome-based UN Agencies have
similar definitions.
2. The term was used for the first time in the IFAD 2013 Country Presence Strategy.
Moreover, the Executive Board Update of April 2016 when reviewing the evolution
of country presence (paragraph 45), states that “it now encompasses many
responsibilities at the country level, including portfolio management, policy
engagement, knowledge management and partnership building”. The April 2016
Update goes on to explain that IFAD Management will present a new
Decentralization Plan in 2016 to address: (i) optimal number and mix of country
office types; (ii) levels and types of staffing needed in the country offices and
headquarters; (iii) further delegation of authority to support decentralized
operations, while ensuring financial and fiduciary controls; and (iv) the required
human resource framework.
3. Key ingredients of decentralization include: (i) presence in a number of countries;
(ii) recruitment of staff in a set of countries; (ii) transfer of staff from headquarters
to some country offices; (iii) redistributing functions and some decision-making
authority from headquarters to IFAD country offices (ICOs); and (iv) elaborating
policies and rules in a number of areas to create an enabling environment while
preserving fiduciary checks.
4. The decision to decentralise some of IFAD’s functions by developing a country
presence and establishing a large number of ICOs, in addition to the introduction of
direct supervision, was a transformative organizational change to bring IFAD closer
to its in-country partners. The decentralization strategy was viewed as a way for
IFAD to improve its development effectiveness and cost efficiency. This change
began in 2003 when the Executive Board approved the three-year Field Presence
Pilot Programme (FPPP).2 Until that point in time and in line with the Agreement
Establishing IFAD, the organization did not have a permanent presence in
developing Member States, other than some ad hoc arrangements for outposting
Country Programme Managers (CPMs, i.e., international professional staff) to a few
Latin American countries beginning with Peru in the mid-1990s. The FPPP involved
establishing field presence in 15 states (three in each of the five geographical
regions), with the overall aim of enhancing the development effectiveness of IFAD
activities. The Independent Office of Evaluation (IOE) evaluated the FPPP in 2007.3
1 A classical definition of decentralization is that of Rondinelli et al. (1981) and refers to decentralization in the
government or civil service: “the transfer of responsibility for planning, management, and resource-raising and allocation from the central government to (a) field units of central government ministries or agencies; (b) subordinate units or levels of government; (c) semi-autonomous public authorities or corporations; (d) area-wide regional or functional authorities; or (e) NGOs/PVOs”. See Rondinelli, et al. (1981) Government Decentralization in Comparative Perspective: Developing Countries", International Review of Administrative Science, 47(2). 2 FPPP design document: www.ifad.org/gbdocs/eb/80/e/EB-2003-80-R-4.pdf.
3 Evaluation report: www.ifad.org/gbdocs/eb/91/e/EB-2007-91-R-6.pdf.
Appendix EB 2016/119/R.10
6
5. The Executive Board adopted IFAD’s first country presence strategy in 2011. The
strategy underlined the need to consolidate the offices in the 15 pilot countries and
to further expand IFAD’s country presence through the establishment of new ICOs.
6. The Board adopted a revised country presence strategy in 2013, covering the
period 2014-2015. This strategy went further, with the Board approving the
establishment of 50 ICOs by the end of 2015. In addition to setting up and staffing
the ICOs, IFAD is in the process of developing the management, financial, human
resource and administrative policies, practices and procedures to support the
organization’s decentralization process.
7. Why this evaluation. As decided by the IFAD Executive Board in December 2015,
IOE conducted a corporate-level evaluation (CLE) of IFAD’s decentralization
experience in 2016. The evaluation was undertaken within the overall framework of
the Revised IFAD Evaluation Policy (2011)4 and followed the broad methodological
fundamentals set out in the second edition of the 2015 IFAD Evaluation Manual.5
8. The overarching purpose of the CLE was to independently assess IFAD’s
decentralization experience. The evaluation was designed to generate findings and
recommendations to further strengthen IFAD’s organizational decentralization to
achieve better development effectiveness on the ground. This evaluation is
required as decentralization has changed in a substantial manner the operating
model of IFAD, challenging its traditional Headquarter-centric characteristic. While
partial aspects of decentralization have been assessed by other independent
evaluations (Corporate-level, Country Programme and project-level evaluation),
there has not been a comprehensive assessment of the process since the CLE of
the FPPP in 2007. In addition, past evaluations have mainly focused on the
programmatic side of establishing country offices but not on the organizational
implications of reassigning decision making authority and functions, some of which
are outside the Programme Management Department of IFAD. This evaluation will
inform the preparation of the Corporate Decentralization Plan that the Management
of IFAD will present to the Executive Board in December 2016.
9. There are both formative6 and summative7 aspects of this evaluation. Because IFAD
is still rolling out its decentralization/country presence strategy and implementation
and fine-tuning are underway, the formative aspects of the Decentralization CLE
were designed to identify findings, conclusions and recommendations intended to
improve performance. Although the country presence policy and strategy dates
from 2011, IFAD’s decentralization process formally started with the FPPP approved
by the Executive Board in December 2003. Thus with the passage of over a decade
of operations for some ICOs, some data on operational performance and
development results are available for the summative aspects of the evaluation to
assess the extent to which anticipated outputs and outcomes have been produced
and the results that have been achieved. That will provide the basis for an overall
assessment of IFAD’s decentralization efforts and generate lessons for the future.
10. A key distinguishing feature of the formative aspects of this evaluation was the
attention devoted to learning and promoting dialogue with IFAD Management and
other concerned stakeholders at key stages in the evaluation process. In particular,
4 www.ifad.org/gbdocs/eb/102/e/EB-2011-102-R-7-Rev-2.pdf.
5 www.ifad.org/evaluation/process_methodology/doc/manual.pdf. However, the CLE had to utilize past evaluations that
were produced following the 2009 Manual and its definition of criteria and domains. 6 OECD defines formative evaluations as evaluations intended to improve performance, most often conducted during
the implementation phase of projects or programs. OECD notes that formative evaluations may also be conducted for other reasons such as compliance, legal requirements or as part of a larger evaluation initiative. A related term is process evaluation, which OECD defines as an evaluation of the internal dynamics of implementing organizations, their policy instruments, their service delivery mechanisms, their management practices, and the linkages among these. See OECD. Glossary of Key Terms in Evaluation and Results Based Management. 2010. Pages 24, 30 and 31. 7 OECD defines summative evaluations as a study conducted at the end of an intervention (or a phase of that
intervention) to determine the extent to which anticipated outcomes were produced. Summative evaluations are intended to provide information about the worth of the program. See OECD. Glossary of Key Terms in Evaluation and Results Based Management. 2010. Page 35.

Appendix EB 2016/119/R.10
7
in the regional workshops both Management and IOE received feedback
simultaneously from in-country partners and ICO staff, thus allowing Management
to draw on this feedback as it prepared a Corporate Decentralization Plan.
Emerging findings were also discussed with senior management and divisional
representatives in July 2016.
11. The CLE findings and recommendations were based on thorough triangulation of
evidence and covered different dimensions of IFAD’s decentralization, including in
the areas of organizational architecture, delegation of authority, ICO models, and
related budget and human resource implications.
12. It was timely to evaluate IFAD’s decentralization efforts and experience in 2016
because: (i) decentralization is an important area of organizational reform during
the Tenth Replenishment of IFAD's Resources (IFAD10) period (2016-2018); and
(ii) in December 2016, Management will present a Corporate Decentralization Plan
to the Executive Board, which will document IFAD’s overall approach and future
actions related to the Fund’s decentralization in the medium term. The findings of
this evaluation will thus inform the preparation of the Corporate Decentralization
Plan. The evaluation was conducted in record time compared to similar CLEs and
was fully completed in 2016. The Approach Paper was reviewed by the Evaluation
Committee in March 2016. The report will be presented to the Executive Board in
December 2016.
B. Evolution of decentralization in IFAD
13. Conceptual evolution. When IFAD was originally established the intention was to
work through, and with, existing IFIs and United Nations agencies rather than for
IFAD to have country offices. That principle governed IFAD’s organizational
structure and operations for the first 20 years or more of its operations. The
absence of a local IFAD presence reflects a decision taken at the World Food
Conference in November 1974 when it was decided to establish IFAD.8 9 The main
linkage between IFAD and the borrowing/recipient countries was the missions
carried out by headquarters staff, international and local consultants and the
cooperating institutions in the country.
14. With the evolution of the development environment at the country and
international levels, IFAD gradually recognized that being closely involved in project
design and implementation as well as in other in-country non-lending activities
would enhance the impact of IFAD financed projects, something that was of
strategic importance for IFAD to fulfil its mandate for rural poverty reduction.
15. Discussions on the issue of IFAD’s field presence were initiated during the
consultations for IFAD’s Fifth Replenishment (IFAD5), in which the lack of an
institutional presence in its borrowing/recipient countries was identified as a
growing constraint on enhancing IFAD’s impact. These discussions were continued
during the Sixth Replenishment consultations. Because of concerns over
implementation performance, the IFAD’s Sixth Replenishment recommended that
Management further analyse ways to enhance IFAD’s field presence and
experiment with different models. Possible options included: (i) proxy field
presence under which IFAD would recruit a consultant locally who can undertake a
range of activities in support of the IFAD country programme, such as attending
donor co-ordination meetings; (ii) outposting CPM to lead ICOs; (iii) Country
8 At that conference the General Secretary of the United Nations stated, “The operations of the Fund would be carried
out through existing institutions”. Communication from the Commission to the Council, World Food Conference, 9 December 1974. SEC (74) 4955 final 9 The Lending Policies and Criteria, one of the IFAD’s basic legal documents initially approved by IFAD’s Governing
Council at its second session in December 1978, stipulated that “Project identification and preparation are normally the primary responsibility of the governments seeking IFAD funds. The Fund will secure, where necessary, the services of other international or regional institutions to assist the countries in the identification and preparation of projects.” The Lending Policies and Criteria were amended in several occasions. The Governing Council adopted a revised version on 14 February 2013, which is now renamed as “Policies and Criteria for IFAD Financing”.

Appendix EB 2016/119/R.10
8
Programme Officer (CPO, i.e. national professional staff))- led ICOs; (iv) regional
offices; (v) sub-regional offices covering several countries and/or liaison offices;
(vi) use of sub-regional networks; (vii) recruiting a regional field support manager;
and (viii) expanded CPM missions.
16. Field presence (2003-2007). During consultations on IFAD5 (2002) and IFAD6
(2005) of IFAD’s Resources, the lack of an institutional presence in developing
Member States was recognized as a key constraint on achieving greater impact on
rural poverty and enhancing the impact of IFAD financed projects, policy dialogue,
knowledge management and partnership building.10 Member States requested
Management to conduct a detailed study of the possibility of an IFAD presence in
the field and to identify options for enhancing IFAD’s role and capacity at the
country level. The findings and recommendations of that study were presented to
the Executive Board in December 2002.11
17. In December 2003 the Board approved a dedicated programme for field presence,
the FPPP, for a three-year period (2004-2006). By 2006, 15 ICOs had been
established. The objectives of establishing ICOs were to help improve IFAD’s
development effectiveness and cost efficiency. The main activities of ICOs were: (i)
country programme development; (ii) supervision/implementation support;12 (iii)
partnership building; (iv) policy dialogue;13 and (v) knowledge management,
innovation and capacity building. These areas have remained the key focus of ICO
activities. The FPPP was IFAD’s first programme dedicated to enhancing field
presence and IFAD’s the first major step towards decentralization.
18. The FPPP was largely managed under the responsibility of the Programme
Management Department (PMD). The offices set up under the FPPP were mainly
seen as an extension of PMD, to better respond to programmatic needs in the
countries concerned. Nationally recruited officers staffed all 15 field presence
pilots, though, at the time, outside the FPPP, IFAD had two country programme
managers (CPMs) outposted to the Plurinational State of Bolivia and Panama in the
Latin America and the Caribbean (LAC) region.
19. As requested by the Executive Board in 2003, IOE evaluated the FPPP at the end of
the pilot to help IFAD decide whether to “continue, expand, end or otherwise
modify the Field Presence Pilot Programme” (EB2003/80/R.4). The evaluation
found that, on the whole, project performance was better in countries with field
presence, as compared with countries without. However, it also underlined that the
effectiveness of the programme was constrained by lack of training of the field
presence officers, insufficient IT support – resulting in lack of access to key IFAD
loan and portfolio management systems – and limited delegation of authority.
20. The FPPP evaluation concluded that IFAD had not systematically experimented with
alternative field presence models. Most pilot countries followed the same model of
appointing a local staff member and arranging for office space. None of the FPPP
pilots involved outposting CPMs from headquarters, although the pilot envisaged
such experimentation. The FPPP evaluation also concluded that the FPPP did not
capture reliable cost data or include a platform for systematic knowledge sharing
among FPPP officers and CPMs. Overall, the FPPP did not provide IFAD’s
management and the Executive Board with appropriate guidance for formulating an
authoritative country presence policy. The FPPP evaluation found that
decentralization has consequences for the work of headquarters and that ongoing
institutional reform processes must take full account of the decentralization of
operations.
10
IFAD (2000) Partnership for Eradicating Rural Poverty: Report of the Consultation to Review the Adequacy of the Resources Available to IFAD 2000 – 2002. GC 24/L.3. 2000. 11
www.ifad.org/gbdocs/eb/77/e/EB-2002-77-R-9-REV-1.pdf. 12
ICOs were expected to spend 50% of their time on this activity. 13
Particularly for ICOs headed by an out posted CPM.

Appendix EB 2016/119/R.10
9
21. An additional thrust to country presence came from the introduction of direct
supervision. Prior to February 2006, the Agreement Establishing IFAD stipulated
that IFAD should delegate the role of supervision of its development interventions
to international cooperating institutions.14 Evaluations during IFAD5 and IFAD6
found that direct supervision had the potential to improve development
effectiveness at the country level and allow IFAD to pay more attention to its
broader objectives at the country programme level.15 Because of these factors, the
Governing Council amended the Agreement of Establishing IFAD and the Lending
Policies and Criteria (paragraph 43), delegating the decisions on project supervision
to the Executive Board. In 2006, the Policy on IFAD’s supervision and
implementation support was approved that resulted in far-reaching changes to
IFAD’s operational approaches, particularly on IFAD’s involvement in the field.
IFAD’s move to direct supervision provided an added incentive for strengthening
IFAD’s country presence as a platform to provide implementation support.16
22. Policy framework for IFAD’s decentralization 2007 onward. The 2007 FPPP
evaluation recommended that IFAD should:
i. Embark on an expanded country presence programme. In particular, it
recommended that the FPPP be transformed into a new programme called the
IFAD Country Presence Programme, which would aim to consolidate the
evidence behind emerging positive results and to determine the most cost-
effective form of IFAD country presence to adopt in the future to enhance
overall development effectiveness.
ii. Develop a country presence policy after 2010. The evaluation noted that
it was crucial that IFAD develop such a policy, given that the Fund was
created as a headquarters-centric institution. Establishment of country
presence would represent a fundamental change in the overall structure and
operations of the Fund. The evaluation also recommended an evolution in the
concept from field presence to country presence to promote a more
comprehensive, integrated engagement of the Fund at the country level.
23. Activity Plan and updates for country presence. The Executive Board
approved a number of key documents providing a framework for implementation of
IFAD’s decentralization. The Board discussed the Activity Plan for Country Presence,
in December 2007. It decided that IFAD should continue its pilot country offices,
integrating them more effectively into the normal programming, administrative and
budgetary processes and experimenting with different ICO models. In 2008, the
Board agreed to expand the programme by upgrading seven informal country
presence arrangements to ICOs and establishing three more ICOs. In 2009 the
Board approved establishing three more ICOs bringing the total to 30 ICOs.
24. From 2008 to 2010, Management presented to the Board annual progress reports
summarizing progress made in strengthening institutional arrangements, results
achieved in programmatic activities (e.g. policy dialogue, knowledge management,
reporting and monitoring) and financial management (e.g. ICO budgets).
25. IFAD Country Presence Policy and Strategy.17 The 2011 policy set out a
midterm strategy from 2011 to 2013, objectives for country offices and criteria for
opening these offices, among other features. It stated that more country offices,
with a cap of 40, would be established by 2013, which would cover about “two
thirds of the number of projects in the portfolio under implementation and three
quarters of the value of the portfolio under implementation”. An exit strategy was
also introduced in the 2011 policy, according to which IFAD would close offices that
14
The Governing Council authorized a departure from this rule in 1997, allowing up to 15 projects to be directly supervised by IFAD under the Direct Supervision Pilot Programme. 15
IFAD. President’s report on IFAD Policy on supervision and implementation support. EB 2006/89/R.4/Rev.1. 2006. 16
IFAD. Self-assessment report: IFAD country presence programme. EB 2011/102/R.10/Add.2. 2011. 17
EB 2011/102/R.10/Rev.2.

Appendix EB 2016/119/R.10
10
had become less relevant to the country programme or those that were judged as
not contributing to the objectives of the policy.
26. IFAD Country Presence Strategy (2014-2015).18 In 2013, based on a review
of the 2011 policy, IFAD Management proposed several revisions to be
implemented in an IFAD Country Presence Strategy (2014-2015), the first policy
document to use the terms "IFAD country office" and the concept of
"decentralization". That strategy recommended establishing another 10 ICOs
bringing the total to 50 although the overall policy framework remained
unchanged. The objective of this updated strategy was to “continue to strengthen
existing offices and establish new country offices in recipient countries where they
can contribute to improving the development effectiveness and cost efficiency of
IFAD’s operations”. In view of IFAD’s field presence experience and considering the
changing circumstances of its borrowing/recipient Member States, the relationship
between ICOs and headquarters was further explored to ensure that human
resource arrangements, the connectivity of ICOs and the delegation of authority to
ICOs would enable ICO staff to perform its representative role as expected.
27. The IFAD Country Presence Strategy (2014-2015) underlined the importance of
pursuing country presence as an IFAD-wide, rather than a PMD-centric, initiative.
The emphasis on decentralization was an explicit recognition that ICOs are an
integral part of IFAD’s broader organizational architecture, and that attention was
needed to systematically decentralize key administrative and support functions.
Thus, in addition to programmatic decentralization (e.g., by tasking ICOs to take on
lead roles in country programming and project supervision and implementation
support), more attention was intended to be devoted to administrative
decentralization [e.g., in human resources management, safety and security,
information and communications technology (ICT), travel and other services].
28. During 2015, designated by IFAD as the year of country offices, there were a series
of events focused on ICOs. The main objectives were to: (i) consolidate the
organization achievements; (ii) build a common IFAD identity; and (iii) focus on the
challenges of decentralization. Throughout 2015, information regarding ICO work
and staff was distributed through the IFAD Intranet, thus enhancing staff
knowledge of ICO achievements and the challenges of decentralization.
29. Update on IFAD’s country presence.19 A 2016 update to the Board provided an
overview of the progress achieved during 2014 and 2015 in consolidating the
existing country offices, establishing additional country offices and the operational
and policy challenges that had emerged. The document discussed the actions taken
to expand IFAD’s country presence, including the evolving country office models,
human resource challenges and the development of related policies and
procedures. It also discussed the impact of IFAD’s country presence on its
development effectiveness, the evolution of country office costs and associated
cost drivers and lessons learned and challenges and opportunities. Management
will present a corporate decentralization plan to the Executive Board in December
2016 to guide IFAD in moving from country presence to corporate decentralization.
C. Progress to date
30. Models for country presence. Based on the FPPP evaluation’s findings of the
limits of the proxy presence instruments (notably, limited capacity to represent
IFAD in an official manner, weak administrative support and delegation of authority,
no access to UN privileges and immunities), IFAD established additional country
offices in the borrowing/recipient countries.
31. By 2011, there were two main models of country office. Under the first model, a
national staff member, recruited as a country programme officer (CPO), led the
18
Document EB 2013/110/R.5/Rev.1. 19
EB 2016/117/R.4.
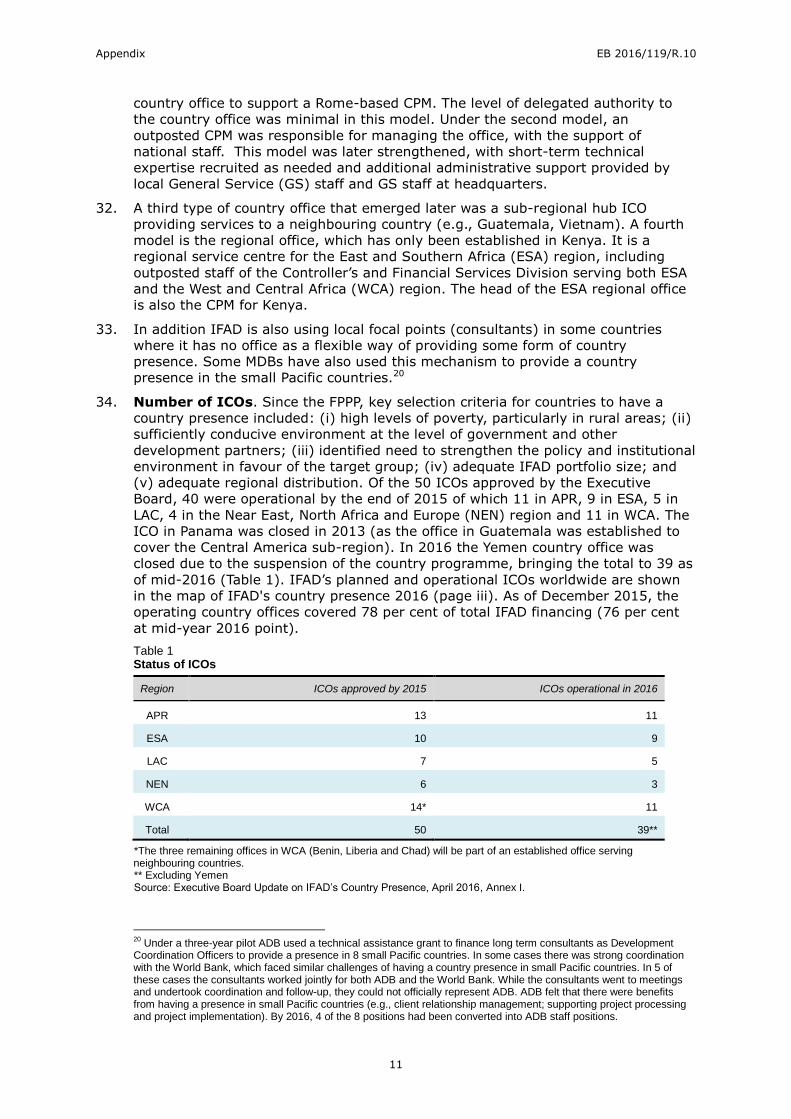
Appendix EB 2016/119/R.10
11
country office to support a Rome-based CPM. The level of delegated authority to
the country office was minimal in this model. Under the second model, an
outposted CPM was responsible for managing the office, with the support of
national staff. This model was later strengthened, with short-term technical
expertise recruited as needed and additional administrative support provided by
local General Service (GS) staff and GS staff at headquarters.
32. A third type of country office that emerged later was a sub-regional hub ICO
providing services to a neighbouring country (e.g., Guatemala, Vietnam). A fourth
model is the regional office, which has only been established in Kenya. It is a
regional service centre for the East and Southern Africa (ESA) region, including
outposted staff of the Controller’s and Financial Services Division serving both ESA
and the West and Central Africa (WCA) region. The head of the ESA regional office
is also the CPM for Kenya.
33. In addition IFAD is also using local focal points (consultants) in some countries
where it has no office as a flexible way of providing some form of country
presence. Some MDBs have also used this mechanism to provide a country
presence in the small Pacific countries.20
34. Number of ICOs. Since the FPPP, key selection criteria for countries to have a
country presence included: (i) high levels of poverty, particularly in rural areas; (ii)
sufficiently conducive environment at the level of government and other
development partners; (iii) identified need to strengthen the policy and institutional
environment in favour of the target group; (iv) adequate IFAD portfolio size; and
(v) adequate regional distribution. Of the 50 ICOs approved by the Executive
Board, 40 were operational by the end of 2015 of which 11 in APR, 9 in ESA, 5 in
LAC, 4 in the Near East, North Africa and Europe (NEN) region and 11 in WCA. The
ICO in Panama was closed in 2013 (as the office in Guatemala was established to
cover the Central America sub-region). In 2016 the Yemen country office was
closed due to the suspension of the country programme, bringing the total to 39 as
of mid-2016 (Table 1). IFAD’s planned and operational ICOs worldwide are shown
in the map of IFAD's country presence 2016 (page iii). As of December 2015, the
operating country offices covered 78 per cent of total IFAD financing (76 per cent
at mid-year 2016 point).
Table 1 Status of ICOs
Region ICOs approved by 2015 ICOs operational in 2016
APR 13 11
ESA 10 9
LAC 7 5
NEN 6 3
WCA 14* 11
Total 50 39**
*The three remaining offices in WCA (Benin, Liberia and Chad) will be part of an established office serving neighbouring countries. ** Excluding Yemen Source: Executive Board Update on IFAD’s Country Presence, April 2016, Annex I.
20
Under a three-year pilot ADB used a technical assistance grant to finance long term consultants as Development Coordination Officers to provide a presence in 8 small Pacific countries. In some cases there was strong coordination with the World Bank, which faced similar challenges of having a country presence in small Pacific countries. In 5 of these cases the consultants worked jointly for both ADB and the World Bank. While the consultants went to meetings and undertook coordination and follow-up, they could not officially represent ADB. ADB felt that there were benefits from having a presence in small Pacific countries (e.g., client relationship management; supporting project processing and project implementation). By 2016, 4 of the 8 positions had been converted into ADB staff positions.
Appendix EB 2016/119/R.10
12
35. Management, coordination, monitoring and reporting. An interdepartmental
steering committee (ISC), chaired by the then Assistant President, PMD was
established to coordinate and monitor the implementation of country presence
plan. The ISC was reconstituted in 2009 and renamed as Country Presence
Coordination Group (CPCG) to further reflect that country presence is “an IFAD
effort”, not a PMD initiative. The Assistant Vice President (AVP), PMD and the AVP,
Financial and Administration Department jointly chaired the new CPCG. The main
responsibility of the CPCG was to “coordinate the planning, implementation and
monitoring of critical tasks and activities that are needed in improving the
management of IFAD’s country presence”.21 The CPCG was inactive after 2010. In
2013 it was re-energised and co-chaired by the AVP, PMD and the AVP, Corporate
Services Department (CSD). Regular CPCG meetings resulted in better coordination
of IFAD’s decentralization initiative across the entire organization. The January
2016 President’s bulletin further reinforced the corporate nature of IFAD’s
decentralization by formally defining the responsibilities of the renamed Corporate
Decentralization Coordination Group.
36. To better support administrative decentralization, the Field Support Unit was
established in 2013 within CSD, with the mandate to manage field security
operations, host country- and service-level agreements and provide coordination
and advisory services aimed at strengthening the functionality of ICOs. FSU
prepared the ICO Handbook, a reference guide to the most salient features of the
corporate policies and procedures that are particularly relevant to ICOs.
37. Institutional arrangements. In line with its Board-approved country presence
policy and strategy, IFAD has established its ICOs under hosting arrangements with
United Nations agencies and, in one case, with a publicly funded research
institution [the Consultative Group on International Agricultural Research (CGIAR)],
see Efficiency Chapter. IFAD initiated discussions with FAO and UNDP and reached
agreement on the issue of hosting arrangements in 2007.22
38. Human resources management. Prior to 2009, the national staff in ICOs were
recruited through host agencies. In line with the 2008 amended framework
agreement between IFAD and UNDP, the President’s Bulletin on administrative
procedures for IFAD country offices was amended to allow for IFAD to directly
contract national and local staff. Accordingly, the Human Resources Division (HRD)
initiated the recruitment process for direct contracting national staff in 2010.
Amendments were made to the Human Resources Policy and Human Resources
Implementation Procedures in response to the changes necessitated by the
establishment of ICOs.
39. Delegation of authority. Decentralization is the transfer of responsibility from
higher to lower levels of decision-making. An essential feature of decentralization is
the delegation of authority and accountability from the headquarters to ICOs so
that the field-based staff can effectively and efficiently carry out their tasks. As a
first step, IFAD has created the Delegation of Authority Framework, which outlines
the organization’s decision-making structure and the responsibilities, roles and
functions of staff, including country office staff. As more experience is gathered
from the field, this framework will be further refined.
D. Structure of the report
40. The remainder of the report is structured into five chapters: (i) evaluation
objectives and methodology; (ii) relevance of IFAD's decentralization and country
presence policy and strategy for the achievement of IFAD’s strategic objectives;
(iii) effectiveness of IFAD's decentralization: furthering the achievement of
21
EB2009/98/R.11 22
To facilitate the process, a framework agreement was signed between IFAD and UNDP in September 2008 with specific provisions covering office space, administrative services and the procurement of goods and services. Apart from UNDP, no corporate agreements have been signed between IFAD and other United Nations Agencies.

Appendix EB 2016/119/R.10
13
institutional and development objectives; (iv) efficiency of IFAD's decentralization:
weighing costs and benefits; and (v) conclusions and recommendations.
Key points
In IFAD decentralization involves redistributing functions, powers, people and some decision-making authority from headquarters to ICOs. The decision to decentralise
some of IFAD’s functions by establishing a large number of ICOs was a transformative organizational change to bring IFAD closer to its in-country partners and to improve its development effectiveness and cost efficiency.
The Executive Board has approved establishing up to 50 ICOs. Of those, 40 were operational at the end of 2015 and 39 in mid-2016. Countries with ICOs accounted for about 80 per cent of IFAD’s total financing and two-thirds of total domestic financing.
The main activities of ICOs are: (i) country programme development; (ii) implementation support; (iii) partnership building; (iv) policy dialogue; and (v) knowledge management, innovation and capacity building.
There are four ICO models: (i) CPM led; (ii) CPO led; (iii) sub-regional hubs providing services to neighbouring countries; and (iv) a regional service centre in Nairobi. In addition, IFAD is using consultants as local focal points in some countries to provide a degree of country presence.
Initially establishing a country presence was largely a PMD initiative and most progress was made on programmatic decentralization. More recently IFAD moved to a corporate decentralization approach and progress began to be made on administrative decentralization.
Appendix EB 2016/119/R.10
14
II. Evaluation objectives and methodology
A. Objectives of the evaluation
41. The overarching objectives of the CLE were to assess and generate learning to
strengthen future strategies and plans on :
i. IFAD’s decentralization experience and efforts, including the underlying
assumptions;
ii. The contribution of IFAD decentralization to better operational performance
and to achieving better development results; and
iii. Costs of the decentralization process in relation to the results achieved.
B. Evaluation methodology
42. Evaluation coverage. The evaluation covered IFAD’s decentralization experience
in the five regions in which IFAD operates, from 2003 – when IFAD initiated the
FPPP – through end-2015. However, in line with its formative aspects, the CLE also
assessed the main elements and directions of the forthcoming update on IFAD’s
country presence strategy that Management presented to the Executive Board in
April 2016. Although IOE completed a CLE of the FPPP in 2007, the 2016
decentralization CLE has a more comprehensive and broader in scope. While it
drew on evidence generated during the FPPP evaluation and assessed the extent to
which its recommendations were internalized by the Fund, it did not aim to re-
evaluate the pilot programme.
43. Methodology. The CLE was anchored in three internationally recognized
evaluation criteria: relevance, effectiveness and efficiency. A key dimension that
distinguished this evaluation was the added attention devoted to stakeholder
engagement and learning at key stages of the evaluation.
44. Results chain. In line with international good practice in enhancing the
transparency and clarity of the subject being evaluated, Figure 1 presents a
simplified version of the CLE’s results chain, drawn from IFAD’s documentation,
complemented by interviews with staff and from selected organizational
management literature. The latter posits that decentralization can lead to
organizational gains by empowering managers closest to the local information to
make decisions, thus more rapidly solving problems and improving service
delivery.23 Decentralization needs to be complemented by effective control,
monitoring and performance measurement systems. Thus decentralization has
implications for an organization’s management, accountability and reporting
systems, financial management, human resource management and performance
evaluation systems. At the corporate level, these systems and associated
procedures need to be in place to gain the full benefits of decentralization.
Organization transformations typically involve major changes in policies, strategies,
structures, operating procedures, financial and human resource management and
organizational culture.24
45. The figure maps the results chain to the evaluation criteria that were used to
assess the performance of IFAD’s decentralization efforts. However, its purpose is
not to illustrate explicitly how all other associated corporate policies (e.g. direct
supervision and implementation support, or human resources policy) contribute to
fulfilling IFAD’s decentralization objectives. The CLE was designed to assess initial
conditions underlying the decentralization framework and issues at the input,
activity, output and outcome levels in the results chain. Outputs and outcomes are
affected by many country factors other than decentralization (e.g. local
23
Jerry M. Silverman. Public Sector Decentralization: Economic Policy and Sector Investment Programs. Volume 188. World Bank. 1992. Page 4. 24
McKinsey Digital. Changing change management. July 2015. McKinsey Global Survey Results: What successful transformations share. 2010. McKinsey Quarterly. The irrational side of change management. 2009.

Appendix EB 2016/119/R.10
15
beneficiaries, climate, harvests, price movements, macroeconomic conditions,
security conditions, governance, institutional capacity issues and availability of
counterpart funds). Thus, the CLE focussed on contribution rather than on
attribution at this level.
46. The CLE adopted a mixed-method approach, using qualitative and quantitative data
collection tools and analysis, to provide a thorough assessment of IFAD’s
decentralization efforts and experience to date. In particular, IFAD’s operational
performance and development results in countries were assessed "with and
without" country presence, as well as "before and after" and by country presence
modality. The broad aim of this analysis was to determine the contribution of
decentralization, and notably its country presence component, to furthering IFAD’s
mandate on the ground, recognizing that it is but one contributing factor.
Figure 1 Results chain for the CLE of IFAD’s Decentralization Experience
Source: IOE.
47. Evaluation framework. Annex I contains the CLE’s evaluation framework, which
includes the three criteria (relevance, effectiveness and efficiency) that were used
in the evaluation, key questions and sub-questions by criterion, sources of data,
and instruments for data and information collection.
48. Evaluation criteria and key questions. The following paragraphs present the
main evaluation questions and sub-questions, by evaluation criterion covered.
49. Relevance. The evaluation analysed: (i) the relevance of the objectives of the
decentralization strategy in relation to IFAD’s mandate and corporate policies; and
(ii) the design and assumptions underlying IFAD’s decentralization approach. The
key questions in assessing relevance were:
How relevant were the design and assumptions of the decentralization and
country presence strategy to enhancing IFAD's operational performance,
results and cost efficiency?
E
C 2
016/9
1/W
.P.3

Appendix EB 2016/119/R.10
16
How relevant are the criteria adopted for establishing ICOs?
How relevant were decentralization efforts to strengthen IFAD’s overall
institutional architecture, for example in the area of human resource
management?
How relevant is the results framework of the strategy, including its
monitoring and reporting system?
How relevant was the organizational structure, systems and processes put in
place to ensure smooth implementation of the decentralization strategy?
50. Effectiveness. The overarching question for assessing effectiveness was the
extent to which IFAD’s decentralization has led to better results on the ground. The
key questions in assessing effectiveness were:
To what extent has decentralization contributed to better performance of
country strategies, lending and non-lending activities, and alignment and
coordination?
Has decentralization enabled IFAD to better inform its corporate policies and
strategies based on enhanced knowledge and lessons from the field?
Has decentralization enhanced cooperation with government authorities, as
well as with international development partners, including the UN Rome-
based agencies?
Has decentralization enabled better engagement of non-governmental actors,
notably the civil society and private sector organizations?
Has decentralization had an effect on IFAD’s resource mobilization, including
cofinancing from both international and domestic sources?
What are the results in terms of country-level scaling up?
51. Efficiency. The evaluation reviewed the administrative resources used in the
design, implementation, monitoring and overall management of the
decentralization model to answer the following key questions to assess efficiency:
What has been the overall cost of decentralization and its implications for
IFAD headquarters?
What are the costs of IFAD’s decentralization in relation to the benefits
accrued (e.g., in terms of operational performance and development results)?
What are the main cost drivers associated with the decentralization process?
What are the costs and internal organizational arrangements at headquarters
for managing the decentralization process (including arrangements for host
country agreements)?
What are the cost savings and efficiency gains in the decentralization of core
functions such as financial and human resource management, ICT,
administrative services? Are other lower-cost alternatives available?
Are country offices and staff adequately supported by the headquarters and
by the existing corporate policies, including human resource policies? Is there
sufficient delegation of authority? Are country offices provided adequate
resources to support the lending portfolio and to engage in non-lending
activities?
52. Consistent with good practice, ratings have been applied within an evaluation
framework that is based on relevance, effectiveness, and efficiency. Criteria have
been rated on the 6-point scale as defined in the Evaluation Manual. The criteria
and sub-criteria are illustrated in Chapters III-V and ratings presented at the end of
the relevant Chapters.

Appendix EB 2016/119/R.10
17
C. Data collection and information sources
53. The evaluation used mixed methods and collected both quantitative and qualitative
information and data from a range of sources. The major information sources are
described in the following paragraphs.
54. Management self-assessment. In line with the IFAD Evaluation Policy,
Management is normally required to conduct a formal self-assessment as an input
to CLEs by IOE. However, no formal self-assessment was required for this CLE
because Management has undertaken several self-assessments in the past years as
inputs towards developing and updating the country presence strategy, the most
recent of which was discussed at the Executive Board in April 2016. IOE reviewed
the available self-assessments and collected additional information and feedback
through interviews with IFAD Management and staff during the evaluation process.
55. Document review. The evaluation team reviewed key documents available in
IFAD on the topic. These included country presence strategies, management
activity plans, self-assessments, final reports from selected IFAD replenishment
consultations, the Fund’s annual programmes of work and budget, President’s
bulletins on topics related to decentralization, human resource policies and
procedures (e.g. related to delegation of authority to outposted staff), reports
produced by the Office of Audit and Oversight and other pertinent documents.
56. The evaluation team mined IOE evaluation reports and project and country
strategy and programme ratings, which was a key source of data for the "before
and after" and "with and without" analyses. In addition to the FPPP evaluation,
many country programme evaluations include pertinent information on IFAD’s
decentralization. The Annual Reports on Results and Impact of IFAD Operations
(ARRIs) and related CLEs (e.g. on IFAD’s efficiency) were also reviewed to extract
relevant information. A structured approach to analysing the evaluation reports
was based on evaluation criteria and questions that the CLE covered.
57. In addition to examining IFAD documents and relevant documents from other
MDBs and the Rome based UN agencies, IOE also undertook a survey of
management literature on centralised/decentralised organizational models and
organizational change management.
58. Analysis of IFAD’s quantitative data. The evaluation included quantitative
analysis based on data available in IOE (such as the ARRI) and IFAD databases
[such as the Grants and Investment Projects System (GRIPS), Flexcube] and other
data available from PMD. The main purpose of the analysis was to assess whether
IFAD’s decentralization efforts, through the establishment of different types of
ICOs, were contributing to better development effectiveness (Annex IV).
59. Data were analysed for countries with and without ICOs, and within countries,
before and after ICOs were established and by type of ICO. Statistical analysis was
undertaken to determine whether differences were statistically significant. Data
was also extracted from IFAD’s financial, human resource and administrative
systems to assess the issues highlighted in the evaluation framework. A dedicated
assessment of the financial costs related to IFAD’s organizational decentralization
was part of this analysis.
60. Ratings generated by IOE in past evaluations were a key source of information in
assessing the contribution of ICOs to the organization’s operational performance
and results, including in terms of performance of the project portfolio, non-lending
activities (i.e. policy dialogue, knowledge management and partnership-building)
and country strategies (i.e. country strategic opportunities programmes
[COSOPs]). Similarly, ratings generated through IFAD’s self-evaluation system were
also drawn on where appropriate (project status reports, etc.), including those
assigned by the Quality Assurance Group (for project design).
Appendix EB 2016/119/R.10
18
61. Electronic survey of IFAD staff and stakeholders. An anonymous electronic
survey was used to extend the reach of the evaluation team to seek feedback from
many stakeholders (e.g. Executive Board members, Senior Management, IFAD staff
at headquarters and in ICOs, key government officials, project staff, the local donor
community and representatives of civil society). IOE coordinated with PMD to
ensure synergy between this CLE activity and Management’s 2016 client survey.
The questionnaire was sent to a total number of 1,987 recipients (502 to Executive
Board Members and IFAD staff and 1,485 to non-IFAD recipients). The total
response rate was 62 per cent and the complete return rate 53 per cent.
62. The survey was designed to seek feedback on: (i) the roles of ICOs and their
relative importance; (ii) various dimensions of the performance of ICOs (e.g.,
government liaison, programmatic areas; non-programmatic areas); (iii)
collaboration with governments, project managers, Rome-based UN agencies, the
local donor community and civil society; and (iv) management, delegation,
accountability, financial management, human resources and IT issues (Annex V).
63. Key informant interviews in IFAD. Semi-structured interviews were a major
source of information for the evaluation team. A wide range of people were
interviewed at headquarters, including selected members of the Evaluation
Committee and the Executive Board, Senior Management and key staff in PMD and
other departments dealing with administrative matters, budget/finance, human
resources, ICT, corporate support services and internal audit. Some were one-on-
one and some were group interviews. Feedback collected through interviews was
treated as confidential.
64. Regional workshops. Time and resource availability for the CLE limited the
number of country visits. However, to ensure credibility of the evaluation’s analysis,
IOE developed a methodology to gather input from in-country stakeholders, in
particular to capture feedback from IFAD clients such as government officials,
project staff and other development partners. Four regional consultation workshops
were held between May and July 2016: at headquarters for NEN, in Lima in for
LAC, in Nairobi with representatives from both ESA and WCA, and in Hanoi for APR.
The regional consultations also allowed IOE to assess the functioning of the only
IFAD regional office (Nairobi) and of the sub-regional hubs in Peru and Viet Nam.
65. Their main purpose was to obtain feedback and insights of stakeholders on IFAD’s
decentralization approaches. The workshops provided opportunities for: (i)
interactive dialogue to identify strengths and weaknesses of the decentralization;
and (ii) deepening the information base for the evaluation. In addition to plenary
sessions, participants were divided into separate groups to provide feedback on
particular issues: (i) government officials and national project manager: benefits
and limitations of having a country office from the governments’ point of view; (ii)
IFAD staff (from the headquarters and country offices): benefits and limitations of
current decentralization of administrative, finance and human resource
responsibilities and actions. In addition, iterative discussion adopting the “World
Café” modality focused on advantages and disadvantages of different country
presence configurations (see Annex IV, Tables 32-36).25
66. Selected ICO case studies. IOE prepared ICO case studies in countries with
different models of ICOs to identify good practices and lessons learned in IFAD’s
decentralization. The criteria used to select the ICOs for case studies included: (i)
type of ICO; (ii) geographic balance; (iii) ease of logistics and combining the ICO
case studies with the regional consultation workshops; and (iv) linkage with
ongoing evaluations.26 Based on these criteria, the 13 ICO case studies were
25
World Café is a technique to organize small-group debates on a given theme and allows all participants to discuss a set of themes and validate the deliberations by moving from one discussion table to another. 26
To extend the reach of the evaluation and to reduce costs four ICO case studies (i.e., Egypt, Nicaragua, DR Congo and India) were undertaken in conjunction with other 2016 evaluations.
Appendix EB 2016/119/R.10
19
undertaken, four in APR (Vietnam; Philippines; India; China), two in ESA (Kenya;
Tanzania), three in LAC (Peru; Ecuador; Nicaragua), two in NEN (Egypt; Georgia)
and 2 in WCA (Burkina Faso; Democratic Republic of the Congo). The ICO case
study concept note set out three main objectives: (i) examine IFAD's country
representation, division of work and related topics to identify good practices and
improvement opportunities from the different approaches of IFAD's decentralization
models; (ii) assess country representation results through an analysis of the
effectiveness and efficiency of IFAD's country representation; and (iii) provide an
opportunity for reflection and knowledge sharing of key issues, areas for
improvement and good practices of IFAD's decentralization strategy.
67. Drawing on past evaluations and readily available documentation IOE briefly
examined the experience of and lessons from selected comparator
institutions to identify key lessons of relevance to IFAD. The CLE studied the
following organizations: AfDB, ADB, EBRD, the Inter-American Development Bank
(IADB), the World Bank Group (including the specific case of the International
Finance Corporation, IFC), the European Investment Bank, and the Rome based UN
agencies (FAO and WFP, see working paper on Decentralization in Multilateral
Development Banks and Rome Based UN Agencies).
D. Evaluation process
68. Timeline and phases. The evaluation was carried out in record time. The
Evaluation Committee considered the approach paper in March 2016 and the
evaluation was completed in 2016. After consideration by the Evaluation
Committee in November the final report was presented to the 119th session of the
Executive Board in December 2016. This tight timeline was driven by the need to
have the report ready in time to inform Management’s planned corporate
decentralization plan, which will document IFAD’s overall approach and future
actions related to the Fund’s decentralization in the medium term that will be
presented to the Executive Board in December 2016.
69. The CLE of IFAD’s Decentralization Experience was undertaken in eight phases: (i)
evaluation design; (ii) desk review of documents and analysis of data; (iii) data
and information collection; (iv) analytical phase; (v) sharing of emerging findings
with Management through PowerPoint presentations; (vi) preparation of draft final
report and comments by IFAD management; (vii) finalization of CLE report and
preparation of IFAD Management response; and (viii) dissemination of results.
These phases were iterative and partially overlapping.
70. Deliverables, review process and feedback. The main deliverables of the CLE
included the approach paper27, the final evaluation report and a Profile and
Insight.28 IOE received comments on the approach paper and draft final report
from a senior independent adviser, Richard Manning, former Chair of the
Development Assistance Committee of the Organisation for Economic Co-operation
and Development and from the Independent Evaluation Department of EBRD. IFAD
Management was invited to provide written comments on the draft approach paper
and draft final report. The Evaluation Committee also reviewed the draft approach
paper, and their comments were duly considered in the design and implementation
of the evaluation. IOE prepared an "audit trail" that transparently illustrated how
IFAD Management comments were treated in the final report. Several working
papers were produced in the course of the evaluation on different topics, which are
available on request. Two further key deliverables were the written IFAD
Management response and report of the senior independent adviser on the quality
27
EC 2016/91/W.P.3 28
Profiles and Insights are two key IOE communication products, produced at the end of the evaluation once the report has been finalized. Both are two-page brochures of about 500-700 words. The Profile will contain a summary of the main evaluation findings and recommendations. The Insight will focus on one topic of key interest (e.g. delegation of authority to ICOs, role of subregional offices/hubs) emerging from the evaluation, with the aim of stimulating further debate and reflection among partners concerned.

Appendix EB 2016/119/R.10
20
of the final evaluation report. Both deliverables are included in the published final
CLE report.
71. Given the formative aspects of the evaluation, added attention was devoted to
organizing consultations with IFAD Management and staff at key stages of the
evaluation. The aim of such interactions was to exchange thoughts and discuss
selected emerging evaluation issues to ensure wider learning and timely feedback
from independent evaluation to IFAD’s work in decentralization.
72. Constraints and limitations to the evaluation. First, the evaluation had to be
conducted under an extremely tight time schedule. It was essential that the
preliminary findings be available to inform Management’s drafting of IFAD’s
corporate decentralization plan and the Executive Board’s consideration of that
document. Second, many ICOs were established relatively recently. Thus, limited
time has passed for the full impact of ICOs to be reflected in quantitative
performance indicators. The evaluation team undertook quantitative analysis of
self-evaluation and independent evaluation ratings and other IFAD databases and
of the E-survey. It also undertook qualitative analysis of data and information from
interviews, case studies and regional workshops to complement and compare with
findings from quantitative analysis. Third, the performance of IFAD-funded portfolio
and country programmes is impacted by many factors beyond country presence
and the work of ICOs as further explained in the Effectiveness Chapter. Fourth,
IFAD’s financial systems do not provide a comprehensive picture of ICO costs:
data are fragmented and not easily available. The CLE had to integrate data from
different sources.
73. IOE compensated for these limitations by triangulating a large amount of
evaluation evidence and multiple methods and sources in order to reach its
conclusions. In addition, this CLE built upon a corpus of evaluation experience and
knowledge accumulated by IOE in the past years through project-level, country
programme and corporate evaluations.
Key points
The overarching objectives of the CLE were to assess: (i) IFAD’s decentralization
experience and efforts; (ii) the contribution of decentralization to better operational performance and development results; (iii) the costs of the decentralization process in relation to the results achieved; and (iv) generate findings and recommendations to further strengthen IFAD’s organizational decentralization.
The evaluation assessed the relevance, effectiveness and efficiency of the decentralization process.
The evaluation used mixed methods and collect both quantitative and qualitative
information and data from a range of sources (e.g., document reviews; semi-structured interviews of key informants; regional/country consultations; quantitative analysis of data available in various IFAD information systems; analysis of relevant evaluations; electronic surveys of stakeholders and ICO case studies).
Given the formative aspects of the evaluation, added attention was devoted to organizing consultations with IFAD Management and staff at key stages of the
evaluation to provide preliminary feedback.
Appendix EB 2016/119/R.10
21
III. Relevance of IFAD’s decentralization
A. The objectives and design of the strategy for country
presence
The objectives
74. The overall objectives for decentralization have not markedly changed
since 2007 and have remained fully valid. The Sixth Replenishment
Consultation emphasized enhancing IFAD’s impact and this was subsequently
confirmed as the priority by the Independent External Evaluation of IFAD (2005).
Following that evaluation, IFAD developed an Action Plan for Improving
Development Effectiveness which was approved in 2005. Following the limited
experience of the 2003-07 piloting of country presence in 15 countries and the
evaluation of that pilot, the first Activity Plan for IFAD’s Country Presence29 was
accepted by IFAD’s Executive Board in December 2007. The objectives of country
presence were seen as particularly important for better project design and
supervision, implementation support and increased country-level dialogue and
would “enhance IFAD’s development effectiveness by allowing IFAD to:
(a) Work in-country where it is needed, especially in developing project designs
better matched to the country context and in providing cost-effective
implementation support;
(b) Play a catalytic role at the country level, particularly in relation to policy
dialogue, partnership-building, knowledge management and innovation;
(c) Improve its understanding of the changing conditions of rural poverty;
(d) Align itself more closely with the aid effectiveness agenda in support of
country ownership and leadership, through improved alignment with country
strategies and systems and better donor coordination;
(e) Contribute towards system-wide coherence of the United Nations by actively
participating and contributing to the One United Nations Initiative.”
75. The 2011 IFAD Country Presence Policy and Strategy30 provided a more nuanced
but also looser statement of objectives. The emphasis was on programme
implementation support as IFAD absorbed supervision from UNOPS and other
agencies.31 The terms of reference for Country Offices specified: (i) country
programme development and implementation support; (ii) partnership building;
(iii) policy dialogue; (iii) knowledge management and innovation; and (iv) local
capacity building.
76. IFAD Country Strategy 2014-1532 made no change in the objectives for country
presence. The 2016 April EB Update on IFAD’s country presence33 also made no
change but stated that a corporate decentralization plan would be brought forward
by Management in 2016. The objectives for country presence were fully consistent
with IFAD’s overall objectives but remained objectives for a country presence,
rather than decentralization. Items such as enhancing and projecting IFAD’s image
and resource mobilization were not explicitly articulated as objectives.
29
EB 2007/92/R.47 Activity Plan for IFAD’s Country Presence, November 2007 30
EB 2011/102/R.10/Rev.2 IFAD Country Presence Policy and Strategy 14 September 2011 31
It stated that “IFAD’s country presence will continue to enhance IFAD’s development effectiveness and, to the extent possible, achieve cost efficiency. […] Development effectiveness will be enhanced by: (a) Helping align country strategies and projects with the country context and country plans; (b) Providing cost-effective and timely project supervision and implementation support; (c) Scouting for and helping to disseminate innovative approaches to rural poverty reduction and rural development; (d) Building partnerships and collaborative relationships locally and nationally; and (e) Ensuring more effective engagement with in-country policy dialogue and advocacy; and (f) Improving IFAD’s understanding of the changing conditions of rural poverty and helping to devise effective responses at the national level.” 32
EB 2013/110/R.5/Rev.1 IFAD Country Presence Strategy 2014-15, 31 December 2013 33
EB 2016/117/R.4 Update on IFAD’s Country Presence, 23 March 2016

Appendix EB 2016/119/R.10
22
77. Internal and external perspectives of priorities of ICO functions.
Government staff and IFAD staff tended to assign high priority to all the functions
of ICOs in responses to the E-survey and in interviews of this CLE. However, for
certain functions, a slightly lower proportion of respondents from within IFAD
stated that the functions were of the highest priority than that of respondents
outside IFAD. Figure 2 summarises the findings (see also Table 4, Annex V) in
areas where both IFAD and non-IFAD (mostly Government staff) assigned high
priorities (e.g. aligning IFAD’s assistance with country development priorities;
government relations and partnership building; country strategy and programme
development; identifying and designing good projects, project implementation
support), as well as areas where non-IFAD respondents tended to assign higher
priority compared to IFAD ones (e.g. resource mobilization for IFAD projects,
strengthening IFAD’s grant programme, contributing to national capacity building).
Figure 2 Proportion of E-Survey Assigning High / Very High Priority to selected Functions of IFAD Country Offices
Source: Responses to this CLE E-Survey (2016).
Design of the strategy
78. Up until 2011 the approach to decentralization was evolving and remained
in a formative stage. Although models of ICOs were identified, there was
no formalised trial of different models and there was no evident proving of
alternatives. For the extended pilot phase of country presence, decentralization
was subject to annual review by the Executive Board between 2008 and 2010. A
Policy and Strategy for Country Presence was then approved by the Executive
Board in 2011.34 This Strategy was clear with respect to:
The maximum number of offices to the end of 2013 (40) and the schedule;
The criteria for establishment of country offices, those for posting a CPM to
the office and maximum number of CPMs to be decentralised (20), and those
for office closure, which were the inverse of those for opening an office;
What would be monitored as regards ICO progress, costs and performance;
Resource commitment for ICOs; and
The hosting and servicing of ICOs by other agencies and agreements with
host countries.
79. The Strategy was less clear on: (i) posting of international professionals, other than
CPMs including up to five technical staff; (ii) issues of delegation of authority; (iii)
34
EB 2011/102/R.10/Rev.2 IFAD Country Presence Policy and Strategy 14 September 2011
0% 20% 40% 60% 80% 100%
Contributing to national capacity building
Strengthening IFAD’s grant programme
Resource mobilization and cost-sharing forIFAD projects
Project implementation support
Identifying and designing good projectsfocused on reducing rural poverty
Government relations and partnership building
Aligning IFAD’s assistance with country development priorities
IFAD
Non-IFAD
Appendix EB 2016/119/R.10
23
staff rotation and training; and (iv) the model for sub-regional or hub
configurations and the variations in staffing for such models.
80. Following a review by Management, IFAD Country Presence Strategy 2014-1535
was considered by the Executive Board in 2013. The maximum number of offices
was increased to 50, of which no more than half would be staffed with CPMs. There
was no further move to decentralize administrative and financial services and it was
further emphasised that the location of such services at regional or sub-regional
hub levels did not change their status as part of corporate services. It was purely a
measure to reduce costs and offer timely service. Rotation was specified for CPMs
who would not spend more than two periods of assignment in a country office
before having an assignment at headquarters. An office serving several countries
was designated as a separate country presence model. The Field Support Unit was
established in the Corporate Services Department.
81. Criteria applied in the strategy for opening and closing of offices and for
out-posting of CPMs were fully relevant but did not take adequate account
of factors for decentralizing CPMs with responsibility for more than one
country. Criteria were developed in the 2011 Policy and Strategy and only minor
changes made in the 2014-15 Strategy: (i) size of IFAD’s country portfolio
(assigned weight 50 per cent); (ii) country’s dependence on agriculture measured
as proportion of agriculture value added in total national value added (weight 15
per cent); (iii) size of rural population (weight 10 per cent); (iv) prevalence of
poverty measured as per capita GDP (weight 15 per cent); (v) “state fragility” –
representing weak performance in achieving development outcomes (IDA Resource
Allocation Index - weight 10 per cent); and (vi) existence of an enabling policy
environment (assigned no weight).
82. Criteria for out-posting CPMs were: - (a) large country programmes; (b) need and
opportunity for policy dialogue on rural poverty reduction and smallholder
agricultural development; (c) countries with weak institutions and development
performance and/or involved in or emerging from conflict; (d) potential for building
partnership – leveraging resources; (e) requiring instruments such as knowledge
management and support for a broader range of stakeholders; and (f) country
offices serving multiple countries.
83. The strategy envisaged that CPMs could be decentralized with responsibility for
more than one country but did not build this into criteria for siting of CPMs or ICOs.
Such criteria would examine sub-regions rather than single countries to consider
where ICOs and CPMs could be best placed to serve a group of countries.
84. The responses to the CLE e-questionnaire survey endorsed the priority choices in
siting of ICOs. IFAD staff and Executive Board Members endorsed high priority to
ICOs for countries with large programmes (37 per cent) and ICOs covering
neighbouring countries (38 per cent). Respondents from outside IFAD, mostly
government and project staff, supported size of programme as the main criteria
(44 per cent) but some of them also supported offices in most and all countries (29
per cent; residual percentages were for other options).
35
EB 2013/110/R.5/Rev.1 IFAD Country Presence Strategy 2014-15, 31 December 2013
Appendix EB 2016/119/R.10
24
Assumptions and the use made of prior evaluation findings
85. While objectives for country presence were by and large justified, some
assumptions were not fully valid. One of the early assumptions was that of
relying on a “light touch” approach. This assumption was due to the Executive
Board’s concern for containing costs and, initially at least, some uncertainty from
senior and middle management about a major departure from IFAD’s traditional
business model.
86. As noted in the Corporate-level Evaluation of the Field Presence Pilot Programme
(2007) and of IFAD Efficiency (2013), as well as by several Country Programme
Evaluations, there was a discrepancy between having a “light touch” approach
(e.g., country offices staffed with one or two professionals) and formulating
ambitious goals in certain areas, such as non-lending activities. Moreover, while the
size of IFAD’s country offices cannot be compared with that of other MDBs, at
present it is not entirely correct to consider IFAD’s decentralization as “light”, at
least relative to the size of the Fund. IFAD now has country offices operational in
39 countries covering about 80 percent of its on-going loan volume and CPM-
Country Directors widely decentralized, especially in Africa. As further argued in
this report and as visible in the evolution of the strategy, leeway was given to
regional divisions to experiment different approaches but missing was a systematic
approach to identify country presence models and organizational changes to
enhance effectiveness and efficiency.
87. Another assumption was about costs. Although IFAD’s own internal analysis
showed that decentralization had generally increased costs in MDBs, the 2011
Policy and Strategy opted for cost neutrality, following the preference of the
Executive Board. The costs of country offices, once established, would be contained
as additional posts in country offices would be at lower cost than those in
headquarters. In the 2014-15 strategy it was argued, and figures were presented,
that showed staffing could be increased to absorb the extra workload of project
supervision and a growing programme at lower cost in country offices than the
equivalent increase in headquarters. This assumption would have been correct only
with a clear shift of functions and staff from headquarters, which has only partially
taken place.
88. According to the decentralization strategy documents: all country offices,
irrespective of their configuration (e.g., CPM-led, CPO-led) and their staffing level,
were expected to deliver on the same full range of services (e.g., implementation
support, non-lending activities). This was not realistic, particularly for smaller
offices with only one professional staff member. Moreover, country offices have not
been given a dedicated budget line for non-lending activities.
89. There were several implicit assumptions with respect to staff and staffing which
have not proved fully valid in practice:
The workload of a country office based CPM is similar to that of a
headquarters based CPM;
Service in a country office by a CPM is attractive enough with a country post
allowance to the next grade to attract CPMs to wish to move from
headquarters;
The necessary adjustments to achieve savings by tasking country-based
programme assistants can be attained through regular attrition of
headquarters programme assistants; without significant reorganization of
regional divisions workflows and without major training of country-level staff.
90. Findings and recommendations from previous evaluations have been
utilised in the design and implementation of the decentralization but their
application has been sub-optimal. The Independent External Evaluation of

Appendix EB 2016/119/R.10
25
IFAD36 in 2005 considered it early to make an overall judgement on
decentralization but fully endorsed the principle and considered there was already
adequate evidence to undertake greater decentralization of CPMs. This
recommendation was only slowly taken up.
91. The 2007 CLE of the FPPP37 found that the same had demonstrated the value of
decentralization but had not been fully implemented and there had been
inadequate monitoring of costs and results. The evaluation made a number of
recommendations with respect to monitoring which are discussed further below. It
also found that experience elsewhere indicated that:
Without significant institutional reorganization decentralization had an
incremental cost. IFAD Management did not reject the finding but asserted
that, in view of the need to contain the IFAD administrative regular budget,
IFAD would absorb decentralization costs;38
Sub-regional models had significant cost and efficiency benefits and should be
piloted. Management was not fully convinced of this recommendation which it
feared would introduce an unnecessary layer in the system but the model is
now being actively considered.
92. Recommendations with respect to monitoring and increased delegation of authority
were not rejected by Management but have not been fully implemented either.
93. IFAD’s decentralization was fully relevant in the light of the experience
and benefits gained in other agencies but the experience of those agencies
could have been drawn on more systematically. When IFAD was established,
other MDBs and UN agencies had an established country presence. Moving on from
a liaison function, the main objectives of decentralization for these organizations
rapidly became to improve project implementation and to establish closer relations
with in-country stakeholders.39
94. In terms of lending volume and number of staff, the MDBs are much larger, and
have a more complex management structure, are involved in many sectors, have a
wider range of products and experience more challenges with matrix
management.40 Similarly, the purposes and business models of FAO and WFP differ
from that of IFAD. IFAD’s work is often more concentrated in disadvantaged parts
of countries, although this is not always the case and some agencies, such as WFP,
work predominantly with the extremely disadvantaged. Each MDB and UN agency
is unique and has a different organizational culture and corporate objectives. With
all these caveats, the experience of other agencies in establishing and operating
resident missions provides some useful lessons for IFAD. For example:
i. Decentralized offices gradually become part of the way the organization does
its business and the questions of changes in organizational structure become
less about decentralization per se and more about continuing functional
analysis and overall organizational modernization and change.
36
Independent External Evaluation of IFAD, September 2005, IFAD Office of Evaluation. 37
EB 2007/91/R.6 Corporate-level evaluation of the Field Presence Pilot Programme, 14 August 2007 38
The 2007 Activity Plan stated with respect to the Programme Management Department (PMD) “The issue is one of where to locate staff rather than whether to add staff. Since the benefits of in-country compared to Rome posting are higher and the costs lower, the rational decision is to maximize country presence. The constraint to having an even larger percentage of IFAD staff in country offices is IFAD’s capacity to manage a decentralized work force”. 39
Although the proportion of IFAD’s total staff assigned to ICOs increased substantially from one percent in 2002 to 13 per cent in mid-2016, the corresponding ratios for MDBs and other Rome based agencies range from 25 to over 50 percent for MDBs and up to 92 per cent for WFP. World Bank 40%; AfDB 50%; ADB 25%; EBRD 27%; IADB 33%. 40
There are management and organizational issues that have been associated with increasing numbers, roles and responsibilities of country offices: (i) reporting lines, delegation of authority and systems of accountability; human resource policies, budget management and information technology and communications technology; (ii) moving international staff to field offices and recruiting more local staff can increase costs; (iii) dispersing sector specialists risks undermining cross-institution knowledge sharing; and (iv) silos can emerge when staff are in many different locations.
Appendix EB 2016/119/R.10
26
ii. Nearly all global UN agencies have regional offices and some such as FAO have
sub-regional. Management systems, the amount of delegation and control and
human resource policies vary across the organizations and, if sub-regional
offices are used, care is needed to ensure that they do not become another
bureaucratic layer without adding value.
iii. Decentralization has often been achieved through major organizational change
and this has required carefully researched and implemented change
management programmes. Corporate leadership has been needed and human
resource and management issues have been identified and addressed (e.g.,
incentives for people to move, delegation of authority, changes in reporting
lines, oversight and risk management systems, communications technology).
Issues have often concerned transition management for staff, matrix reporting
and ensuring both vertical and horizontal communication and knowledge
sharing.
iv. Some of the comparators have moved back-office services to low-cost
locations.
v. Decentralization and the establishment of country offices has not necessarily
been cost neutral. Typically additional costs have been incurred for staff and
offices and some organizations, especially in the UN system and IFC, have
downsized headquarters (and/or the functions in headquarters) as the field
presence grew. Both in the UN and MDBs there have often been budgetary
provisions agreed by the governing bodies for staff redeployment and
redundancy packages.
95. Evaluations in the MDBs and UN agencies have confirmed the benefits of country
offices and movements toward decentralization, notably in terms of stronger client
relations, deeper country knowledge, better country programming, better project
design and supervision, improved portfolio quality, faster implementation and
procurement, enhanced policy dialogue, analytical work and advisory services and
stronger in-country partnerships. 41
96. Compared with these organizations, IFAD can be considered to have decentralized
fast. There was a large body of experience to draw upon and the documentation
presented to the Executive Board suggests that this was not fully utilised. Initially,
for instance, there was limited attention to broader organizational changes,
including at the headquarters.
97. By 2013 IFAD could have made a more structured functional analysis of
what is best done in headquarters and what is best done at country or close to
country-level. Such an analysis could well have led to more conscious reform at
headquarters level, including options to reduce staff, as well as in the country
offices. It could also have meant that more concrete measures were taken to
capacitate the decentralized level for the functions, thus identified.
98. In sum, the overall objectives and evolving design of the strategy for
country presence were valid and the functions of the ICOs relevant but
there were significant areas for improvement. Some key assumptions were
not fully valid. Importantly, the strategies envisaged a greater number of CPMs in
the country offices but did not foresee any significant adjustment in the respective
roles of headquarters and the country offices. Lessons from IFAD’s own experience
41
Some weaknesses have been noted in country offices being actively involved in corporate knowledge management and sharing experience and innovation at the country level. See: Evaluation of FAO’s Decentralization, PC 92/6a) – FC 108/18 September 2004; Report of the Independent External Evaluation of FAO, September 2007, C2007/7A.1-Rev.1; An Evaluation of the World Bank’s Organizational Effectiveness – The Matrix System at Work, Independent Evaluation Group – World Bank April 2012; How WFP Country Offices adapt to change: A Strategic Evaluation - Report number: OE/2012/001 December 2011; Review of Management and Administration in the World Food Programme (WFP) JIU/REP/2009/7; Evaluation of the Results of the IDB Realignment, OVE-IDB, March 2014; Independent Evaluation of the Decentralization Strategy and Process at the African Development Bank Oct 2009. EBRD (2016), EBRD’s Experience with Resident Offices.

Appendix EB 2016/119/R.10
27
and from other agencies was not always drawn systematically. Considering that the
relevance of the objectives was high but there were gaps in the strategy design, a
score of moderately satisfactory is accorded to objectives and design.
B. Internal enabling context, governance and monitoring of the strategy for decentralization
Internal IFAD context and institutional commitment to decentralization
99. IFAD has evolved, taking on a steadily growing and widening range of
both lending and non-lending functions within its organizational mandate.
IFAD’s Strategic Plans and Replenishment documents have given steadily more
prominence to IFAD’s role in policy dialogue; partnership and analysing and
disseminating actionable knowledge from its development work. IFAD’s Strategic
Plan 2016-2025, identifies three outcomes of IFAD’s work:
Enabling policy and regulatory frameworks at national and international
levels;
Increased levels of investment in the rural sector; and
Improved country-level capacity for rural policy and programme
development, implementation and evaluation.
100. In the Strategic Plan, the Pillars of IFAD’s Results Delivery include knowledge
building, dissemination and policy engagement. The principles of engagement
include innovation, learning, scaling-up and partnerships. All of these principles of
engagement are difficult to apply in the absence of frequent in-country contact and
relationships established with national actors, facilitated by country presence.
Several of the areas in which IFAD identifies its particular strengths (e.g., value
chain development for the rural poor, rural finance, rural collective organization)
require intimate specific in-country knowledge if they are to be operationalised by
IFAD or other actors in IFAD’s role as a knowledge broker. Although principles may
be common across countries, their application varies greatly, even within countries,
with levels of development and education, culture, existing institutions,
infrastructure, market access and the agro-ecology.
101. Some major donors have been very conscious of costs and concerned with
fiduciary controls, as well as the applicability of decentralization to a Fund
with a small staff. Nevertheless, the Executive Board has approved each
step in the country presence strategy with a cautious approach. Although
IFAD Executive Board and Replenishments have emphasised ongoing reform for
increased effectiveness, it is evident from the minutes of the Executive Board that
there has been a lack of uniformity of views on the desirability of decentralization.
This was also noted in the CLE of the FPPP in 2007 and has been linked to concerns
about the relative size of IFAD’s regular budget (to the programme size), which has
led to zero growth budgets, including under the current replenishment.42 For
example DFID’s Multilateral Aid Review of IFAD (February 2011) found financial
resources management to be weak in IFAD and disbursements low in comparison
with other agencies. After the funding authorised by the Executive Board for the
country presence pilot, there has been an emphasis on absorbing the costs of
country presence and no additional finance for country presence was approved
until 2016 when an IFAD Regular Budget increase of US$ 2 million was agreed of
which US$1.1million can be attributed to ICOs.
42
As a percentage of the commitments, the administrative efficiency ratio for 2016 is expected to be 15.1 per cent, compared with the equivalent ratio for the first year of IFAD 9 (i.e. 2013) of 14.3 percent. EB 2015/116/R.2 IFAD’s 2016 results-based programme of work and regular and capital budgets, the IOE results-based work programme and budget for 2016 and indicative plan for 2017-2018, and the HIPC and PBAS progress reports, 25 November 2015.

Appendix EB 2016/119/R.10
28
102. Initially, staff and middle-level management commitment to
decentralization was not clear, but it has improved in the recent years.
There has been a natural reluctance of staff long located in Rome to move or see
their roles reduced and it was reported to the evaluation in interviews that, initially,
regional division directors resisted a reduction in their direct control but more
recently, they and professional staff have embraced decentralization, especially in
Africa. At the same time, although strategic work-force planning has considered
decentralization, there has been reluctance by management to force through re-
balancing in staffing or re-examine the overall organizational model (see also the
Efficiency Chapter).
Governance
103. The Executive Board (EB) has been apprised and has taken all major
decisions with respect to country presence but lacked an adequate base
for decision making. Country presence has with very few exceptions been
considered at least once a year by the EB and the level of detail at which the EB
has entered into which country offices to open and CPMs to decentralise would in
many agencies be regarded as micro-management. This being said, in the absence
of an adequate monitoring and reporting system, as discussed below, the Executive
Board did not have a robust basis for decision making, particularly as there was no
tracking of how well country offices conformed to the criteria, the inadequacy of
criteria for offices covering more than one country and a paucity of cost-data.
104. Internally, the Corporate Decentralization Coordination Group is
responsible for coordinating the planning, implementation and monitoring
of IFAD’s country presence. It now meets regularly but did not so in the
past. The Group is co-chaired by the Associate Vice-President, Programmes; and
the Associate Vice-President, Corporate Services Department (CSD). It now meets
regularly but for several years prior to 2013 it did not and PMD drove
decentralization without adequate corporate oversight. This having been said, the
approaches of the PMD Regional Divisions have diverged considerably and the
extent of mutual lesson-learning has been limited.
Monitoring
105. The Monitoring indicators for IFAD country offices were inadequately
defined and do not include cost or efficiency indicators. Indicators were
defined in the IFAD Country Presence Policy and Strategy43 approved by the
Executive Board in 2011 (see Annex VI Table 2), which stated that each country
office is responsible for providing reports on progress towards targets and
monitoring indicators. Indicators are in seven categories, which are in line with ICO
tasks. Management agreed with the recommendations of the CLE of the FPPP in
2007 to include cost indicators but these were only very partially tracked or
reported as the necessary adjustments which management had agreed to make in
accounting system codes did not take place.44
106. Indicators currently cover: (i) outreach and scaling up, (ii) country programme
development, (iii) project implementation, (iv) partnership building, (v) policy
dialogue, (vi) knowledge management and innovation; and (vii) country office
management. The framework, as introduced, had 25 indicators and six sub
indicators (subsequently reduced to 23 indicators and five sub-indicators). The
number of indicators is large and unwieldy. Many indicators include no target so a
trend can be tracked but not progress towards a target. Many of the indicators
could be improved but seven are either inappropriate to what it is intended to
measure and/or not adequately defined (See Table 2) below. For example all the
indicators of input to COSOP, project design and supervision ask for the percentage
of missions in which ICO staff participated without in any way defining what would
43
EB 2011/102/R.10/Rev.2 IFAD Country Presence Policy and Strategy 14 September 2011 44
Partial Budget Costs were reported for the period 2008-11
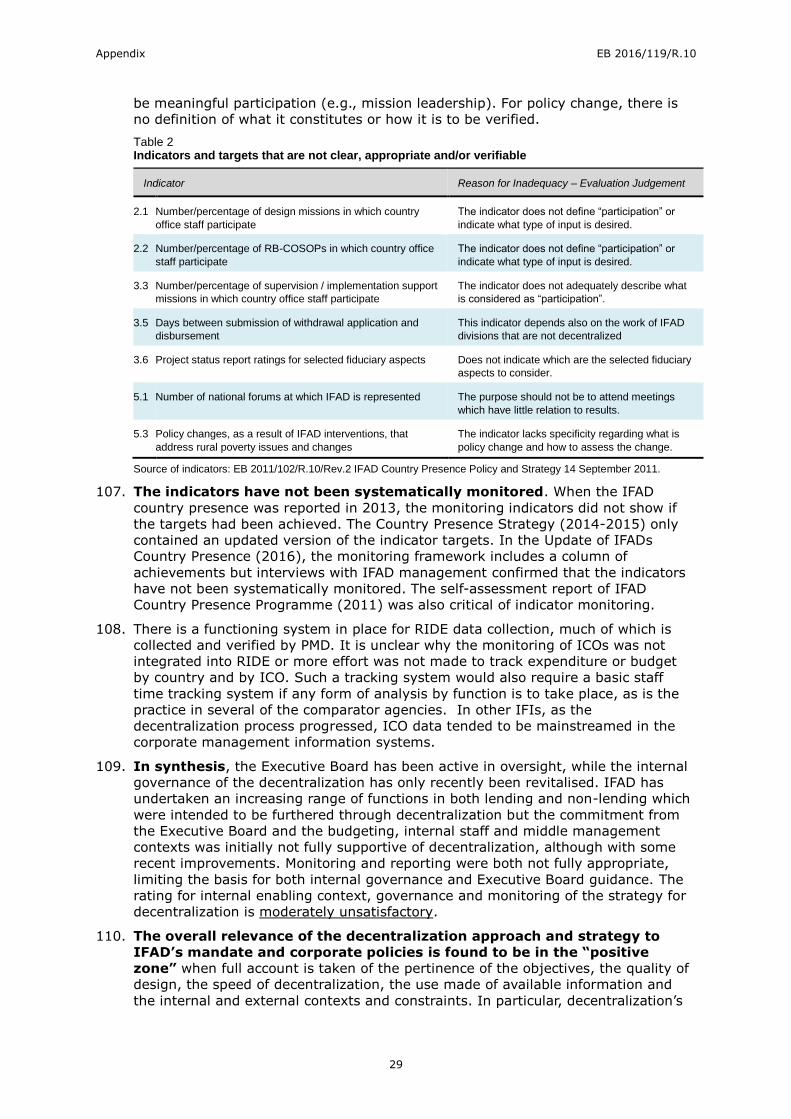
Appendix EB 2016/119/R.10
29
be meaningful participation (e.g., mission leadership). For policy change, there is
no definition of what it constitutes or how it is to be verified.
Table 2 Indicators and targets that are not clear, appropriate and/or verifiable
Indicator Reason for Inadequacy – Evaluation Judgement
2.1 Number/percentage of design missions in which country
office staff participate
The indicator does not define “participation” or
indicate what type of input is desired.
2.2 Number/percentage of RB-COSOPs in which country office
staff participate
The indicator does not define “participation” or
indicate what type of input is desired.
3.3 Number/percentage of supervision / implementation support
missions in which country office staff participate
The indicator does not adequately describe what
is considered as “participation”.
3.5 Days between submission of withdrawal application and
disbursement
This indicator depends also on the work of IFAD
divisions that are not decentralized
3.6 Project status report ratings for selected fiduciary aspects Does not indicate which are the selected fiduciary
aspects to consider.
5.1 Number of national forums at which IFAD is represented The purpose should not be to attend meetings
which have little relation to results.
5.3 Policy changes, as a result of IFAD interventions, that
address rural poverty issues and changes
The indicator lacks specificity regarding what is
policy change and how to assess the change.
Source of indicators: EB 2011/102/R.10/Rev.2 IFAD Country Presence Policy and Strategy 14 September 2011.
107. The indicators have not been systematically monitored. When the IFAD
country presence was reported in 2013, the monitoring indicators did not show if
the targets had been achieved. The Country Presence Strategy (2014-2015) only
contained an updated version of the indicator targets. In the Update of IFADs
Country Presence (2016), the monitoring framework includes a column of
achievements but interviews with IFAD management confirmed that the indicators
have not been systematically monitored. The self-assessment report of IFAD
Country Presence Programme (2011) was also critical of indicator monitoring.
108. There is a functioning system in place for RIDE data collection, much of which is
collected and verified by PMD. It is unclear why the monitoring of ICOs was not
integrated into RIDE or more effort was not made to track expenditure or budget
by country and by ICO. Such a tracking system would also require a basic staff
time tracking system if any form of analysis by function is to take place, as is the
practice in several of the comparator agencies. In other IFIs, as the
decentralization process progressed, ICO data tended to be mainstreamed in the
corporate management information systems.
109. In synthesis, the Executive Board has been active in oversight, while the internal
governance of the decentralization has only recently been revitalised. IFAD has
undertaken an increasing range of functions in both lending and non-lending which
were intended to be furthered through decentralization but the commitment from
the Executive Board and the budgeting, internal staff and middle management
contexts was initially not fully supportive of decentralization, although with some
recent improvements. Monitoring and reporting were both not fully appropriate,
limiting the basis for both internal governance and Executive Board guidance. The
rating for internal enabling context, governance and monitoring of the strategy for
decentralization is moderately unsatisfactory.
110. The overall relevance of the decentralization approach and strategy to
IFAD’s mandate and corporate policies is found to be in the “positive
zone” when full account is taken of the pertinence of the objectives, the quality of
design, the speed of decentralization, the use made of available information and
the internal and external contexts and constraints. In particular, decentralization’s

Appendix EB 2016/119/R.10
30
efforts were pertinent to enhance IFAD’s development results. Some assumptions
were not fully valid, such as on cost and “light touch” approach. The
decentralization process was only in part informed by IFAD’s own experience as
well as those of other organizations. Monitoring and governance had significant
gaps. Restructuring of the headquarters based on functional analysis should have
been part of the decentralization strategy but was not emphasised. Overall it can
be argued that the move towards decentralization was appropriate but an
approach better based on structured functional analysis could have
emerged earlier. The rating for relevance is thus moderately satisfactory.
Key points
IFAD’s overall objectives and the design of the strategy were valid. An increasing
range of functions in both lending and non-lending came to be furthered through
decentralization, and decentralization has proceeded relatively quickly.
However, some of the initial assumptions (e.g. cost neutrality, “light touch”) were not
fully valid. Findings and recommendations from previous evaluations have been only
in part utilised and decentralization could have proceeded faster if they had been used
fully and if the experience of other organizations had been systematically applied.
Significant adjustment in the respective overall roles of headquarters and the country
offices was not foreseen and by 2013 IFAD could have made a more structured
functional analysis of what is best done in headquarters and at country level.
Monitoring and governance of the decentralization were inadequate. The Executive
Board approved each step of the decentralization and has been active in oversight,
but:
- Monitoring was not fully appropriate and poorly reported, limiting the basis for
Executive Board and internal management governance
- The budgeting, internal staff and middle management contexts were not fully
supportive of decentralization
- Internal governance of the decentralization has only recently been revitalised.
Ratings by evaluation criteria and sub-criteria. Relevance
Evaluation criteria
Evaluation sub-criteria Rating
Relevance I.A Relevance of objectives and design moderately satisfactory (4)
I.B Internal Enabling Context (Governance and Monitoring) moderately unsatisfactory (3)
Overall rating for Relevance moderately satisfactory (4)

Appendix EB 2016/119/R.10
31
IV. Effectiveness of IFAD's decentralization 111. The overarching evaluation questions for effectiveness was assessing the extent
that IFAD’s decentralization contributed to helping IFAD deliver better on: (A)
operational performance (strategy and programme management; non-lending
activities; project performance); and (B) development results (impact, gender
equality, natural resource management and climate change, sustainability, pro-poor
innovation and scaling up). In assessing effectiveness, the evaluation was guided
by the more detailed evaluation questions in the evaluation framework (Annex I).
A. Contributing to improved operational performance
A.1.a Contributions to strategy and programme management and
project performance
112. Results-based Country Strategic Opportunities Programmes (COSOPs) embody
IFAD’s strategy in a country towards the goal of poverty reduction and rural
development. Evidence suggests that the establishment of ICOs contributed
to better design and performance of COSOPs. For instance, the analysis of
Country Programme Evaluations (CPEs) and their ratings, shows that the presence
of ICOs is associated with COSOPs that are more relevant (e.g., better responding
to country priorities and local needs) and also performing better in terms of
delivering results (this aspect is discussed later in this Chapter). More qualitative
observations came from the regional workshops (Annex IV Tables 33-36) and
interviews with IFAD’s development partners highlighting that country presence
had increased IFAD’s staff exposure to and understanding of Government priorities,
policies, norms local practices as well as operational constraints. This emerged
particularly at the time of strategy and project design. Average ratings of COSOP
relevance, effectiveness and overall performance are in the moderately satisfactory
range and the rating for countries with ICOs45 was significantly higher than for
those without.*** 46 (see Table 10 in Annex IV). This was corroborated by
interviews with key national partners as well as by responses obtained through the
CLE E-survey. In fact 81 per cent of respondents agreed/strongly agreed that ICOs
promoted national ownership and direction of IFAD’s development assistance and
better alignment of IFAD’s assistance with national priorities (see Table 7 and 8,
Annex V).
113. ICOs have helped identify and design projects focused on reducing rural
poverty. This was the perception and experience of national stakeholders
conveyed during regional workshops and interviews. Also, the large majority of the
E-survey respondents agreed/strongly agreed and rated this dimension as
satisfactory (Table 7, Annex V).47 This was one of the dimensions of ICO
performance that received the highest share of satisfactory/highly satisfactory
ratings and this positive view of the contributions of ICOs was widely held by all
types of respondents.48
114. Despite this positive feedback, this CLE noted that project designs in countries with
ICOs do not receive higher quality at entrance (QA) ratings than those in countries
45
Countries with ICOs included those in which ICOs were operational for at least four years before the CPE was completed. 46
The following labels describe the significance of the difference of means tested: (i) strongly significant if the P value was less than or equal to 0.01 (***); (ii) moderately significant if the P value was greater than 0.01 and less than or equal to 0.05 (**); (iii) weakly significant if the P value was greater than 0.05 and less than or equal to 0.10 (*); (iv) not significant if the P value was greater than 0.10. In inferential statistics, the p-value is understood as the probability of obtaining a result equal to or higher /lower (depending on the type of test) than what was actually observed, when a “null hypothesis is true”. In this CLE, the null hypothesis is that differences between “with” and “without” ICO observations are equal to zero. If the p-value is lower than a certain cut-off point (say 0.1, 0.05, 0.01) then the finding is not consistent with the null hypothesis which is rejected in favour of the hypothesis that there is in fact a difference between “with” and “without ICO” averages. See Lovric, M. (2011) International Encyclopedia of Statistical Science, Springer-Verlag, Berlin. 47
76 per cent of the respondents assigned satisfactory/highly satisfactory ratings. 48
The others were aligning IFAD’s activities with national priorities (76 per cent) and supporting project implementation (77 per cent).
Appendix EB 2016/119/R.10
32
without. The average rating for all projects was in the satisfactory range and the
difference was not statistically significant. This is not surprising: IFAD’s quality
standards are the same for all projects, regardless of whether or not an ICO is
involved. If the quality assessment rating is not acceptable the project will not be
submitted to the Executive Board. This institutional incentive is likely to reduce
rating differences between with and without ICOs.
115. While rated positively, ICOs are reported to be less strong at
strengthening IFAD’s grant programme. Feedback provided during interviews
indicated that in some countries IFAD’s grants were weakly coordinated with the
country strategy and programme. The 2014 CLE on the grant programme also
found weaknesses in the linkage between grants and country programmes and
limited integration of grants into COSOPs. The CLE recommended that country
specific grants receive a larger allocation of resources relative to global regional
grants but this recommendation was not followed up.49 E-survey respondents rated
ICO performance in this area on the border between the moderately satisfactory
and satisfactory ranges – 56 per cent assigned a satisfactory/highly satisfactory
rating, one of the lowest rated performances among the 15 ICO performance
categories.50
116. In sum, ICOs help to better align IFAD’s country strategy and programme with local
needs and priorities, by enhancing IFAD’s knowledge about the local development
context and the government’s policies and priorities, and to identify and design
projects focused on rural poverty. This is a clear strength of IFAD’s country
presence. The contribution of decentralization to improving the quality of COSOPs
and the project identification and design is rated as satisfactory.
A.1.b Contribution to project supervision and implementation support
117. IFAD and all MDBs recognise that effective project supervision and implementation
support are essential for project success and for achieving good development
outcomes. It is widely recognised that having staff in the field enhances project
supervision and implementation support.51 When MDBs initially set up their country
offices, the main tasks were portfolio management, project supervision and
supporting project implementation.
118. The change in IFAD’s operational model by combining direct supervision
with country presence was a transformative organizational change. Direct
supervision and developing a country presence are closely linked. Direct
supervision had a major impact on the work of CPMs, and set in motion a gradual
shift of some of the IFAD’s work from headquarters to the field. Providing
implementation support covers a wide range of activities (e.g., development;
technical; financial; administrative). Many IFAD staff members recalled that the
2007 introduction of direct supervision as the standard modality at IFAD was one of
the factors that helped further the country presence agenda. There is evidence
through past evaluations and CLE interviews that ICOs help better prepare
supervision mission, particularly by coordinating with national partners and more
accurately focusing on key project performance issues.
119. Arguably, one of the most important contributions of ICOs has been to
project implementation support. There was strong consensus on this in regional
workshops (Tables 33-36, Annex IV) and country case studies. Relative to
49
The ceiling of resources allocated for grants is currently set at 6.5 per cent of IFAD’s annual programme of loans and grants, of which 5 per cent for global/regional grants and only 1.5 per cent for country-specific grants. 50
While 66 per cent of non-IFAD respondents rated the performance of ICOs in strengthening IFAD’s grant programme as satisfactory/highly satisfactory the corresponding figure for IFAD staff was 40 per cent -- 26 per cent of IFAD staff rated the performance of ICOs below moderately satisfactory in this area. 51
AfDB. Independent Evaluation of the Decentralisation Strategy and Process at the African Development Bank. 2009. ADB. Resident Mission Policy and Related Operations: Delivering Services to Clients. 2007. ADB: Decentralization: Progress and Operational Performance. 2013.

Appendix EB 2016/119/R.10
33
headquarters, ICOs have comparative advantages and assure better continuity and
follow-up: easier communication with counterpart ministries, more frequent follow-
up. Even well designed and well managed projects are bound to face some
blockages during implementation, due to complicated administrative and
bureaucratic procedures and interpretation of rules and requirements. The
presence of IFAD staff in the country who can frequently interact with stakeholders,
in the local language when needed, avoids cumbersome and protracted
correspondence with the headquarters, which can cause delays of weeks or
months. Some ICOs put on training courses for various topics related to project
supervision and implementation support (e.g., M&E, financial management,
procurement) to build project management capacity. Of course, the quality of
results achieved depends on ICO staff experience, personality, commitment and
standards.
120. E-survey respondents rated ICO performance as satisfactory in terms of supporting
project implementation – 77 per cent assigned a satisfactory/highly satisfactory
rating (one of the top ratings among 15 ICO performance dimensions) categories.52
They also agreed that ICOs performed satisfactorily in identifying and resolving
problems53 and in making decisions in a timely manner (Tables 7 and 8, Annex V).
Overall, the feedback from survey, interviews and case studies was that country
presence helped improve IFAD’s overall institutional performance.
121. There was consistent feedback that ICOs were under-resourced relative to
their assigned responsibilities. This view was most strongly held by clients in
countries with ICOs and by IFAD staff, both headquarters and ICO based and
concerned financial resources, staffing and expertise available. This aspect is
discussed more in detail in the Efficiency Chapter.
122. While evidence is robust through triangulation between difference sources on the
ICO contribution to quality of supervision and implementation support, evidence
from internal portfolio indicators is more mixed as explained below.
123. Country presence contributed to shortening the time from project approval to entry
into force. When countries with and without ICOs were compared, on average 69
fewer days were required for projects to enter into force in countries with ICOs, a
difference that was strongly significant.54 The same pattern held when projects
were compared before and after ICOs were established.55 CPM-led ICOs performed
better than CPO led ICOs in accelerating projects entering into force. About 105
fewer days were required for projects to enter into force in countries with CPM-led
ICOs than in countries with CPO-led ICOs (see tables 21-22 in Annex IV).
124. No clear evidence that ICOs contributed to reduce time to process withdrawal
applications. It is important to note that processing withdrawal applications was
largely the responsibility of CFS (now moved to ACD) not of ICOs.56 Because of
procedural improvement, during the past few years there has been a marked
reduction in the time required to process withdrawal applications across the board.
Since January 2012, the formal involvement of CPMs/PMD has been limited to
52
The other ratings in this top cluster were for aligning IFAD’s assistance with country priorities and identifying and designing good projects focused on rural poverty. 53
67 per cent of respondents rated the ICOs’ performance in identifying and resolving problems as satisfactory/ highly satisfactory. 61 per cent of respondents rated the ICOs’ performance in making decisions in a timely manner as satisfactory or highly satisfactory. 54
On average it took 288 days for projects to enter into force. 55
The period between approval and entry into force was shorter** by 73 days after ICOs became operational. 56
In mid-2016, CFS was divided into two divisions: Financial Management (FMD) and Loan Administration and Disbursement (ACD) respectively. ACD is responsible for maintaining IFAD's accounts (including ICO ledgers) whilst also processing the Fund’s administrative and operational expenses, including those for IFAD Country Offices; and for loan and grant administration, inclusive of disbursements. Until April 2016, certification by CPM was required for all types of withdrawal applications. At present, ACD reviews withdrawal applications ex ante in headquarters and finance officers and financial management consultants during missions review the documentation ex post. The withdrawal application is reviewed by an assistant and then by a financial officer before it is sent to the Treasury Services Division for payment.
Appendix EB 2016/119/R.10
34
certifying that the withdrawal application was for IFAD-funded procurement and
consistent with the Annual Work Plan and Budget before ACD can process the
withdrawal application. ICOs also provide in-country advice and sometimes training
on IFAD’s procedures for withdrawal applications and disbursements. The
quantitative analysis of the withdrawal applications processed in 2015 showed that,
in fact, it took on average one day longer to process withdrawal applications in
countries with ICOs. It is not clear whether this is because ICOs more rigorously
screen withdrawal applications or because the ICOs are an added bureaucratic
level. 57
125. Correlation between ICO presence and reduced time to first disbursement. In the
sample examined (2003-2015), the time taken to make the first disbursement
after approval was typically about 1.6 years, regardless of whether or not there
was an ICO in the country. Although it took 55 fewer days to make the first
disbursement in countries with ICOs compared to countries without ICOs, the
difference was not statistically significant. CPM-led ICOs performed better than
CPO-led ICOs in improving efficiency by reducing the time from approval to first
disbursement. On average it took 1.6 years to make the first disbursement in
countries where the ICO was CPO-led compared to 0.9 years in countries with CPM-
led ICOs. This difference, about 270 days or 9 months, was strongly significant
(see table 19 to 22 in Annex IV).
126. No evidence of ICOs’ contribution to shortening project implementation period.
Many factors have an influence on the time required to implement projects, not all
of which are within the control of IFAD or ICOs.58 The project duration was
analysed for the 143 projects that were approved from 2003 and closed by 2015
and there were 57 projects in countries with an operational ICO for at least two
years before project closure. Projects were completed in a shorter time in countries
without ICOs than in countries with ICOs and the differences were significant: (i)
7.6** months longer with an ICO from approval to completion; and (ii) 9*** months
longer from entry into force to completion. However, some of these 57 projects
were in an advanced stage of implementation when the ICOs were established. In
such cases it was probably beyond the capacity of ICOs to make up for lost time
caused by decisions made several years before.
127. No consistent evidence that ICO significantly contributed to improve project
administration indicators. The analysis was based on the latest cohort of Project
Status Reports (2015) rating of 11 dimensions of project administration.59 The
ratings were higher in countries with ICOs for performance of M&E** However,
ratings were higher in countries without ICOs compared to countries with ICOs in
three areas related to the quality of project financial governance: (i) quality of
financial management**; (ii) acceptable disbursement rate**; and (iii) quality and
timeliness of audits.** 60
128. In sum, there is convincing evidence that ICOs were effective in supporting the
supervision process and, even more so, improving the quality of implementation
57
A more detailed analysis was undertaken of the time required to process withdrawal applications by low, medium and high risk ratings. As expected, the time required to process withdrawal applications was shortest (about 10 days) when ICOs risk ratings were low and longest (about 17 days) when risk ratings were high. While ICOs helped to shorten
* the
time required by 2 days for low risk projects, it took 2 days longer**
to process withdrawal applications in high risk countries with ICOs. There was no significant difference for countries with a medium risk rating. The same pattern was evident when a sensitivity analysis was done focusing on ICOs that had been operational for four or more years. In 2016 it was agreed that PMD and CPMs would no longer provide certifications for low risk projects, except for direct payments to suppliers and initial advances to projects. 58
On average it has taken a little over 8 years to complete an IFAD project after approval, about 1.4 years longer than originally anticipated. There is some evidence that the duration of project implementation is slowly declining over time. 59
The dimensions are: (i) effectiveness lag; (ii) quality of financial management; (iii) acceptable disbursement rate; (iv) counterpart funds; (v) compliance with financing covenants; (vi) compliance with procurement; (vii) quality and timeliness of audits; (viii) quality of project management; (ix) performance of M&E; (x) coherence between the annual work plan and budget and implementation; (xi) exit strategy (readiness and quality). 60
Sensitivity tests for cases in which the ICO had been in operation for 4 and 8 or more years were broadly consistent with these findings and did not show any measurable impact of ICOs on these 15 dimensions of project administration.

Appendix EB 2016/119/R.10
35
support (continuity of engagement, availability and follow-up) and this is largely
consistent with the findings of past evaluations.61 The analysis of project-level
indicators (pace of implementation, disbursement, administrative issues) yields less
consistent findings although it is recognised that some of these are in part beyond
control or responsibility of ICOs. All elements considered, the rating for the
contribution to quality of supervision and implementation support is satisfactory.
A.1.c Contributions to achieving better project performance
129. This section reviews criteria that are part of the “project performance” of
independent evaluations. Much of the analysis is based on ratings from Project
Completion Report Validations and Project Performance Evaluations available in the
IOE ARRI databases.62 Three caveats must be born in mind when interpreting
these results (as well as those of this Chapter’s further section on development
effectiveness). First, many factors other than the work of ICOs influence project
performance including the enabling environment (e.g., government policies; local
institutional capacity; macro-economic conditions; political stability and security
conditions), market conditions and price movements, climatic factors, the
availability of counterpart funds, and others.
130. Second, on average it takes 8 years to implement IFAD-financed projects. There
are few projects that were identified, designed, approved, implemented and
evaluated after an ICO was established. Most of the projects that ICOs helped to
identify and design are still under implementation. For the purposes of the analysis
it was assumed that ICOs could have an influence on project performance if they
were operational for at least two years before project completion.63
131. Third, the establishment of country offices was not assigned randomly and it
cannot be assumed that countries with and without ICOs share the same salient
characteristics. The type of dataset and the limited number of observations
prevented the use of more sophisticated statistical techniques (e.g., instrumental
variables or propensity score matching). However, the evaluation team conducted
sensitivity analysis for small vs. large projects64 that yielded consistent results.
132. The analysis of project ratings shows that ICOs contributed to better
project effectiveness. Project performance until 2015 was a composite criterion
of relevance, effectiveness and efficiency.65 Key findings from the statistical
analysis are displayed in Figure 3 (and further detailed in Table 1 of Annex IV).
Ratings for effectiveness are higher in countries with ICO (here defined as having
an ICO operational for at least two years before completion) and this is statistically
significant.*** It is also to be noted that, moving from “without” to “with” ICO, the
average rating shifts from below moderately satisfactory (3.89) to ratings that are
well in the positive zone (4.40). While other factors may have been at play, it is
plausible that this result is connected to the important work of implementation
support done by ICOs, notably problem solving, follow-up to implementation
problems and anomalies as well as guidance provided to project management
teams. This would be in line with the type of responses received during country
case studies and regional workshops and oft-observed patterns during previous
evaluative IOE work and validates the expected “chain of results” that moves from
implementation support to better delivery of immediate project objectives.
61
Direct supervision and implementation support was the learning theme of the 2011 ARRI and the subject of the 2013 CLE on IFAD's Supervision and Implementation Support Policy. 62
The sample considered included 85 PCR validations, 39 project performance assessments, 2 impact evaluations and 30 other project evaluations. 63
Of the 155 projects, 103 were in the without the ICO group and 52 were in the with the ICO group. 64
Defined as projects above or below the median loan amount. 65
It was defined as the arithmetic average of these ratings. In 2016, the definition of performance has changed with the introduction of the second edition of the Evaluation Manual and now includes sustainability of benefits.

Appendix EB 2016/119/R.10
36
133. Ratings were higher but not statistically significant for relevance and
efficiency dimensions of project performance.66 With or without ICO, ratings
for relevance were in the satisfactory zone and that is where marginal
improvements are more challenging. Relevance is also largely determined at the
time of project identification and design, although some rectification is possible
during implementation. For the majority of projects rated in the databases, no ICO
was operational during that phase.
Figure 3 IOE Project Performance Ratings with and without ICOs (projects completed 2007 – 2015)
Source: CLE Analysis of ARRI Database (2016)
134. For both with and without ICO, the average rating for efficiency was below 4
(“moderately satisfactory) and the difference not robust to statistical tests. This
finding is on balance not surprising. Efficiency is highly sensitive to project
performance, notably capacity and management and technical skills of the project
team. In many instances, the ICO was established at a later stage in the project
life cycle and it would not be realistic to expect that it could solve efficiency
problems that had accumulated during the earlier years of implementation.
135. Average project performance ratings were significantly higher with ICOs
and this is likely to have been driven by the higher ratings of effectiveness. Again,
the rating shifts from below (3.95) to above (4.26) the moderately satisfactory
thresholds as the without and with ICO is considered. As has been noted by the
past ARRIs, the proportion of projects that IOE rated as moderately satisfactory
and satisfactory has gradually increased and has exceeded 80 per cent for projects
completed in 2011 or later. It would not be without some foundation to infer that
the decentralization process (especially ICOs) has reinforced implementation
support and played an important role in fostering this trend.
136. In sum, the contribution to achieving better project performance is rated as
satisfactory, having taken due considerations of the criteria that can be more / less
affected by country presence in the above time frame.
137. Overall the contribution of decentralization to strategy, programme management
and project performance can be assessed as satisfactory, based on the sub-
dimension of strategy preparation, contribution to supervision and to
implementation support and project performance. Equally important, this CLE
validates one of the assumptions of the implicit theory of change of
66
Sensitivity testing broadly confirmed these findings. If the ICOs were in operation for 4 or more years before project completion, ICOs had a discernible positive influence on overall project achievements
** and effectiveness
***. The
influence of ICOs in contributing to better project outcomes is clearer for smaller projects than for larger projects. The higher ratings for small projects were significant for overall project achievement
**, effectiveness
*** and average project
performance*. For large projects only the higher rating for effectiveness
** was significant.
0
0.5
1
1.5
2
2.5
3
3.5
4
4.5
5
Relevance Effectiveness*** Efficiency Average ProjectPerformance **
without ICOs
with ICOs

Appendix EB 2016/119/R.10
37
decentralization, by illustrating the mechanism that better implementation support
can lead to better delivery of the immediate project results. It remains to be seen
whether in the future, as ICO presence consolidates, criteria such as relevance and
efficiency can also be positively affected.
A.2 Contributions to non-lending activities
138. As noted in the Relevance Chapter, non-lending functions have acquired growing
importance in IFAD’s business model and there were expectations that
decentralization would contribute to that. This is explored in the sections below.
A.2.a Contributions to better knowledge management
139. Many divisions and departments contribute to the knowledge management. 67 At
the institutional level, key roles are played by SKD (for global and corporate
knowledge management) and PMD (for regional, country, thematic and project
level knowledge). The Communications Division manages IFAD.org and corporate
communications. In PMD the regional departments, PTA (through its notes and
toolkits), ECD, ICOs and projects are all involved in knowledge generation and
management activities. IOE also contributes to knowledge generation,
dissemination and management through its evaluation products, learning events,
dedicated knowledge products and online material.
140. Many projects produce knowledge products, some of which are supported by PTA
and ECD grants. According to the CLE case studies and regional workshops
discussions, ICOs have the potential to contribute by: (i) acting as a hub for
knowledge management platforms and disseminating knowledge products; (ii)
being closely connected with project implementation enables ICO staff to capture
and share lessons and best practices,68 if there is “buy-in” from CPMs; (iii)
providing training on knowledge management to local partners; and (iv) organising
study visits to other countries/projects. ICO case studies found, however, that
many ICOs had limited resources and allocate little time to these activities.
141. The approach to knowledge management varies across PMD divisions. Some
regional divisions have dedicated knowledge management positions and in others
portfolio advisors, senior CPMs and/or senior economists, with the support of a
programme assistant, are knowledge management focal points. Box 1 describes
APR’s out-posting the division’s knowledge management coordinator to the Hanoi
hub. In some ICOs (e.g., China; Sudan) associate programme officers work on
knowledge management and in others CPAs played an important role.
142. There is no platform to facilitate access to country/project specific
knowledge products. While there are examples of project level knowledge
products,69 PMD’s regional divisions do not systematically track and monitor these
products. To be useful, knowledge must be codified, catalogued, retrievable and
disseminated (see also the 2016 ARRI where knowledge management was the
annual theme). IFAD has not yet been able to establish an electronic platform that
people inside and outside IFAD can easily use to identify and retrieve knowledge
produced at the ICO, project and country level on topics that are of interest to
them. A Knowledge Management Action Plan is being prepared that includes plans
for a knowledge management platform and strategy and the creation of new
systems. SKD plans to develop a project knowledge series. However, these will not
67
All MDBs sought to become learning institutions from the mid-1990s onward and have invested resources in knowledge management. IFAD’s 2007 knowledge management strategy defines knowledge management as the process of “capturing, creating, distilling, sharing and using know-how” and states that IFAD will strive to be a learning organization that systematically learns from its projects and programmes. IFAD’s knowledge management system has learning and adaptation at its core, which is supported by four pillars: (i) innovation and experimentation; (ii) information management; (iii) monitoring and evaluation; and (iv) communications. 68
Examples given in the LAC workshop of promoting knowledge management and learning included PROCASUR, south-south cooperation and some specific cases (e.g., rural talents, CLAR, rural finance). 69
One of many examples was the booklet Indonesian Coastal Community Development: Experience and Lessons Learned. December 2015.

Appendix EB 2016/119/R.10
38
replace the need to develop a knowledge management system covering knowledge
products at the country, ICO and project level.
143. Several factors constrain the flow of knowledge from the ICO/country/ project
levels: (i) there are weaknesses in the M&E systems for knowledge management in
COSOPs and projects;70 (ii) there are different applications within IFAD that
manage different elements of project level knowledge;71 (iii) delivery of knowledge
management results are not included in the annual performance reviews of staff;
(iv) there are unsatisfied human and financial resource needs at the country office
level; and (v) country pages on IFAD.org include relatively little information (few or
no country or project knowledge products or links to them),72 predominantly in
English, and contain nothing in local languages limiting dissemination to local
stakeholders and sometime leading to sub-optimal situations.73
Box 1 Knowledge management and the out-posted APR knowledge management coordinator
APR’s core knowledge management team includes a knowledge management coordinator who is one of the out-posted CPMs in the Hanoi hub, the regional economist in headquarters and one dedicated programme assistant in headquarters. CPMs and CPOs are also part of the APR knowledge team and regularly interact with the core members. The approach of APR’s knowledge management coordinator is to use knowledge to support country based results management through knowledge driven COSOPs that include knowledge related M&E indicators.
Transforming Hanoi into a regional hub and outposting the APR knowledge coordinator opened up opportunities to use knowledge to raise IFAD’s profile in the region and for IFAD to become more closely integrated into regional knowledge systems (e.g., ASEAN; Greater Mekong Sub-region). Managing knowledge through a regional hub helps to: (i) avoid knowledge silos in countries; (ii) share information on common issues and project experience across the region; and (iii) undertake joint cluster case studies, develop regional learning routes and contribute more effectively to IFAD-Asia contents, IFAD’s regional knowledge management platform.
IFADAsia contains a wealth of information (e.g., news; blogs; events; discussions; resources; images; videos). The APR knowledge management coordinator uses Google analytics to track the usage of the 3,000 member IFADAsia webpage (i.e., sessions; users; page views; pages/sessions; average session duration; bonce rate; per cent new sessions; users by country).
Sources: Interviews, document reviews and APR Knowledge Management 2016 Action Plan, June 2016.
144. The Communications Division manages “IFAD.org” which is intended as a
communication tool to disseminate IFAD’s corporate messages to carefully targeted
audiences. The Field Communication and Capacity Development Team works in
tandem with Regional Communication Officers in place in four regions. A number of
separate project or thematic websites and systems are being developed to share
information. IFAD is emerging from a highly centralized approach in this area. A
more decentralised approach would require training IFAD staff in the use of
multiple interfaces and protocols to be put into place. There is an ongoing review of
IFAD.org and other possible tools that could be used to promote communications
and manage and disseminate information. This includes connecting press releases,
publications and other knowledge resources, such as blogs to the country pages.
The Communications Division is also investigating how to connect grants
information to the country/regional pages.
145. The analysis of CPE ratings for the performance of knowledge management showed
no statistically significant differences between the averages of countries with ICO
(see table 10 in Annex IV) and those without. E-survey responses corroborated
these observations. Less than half (48 per cent) of all E-survey respondents rated
70
Knowledge management plans are not yet systematically built in to COSOPs and projects that view knowledge as something that will help to achieve objectives and is covered by the associated M&E systems. 71
http://intranet.ifad.org/jobaids/webapps.htm 72
In MDB’s country home pages, embedded in the corporate webpage, are the first place to visit to find country specific information. 73
For example in Indonesia several projects translated IFAD guidelines into Bahasan Indonesian. It would be more efficient to translate the guidelines once and make them available to all project offices via IFAD.org/Indonesia.
Appendix EB 2016/119/R.10
39
the knowledge management performance of ICOs as satisfactory/highly
satisfactory (IFAD staff’s rating were significantly*** lower than those of non-IFAD
respondents).
146. In sum, the performance of ICOs in the area of knowledge management is rated as
moderately unsatisfactory. While projects and ICOs do, in fact, produce project
related knowledge, IFAD’s knowledge management systems do not effectively
organise this material so that people who might wish to use it can easily retrieve it.
Consequently IFAD staff and stakeholders outside of IFAD cannot make full use of
this project related knowledge that is produced.
A.2.b Contributions to strengthening partnerships at the country
level
147. IFAD recognizes the importance and value of partnerships as a means to achieve
its development objectives. The presence of ICOs increases IFAD’s
interaction with a broad range of local stakeholders. 74 ICO staff reported
spending considerable time on partnership activities. CPMs, other international staff
and national officers each devoted 17/18 per cent of their time to building
partnerships and relations. Building IFAD’s partnership with governments
accounted for most of the time CPMs allocated to partnership activities. Findings
were quite distinct according to different types of partnership.
A.2.b.i Partnerships with governments
148. Partnerships with governments were viewed as IFAD’s most important ones.
According to the ICO fact sheets returned to this CLE, CPMs in ICOs and CPOs
spend about 12 per cent and 10 per cent of their time respectively on partnership
building with governments and IFAD representation and image building combined.
149. Evaluation evidence suggests that country presence strengthened
IFAD/government partnerships and was positively correlated with
domestic financing. This was consistently the perception of government officials
interviewed and participating in workshops (see Tables 33-36, Annex IV). In their
E-survey responses, government officials in countries with ICOs rated ICO
performance as satisfactory for each of five dimensions.75 Moreover, 94 per cent of
government officials involved with IFAD prior to the establishment of the ICO in
their country felt that the ICO improved IFAD’s performance (15 per cent,
somewhat better; 44 per cent, better; 36 per cent, much better). Further evidence
came from the analysis of domestic financing for IFAD projects, despite the fiscal
constraints and competing priorities in IFAD’s client countries. The share of
domestic financing was three percentage points higher and statistically significant*
when countries were compared with and without ICOs, comparisons between
“before” and “after” ICO yielded even stronger findings (Tables 11-14 in Annex IV).
150. In sum, considering qualitative evidence and data on domestic financing, the
contribution of ICOs to building and strengthening IFAD’s partnerships with
governments is rated as highly satisfactory.
A.2.b.ii Partnerships with the MDBs and Bilateral Aid Agencies
151. Country presence increased information sharing and IFAD’s participation
in the local aid community. Country presence, or presence in a nearby hub,
74
E-survey responses from local stakeholders reported that 46 per cent met with IFAD staff once a month or more frequently in countries with an ICO. In countries without ICOs 13 per cent had the same degree of contact and 53 per cent met IFAD staff once or twice a year or never. Local stakeholders living in countries with ICOs were more familiar with IFAD’s activities and operations than those living in countries without ICOs. 75
Namely: (i) adequacy of the scope and responsibilities of the office; (ii) adequacy of the decision-making authority of the office; (iii) enhancing national ownership and direction of development assistance; (iv) decreasing the burden on government for formal and informal reporting to IFAD; and (v) effectively managing the IFAD/government relationship. The proportion of government officials rating ICO performance satisfactory/highly satisfactory ranged from a low of 69 per cent for the adequacy of the decision-making authority of the office to a high of 82 per cent for effectively managing the IFAD/government relationship.

Appendix EB 2016/119/R.10
40
made it more likely that IFAD would attend, and sometimes co-chair, the sectoral
donor coordination meetings, something that was appreciated by both
governments and the local donor community (e.g., Kenya,76 Laos, Philippines,
Tanzania77 and Vietnam).78
152. The amount of cofinancing is an indicator, albeit crude, of the strength of
partnerships with international development organizations. Between 2003 and
2015, the international cofinancing mobilized for IFAD projects totalled $3.6 billion,
of which $3.0 billion was from multilateral sources and $0.5 billion was from
bilateral sources. IFAD’s top cofinancing partners were IDA ($1.0 billion), ADB
($0.8 billion), OFID ($0.5 billion), AfDB ($0.3 billion), IsDB ($0.1 billion) and the
European Union ($0.1 billion).
153. At the aggregate level there is no evidence that ICOs catalysed more
international cofinancing for IFAD projects. The share of international
cofinancing as a percentage of total project costs was 5 to 6 percentage points
lower for both with and without ICO comparisons across countries after ICOs were
established* and before and after ICO comparisons in the same country** (see
Tables 11-15 in Annex IV). As noted during the country case studies, this reflects a
number of factors: (i) many donors have indicative programming figures for
countries that cannot always be increased because of a potential cofinancing
opportunity with IFAD; (ii) each donor has its own priorities for engagement in
countries that may, or may not, be aligned with IFAD’s; (iii) some donors make
major cofinancing decisions in headquarters rather than in the field;79 (iv)
governments may not prioritise cofinancing an IFAD project in allocating a largely
fixed envelop of donor funds and some countries may prefer “specialised donors”
according to geographical area or sub-sector; and (v) the work of the Office of
Partnerships and Resource Mobilization is headquarters centred and concentrates
on mobilising resources and special funds with partners – it is not directly linked to
operations at the country level.
154. However, for some multilateral donors, ICOs contributed to mobilising
additional international financing (e.g., ADB; EU; AfDB). The evidence is
clearest for ADB. Between 2003 and 2015 ADB provided a total of US$847 million
to cofinance IFAD projects. Of that, US$721 million, 85 per cent, was provided to
countries after ICOs were established. Of the US$721 million in ADB cofinancing
that was associated with the presence of ICOs, US$600 million went to countries
where the ICO was CPM led and US$121 million went to countries where the ICO
was CPO led (see table 15 in Annex IV). ICOs played an important role in helping
to strengthen the ADB/IFAD partnership, something that has been documented in
both IFAD and ADB evaluations.80
76
In Kenya the CPM, ICO staff and all partners (i.e., government, UN/RBAs, MDBs and the private sector) believed that having an ICO improved IFAD’s visibility and possibilities for partnerships. Although AfDB and World Bank staff interviewed did not have much experience working with IFAD in Kenya, they emphasised the importance of participation in the agriculture donor group for knowledge sharing and identification of opportunities for joint work. They gave some positive examples of collaboration with IFAD in other countries with ICOs where they had worked (e.g., Sudan, where IFAD studies were useful for a sector review; Ghana where they had co-financed a project and undertaken joint supervision). 77
In Tanzania the ICO staff and all partners were convinced that having an ICO increased opportunities for partnerships, although that was somewhat undermined by the rapid turnover of CPMs. 78
In their E-survey responses, 64 per cent of representatives of local donor community in countries with ICOs agreed/strongly agreed that with a country office: (i) IFAD was well integrated into the country-level or sectoral/thematic donor coordination mechanisms; and (ii) IFAD staff regularly attended local coordination meetings. In comparison, only 41 per cent of local donor respondents from countries without ICOs agreed/strongly agreed. 79
Australia, Canada, France, and Japan tend to centralize decisions on which partnerships or activities to engage in while the Nordic countries, the Netherlands and the United Kingdom typically leave such decision to their field offices. Source: ADB. Effectiveness of Asian Development Bank Partnerships. 2016. 80
In addition, interviews with the Development Bank of Latin America (Corporación Andina de Fomento (CAF), undertaken during the Peru ICO case study, found that CAF was interested in working with IFAD on value chains and linking major producers and processors with small producers, an area where IFAD has expertise. A Memorandum of Understanding for expanded collaboration was signed in Rome as a result of headquarters-driven initiative in 2015. However, in implementing the agreement, CAF found it easier to discuss options with the Peru ICO, which could direct
Appendix EB 2016/119/R.10
41
155. In sum, given the mixed nature of the findings, decentralization and ICOs are rated
as moderately satisfactory in strengthening IFAD’s partnerships with the donor
community.
A.2.b.iii Coordination with Rome-based and other UN Agencies
156. Increasing cooperation between the Rome Based Agencies has been a concern of
the Executive Board for many years. Since the Rome Based Agencies have thematic
affinities and some overlapping in country composition of executive boards, IFAD is
a UN agency, the UN has adopted the One UN approach and nearly all ICOs are
hosted by UNDP or FAO, the a priori expectation was that ICOs would contribute to
deepening IFAD’s partnerships with those agencies.
157. Overall, evidence suggests that ICO helped establish more regular
contacts but not significantly strengthen substantive and programmatic
collaboration. For example, ICOs allow IFAD to be better integrated into the
existing UN country-level or sectoral coordination mechanism. E-survey
respondents from UN agencies were optimistic about opportunities for collaboration
and joint work (depending on the specific question, 67 to 79 per cent
agreed/strongly agreed about improved opportunities; Table 10 in Annex V).
158. However, in many cases, these opportunities did not translate into reality as shown
through ICO case studies and regional consultation workshops. ICOs contributed to
sharing of information at the country level between IFAD, the Rome Based
Agencies and the UN system but tangible examples of enhanced cooperation
beyond sharing of information that could be attributed to the presence of an ICO
(e.g., Kenya; Laos; Rwanda) were exceptions rather than the norm. While ICOs
were members of the UN country teams, their participation was deliberately limited
because such meetings were viewed as time consuming and not adding much value
to IFAD’s operations. ICOs generally viewed IFAD’s participation in the One UN
Initiative as a low priority, given that IFAD’s operating model is different and more
akin to that of MDBs. Given their multiple responsibilities and limited staffing, ICOs
made a pragmatic decision to participate selectively in such meetings.81
159. While the sectoral coverage of IFAD and FAO are similar, their services differ with
IFAD’s core business being financing projects and FAO’s core business being
providing expert services and knowledge products. Much of the cooperation
between IFAD and FAO, or its investment centre, is reliant on IFAD mobilising
financing from its internal resources or grants to pay for FAO’s services.82
160. In sum, the contribution of country presence to deepening IFAD’s partnerships with
the UN and Rome-based Agencies is rated as moderately unsatisfactory. PMD’s
2016 functional review calls for, inter alia, stronger partnerships with, and
outsourcing some technical work to, FAO’s Investment Centre, CGIAR centres, the
Rome Based Agencies and the UN Committee on Food Security/High Level Panel of
Experts on Food Security and Nutrition. Time will tell if this vision becomes a
reality.
A.2.b.iv Non-government stakeholders
161. IFAD has a long tradition of working with organizations representing the rural poor.
Most projects involve beneficiary organizations that help identify, design and
implement small, community driven project components.
CAF representatives to the right contacts in IFAD. Cofinancing is currently considered in a new project in Ecuador although this is subject to the agreement of the Government. 81
An analysis of IFAD’s cofinancing data with Rome-based agencies and UNDP corroborated the findings of the ICO case studies. Between 2003 and 2015 WFP (US$44.1 million), UNDP (US$7.3 million) and FAO (US$2.1 million) provided at total of US$53.4 million combined to cofinance IFAD projects
81 . All FAO and UNDP cofinancing was in
countries without ICOs or prior to ICOs being established in the country. For WFP, 11 per cent of its cofinancing was in countries after an ICO was established and 89 per cent was unrelated to the presence of an ICO. 82
The 2014 CLE on the grant programme found that between 2004 and 2013 FAO was the largest recipient of IFAD grants [64 grants (9 per cent of the total); US$29 million (7.6 per cent)].
Appendix EB 2016/119/R.10
42
162. Directly involving civil society organizations representing the rural poor in projects
is one of IFAD’s comparative strengths relative to other MDBs. ADB representatives
interviewed felt that complementary institutional comparative advantages – ADB
financing rural infrastructure and IFAD’s proven track record of successfully working
with organizations representing the rural poor – promote a deeper partnership and
cofinancing between the two organizations.83
163. The assessment is positive but it is difficult to discern differences between
with and without ICOs case. There was consensus between country case
studies, workshops and E-surveys84 that IFAD performed well at: (i) reaching out
to, and consulting with, non-government stakeholders; (ii) involving non-
government stakeholders in designing its operations; and (iii) involving non-
government stakeholders in assessing its operations. However, there were no clear
differences in the above dimensions between countries with and without ICOs,
particularly from the survey.85
164. There are cases in which country presence has facilitated partnerships
with private sector entrepreneurs. However, these partnerships –when
existing- are more often initiated by project management teams than by
country offices. While some examples of established partnerships exist, for
example on maize in Ghana, cocoa in Indonesia, tea in Rwanda and oil palm in
Uganda,86 these were often initiated in the absence of a country office, although
the latter played a facilitating role later on. During this CLE country visits, there
was some evidence of an IFAD/private sector interface with projects in both Kenya
and Tanzania: in all cases the initiative had emerged from the private sector and
the managers of IFAD-funded projects.87 Small-scale indigenous entrepreneurs in
Vietnam appreciated IFAD’s support. While they had some contact with the ICO,
most of their interaction was with the relevant project office, beneficiaries and
other actors in the marketplace. Similar findings stem from past country
programme evaluations. This is consistent with the responses of ICO staff to the E-
survey that indicated that they met with private sector representatives less
frequently than government officials, staff of project offices, representatives of the
local donor community and civil society organizations and beneficiaries.
165. In sum, given the mixed evidence, the contribution of ICOs to strengthening IFAD’s
partnerships with non-government stakeholders is rated as moderately
satisfactory.
166. Overall, the contribution of ICOs to strengthening IFAD’s partnerships with in-
country partners is rated as moderately satisfactory. This takes into account strong
contributions to improvement in strengthening partnerships governments, more
mixed findings on partnership with the local donor community and non-government
actors, and limited programmatic cooperation with Rome-based agencies.
83
A good partnership has developed between IFAD and ADB and was initiated by the former out-posted Laos CPM with ADB agriculture staff based in Laos, participated in joint review missions for an on-going co-financed project and was actively involved in the design of a new project and the related policy dialogue. ADB appreciated the fact that the CPM was able to mobilise an IFAD livestock expert, an area in which ADB did not have expertise, IFAD’s technical expertise (e.g., integrated pest control, its approach to rural finance) and its long, successful history of working with beneficiary organizations. Key points related to the partnership include: (i) it was driven by committed individuals on both sides who wanted to make it work; (ii) the two organizations have complementary strengths; and (iii) sometimes procedures at headquarters work against such partnerships (this refers to delays in project approval). 84
The percentage of E-survey respondents assigning a satisfactory or highly satisfactory rating ranged between 63 and 74 per cent depending on the criteria. 85
Similarly, the 2016 report on the Farmers’ Forum, a mechanism to facilitate dialogue on rural development and poverty reduction between apex farmer and rural producer organizations, IFAD and governments, suggested that there was not a strong relationship between the presence/absence of an ICO and the strength of the partnership. 86
IFAD (2015). Brokering Development: Enabling Factors for Public-Private-Producer Partnerships in Agricultural Value Chains. 87
IFAD staff (national and international) are more comfortable interfacing with the public sector. In some cases there seems to be a preference for cooperatives and groups for marketing rather than analysing and building on the role of small traders, who often are the point of first interface for both inputs and marketing. Agencies such as IFC, EBRD, USAID and the Gates Foundation have more explicit focus on the private sector.

Appendix EB 2016/119/R.10
43
A.2.c Contributions to strengthening country level policy dialogue
167. At the corporate level, IFAD recognizes the importance of an enabling policy
environment to support and accelerate agriculture and rural development. IFAD
selectively engages in policy dialogue aimed at reducing rural poverty and
empowering beneficiary organizations to gain policy influence. IFAD’s policy
dialogue initiatives involve governments, rural producer organizations and other
donors and partners. Effectively undertaking policy dialogue requires having a well
thought out plan that sets priorities by identifying the areas in which IFAD will
engage to promote policy reform, the objectives to be achieved and a plan of
action that is adequately resourced.
168. In the past IOE and the Brookings Institute have highlighted weaknesses in IFAD’s
country-level policy work resulting from: (i) over-ambitious policy agendas set out
in COSOPs that are not followed through; (ii) IFAD’s narrow focus on projects, at
the expense of knowledge management and policy engagement; (iii) a lack of
capacity in terms of in-country presence and in-house skills; and (iv) lack of
instruments and tools to support country-level policy dialogue.
169. Although there are some positive examples of country-level policy
dialogue that involve ICOs, this was not a systematic finding across ICOs.
Two general findings stood out from interviews, case studies and workshops. On
the one hand, ICOs, particularly CPM-led ones, had opportunities of: (i) long-term
engagement (building relationships, trust and understanding of local priorities,
constraints) with national policy makers; (ii) basing suggestions for policy reform
on good practices documented in knowledge products and grounded in project
experience; and (iii) participating in sector working groups and engaging with all
relevant actors. Some examples emerged including Vietnam (Box 2).
Box 2 A combination of non-lending products contribute to policy dialogue in Vietnam
The Vietnam COSOP for 2012-17 was designed to support the National Targeted Program on New Rural Development (NTD-NRD), bringing under one umbrella all programmes implemented in the rural space and with a strong poverty reduction thrust. Because of IFAD’s good track record of successful projects, IFAD’s knowledge and expertise and the good relationships established with the Hanoi ICO, the government invited IFAD to partner with the World Bank to evaluate phase 1 of the NTP-NRD and make recommendations for phase 2. Because of World Bank staff turnover, IFAD was the lead agency in this initiative. The Hanoi ICO mobilised funding for the consultants to support this work from IMI funding for policy work managed by PTA (US$60,000). The grant approval process was straightforward, involving a simple memo approved by the APR and PTA Directors.
In June 2016 the resulting report was transmitted to the Deputy Prime Minister, the Ministers of Agriculture and Rural Development and Planning and Investment and Vice Ministers of Agriculture and Rural Development and Finance. It included background notes on governance, planning and fiscal decentralization, strategic and design considerations for the 2
nd phase of the NTP-NRD 2016-
2020 and learning from global experience.
The Ministry of Agriculture and Rural Development confirmed that the government appreciated the work of IFAD and the World Bank. It viewed the analysis, lessons and recommendations as sound. The results of this work were being incorporated into the soon to be completed new five year plan covering the period to 2020, effectively scaling up IFAD’s experience to the national level.
Source: Vietnam ICO case study
170. On the other hand, because of their small size and competing priorities, relatively
little ICO staff time was allocated to policy dialogue (e.g., Philippines; Kenya, Peru;
Ecuador; Bolivia). The ICOs reported that, on average, CPMs, other international
staff and CPOs only spend 4 to 5 per cent of their time on policy dialogue and
providing policy inputs to governments.
171. The analysis of 36 CPE ratings provides no evidence that the presence of an ICO
improved IFAD’s policy dialogue performance. Differences were not statistically
significant for countries with and without ICOs (see Table 10 in Annex IV). These

Appendix EB 2016/119/R.10
44
findings may partly reflect the fact that many of the evaluations cover COSOPs and
projects that were designed, approved and implemented before IFAD began to
place increasing priority on policy dialogue. This CLE also analysed the quality of
the coverage of policy dialogue in COSOPS using the data assembled for
Management’s comprehensive 2016 review of IFAD’s country level policy
engagement.88 It found there was no difference in the quality of the coverage of
policy dialogue in COSOPs and project design documents in countries with and
without ICOs (Table 16, Annex IV).
172. Good coverage of policy dialogue issues in COSOPs and project design documents
appears to be largely determined by the interests, experience and initiatives of
CPMs and how ICO staff allocate a scarce commodity, their time, among the many
competing priorities. The fact that some regions are more involved in policy
dialogue than others indicates that the leadership provided by regional directors is
also an important factor. Some of the ICO case studies (e.g., DRC; Tanzania) found
that a turnover of the CPM and long delays in filling the vacancy had an adverse
impact on policy dialogue. In other cases (e.g., Vietnam) the arrival of a new CPM
energised IFAD’s policy dialogue. Many CPMs were recruited for their programmatic
skills and are not necessarily experienced in policy dialogue. Experience in policy
dialogue is not a required skill set when IFAD recruits new CPMs and training
programmes are not yet in place to help existing CPMs develop the required skills.
173. In sum, the formal and informal corporate incentives do not encourage ICOs to
undertake policy dialogue. In practice individual performance assessments are
more heavily driven by project approval, successful implementation and ensuring
sound fiduciary matters than non-lending activities, including policy dialogue. That
is probably one reason why over-stretched CPMs and CPOs allocate relatively little
of their time to policy dialogue. ICO contribution to country level policy dialogue is
rated as moderately unsatisfactory.
174. IFAD’s rural-sector performance (RSP) analysis is a tool that has the potential to
institutionalise country level policy dialogue and enhance the role of ICOs in that
process. Each year IFAD assesses the policy and institutional environment for
reducing rural poverty for every country of operation and summarises the findings
in the RSP score, which is included as a policy variable in the Performance Based
Allocation System formula.89 The RSP is unique to IFAD in the international
community as a knowledge product.90 If IFAD were to adopt a more rigorous ICO-
led approach to the RSP scoring process that involved systematic consultation with
local stakeholders, it could serve as a useful tool to identify the policy areas where
IFAD would engage.
175. In synthesis, the contribution of decentralization and ICOs to improving
performance of non-lending activities is rated as moderately unsatisfactory. That
rating takes into account the assessments of the contribution to knowledge
management (moderately unsatisfactory), partnerships (moderately satisfactory)
and policy dialogue (moderately unsatisfactory) and the fact that limited resources
were made available to these activities.
176. On balance, the contribution of decentralization and ICOs to overall operational
performance is rated as moderately satisfactory, based on a satisfactory rating of
contributions to programme management and a moderately unsatisfactory rating of
contributions to non-lending activities. The 2011 Country Presence Policy and
88
IFAD (2016). Country-level policy engagement in IFAD A review of experience. The data in this report was a scoring of whether or not policy dialogue was mentioned in the COSOPs and project documents. No judgement was made on the quality of the planned policy dialogue or, in fact, if it actually took place. 89
The RSP score has a weight of 0.45 in the PBAS. 90
The 2016 CLE on the PBAS identified some weaknesses in RSP scores and processes: (i) the underlying processes used to determine RSP scoring were not systematic; (ii) the quality assurance of scores varied from division to division; and (iii) the amount of stakeholder input varied significantly across countries. The Technical Working Group for the Fine Tuning of the PBAS is examining ways to strengthening the RSP scoring process and the role that the RSP plays as an instrument to enhancing country-level policy dialogue.
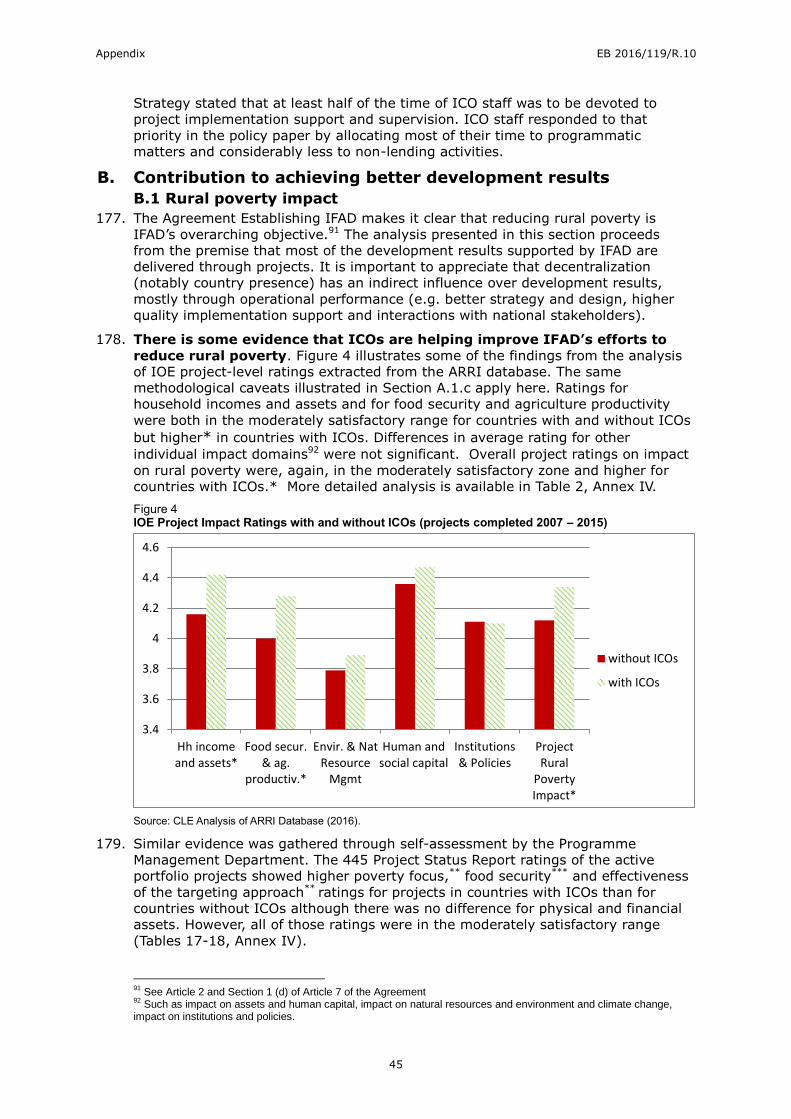
Appendix EB 2016/119/R.10
45
Strategy stated that at least half of the time of ICO staff was to be devoted to
project implementation support and supervision. ICO staff responded to that
priority in the policy paper by allocating most of their time to programmatic
matters and considerably less to non-lending activities.
B. Contribution to achieving better development results
B.1 Rural poverty impact
177. The Agreement Establishing IFAD makes it clear that reducing rural poverty is
IFAD’s overarching objective.91 The analysis presented in this section proceeds
from the premise that most of the development results supported by IFAD are
delivered through projects. It is important to appreciate that decentralization
(notably country presence) has an indirect influence over development results,
mostly through operational performance (e.g. better strategy and design, higher
quality implementation support and interactions with national stakeholders).
178. There is some evidence that ICOs are helping improve IFAD’s efforts to
reduce rural poverty. Figure 4 illustrates some of the findings from the analysis
of IOE project-level ratings extracted from the ARRI database. The same
methodological caveats illustrated in Section A.1.c apply here. Ratings for
household incomes and assets and for food security and agriculture productivity
were both in the moderately satisfactory range for countries with and without ICOs
but higher* in countries with ICOs. Differences in average rating for other
individual impact domains92 were not significant. Overall project ratings on impact
on rural poverty were, again, in the moderately satisfactory zone and higher for
countries with ICOs.* More detailed analysis is available in Table 2, Annex IV.
Figure 4 IOE Project Impact Ratings with and without ICOs (projects completed 2007 – 2015)
Source: CLE Analysis of ARRI Database (2016).
179. Similar evidence was gathered through self-assessment by the Programme
Management Department. The 445 Project Status Report ratings of the active
portfolio projects showed higher poverty focus,** food security*** and effectiveness
of the targeting approach** ratings for projects in countries with ICOs than for
countries without ICOs although there was no difference for physical and financial
assets. However, all of those ratings were in the moderately satisfactory range
(Tables 17-18, Annex IV).
91
See Article 2 and Section 1 (d) of Article 7 of the Agreement 92
Such as impact on assets and human capital, impact on natural resources and environment and climate change, impact on institutions and policies.
3.4
3.6
3.8
4
4.2
4.4
4.6
Hh incomeand assets*
Food secur.& ag.
productiv.*
Envir. & NatResource
Mgmt
Human andsocial capital
Institutions& Policies
ProjectRural
PovertyImpact*
without ICOs
with ICOs

Appendix EB 2016/119/R.10
46
180. In sum, ICO contributions to improving the poverty reduction outcomes of IFAD-
funded operations can be assessed as satisfactory. Given that it takes an average
of eight years to implement IFAD projects and ICOs have been involved in the full
project cycle for only a small number of projects, the above results may understate
the full impact of ICOs’ contribution to strengthening of the poverty reduction
outcomes of IFAD’s operations. Taking into account the fact that many other factors
are at play in generating impacts and that country office presence has at best an
indirect effect, these results could not be taken for granted.
B.2 Gender equality and women’s empowerment
181. IFAD promotes gender equality and empowering rural poor women as set out in
IFAD’s 2012 Policy on Gender Equality and Women’s Empowerment.
182. While the country presence policy papers did not identify addressing
gender issues as a specific priority for ICOs, evidence suggests that ICOs
helped deliver better gender results at the country level. Before examining
the results, it is worth identifying the mechanisms through which ICOs may have
facilitated certain outcomes, in addition to implementation support. Some ICO staff
and some staff in project offices are self-nominated members of the gender
thematic group.93 Technology has been used to strengthen communications and
outreach for global gender events and training. Two divisions have full-time
regional gender and youth coordinators in ICOs (WCA in Senegal ICO and ESA in
Nairobi, see Box 3).
183. Also, the presence of the country office facilitated the organization of in-country
gender events – CPMs led 16 of the 25 ICOs in the countries that hosted gender
events. These are not examples of development results but of initiatives supported
through country offices to help sensitize government staff, project managers and
front-line field facilitators on gender equality and women’s empowerment and on
IFAD’s goals and experience in this domain. During interviews, many project
managers and government staff stated that it was through this sensitization that
they and their colleagues had far better understanding of IFAD goals and of the
broader importance of gender equality for rural development. These details
illustrate how country presence can, indirectly, further IFAD’s agenda. However,
government, project and IFAD staff agreed that more can and should be done to
use the improved IT/communications facilities to promote online training and self-
learning and to brief staff in project offices on the gender aspects of project design.
That may require mobilising additional funding.
Box 3 Summary of the activities of the WCA gender and youth coordinator
The WCA regional gender and youth coordinator, based in the Senegal ICO, also covers Benin, Cape Verde and Gambia. The WCA gender coordinator provides three levels of support: (i) at the regional level as part of the WCA team she: (a) provides support from a gender perspective in programmatic areas by reviewing project designs and contributing to supervision, portfolio and midterm project reviews; (b) provides technical support on gender related issues in response to requests from CPMs; and (c) travels in two or three countries a year to provide support to on-going projects; (ii) at the divisional level she works with PTA on value chains, farmers’ organizations, women, youth and small business including organising events and preparing and disseminating knowledge products (e.g., the Kinshasa forum in 2014 on targeting and youth; publication on women empowerment in West and Central Africa); and (iii) at the country level she provides technical support on socio economic aspects in the countries covered by the ICO. To comply with the human resource policies of the UN system, as national officers gender coordinators can work outside their home country for a maximum of six months a year.
Source: Interviews and document reviews
184. Project ratings for gender equality and women's empowerment were well above the
moderately satisfactory threshold for countries without ICO (4.20) but significantly
93
About 55 per cent of IFAD-funded projects have a gender focal point.
Appendix EB 2016/119/R.10
47
higher** (4.53) for countries with an ICO established for at least two years before
project completion (Figure 5; see also Table 2 Annex IV).94 Thus, rating had moved
from the moderately satisfactory zone to just above the threshold of the
satisfactory one. Similar evidence (significant differences) came from PMD’s Project
Status Report ratings.
185. In synthesis, the contribution of ICOs to helping IFAD to deliver better
development results in the area of gender is rated as satisfactory, given the
consistent positive findings from the quantitative analysis.
B.3 Environmental and natural resource management and climate
change
186. It is widely acknowledged that the rural poor are among the most vulnerable in the
world in terms of the accelerating environmental degradation, climate change and
degradation of natural resources. The goal of IFAD’s 2012 environment and natural
resource management policy was to enable poor rural people to escape from, and
remain out of, poverty through more-productive and resilient livelihoods and
ecosystems. To support its environment and natural resource management
operations IFAD succeeded in mobilizing considerable grant resources from the
Global Environment Facility and the Adaptation Fund, both of which have
knowledge management components. There are examples of IFAD projects that
target sustainable environment and natural resource management and climate
change.95 The issue analysed in this section is whether ICOs played a discernible
role in contributing to IFAD’s improved performance in delivering better
environment and natural resource management results.
187. The analysis of project evaluation ratings found that they were below the
moderately satisfactory threshold for countries with and without ICOs and that in
the “with ICO” case the average was higher but the difference was not statistically
significant (Figure 4; see also Table 2 Annex IV). The 2015 self-assessment ratings
by PMD show similar findings. In fact attention to natural resource management
and quality of natural asset improvement and climate resilience had almost
identical averages and the difference was not significant. During interactions with
IFAD staff and partners in the field, few examples emerged of specific instruments
available to country offices, other than project identification and design and some
ad hoc seminars, to sensitise national and international partners in this area.96
188. In sum, the contribution of country presence to environmental and natural resource
management and climate change is rated as moderately unsatisfactory. Given that
the decision has been made to appoint four national officers with regional
responsibilities over environment and climate change, decentralization performance
in this area may improve in the future.
B.4 Contributions to innovation, replication and scaling up
189. IFAD’s 2015 Operational Framework for Scaling Up defines scaling up as
“expanding, adapting and supporting successful policies, programmes and
knowledge, so that they can leverage resources and partners to deliver larger
results for a greater number of rural poor in a sustainable way”. The Report of the
Consultation on IFAD10 stated that IFAD would “Give explicit and consistent
attention in all its operations to innovation, learning and scaling up.” IFAD has
been developing a corporate approach to scaling up since 2009, with support from
94
The former was in the satisfactory range and the latter was in the moderately satisfactory. 95
Responsibilities of PMD’s Environment and Climate Division (ECD) include supporting project design and implementation, designing and implementing grant and supplementary-funded initiatives, mobilising resources and managing dedicated financial resources, training and capacity building, knowledge management and partnerships and corporate responsibilities. 96
Training is provided to IFAD staff and project staff in the field in the start-up workshop of projects that have ASAP, GEF, or other green financing initiatives.
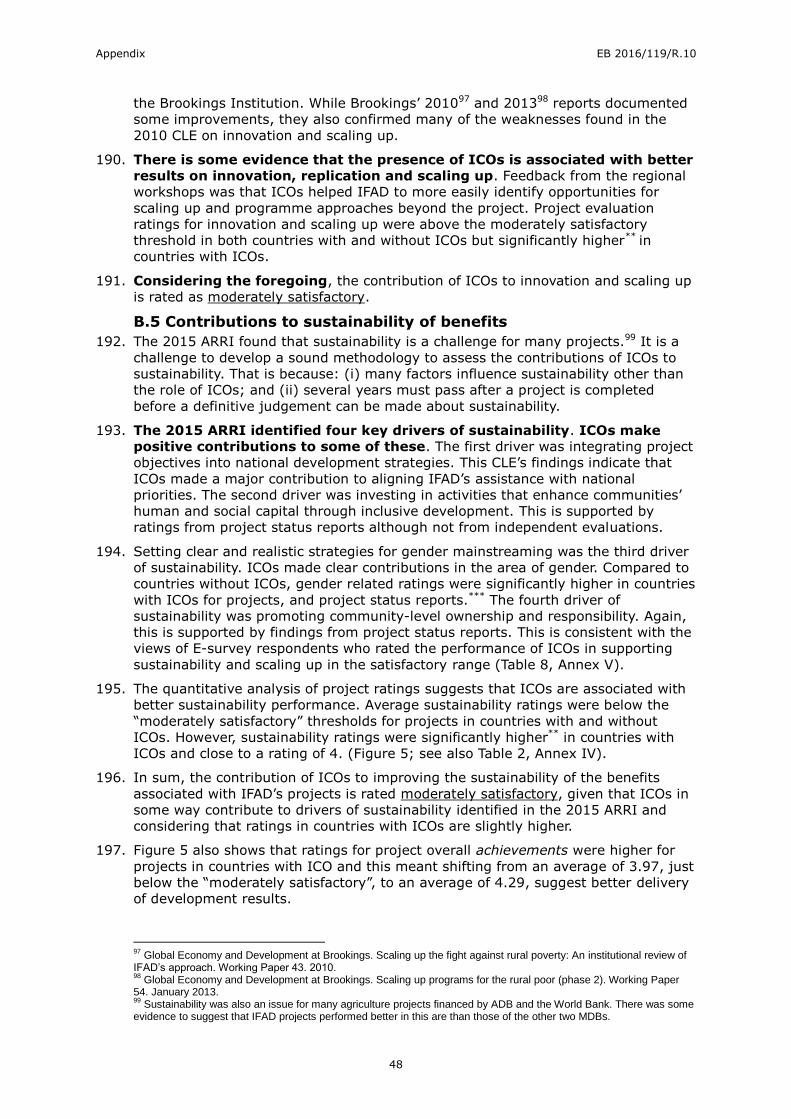
Appendix EB 2016/119/R.10
48
the Brookings Institution. While Brookings’ 201097 and 201398 reports documented
some improvements, they also confirmed many of the weaknesses found in the
2010 CLE on innovation and scaling up.
190. There is some evidence that the presence of ICOs is associated with better
results on innovation, replication and scaling up. Feedback from the regional
workshops was that ICOs helped IFAD to more easily identify opportunities for
scaling up and programme approaches beyond the project. Project evaluation
ratings for innovation and scaling up were above the moderately satisfactory
threshold in both countries with and without ICOs but significantly higher** in
countries with ICOs.
191. Considering the foregoing, the contribution of ICOs to innovation and scaling up
is rated as moderately satisfactory.
B.5 Contributions to sustainability of benefits
192. The 2015 ARRI found that sustainability is a challenge for many projects.99 It is a
challenge to develop a sound methodology to assess the contributions of ICOs to
sustainability. That is because: (i) many factors influence sustainability other than
the role of ICOs; and (ii) several years must pass after a project is completed
before a definitive judgement can be made about sustainability.
193. The 2015 ARRI identified four key drivers of sustainability. ICOs make
positive contributions to some of these. The first driver was integrating project
objectives into national development strategies. This CLE’s findings indicate that
ICOs made a major contribution to aligning IFAD’s assistance with national
priorities. The second driver was investing in activities that enhance communities’
human and social capital through inclusive development. This is supported by
ratings from project status reports although not from independent evaluations.
194. Setting clear and realistic strategies for gender mainstreaming was the third driver
of sustainability. ICOs made clear contributions in the area of gender. Compared to
countries without ICOs, gender related ratings were significantly higher in countries
with ICOs for projects, and project status reports.*** The fourth driver of
sustainability was promoting community-level ownership and responsibility. Again,
this is supported by findings from project status reports. This is consistent with the
views of E-survey respondents who rated the performance of ICOs in supporting
sustainability and scaling up in the satisfactory range (Table 8, Annex V).
195. The quantitative analysis of project ratings suggests that ICOs are associated with
better sustainability performance. Average sustainability ratings were below the
“moderately satisfactory” thresholds for projects in countries with and without
ICOs. However, sustainability ratings were significantly higher** in countries with
ICOs and close to a rating of 4. (Figure 5; see also Table 2, Annex IV).
196. In sum, the contribution of ICOs to improving the sustainability of the benefits
associated with IFAD’s projects is rated moderately satisfactory, given that ICOs in
some way contribute to drivers of sustainability identified in the 2015 ARRI and
considering that ratings in countries with ICOs are slightly higher.
197. Figure 5 also shows that ratings for project overall achievements were higher for
projects in countries with ICO and this meant shifting from an average of 3.97, just
below the “moderately satisfactory”, to an average of 4.29, suggest better delivery
of development results.
97
Global Economy and Development at Brookings. Scaling up the fight against rural poverty: An institutional review of IFAD’s approach. Working Paper 43. 2010. 98
Global Economy and Development at Brookings. Scaling up programs for the rural poor (phase 2). Working Paper 54. January 2013. 99
Sustainability was also an issue for many agriculture projects financed by ADB and the World Bank. There was some evidence to suggest that IFAD projects performed better in this are than those of the other two MDBs.
Appendix EB 2016/119/R.10
49
Figure 5 IOE Project Impact Ratings with and without ICOs (projects completed 2007 – 2015)
Source: CLE Analysis of ARRI Database (2016)
198. On balance, the contribution of decentralization and ICOs to helping IFAD achieve
better development results is rated moderately satisfactory, reflecting satisfactory
contributions in the areas of rural poverty and gender; moderately satisfactory for
innovation, replication and scaling up and sustainability but moderately
unsatisfactory for environment and natural resource management and climate
change. These findings are broadly in the positive zone and encouraging. Overall,
there is support for the assumption that decentralization would lead not only to
better internal and project performance but also to better development results for
IFAD final clients.
C. Overall findings about the effectiveness of ICOs
C.1 Overall effectiveness of ICOs
199. The effectiveness of IFAD’s decentralization and establishing country
presence is rated as moderately satisfactory. This takes into account the
rating of moderately satisfactory for development results and moderately
satisfactory for operational performance. While decentralization processes operate
indirectly towards the achievement of development results, this CLE validates the
causality chain assumed in the implicit theory of change for decentralization, with
some qualifications for the non-lending activities which have also received lower
attention, resources and consequently staff time.
C.2 Effectiveness of different ICO models100
200. The evaluation did not find consistent evidence that ICOs led by an
international staff (CPM) were more effective than those led by a national
staff (CPO). Although there were a few instances when CPM led ICOs delivered
better results than CPO led ICOs, for the large majority of indicators, there was no
difference in the relative effectiveness of the two ICO models. In terms of self-
assessment evidence, the quantitative analysis of the most recent Project Status
Report Ratings did not show that CPM-led ICOs outperformed CPO-led ICOs for any
of the 10 criteria101 that measure IFAD’s contributions to development
effectiveness. However, some of the indicators of implementation pace show that
100
The analysis on the E-survey and quantitative analysis could not assess the effectiveness of hubs, mainly because: of the relatively short time period that some of the ICOs have officially acted as hubs. 101
Gender focus; poverty focus; effectiveness of the targeting approach; climate and environment focus; institution
building; empowerment; quality of beneficiary participation; responsiveness of service providers.
0
0.5
1
1.5
2
2.5
3
3.5
4
4.5
5
Innovation &Scaling-up**
Sustainability** Genderequality**
Proj. OverallAchievement **
without ICOs
with ICOs
Appendix EB 2016/119/R.10
50
CPM-led ICOs were performing better: smaller time laps between project approval
and entry into force and from approval to first disbursement.
201. The small number of CPM-led ICOs that were in operation for a significant number
of years did not permit a valid statistical comparison between the differences in
performance of CPM vs. CPO-led ICOs based on an analysis of IOE’s project and
CPE ratings. A longer period of time must pass before IOE ratings can be used to
assess the relative effectiveness of CPM and CPO-led ICOs in delivering results.
202. The feedback given to the evaluation team during many interviews by IFAD staff,
both in headquarters and in ICOs, was that CPM-led ICOs delivered superior results
compared to CPO led ICOs. Factors cited included the greater experience and
international exposure of CPMs, the CPMs’ greater familiarity with IFAD’s policies
and procedures, the greater local knowledge and stronger partnerships built by
out-posted CPMs and the greater capacity of CPMs to undertake non-lending
activities. However, looking at the E-survey responses of IFAD’s clients, there was
no statistically significant difference in the overall appreciation rating of the two
ICO models. Of the 15 more specific dimensions of ICO performance, CPM-led ICOs
were rated better for only two: (i) aligning IFAD’s assistance with country
priorities*; and (ii) mobilising financing from other organizations.**
203. A number of factors may have contributed to the above findings. First, the
evaluation found a continuum of realities in terms of the roles and functions of
ICOs rather than a strict application of the ICO models defined in the country
presence policy papers. CPMs often have responsibilities for neighbouring countries
with CPOs. For some ICOs there was a turnover of CPMs and long vacancies before
the next CPM arrived. Interactions with government and project representatives
from countries with fragile situation (e.g., Sudan, Democratic Republic of Congo)
suggest that the problem of turn-over of CPM was a special problem in such case
as it added to the volatility of the situation and created further discontinuity to
programme management and partnership with national actors. During those
periods CPOs effectively led the ICOs. The 3 to 5 year CPM rotation cycle is less
than the average time that it takes to implement IFAD projects or the life of a
COSOP. Moreover, not all CPM-led ICOs were the same. For example some CPM led
ICOs have a CPO and others do not (e.g., LAC CPM-led ICOs).
204. Second, CPOs work in their home country and, for that reason, relative to newly
assigned CPMs, experienced senior CPOs may better know the past and present
history and lessons of projects, the common issues with the government and the
country situation. That would be particularly true if relatively inexperienced staff
were out-posted as CPMs, which happened sometimes during the initial
implementation of the country presence policy, or if they were newly recruited at
IFAD and did not have detailed knowledge of IFAD’s policies and procedures.
205. This CLE recognizes that out-posted CPMs have responsibilities that cannot be
assumed by national staff. No comparator organization has given all CPM-type
responsibilities to national staff and internationals often have a higher formal level
of entry to government and the international community than national staff.
206. Since the CPOs led many ICOs for most of the period under review, a corollary of
the above findings is that CPOs can and do play an important role in helping
IFAD to deliver better operational performance and development
results.102 In any case, budget constraints are likely to limit the number of
102
A case study in the Philippines offers material for reflection. According to the ADB staff interviewed, the CPO actively participated in: (i) joint project processing and recruiting well-qualified local consultants that benefited the project design; and (ii) joint review missions, recruiting consultants and identifying and resolving problems. The CPO coordinated with other donors and represents IFAD effectively in coordination meetings convened by the National Economic and Development Agency. ADB staff viewed the Philippine ICO as being effective because of the CPO who was known and respected both in government and non-government circles. He was an ex-senior government official who: (i) was well qualified; (ii) had a wide range of contacts in the government and good access to senior officials; (iii)

Appendix EB 2016/119/R.10
51
additional CPM positions created. The forgoing is not a complete analysis of the
relative performance of the CPM and CPO led ICOs models as it only draws on the
evaluation evidence related to effectiveness. More evidence on the various hub
models is presented in the efficiency chapter related to both organizational and
cost analysis. In the last chapter of the report draws upon all of the evaluation
findings to reach broad organizational conclusions on the various ICO models.
Key findings on the effectiveness of IFAD’s decentralization
The evaluation evidence shows that ICOs help to:
Strengthen COSOPs and project design through greater country knowledge and a
stronger focus on rural poverty, although not linkages with grants.
Facilitate supervision and strengthen project implementation support with improvements in some of the implementation pace indicators.
Deliver better results at the country level through more successful projects
Deliver better results in addressing rural poverty and gender, innovation and scaling up and sustainability.
Mixed results on ICO contributions to improving non-lending activities:
CPE ratings do not show that ICOs were associated with better policy dialogue, or knowledge management performance.
There have been improvements in partnership, particularly those with Governments and, with some nuances, with donors and MDBs and some of the non-governmental actors (but not necessarily private sector ones)
Examples of good non-lending performance were not systematic across ICOs
reflect more the interests and capabilities of CPMs/CPOs.
ICO staff have limited resources for and spend relatively little time on non-lending activities.
Inconsistent evidence that CPM led ICOs systematically deliver better results than CPO led ICOs. CPOs can and do play an important role in helping IFAD to deliver better development outcomes.
had good civil society contacts; and (iv) could help ADB identify and fix problems. Because of those characteristics ADB staff valued his input in processing and supervising IFAD/ADB cofinanced projects. The CPO retired in 2016.

Appendix EB 2016/119/R.10
52
Ratings by evaluation criteria and sub-criteria. Effectiveness
Evaluation criteria
Evaluation sub-criteria Rating
Effectiveness A Achieving Improved Operational Performance moderately satisfactory (4)
A.1 Contributions to strategy, programme management and project performance
satisfactory (5)
A.1.a Contributions to Preparing Country Strategies, Project Identification and Design
satisfactory (5)
A.1.b Contribution to Project Supervision and Implementation Support
satisfactory (5)
A.1.c Contribution to Achieving Better Project Performance satisfactory (5)
A.2 Contribution to non-lending activities moderately unsatisfactory (3)
A.2.a Contribution to Knowledge Management moderately unsatisfactory (3)
A.2.b Contribution to Partnerships moderately satisfactory (4)
A.2.b.i Partnership with Governments highly satisfactory (6)
A.2.b.ii Partnership with MDBs and Bilateral Aid Agencies moderately satisfactory (4)
A.2.b.iii Partnership with UN and Rome-based Agencies moderately unsatisfactory (3)
A.2.b.iv Partnership with non-government stakeholders
moderately satisfactory (4)
A.2.c Contribution to Policy Dialogue moderately unsatisfactory (3)
II.B Contribution to achieving better development results moderately satisfactory (4)
B.1 Rural Poverty Impact satisfactory (5)
B.2 Gender equality and women’s empowerment satisfactory (5)
B.3 Environmental and natural resource management and climate change
moderately unsatisfactory (3)
B.4 Contribution to innovation and scaling up moderately satisfactory (4)
B.5 Contribution to sustainability of benefits moderately satisfactory (4)
Overall rating for Effectiveness moderately satisfactory (4)

Appendix EB 2016/119/R.10
53
V. Efficiency of IFAD's decentralization 207. This chapter explores four key dimensions of institutional efficiency related to
decentralization: (A) decentralization and management of costs at corporate level;
(B) institutional structure and organizational arrangements; (C) human resources
aspects; (D) administrative and technical support functions and decentralization of
approval authority and responsibilities.
A. Decentralization and management of costs
The context
208. IFAD initiated a 3-year pilot for permanent field presence starting in 2004. In
December 2003, the EB had approved a budget of US$3 million for a 3-year Field
Presence Pilot Programme (FPPP), involving 15 countries.103 Even with a small
resource envelope, the FPPP had a broad set of country presence objectives, as
noted under Relevance (“strengthening and integrating four interrelated
dimensions: project implementation, policy dialogue, partnership building and
knowledge management”).
209. Termination of the agreement with UNOPS. IFAD introduced the Direct
Supervision and Implementation Support policy in 2007 and terminated the
supervision agreement with UNOPS. The total supervision and implementation
support costs were US$ 19.8 million of which half was paid to cooperating
institutions (UNOPS held the lion’s share).104 This led to an increase in IFAD’s PMD
budget and, together with the termination of the agreement with UNOPS, allowed it
to accommodate costs for both direct supervision and country presence.
210. Between 2008 and 2010, the PMD budget increased significantly and
integrated the PDFF. In 2008, the budget of the Programme Development
Financing Facility (PDFF) was increased by US$3 million in real terms.105 In the
2009 budget, the PDFF was further increased by US$2 million, and an unspecified
part of the increase was attributed to strengthening of country presence, as IFAD
planned to substantially increase the number of existing and planned ICOs in 2009,
from 17 to 27. 106 A significant budget increase for country presence was approved
for 2010. The PDFF budget (US$42 million in 2009) was integrated with the
administrative budget in 2010, and the budget for country presence (excluding
outposted staff) was increased by US$2.8 million in real terms, reflecting the
planned increase in ICOs from 27 to 30.107
211. Then, between 2011 and 2015, the PMD budget remained almost flat in
spite of increasing country presence costs. In the 2011 budget document, five
new country offices were planned for 2011, bringing the total number to 35.108 The
costs of ICOs were budgeted at US$7.3 million, reflecting a real decrease of
US$500,000 from the 2010 budget of US$7.7 million. The costs of outposted staff
of US$4.2 million were included for the first time in country presence costs,
bringing the total costs to US$11.5 million. The PMD budget increased by US$7.6
million (US$6.7 million in real terms), and this was attributed to an expansion of
43 per cent in the programme of work, as well as the budget implication of more
intensive project design, supervision and implementation support.
103
Field Presence Pilot Programme, EB 2003/80/R.4, December 2003. 104
IFAD estimated that the full implementation of the 2007 supervision and implementation support policy was to increase annual supervision and implementation support costs between 4 and 12 per cent (from US$800,000 to US$2.4 million). IFAD Policy for Direct Supervision and Implementation Support (2007)
105 No specific reference was made to country presence costs: the increment was partly attributed to a 10 per cent
increase in the programme of work. The PDFF was a separate budget from IFAD’s administrative budget until 2010, and financed new project / programme development and management of the ongoing project portfolio.
EB 2007/92/R.2/Rev.1, December 2007. 106
EB 2008/95/R.2/Rev.1, December 2008. 107
EB 2009/98/R.2, November 2009. 108
EB 2010/101/R.2/Rev.1, December 2010.

Appendix EB 2016/119/R.10
54
212. Budgets for outposted staff and ICO non-staff costs increased in 2012 and 2013
while costs of local staff were lower. In 2012, the budget109 for country presence
costs was US$12.3 million, representing a real increase of US$600,000 over the
2011 budget. The increase reflected higher FTEs and costs of outposted staff and
higher non-staff costs that were partly offset by lower costs and FTEs of local staff.
213. Budget increases for country presence in 2014 and 2015 were driven by cost
increases for outposted staff, local staff and non-staff costs. Total country presence
costs in 2014 were budgeted at US$13.4 million,110 and the bulk of the increase
over 2013 was accounted for by a real increase of US$470,000 in local staff costs.
The budgeted total country presence costs in 2015111 were US$14.2 million, which
amounted to an increase of 6 per cent in real terms over 2014.
214. In 2016, an increase of US$2 million in country presence budgets was
approved as Management recognised that decentralization entailed
additional costs. This was the first time since 2011 that a major increment was
made to PMD’s and IFAD’s budget to finance higher country presence costs.112
Management proposed a budget increment of US$2 million to meet the costs of
establishing at least 5 new ICOs and other increased ICO costs.113 The budget for
recurrent administrative costs of ICOs for 2016 (i.e., excluding the costs of
outposted staff) was thus set at US$10.3 million.114 The March 2016 EB Update
paper also projected further increases of US$0.5 million in ICO costs each year in
2017 and 2018.115
215. IFAD’s ICO budgeted costs have increased from US$11.5 million in 2011 to
US$16.2 million in 2016. Over the five-year period, local staff costs have
increased by 13 per cent (but most of the increase occurred between 2015 and
2016), non-staff costs by 55 per cent and outposted staff costs by 40 per cent
(Table 3). Thus an increase in the costs of outposted of staff was combined with a
more modest overall increase in national staff costs. Non-staff costs have risen
significantly, reflecting the increase in outposted staff. The ICO costs increased
significantly as a proportion of PMD and IFAD’s administrative budget.
216. A comparison with multilateral development banks such as the African
Development Bank, the Asian Development Bank and the Inter-American
Development Bank shows that, for 2015, their country office costs as percentage of
the total cost of operations units ranged from 32 to 42 per cent (compared with 22
per cent in 2016) and country office costs as percentage of total costs of the
institution ranged from 18 to 24 per cent (compared with 10 per cent at IFAD).
109
EB 2011/104/R.2/Rev.1, December 2011. 110
EB 2013/110/R.2, November 2013. 111
EB 2014/113/R.2, November 2014. 112
In 2015, PMD’s budget increased by $0.5 million ($0.3 million in real terms); this increase was attributed in part to relocation costs associated with outposting and increased ICO presence. 113
US$720,000 was for increase in costs of national staff, US$700,000 was for higher IFAD contributions to support UN country-level development coordination through the resident coordinator’s office, and US$400,000 was for increases in non-staff administrative costs. 114
Source: EB Paper – Update on Country Presence, EB 2016/117/R.4, March 2016. 115
The estimated annual incremental costs are net of projected reductions in headquarters staffing costs of US$0.3 million each year in 2017 and 2018.
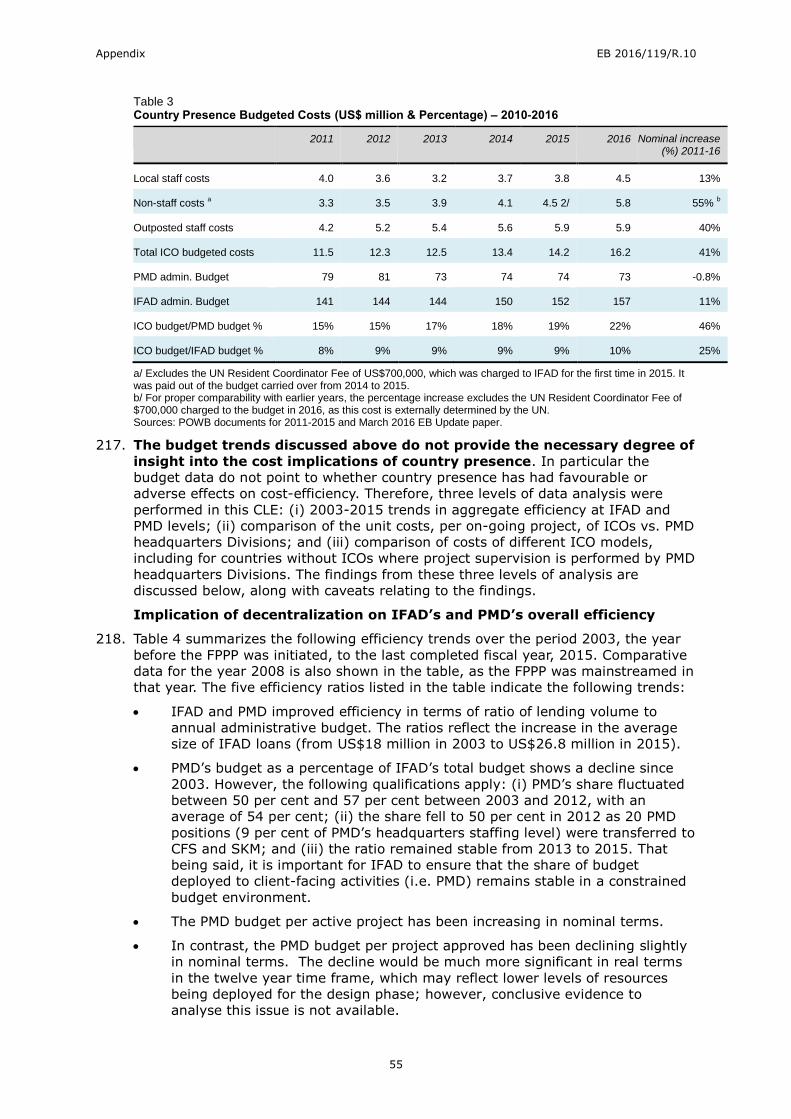
Appendix EB 2016/119/R.10
55
Table 3 Country Presence Budgeted Costs (US$ million & Percentage) – 2010-2016
2011 2012 2013 2014 2015 2016 Nominal increase (%) 2011-16
Local staff costs 4.0 3.6 3.2 3.7 3.8 4.5 13%
Non-staff costs a 3.3 3.5 3.9 4.1 4.5 2/ 5.8 55%
b
Outposted staff costs 4.2 5.2 5.4 5.6 5.9 5.9 40%
Total ICO budgeted costs 11.5 12.3 12.5 13.4 14.2 16.2 41%
PMD admin. Budget 79 81 73 74 74 73 -0.8%
IFAD admin. Budget 141 144 144 150 152 157 11%
ICO budget/PMD budget % 15% 15% 17% 18% 19% 22% 46%
ICO budget/IFAD budget % 8% 9% 9% 9% 9% 10% 25%
a/ Excludes the UN Resident Coordinator Fee of US$700,000, which was charged to IFAD for the first time in 2015. It was paid out of the budget carried over from 2014 to 2015. b/ For proper comparability with earlier years, the percentage increase excludes the UN Resident Coordinator Fee of $700,000 charged to the budget in 2016, as this cost is externally determined by the UN. Sources: POWB documents for 2011-2015 and March 2016 EB Update paper.
217. The budget trends discussed above do not provide the necessary degree of
insight into the cost implications of country presence. In particular the
budget data do not point to whether country presence has had favourable or
adverse effects on cost-efficiency. Therefore, three levels of data analysis were
performed in this CLE: (i) 2003-2015 trends in aggregate efficiency at IFAD and
PMD levels; (ii) comparison of the unit costs, per on-going project, of ICOs vs. PMD
headquarters Divisions; and (iii) comparison of costs of different ICO models,
including for countries without ICOs where project supervision is performed by PMD
headquarters Divisions. The findings from these three levels of analysis are
discussed below, along with caveats relating to the findings.
Implication of decentralization on IFAD’s and PMD’s overall efficiency
218. Table 4 summarizes the following efficiency trends over the period 2003, the year
before the FPPP was initiated, to the last completed fiscal year, 2015. Comparative
data for the year 2008 is also shown in the table, as the FPPP was mainstreamed in
that year. The five efficiency ratios listed in the table indicate the following trends:
IFAD and PMD improved efficiency in terms of ratio of lending volume to
annual administrative budget. The ratios reflect the increase in the average
size of IFAD loans (from US$18 million in 2003 to US$26.8 million in 2015).
PMD’s budget as a percentage of IFAD’s total budget shows a decline since
2003. However, the following qualifications apply: (i) PMD’s share fluctuated
between 50 per cent and 57 per cent between 2003 and 2012, with an
average of 54 per cent; (ii) the share fell to 50 per cent in 2012 as 20 PMD
positions (9 per cent of PMD’s headquarters staffing level) were transferred to
CFS and SKM; and (iii) the ratio remained stable from 2013 to 2015. That
being said, it is important for IFAD to ensure that the share of budget
deployed to client-facing activities (i.e. PMD) remains stable in a constrained
budget environment.
The PMD budget per active project has been increasing in nominal terms.
In contrast, the PMD budget per project approved has been declining slightly
in nominal terms. The decline would be much more significant in real terms
in the twelve year time frame, which may reflect lower levels of resources
being deployed for the design phase; however, conclusive evidence to
analyse this issue is not available.
Appendix EB 2016/119/R.10
56
219. Overall, the ratios shown in Table 4 indicate that decentralization has not had an
adverse effect on cost efficiency at the IFAD and PMD levels. This was due to two
primary reasons that are not directly connected with decentralization: (i) IFAD’s
and PMD’s budget growth has sharply slowed since 2011, constraining possible
growth in unit costs of projects approved and supervised; and (ii) the average size
of projects has increased, as mentioned earlier, leading to slower growth of the
PMD budget compared to lending volume. During interviews, some PMD staff
indicated a decreasing trend in budget for project design. If this were correct, it
may lead to deterioration in performance quality in the long term.
Table 4 Trends in IFAD and PMD Efficiency Ratios 2003, 2008 and 2015a (nominal terms)
Ratio / Percentage 2003 2008 2015 b Change
2003-2015
Ratio of Lending volume to IFAD administrative budget
6:1 5:1 8:1 33%
Percentage of PMD budget to IFAD Lending volume
12% 11% 6% -50%
PMD budget as a % of total IFAD administrative budget
55% 52% 49% -11%
PMD budget per active project US$227,000 US$283,000 US$292,000 29%
PMD budget per project approved US$2.05 million US$2.22 million US$1.93 million -6%
a/ 2003 – Year before FPPP was started; 2008 – Year in which FPPP was mainstreamed. b/ The 2015 data reflects the following staffing changes in 2012: 13 PMD positions in loans and grants function, and the related budget, were transferred to CFS; and 7 PMD positions in the grants secretariat, and the related budget, were transferred to SKM. Source: EB budget documents, PMD data and IOE analysis.
Operational cost-efficiency of ICOs vs. PMD headquarters
220. Actual costs of ICOs on budget execution and financial expenses are not
easily available. This is a serious gap in data availability which complicated the
strategic management of decentralization costs. There are two reasons for it: first,
IFAD lacks a cost accounting system that would enable the recording and reporting
of costs at the ICO level; for reporting on budget execution, costs are reported only
at the PMD Division level, combining headquarters and ICO costs. Second,
statements of expenditure from host agencies that process local staff compensation
and administrative transactions are often late, reportedly by up to six months in
some cases. Such delays hindered the reporting of the actual costs of ICOs in the
financial accounting system in a timely manner.116
221. Given the above constraints, an estimate of the average operational costs of
different modalities of country presence was made by combining data on financial
commitments for certain expenditure categories in 2015 (e.g., design and
supervision) with budgets for 2016 (staff and non-staff cost budgets). In particular,
the cost estimates for the “without ICO” case include design and supervision cost
data and imputed headquarters CPM and GS staff costs (whether in the field or at
the headquarters, a country programme requires a CPM and a programme
assistant). In the “with ICO” case, the estimates include the above as well as ICO
staff and non-staff cost data.
116
At year-ends, CFS estimates actual expenses by calculating accruals (i.e. expenses incurred but not yet reported by host agencies) on the basis of ICOs’ budgets. While it is likely that this methodology results in substantial accuracy of reported expenses, it is important to record actual expenses as they are incurred for budget and financial reporting. An alternative option could be to set up each ICO or country as a cost centre and record commitments in each cost centre, which could be used for expense reporting.

Appendix EB 2016/119/R.10
57
222. Average design and supervision costs and operational costs per on-going
project are lower with ICOs. This can be clearly seen from Table 6 (average
supervision costs are US$ 56,370 against US$ 94,078; average operational costs
are US$ 137,757 against US$ 179,035). It may be inferred that the cost efficiency
gains are related inter alia to: (i) more use of national staff (vs. consultants); and
(ii) lower international travel costs.
223. While the CPM-led ICO is a relatively costly configuration, sub-regional
hubs generate cost-efficiency gains. Table 5 illustrates per-country average
operational costs of different ICO modalities. They are higher for countries with a
CPO-led office than for countries without an ICO. With a CPM-led office, average
costs per country increase but decrease when sub-regional hubs are considered.
This is because hubs are serving several countries (typically 3 or 4) without having
to replicate the country office structure in all of them.117 In the case of per-project
average operational costs (Table 6), a slightly different pattern is observed. Moving
from “without ICO” to CPO-led ICO, average costs per project decline. They
increase in correspondence with the CPM-led modality and decline under the sub-
regional hub modality.
Table 5 Average per country operational costs of different country presence models (US$)
Models of Country Presence
Staff Costs (HQ and ICO)
a
Non-Staff ICO Costs
b
Design and Supervision
Costs c
Sum
Overall Without ICO
58 408 - 64 679 123 087
Overall With ICO 222 880 64 687 199 173 486 740
CPO-led 197 178 43 645 184 926 425 749
CPM-led 266 392 105 228 279 489 651 109
Sub-regional hub 163 978 40 200 152 012 356 190
Table 6 Average per project operational costs of different country presence models (US$)
Models of Country Presence
Staff Costs (HQ and ICO)
a
Non-Staff ICO Costs
b
Design and Supervision
Costs c
Sum
Overall Without ICO
84 957
94 078 179 035
Overall With ICO 63 079 18 308 56 370 137 757
CPO-led 52 033 11 518 48 800 112 351
CPM-led 74 777 29 538 68 647 172 962
Sub-regional hub 71 601 8 962 64 320 144 883
a/ Includes the average cost of ICO staff (for “the with-ICO” case) per country / project served and staff at the headquarters (GS and CPM when HQ-based) per country / project served. b/ Includes average local non-staff costs per country / project served, differentiated by model of country presence. c/ Average design and supervision costs, per country / project served, differentiated by model of country presence. Sources of information: PMD and HR data and IOE analysis; costs of with-ICO and without-ICO models are based on 2016 budgets, except for supervision and design costs, based on PMD expenditure commitment data for 2015.
224. When the headquarters costs of support to ICOs are included, the total
costs of decentralization for IFAD are higher than those at the PMD-level
reported in EB budget documents. This CLE estimates costs of country presence
in 2016 for IFAD at US$21.3 million. This includes estimated headquarters support
costs of US$5.1 million (Table 7) and the US$16.2 million of PMD costs reported in
the 2016 budget document. This figure represents a tentative estimate of the total
117
The case of a regional office of Nairobi is not reported in the table due its peculiarity (it is de facto a regional hub with additional staff from CFS) which makes it less clear how to impute costs to individual countries.

Appendix EB 2016/119/R.10
58
resources deployed by IFAD for decentralized operations and is a conservative
estimate as it does not take into account, for example, the staff costs of other non-
CPM professional staff members at the headquarters who support the country
offices. It also does not factor in indirect costs for other service divisions.
Table 7 IFAD – Estimated Costs of Decentralization in 2016
Cost Components US$ Million
Total ICO budgets 10.9
Total outposted staff budget 5.3
Total country presence costs – PMD 16.2
FSU budget 1.0
Imputed costs of PMD headquarters GS staff supporting ICOsa 4.1
Total country presence costs – IFAD b 21.3
a/ Based on estimated average salaries and benefits of 52 GS staff that support ICOs; data on the number of GS staff was provided by PMD, and salaries and benefits data was obtained from HR. The underlying assumption is that these staff members are engaged full-time in supporting ICOs. b/ Costs of other business units, e.g., CFS and ADM that could be specifically attributed to country presence are not considered to be material, as most of the activities of these units would need to be performed even without the establishment of ICOs. Source: PMD and HR data.
Managing future costs
225. Incremental costs of ICOs – local staff and non-staff – are projected at
around US$250,000, which is one measure of the costs of expanding
country presence. The figure of US$250,000 is derived from the projected budget
increase of US$1 million over 2017-2018 for establishing 4 new ICOs.118 This
estimate excludes outposted staff costs.
226. The case for opening additional country offices, beyond the current
operational ones, requires clear justification. As of July 2016, the current 39
functioning ICOs covered 76 per cent of IFAD’s current active projects portfolio. If
ten additional country offices were added (according to the plans in the EB 2016
April Update), then the country offices would cover 83 per cent of IFAD’s active
portfolio, an increment of only 7 per cent. This is a minor increase, while
incremental costs would be in the order of US$ 2.5 million. Given the incremental
costs, the issue of value-added from new offices vs. their costs is an important one.
227. PMD staffing levels at headquarters have remained unchanged since 2008
when the FPPP was mainstreamed. The total number of PMD staff has grown
from 194 in 2008 to 305 (budgeted positions) in 2016, while the number of ICO
staff, including outposted staff, has increased over the same period from 5 to 107
(about 16 per cent of total IFAD staff).119 120 The increase in PMD total staff (and
its headquarters staff) would have been higher without the transfer of 20 staff to
other units in 2012. Thus PMD’s Headquarters staffing level has remained virtually
unchanged while IFAD has added staff in ICOs.121 The only way to reap significant
118
March 2016 Update paper para. 44: Total incremental costs of 4 new ICOs were projected at US$1.59 million, which would be partly offset by savings of US$0.6 million in headquarters staff costs. The average incremental cost for 2017-2018 is higher than the 2016 budget of US$229,000 (US$10.3 million for 45 offices) per ICO. 119
According to the EB 2016 Update: “Staffing in ICOs has increased significantly in recent years. The recruitment of national staff grew by 10 per cent from 2013 to 2015, bringing the number from 63 to 70. As part of the 2016 strategic workforce exercise, another increase is envisioned, raising the total number of international and nationally recruited field staff to nearly 100. This means that country office staff will constitute 35 per cent of all PMD staff”. 120
As a comparison, in Regional MDBs outposted staff was typically 23 to 38 per cent with an average office size of 18-22 staff members 121
This trend was also noted in the 2013 corporate level evaluation of IFAD’s efficiency: …”it appears that the number of country offices and costs are rising without offsetting reductions in Rome. Such higher costs reduce efficiency unless proportionately higher benefits are achieved.”
Appendix EB 2016/119/R.10
59
cost efficiency gains from decentralization would have been to reduce headquarters
staff, something which IFAD has been reluctant to do.
228. The sub-regional hub modality has the potential to increase cost-efficiency
under certain conditions. In the 2016 EB Update paper it was stated that the
advantage of the hubs was that they enabled a more optimal sharing of
responsibilities and tasks among CPMs and other technical staff. However, the
paper also noted the example of the Guatemala hub: “LAC created the hub in order
to provide a higher level of attention to countries in the region while avoiding the
creation of offices in countries with few projects and limited administrative
budgets.” The sub-regional hub model offers the potential to increase the cost-
efficiency of ICOs. However, this requires supplementary measures such as not
creating new ICOs or closing some of the ICOs covered by a hub, and reducing
headquarters’ staff. A modelling exercise to explore these opportunities is
presented later in this Chapter and in Annex VII.
229. In summary, while opening country offices implied additional costs, this has not
led to uncontrolled PMD and IFAD administrative budget growth. Before 2011, this
was possible thanks to: (i) the termination of the agreement with UNOPS, which
allowed PMD to use the related budget for incremental costs of direct supervision
and country presence; and (ii) PMD budget increases in 2008-2010. PMD managed
to expand country presence from 2011 to 2015 within its largely flat budgets. It is
possible that the level of resources dedicated to project design has decreased,
although there is no conclusive evidence. On the other hand, PMD staffing levels
at the headquarters have not been reduced as decentralization has proceeded.
230. Looking at average per project operational costs, those in the “with ICO” case are
lower than those in the “without ICO case” (indicating possible efficiency gains of
country presence). Between alternative ICO configurations, average operational
costs per country and per project are highest for the CPM-led model but sub-
regional hubs show some economies of scale (Tables 5 and 6).
231. Overall, PMD budget has been able to absorb a considerable cost increase. Data are
not available at the desired disaggregated level and consistently over the years but
the findings of the previous chapters suggest that the current resource envelope
has allowed PMD to ensure programme management, project design, supervision
and implementation support but not a commensurate enhancement in non-lending
activities. Taking into account these findings, the rating on management of the
costs of decentralization at the corporate level is moderately satisfactory.
B. Institutional structure and organizational arrangements
B.1 Current organizational arrangements for decentralized offices and regional divisions
232. There is currently a gradation of organizational arrangements at the
country level (see Annex IV Tables 32-36 for a summary of regional workshop
discussions on different modalities). The main modalities are:
No country presence, where all matters are handled directly from
headquarters. There may also be a consultant on a retainer contract (referred
to as focal point) who follows-up matters on behalf of the Regional Division,
reporting to the CPM.122 Strategy, Programme and operational matters are all
handled from Headquarters by a CPM assisted by a Programme Assistant
(PA). In most cases the HQ based CPM and PA are handling several countries
of the Region.
An office headed by a national professional officer who normally has the title
of Country Programme Officer (CPO), sometimes with one or more associate
122
This arrangement has been common in the NEN Division and is also used to varying degrees by other regional divisions for countries in which they do not have offices.
Appendix EB 2016/119/R.10
60
CPOs and with one country programme assistant (CPA), with the reporting
line to the CPM who may be in Headquarters, or in another ICO.
An office headed by an international CPM, normally with the title of Country
Director and generally with one CPO and one or more CPAs of whom one may
be specific to programme and the other to administration.123 The reporting
line of the CPM (Country Director) remains to the Regional Division
Director.124 Many CPM headed offices often cover more than one country.
Many CPM headed ICOs have a number of consultants and short-term
national staff working in them on a more or less continuous basis. These are
employed under the project supervision and design budgets.125
Hubs serving sub-regions: in the LAC and Asia and Pacific regions
(Guatemala, Peru, Vietnam) there may be more than one CPM in a hub office,
in which case one CPM is normally more junior and the lead CPM is the
Country Director (or Sub-regional Coordinator). The Nairobi Regional Office is
a special case but serves as a hub. Its origins are in the UNOPS office in
Nairobi that served supervision of IFAD-funded projects in Africa (see Box 4).
Box 4 The Nairobi Regional Office
Background: Until 2007 there was a UNOPS office in Nairobi for the supervision of IFAD projects in Africa. When UNOPS supervision was terminated and IFAD took up the responsibility, some UNOPS national staff were transferred to IFAD. The former Controller’s and Financial Services Division (CFS) out-posted financial management staff for East and Southern Africa and staff working on processing of withdrawal applications for both East and Southern Africa and West and Central Africa to Nairobi.
A technical adviser on land tenure moved to Nairobi with responsibilities for
programme support in East and Southern Africa but moved back to Rome after two years. A Regional Environment Specialist was based in Nairobi for a few years. A regional gender and youth technical advisor was appointed as a national professional and a national post has also been advertised for an environment and climate change advisor. Previously, an out-posted FSU staff member supported fiduciary management improvement for the region.
Programme support: Kenya is an airline hub with daily flights to East African countries and good telecommunications. There is adequate office space. Overall management of the office was assigned to an out-posted CPM (Country Director), with varying responsibilities for other countries and currently covers Madagascar, Mauritius and Seychelles, in addition to Kenya (some country programme work has been retained in Rome for the Indian Ocean islands). Although the office is referred to as a regional
office, it is in reality a hub-office for the purposes of programme support. Nairobi has
also provided a good focal point for training events and meetings for East and Southern Africa. Kenya benefits from an educated workforce and provides a good location for regional advisors.
Source: CLE Kenya case study (2016)
233. The PMD regional divisions have also grouped ICO and Headquarters staff
for purposes of mutual support and for knowledge management. The
groups are more fluid than the ICO structure and are at varying stages of
institutionalization:126
123
The office may also include other staff and consultants on temporary contracts and can include Junior Professional Officers (JPOs-APOs) paid for by donor governments through trust funds (additional temporary staff are sometimes found in offices headed by CPOs, but to a lesser extent). 124
The majority of CPM/Country Directors (14 out of 22) have responsibility for one or more neighbouring countries (with or without ICO). Some CPM/Country Directors in large countries, or if they are more junior (P4) serve a single country. 125
The supervision and design budgets are annual variable cost-allocations managed by the Regional Divisions for travel, consultants, etc. They do not include regular staff or the administrative budgets for ICOs, although savings on vacant posts are fungible and accrue to this allocation (allotment). 126
Staff also sometime refer to the Groups as Hubs
Appendix EB 2016/119/R.10
61
Geographical groups have been identified particularly in WCA and APR,
including both HQ and staff in a sub-region. Some HQ staff, including CPMs
and GS may be included in more than one group. At least on paper, this form
of group appears to lack coherence and clarity on reporting lines and it also
appears inefficient to have staff responsible for only part of the countries in a
group and part in one or more other groups. The reason this has evolved may
be due to pragmatic distribution of CPM responsibilities in a manner that is
consistent with the availability of staff.
Groups are also envisaged, but not yet operational, with a wider mandate,
based on similarity of the countries, knowledge management and some
degree of back-up by CPMs to each other. In the case of LAC two of the three
envisaged knowledge management groups are based on existing hubs with
two CPMs each. The APR model includes the Vietnam hub and, in NEN, an
office is envisaged for Ankara in Turkey with some hub responsibilities vis-à-
vis central Asia. In ESA and, to some extent WCA, the groups do not include
any particular postings of staff in a single location (e.g., Tanzania, Rwanda
and Uganda are envisaged for a group but the CPMs are currently planned to
remain in Tanzania and Uganda).
234. There are considerable differences in the extent to which regional
divisions are decentralised and the models they have employed for
decentralization. East and Southern Africa (ESA) currently has two CPMs in
headquarters and five P5 senior CPMs in the region cover one or more additional
countries and West and Central Africa is similar. However, NEN has only two ICOs
with international staff in Sudan and recently Egypt and a nationally headed ICO in
Morocco. Latin America has pioneered a hub model and headquarters-based groups
have been the norm in Asia and the Pacific with one hub in Hanoi.
235. In the regional divisions, only slightly above half of the staff are
headquarter-based. However, international and general service staff are
still predominantly headquarter-based. Compared to ten years ago, there
have been important changes, notably the recruitment of a high number of national
staff and some outposting of staff from the headquarters. APR, ESA and WCA have
now slightly more budgeted regular staff in the field than at the headquarters.
However, there is scope for further adjustments. Staff classified as CPMs fell from
55 in 2011 to 48 in 2016 (only P4-P5 can now be CPMs) but 68 percent of
professional staff remain in the headquarters (Table 8) and all divisions have large
front office and cross-country teams. Only WCA has more international staff in the
field than at the headquarters. The international professional staff in country are
almost exclusively P4 and P5 CPMs. The rationale for retaining junior professionals
in headquarters rather than supporting CPMs and gaining experience in ICOs is not
clear. Moreover, two thirds of general service staff are still at the headquarters.
The potential cost-savings of greater restructuring have thus not been realised.
With the exception of CPMs, the decentralization has led to an expansion in the
numbers of staff (national and international), with large proportions of professional
and General Service staff remaining in the headquarters.
236. According to the E-survey, IFAD outposted staff supported the idea of transferring
staff from Rome to ICOs while HQ staff were almost equally split between favouring
and disagreeing. All categories of staff favoured transferring personnel to the
regions (e.g. hubs, no necessarily individual country offices; see Table 9). Also, all
categories of staff strongly favoured recruiting more local staff for ICOs: to remain
cost-neutral this would require reducing the numbers of staff in headquarters and
some consolidation of transaction and administrative type functions to hub offices,
rather than dealing with them in all individual ICOs. No evidence was found that
there had been a functional analysis on decentralized functions and the pattern of
change appears to have been largely left to the individual divisions.

Appendix EB 2016/119/R.10
62
Table 8
Staff Distribution by Regional Division (budgeted regular staff posts) in 2016
Percentage of Regional Division staff in Number of total staff in this group
HQ ICOs
APR International Professionals 79% 21% 19
National Professionals 100% 20
Total General Service 79% 21% 14
Total APR Staff 49% 51% 53
ESA International Professionals 53% 47% 19
National Professionals 100% 10
Total General Service 65% 35% 20
Total ESA Staff 47% 53% 49
LAC International Professionals 71% 29% 17
National Professionals 100% 3
Total General Service 54% 46% 13
Total LAC Staff 58% 42% 33
NEN International Professionals 89% 11% 19
National Professionals 100% 7
Total General Service 77% 23% 13
Total NEN Staff 69% 31% 39
WCA International Professionals 48% 52% 21
National Professionals 100% 13
Total General Service 60% 40% 20
Total WCA Staff 46% 54% 54
Sum
Reg.
Div.
International Professionals 68% 32% 95
National Professionals 0% 100% 53
Total General Service 66% 34% 80
Total All Staff 53% 47% 228
Source IFAD Staff Tables June 2016.
Table 9 Questionnaire Response Summary Future of ICOs
Headquarters Staff CPMs Serving in Country CPOs
Disagree Agree Disagree Agree Disagree Agree
IFAD should: Transfer more staff from Rome to ICOs
48% 52% 15% 85% 28% 72%
Transfer more staff from Rome to the regions
25% 75% 22% 88% 13% 87%
Strengthen ICOs by recruiting more local staff
14% 86% 0% 100% 6% 94%
Responses to the CLE E-survey (2015).
237. There are some inconsistencies in organization at the country level. It was
observed during country visits that sometimes CPMs and CPOs seemed to be

Appendix EB 2016/119/R.10
63
duplicating parts of each other’s work. There was positive evidence that some
functions which require a CPM could be carried out from a hub location such as
chairing donor-government sector groups.127 There were good examples of sharing
consultancy services and some GS staff servicing neighbouring countries128 from
the hubs in Kenya, Vietnam, Guatemala and Peru.
238. In sum, in about thirteen years, regional divisions have been able to establish 40
country offices (currently 39 are operational) and have recruited over 100 new
national staff members, while outposting some of their staff, especially those
serving Africa. This has been a short process when compared to other Multilateral
Development Banks. At the same time, there has been no commensurate
reorganization of the headquarters divisions. With the exception of CPMs, this has
led to an expansion in the numbers of staff (national and international) with large
proportions of professional staff and GS staff remaining in the headquarters. The
rating for current organizational arrangements for decentralized offices and
regional divisions is thus moderately satisfactory.
Organizational questions moving forward
239. Sub-regional hubs have a number of potential advantages. Apart from
Nairobi, the other hubs have only been in place for a relatively short-time but there
is evidence to argue that they can be cost-efficient and effective in servicing
countries. These arguments are drawn from cost estimates in this Chapter (Tables
5 and 6) and from interviews with IFAD staff as well as representatives from
member state governments and other in-country stakeholders and discussions held
at the CLE regional workshops. In synthesis, sub-regional hubs:
Strategically: provide a sub-regional thematic perspective, facilitate cross-
border approaches (e.g. in case of similar agro-ecology, institutional and
cultural context) and facilitate engagement in sub-regional fora and inter-
governmental schemes;
Enhance stability, reduce isolation: provide better continuity and flexibility in
serving countries, despite staff turn-over, illness and vacations. They can also
provide training ground for national and international staff;
Enhance rationalization of staff and consultants: allow the use of national
professionals outside their own country and use consultants more efficiently
across countries including for procurement. There is also the possibility to
consider some hubs hosting regional or sub-regional advisers (national or
international) as is already the case in Africa and is underway for
environment advisers in ESA, WCA, APR and LAC. This allows countries to be
supported more efficiently and appropriately with small CPO headed ICOs, or
without ICOs. Concentration of GS transaction, document processing and
monitoring in low-cost duty stations where adequate controls and segregation
can be assured improves cost efficiency;
Facilitate economies of scale and ease of access in international travel and
help overcome time zone issues. While larger hub offices will have higher
costs for space and require more administration, they also allow for
efficiencies in administration, downsizing the physical space for some existing
non-hub ICOs and more efficient use of GS staff who will be familiar with the
tasks they undertake frequently rather than intermittently.
240. However, there is a danger of a drift toward hubs based on the present
structure without functional analysis of the hub structure or the tasks to be
performed by hubs and those to be performed in headquarters.
127
E.g. Chairing from Hanoi in Cambodia 128
E.g. The hubs in in Vietnam, Peru and Guatemala and the Tanzania office which also serves Rwanda which has a CPO headed ICO.

Appendix EB 2016/119/R.10
64
241. A modelling exercise to study the availability of alternative organization
arrangements. To explore the implication of alternative options for regional
divisions, this CLE modelled an illustrative direction of change for a hub and ICO
network with a restructuring of headquarters regional divisions around a
decentralised model with hubs (Annex VII). This is not equivalent to recommending
a specific option but the exercise helped substantiate the argument that
approaches exist and may provide inputs in devising alternatives.
242. The intention in modelling was to achieve staff cost-neutrality and, if possible, a
saving, while increasing efficiency and effectiveness. The modelling exercise only
took account of regular staff costs. Establishment costs and administrative costs
were not covered in this exercise. Some offices could downsize and there could be
some savings. As the model would carry out more work in the regions, travel costs
may be neutral.
243. The modelling approach included, with exceptions: (i) a senior CPM in each hub
supported by one international professional in the hub and national professionals
and GS; (ii) ICOs supported from the hub, generally having no or a single GS and
usually no CPM; (iii) headquarters divisions (except NEN) having a front office team
and an ICO country support team (with two P5s and 2 senior GS). With the
exception of NEN and a few countries with no programme, all the CPMs were
decentralised but the possibility for rotation was preserved by maintaining 2 P5s in
each country support team.
244. This modelling exercise indicatively achieves an overall reduction in staff budgeted
costs of US$ 1.3 million for regional divisions, with lower budgeted costs at the
headquarters of US$ 5.5 million and increased budgeted staff costs in the field of
US$ 4.2 million. Some modest decrease of budgeted costs is achieved for two
divisions (ESA, NEN) and some modest increase for one division (LAC). More
sizeable modelled reductions emerged in divisions which had staff concentrated in
headquarters (APR, WCA).129 Most of the modelled divisional savings reflect an
assumption of transfer of junior professional responsibilities in part to national
professionals and a transfer of GS responsibilities to the field with a net increase in
field GS staff and reduction at the headquarters (further details in Annex VII).
B.2 Host country arrangements and service-level agreement with host agencies
245. Host Country Agreements were initially not seen as essential for piloting
IFAD’s country presence but have become over time important
prerequisites, especially for posting international staff. During the pilot
phase, most staff were national and the ICO was hosted, and staff employed, by
another UN agency which had a long-standing presence and the associated
privileges and immunities. However, as IFAD moved to establish formal presence,
employ staff directly and to deploy CPMs as Representatives, IFAD country offices
needed recognition of the privileges and immunities extended to UN system
agencies and MDBs.
246. Where countries are signatories to the Convention on the Privileges and Immunities
of the Specialized Agencies,130 specific provisions for IFAD are covered in an Annex
to the Convention which only four countries have signed. As of June 2016, out of
the 39 countries where ICOs were operational, 12 had not ratified the Specialized
129
More precisely, the modelling exercise yields a budgeted staff cost reduction of US$ 492,501 for APR; US$ 855,672 for WCA; US$ 126,780 for NEN; US$ 63,246 for ESA; and an increase of US$ 227,975 for LAC. 130
The specialized Agencies Convention applies to those international organizations that had entered into special relationship agreements with the United Nations pursuant to Article 63 of the Charter and contains approximately the same provisions and immunities as the Convention on the Privileges and Immunities of the United Nations.
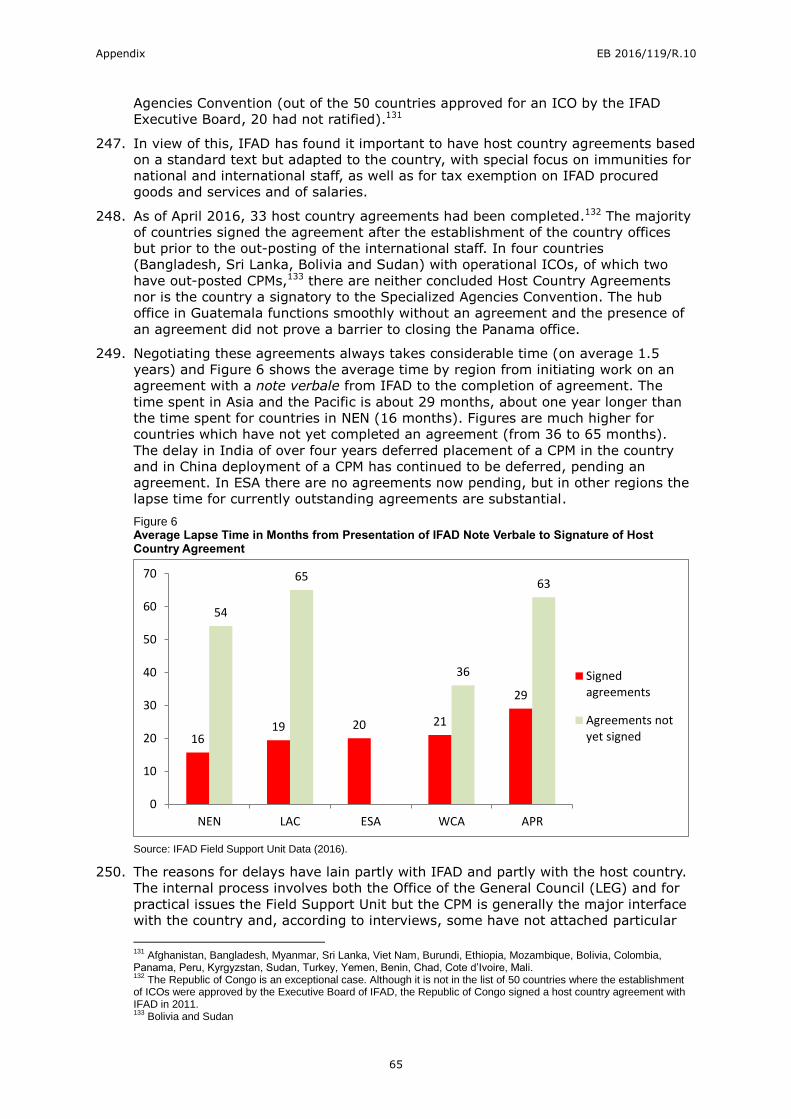
Appendix EB 2016/119/R.10
65
Agencies Convention (out of the 50 countries approved for an ICO by the IFAD
Executive Board, 20 had not ratified).131
247. In view of this, IFAD has found it important to have host country agreements based
on a standard text but adapted to the country, with special focus on immunities for
national and international staff, as well as for tax exemption on IFAD procured
goods and services and of salaries.
248. As of April 2016, 33 host country agreements had been completed.132 The majority
of countries signed the agreement after the establishment of the country offices
but prior to the out-posting of the international staff. In four countries
(Bangladesh, Sri Lanka, Bolivia and Sudan) with operational ICOs, of which two
have out-posted CPMs,133 there are neither concluded Host Country Agreements
nor is the country a signatory to the Specialized Agencies Convention. The hub
office in Guatemala functions smoothly without an agreement and the presence of
an agreement did not prove a barrier to closing the Panama office.
249. Negotiating these agreements always takes considerable time (on average 1.5
years) and Figure 6 shows the average time by region from initiating work on an
agreement with a note verbale from IFAD to the completion of agreement. The
time spent in Asia and the Pacific is about 29 months, about one year longer than
the time spent for countries in NEN (16 months). Figures are much higher for
countries which have not yet completed an agreement (from 36 to 65 months).
The delay in India of over four years deferred placement of a CPM in the country
and in China deployment of a CPM has continued to be deferred, pending an
agreement. In ESA there are no agreements now pending, but in other regions the
lapse time for currently outstanding agreements are substantial.
Figure 6 Average Lapse Time in Months from Presentation of IFAD Note Verbale to Signature of Host Country Agreement
Source: IFAD Field Support Unit Data (2016).
250. The reasons for delays have lain partly with IFAD and partly with the host country.
The internal process involves both the Office of the General Council (LEG) and for
practical issues the Field Support Unit but the CPM is generally the major interface
with the country and, according to interviews, some have not attached particular
131
Afghanistan, Bangladesh, Myanmar, Sri Lanka, Viet Nam, Burundi, Ethiopia, Mozambique, Bolivia, Colombia, Panama, Peru, Kyrgyzstan, Sudan, Turkey, Yemen, Benin, Chad, Cote d’Ivoire, Mali. 132
The Republic of Congo is an exceptional case. Although it is not in the list of 50 countries where the establishment of ICOs were approved by the Executive Board of IFAD, the Republic of Congo signed a host country agreement with IFAD in 2011. 133
Bolivia and Sudan
16 19 20 21
29
54
65
36
63
0
10
20
30
40
50
60
70
NEN LAC ESA WCA APR
Signedagreements
Agreements notyet signed
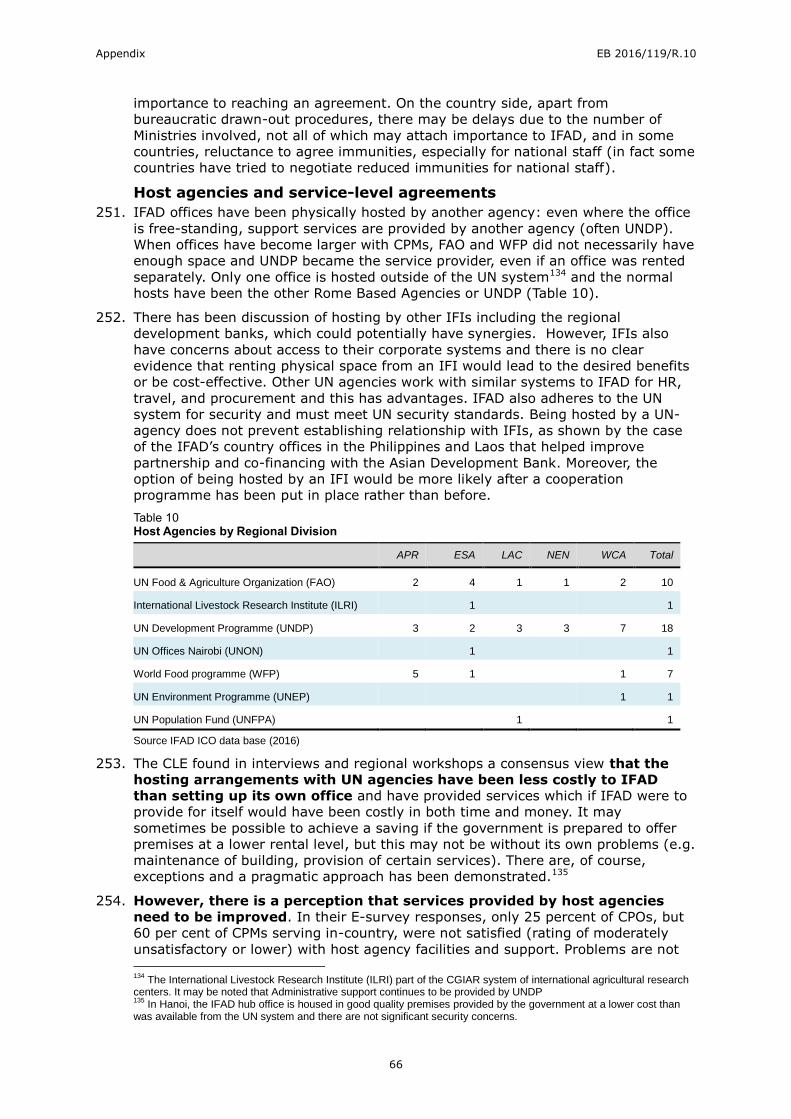
Appendix EB 2016/119/R.10
66
importance to reaching an agreement. On the country side, apart from
bureaucratic drawn-out procedures, there may be delays due to the number of
Ministries involved, not all of which may attach importance to IFAD, and in some
countries, reluctance to agree immunities, especially for national staff (in fact some
countries have tried to negotiate reduced immunities for national staff).
Host agencies and service-level agreements
251. IFAD offices have been physically hosted by another agency: even where the office
is free-standing, support services are provided by another agency (often UNDP).
When offices have become larger with CPMs, FAO and WFP did not necessarily have
enough space and UNDP became the service provider, even if an office was rented
separately. Only one office is hosted outside of the UN system134 and the normal
hosts have been the other Rome Based Agencies or UNDP (Table 10).
252. There has been discussion of hosting by other IFIs including the regional
development banks, which could potentially have synergies. However, IFIs also
have concerns about access to their corporate systems and there is no clear
evidence that renting physical space from an IFI would lead to the desired benefits
or be cost-effective. Other UN agencies work with similar systems to IFAD for HR,
travel, and procurement and this has advantages. IFAD also adheres to the UN
system for security and must meet UN security standards. Being hosted by a UN-
agency does not prevent establishing relationship with IFIs, as shown by the case
of the IFAD’s country offices in the Philippines and Laos that helped improve
partnership and co-financing with the Asian Development Bank. Moreover, the
option of being hosted by an IFI would be more likely after a cooperation
programme has been put in place rather than before.
Table 10 Host Agencies by Regional Division
APR ESA LAC NEN WCA Total
UN Food & Agriculture Organization (FAO) 2 4 1 1 2 10
International Livestock Research Institute (ILRI) 1 1
UN Development Programme (UNDP) 3 2 3 3 7 18
UN Offices Nairobi (UNON) 1 1
World Food programme (WFP) 5 1 1 7
UN Environment Programme (UNEP) 1 1
UN Population Fund (UNFPA) 1 1
Source IFAD ICO data base (2016)
253. The CLE found in interviews and regional workshops a consensus view that the
hosting arrangements with UN agencies have been less costly to IFAD
than setting up its own office and have provided services which if IFAD were to
provide for itself would have been costly in both time and money. It may
sometimes be possible to achieve a saving if the government is prepared to offer
premises at a lower rental level, but this may not be without its own problems (e.g.
maintenance of building, provision of certain services). There are, of course,
exceptions and a pragmatic approach has been demonstrated.135
254. However, there is a perception that services provided by host agencies
need to be improved. In their E-survey responses, only 25 percent of CPOs, but
60 per cent of CPMs serving in-country, were not satisfied (rating of moderately
unsatisfactory or lower) with host agency facilities and support. Problems are not
134
The International Livestock Research Institute (ILRI) part of the CGIAR system of international agricultural research centers. It may be noted that Administrative support continues to be provided by UNDP 135
In Hanoi, the IFAD hub office is housed in good quality premises provided by the government at a lower cost than was available from the UN system and there are not significant security concerns.
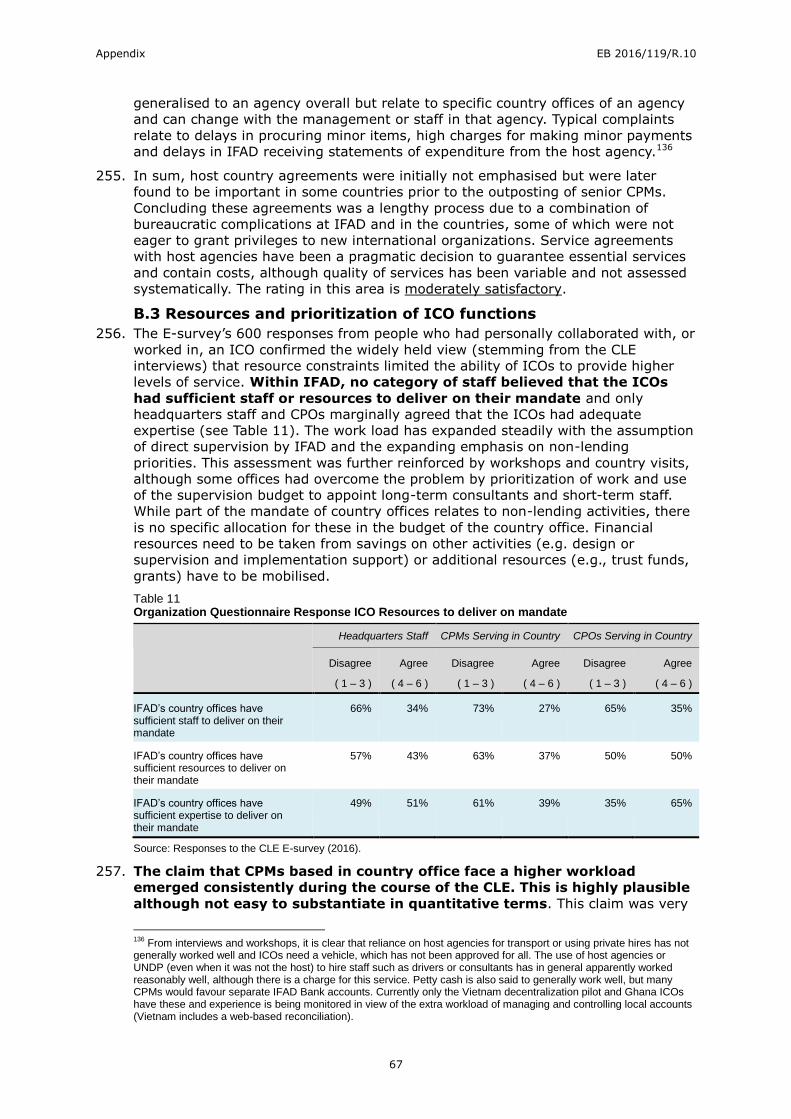
Appendix EB 2016/119/R.10
67
generalised to an agency overall but relate to specific country offices of an agency
and can change with the management or staff in that agency. Typical complaints
relate to delays in procuring minor items, high charges for making minor payments
and delays in IFAD receiving statements of expenditure from the host agency.136
255. In sum, host country agreements were initially not emphasised but were later
found to be important in some countries prior to the outposting of senior CPMs.
Concluding these agreements was a lengthy process due to a combination of
bureaucratic complications at IFAD and in the countries, some of which were not
eager to grant privileges to new international organizations. Service agreements
with host agencies have been a pragmatic decision to guarantee essential services
and contain costs, although quality of services has been variable and not assessed
systematically. The rating in this area is moderately satisfactory.
B.3 Resources and prioritization of ICO functions
256. The E-survey’s 600 responses from people who had personally collaborated with, or
worked in, an ICO confirmed the widely held view (stemming from the CLE
interviews) that resource constraints limited the ability of ICOs to provide higher
levels of service. Within IFAD, no category of staff believed that the ICOs
had sufficient staff or resources to deliver on their mandate and only
headquarters staff and CPOs marginally agreed that the ICOs had adequate
expertise (see Table 11). The work load has expanded steadily with the assumption
of direct supervision by IFAD and the expanding emphasis on non-lending
priorities. This assessment was further reinforced by workshops and country visits,
although some offices had overcome the problem by prioritization of work and use
of the supervision budget to appoint long-term consultants and short-term staff.
While part of the mandate of country offices relates to non-lending activities, there
is no specific allocation for these in the budget of the country office. Financial
resources need to be taken from savings on other activities (e.g. design or
supervision and implementation support) or additional resources (e.g., trust funds,
grants) have to be mobilised.
Table 11 Organization Questionnaire Response ICO Resources to deliver on mandate
Headquarters Staff CPMs Serving in Country CPOs Serving in Country
Disagree
( 1 – 3 )
Agree
( 4 – 6 )
Disagree
( 1 – 3 )
Agree
( 4 – 6 )
Disagree
( 1 – 3 )
Agree
( 4 – 6 )
IFAD’s country offices have sufficient staff to deliver on their mandate
66% 34% 73% 27% 65% 35%
IFAD’s country offices have sufficient resources to deliver on their mandate
57% 43% 63% 37% 50% 50%
IFAD’s country offices have sufficient expertise to deliver on their mandate
49% 51% 61% 39% 35% 65%
Source: Responses to the CLE E-survey (2016).
257. The claim that CPMs based in country office face a higher workload
emerged consistently during the course of the CLE. This is highly plausible
although not easy to substantiate in quantitative terms. This claim was very
136
From interviews and workshops, it is clear that reliance on host agencies for transport or using private hires has not generally worked well and ICOs need a vehicle, which has not been approved for all. The use of host agencies or UNDP (even when it was not the host) to hire staff such as drivers or consultants has in general apparently worked reasonably well, although there is a charge for this service. Petty cash is also said to generally work well, but many CPMs would favour separate IFAD Bank accounts. Currently only the Vietnam decentralization pilot and Ghana ICOs have these and experience is being monitored in view of the extra workload of managing and controlling local accounts (Vietnam includes a web-based reconciliation).
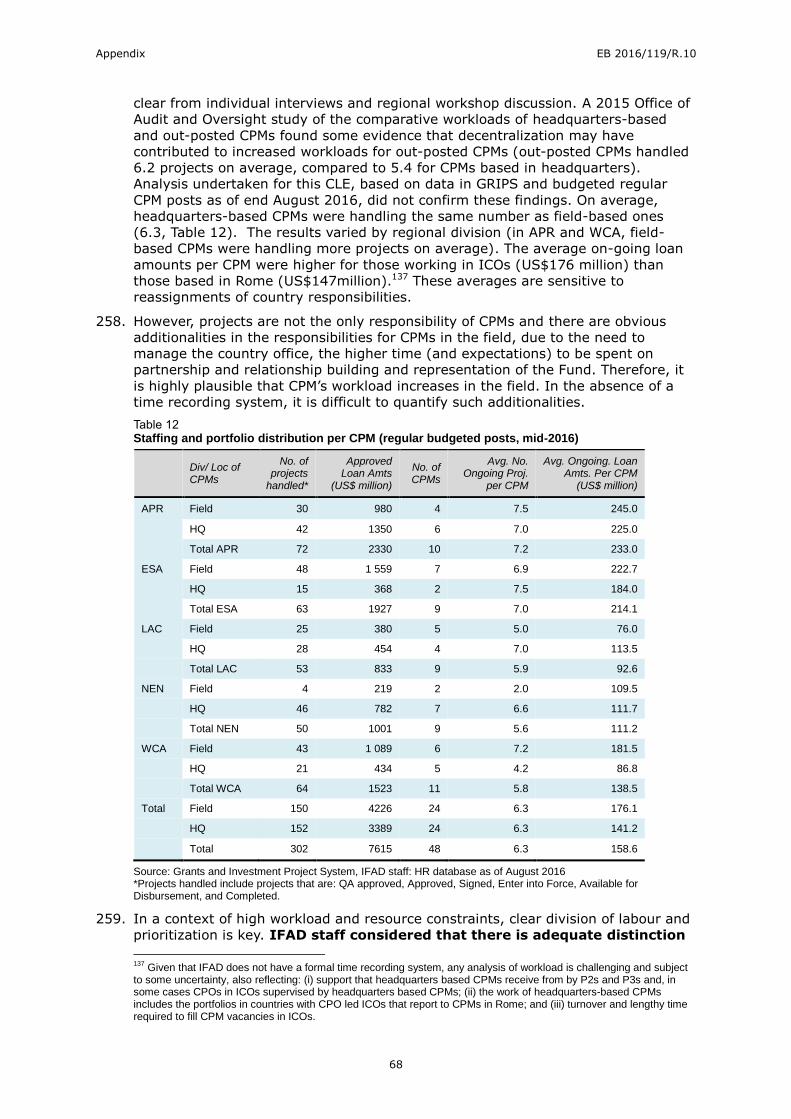
Appendix EB 2016/119/R.10
68
clear from individual interviews and regional workshop discussion. A 2015 Office of
Audit and Oversight study of the comparative workloads of headquarters-based
and out-posted CPMs found some evidence that decentralization may have
contributed to increased workloads for out-posted CPMs (out-posted CPMs handled
6.2 projects on average, compared to 5.4 for CPMs based in headquarters).
Analysis undertaken for this CLE, based on data in GRIPS and budgeted regular
CPM posts as of end August 2016, did not confirm these findings. On average,
headquarters-based CPMs were handling the same number as field-based ones
(6.3, Table 12). The results varied by regional division (in APR and WCA, field-
based CPMs were handling more projects on average). The average on-going loan
amounts per CPM were higher for those working in ICOs (US$176 million) than
those based in Rome (US$147million).137 These averages are sensitive to
reassignments of country responsibilities.
258. However, projects are not the only responsibility of CPMs and there are obvious
additionalities in the responsibilities for CPMs in the field, due to the need to
manage the country office, the higher time (and expectations) to be spent on
partnership and relationship building and representation of the Fund. Therefore, it
is highly plausible that CPM’s workload increases in the field. In the absence of a
time recording system, it is difficult to quantify such additionalities.
Table 12 Staffing and portfolio distribution per CPM (regular budgeted posts, mid-2016)
Div/ Loc of CPMs
No. of projects
handled*
Approved Loan Amts
(US$ million)
No. of CPMs
Avg. No. Ongoing Proj.
per CPM
Avg. Ongoing. Loan Amts. Per CPM
(US$ million)
APR Field 30 980 4 7.5 245.0
HQ 42 1350 6 7.0 225.0
Total APR 72 2330 10 7.2 233.0
ESA Field 48 1 559 7 6.9 222.7
HQ 15 368 2 7.5 184.0
Total ESA 63 1927 9 7.0 214.1
LAC Field 25 380 5 5.0 76.0
HQ 28 454 4 7.0 113.5
Total LAC 53 833 9 5.9 92.6
NEN Field 4 219 2 2.0 109.5
HQ 46 782 7 6.6 111.7
Total NEN 50 1001 9 5.6 111.2
WCA Field 43 1 089 6 7.2 181.5
HQ 21 434 5 4.2 86.8
Total WCA 64 1523 11 5.8 138.5
Total Field 150 4226 24 6.3 176.1
HQ 152 3389 24 6.3 141.2
Total 302 7615 48 6.3 158.6
Source: Grants and Investment Project System, IFAD staff: HR database as of August 2016 *Projects handled include projects that are: QA approved, Approved, Signed, Enter into Force, Available for Disbursement, and Completed.
259. In a context of high workload and resource constraints, clear division of labour and
prioritization is key. IFAD staff considered that there is adequate distinction
137
Given that IFAD does not have a formal time recording system, any analysis of workload is challenging and subject to some uncertainty, also reflecting: (i) support that headquarters based CPMs receive from by P2s and P3s and, in some cases CPOs in ICOs supervised by headquarters based CPMs; (ii) the work of headquarters-based CPMs includes the portfolios in countries with CPO led ICOs that report to CPMs in Rome; and (iii) turnover and lengthy time required to fill CPM vacancies in ICOs.
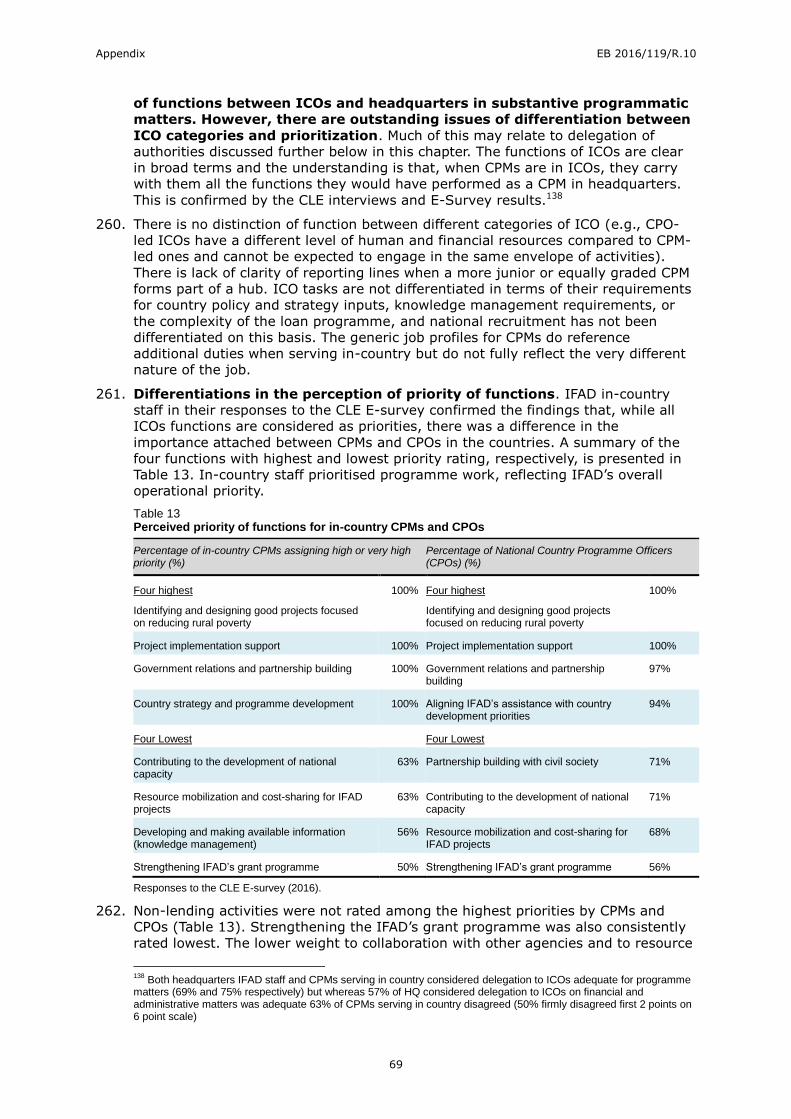
Appendix EB 2016/119/R.10
69
of functions between ICOs and headquarters in substantive programmatic
matters. However, there are outstanding issues of differentiation between
ICO categories and prioritization. Much of this may relate to delegation of
authorities discussed further below in this chapter. The functions of ICOs are clear
in broad terms and the understanding is that, when CPMs are in ICOs, they carry
with them all the functions they would have performed as a CPM in headquarters.
This is confirmed by the CLE interviews and E-Survey results.138
260. There is no distinction of function between different categories of ICO (e.g., CPO-
led ICOs have a different level of human and financial resources compared to CPM-
led ones and cannot be expected to engage in the same envelope of activities).
There is lack of clarity of reporting lines when a more junior or equally graded CPM
forms part of a hub. ICO tasks are not differentiated in terms of their requirements
for country policy and strategy inputs, knowledge management requirements, or
the complexity of the loan programme, and national recruitment has not been
differentiated on this basis. The generic job profiles for CPMs do reference
additional duties when serving in-country but do not fully reflect the very different
nature of the job.
261. Differentiations in the perception of priority of functions. IFAD in-country
staff in their responses to the CLE E-survey confirmed the findings that, while all
ICOs functions are considered as priorities, there was a difference in the
importance attached between CPMs and CPOs in the countries. A summary of the
four functions with highest and lowest priority rating, respectively, is presented in
Table 13. In-country staff prioritised programme work, reflecting IFAD’s overall
operational priority.
Table 13 Perceived priority of functions for in-country CPMs and CPOs
Percentage of in-country CPMs assigning high or very high priority (%)
Percentage of National Country Programme Officers (CPOs) (%)
Four highest
Identifying and designing good projects focused on reducing rural poverty
100% Four highest
Identifying and designing good projects focused on reducing rural poverty
100%
Project implementation support 100% Project implementation support 100%
Government relations and partnership building 100% Government relations and partnership building
97%
Country strategy and programme development 100% Aligning IFAD’s assistance with country development priorities
94%
Four Lowest Four Lowest
Contributing to the development of national capacity
63% Partnership building with civil society 71%
Resource mobilization and cost-sharing for IFAD projects
63% Contributing to the development of national capacity
71%
Developing and making available information (knowledge management)
56% Resource mobilization and cost-sharing for IFAD projects
68%
Strengthening IFAD’s grant programme 50% Strengthening IFAD’s grant programme 56%
Responses to the CLE E-survey (2016).
262. Non-lending activities were not rated among the highest priorities by CPMs and
CPOs (Table 13). Strengthening the IFAD’s grant programme was also consistently
rated lowest. The lower weight to collaboration with other agencies and to resource
138
Both headquarters IFAD staff and CPMs serving in country considered delegation to ICOs adequate for programme matters (69% and 75% respectively) but whereas 57% of HQ considered delegation to ICOs on financial and administrative matters was adequate 63% of CPMs serving in country disagreed (50% firmly disagreed first 2 points on 6 point scale)

Appendix EB 2016/119/R.10
70
mobilization emanates, at least in part, from the time consuming nature of this
work and often limited returns to effort, as confirmed by interviews. Some staff
argued that time spent in UN system-wide coordination was not always time well
spent, due to the very different mandates. Some staff also felt a lack of
qualification to undertake resource mobilization.
263. The relative priorities to functions assigned by in-country staff were
largely reflected in the use of staff time. Country Programme absorbed the
majority of effort of all categories of staff in ICOs except those General Service
working on administrative support (See Table 14). Among the non-lending
priorities, partnership absorbed the most time.
Table 14 Reported Use of Staff Time in ICOs
Average countries without CPMs
Average countries with CPMs
Natio
nal
pro
fessio
nals
&
regula
r ICO
consulta
nts
%
Genera
l Serv
ice
(adm
inis
tratio
n &
genera
l support) %
Country
P
rogra
mm
e
Ma
nager (if in
ICO
) %
Oth
er in
tern
atio
nal
Pro
fessio
nal U
N
volu
nte
ers
& A
PO
s
%
Natio
nal
pro
fessio
nals
&
regula
r ICO
consulta
nts
%
Genera
l Serv
ice
(pro
gra
mm
e %
)
Genera
l Serv
ice
(adm
inis
tratio
n &
genera
l support) %
Country Programme 53.2 62.0 56.6 69.0 64.7 58.8 35.5
Partnership & Relationship Building
18.0 3.0 18.2 17.0 17.3 3.1 4.4
Policy dialogue, knowledge management & capacity development
15.7 2.0 11.4 11.5 11.8 2.4 2.9
ICO management & administration
9.1 29.6 10.3 2.0 3.6 33.4 54.7
IFAD representation & Image Building
3.7 3.4 3.3 0.5 2.3 1.6 1.5
Number of Cases 18 5 22 10 21 11 13
Source: Responses to Evaluation Country Fact Sheet by ICOs
264. Guidance on prioritization. If there is total work overload, some functions will
not be fulfilled. There is a general understanding that 50 per cent of ICO time
should be devoted to operational matters but expectations for broader work in
policy, knowledge management and in-country dialogue have been steadily
growing. While part of the answer to this problem could be addressed through
organizational efficiency improvements, there is also an issue of closer
prioritization and definition of tasks, based on country needs and opportunities. As
an example, the prioritization within policy dialogue of attendance at meetings
requires guidance.139 IFAD Representation was interpreted by some staff as
including extensive participation in events of the diplomatic circuit, which they did
not perceive as particularly useful.
265. In sum, in a context of high workload and constrained resources, while functions
are reasonably clear between headquarters and ICOs, there is insufficient
differentiation of expectations between varying ICO types and inadequate
prioritization of functions for individual countries and guidance is not sufficient on
139
Standard terms of reference for CPMs state that CPMs serving in country offices will participate in and contribute to all international and national meetings/thematic groups meetings
Appendix EB 2016/119/R.10
71
some functions such as inter-agency dialogue. Clarity, prioritization and
differentiation of functions is thus rated only moderately unsatisfactory.
266. Overall, the rating for institutional structure and organizational arrangements is
moderately satisfactory, taking into account a moderately satisfactory rating for
host agencies and service-level agreements and organizational arrangements for
decentralized offices and regional divisions, and moderately unsatisfactory for
prioritization and differentiation of functions.
C. Human Resources aspects
267. As per a decision of the Executive Board in 1978, IFAD has an observer status in
the International Civil Service Commission (ICSC). As stated in the Human
Resources Policy adopted by the Executive Board in 2004, the salary and benefit
levels of IFAD staff shall follow the methodology of the UN common system, as
applied to various duty stations. Any matter of human resources management not
specifically treated in the Policy will be decided by the President, in light of
practices, rules and procedures adopted in the United Nations Common System, as
well as other similar financial institutions.
268. Duties of staff serving in headquarters and ICOs are specified but with
scope for improvement. The generic job profiles that apply to CPMs state
additional responsibilities when serving in an ICO but do not fully reflect the
different nature of the job.140 It emerged from the CLE interviews that placement of
international staff in offices has been more on the basis of willingness to move and
general qualifications, rather than selection criteria, involving the special
requirements of a particular ICO or the managerial skills required to run an office
and network with government and donors. The Human Resources Division and the
Regional Directors are designing 3-5 new generic job profiles that will take into
account the different nature of the jobs (HQ CPM vs ICO CPM and CPO in a CPM-led
ICO vs CPO leading an ICO), with an increased focus on the managerial
responsibilities.
269. As implemented, staff performance assessment in the Performance Evaluation
System (PES)141 tends to blend knowledge management, policy dialogue and
partnership building, while the job profile has distinct functionalities for these.
Performance objectives for HR and ICO management and IFAD representation are
often lacking.142 It is expected that the situation may improve when the new
generic job profiles are introduced.
270. National Professional Officers are part of the locally-recruited professional staff
category of the UN system. They are selected through local/national competition to
provide expertise and knowledge within the country context. As a measure for
career development, deployment of national professionals to serve a wider region
has now been resolved with a provision that national professionals can travel for up
to six months of the year outside their country. While this is being incorporated in
the generic job profile for advisors in gender and the environment, it has not yet
been reflected in that for CPOs and they were not recruited on that basis. Although
salaries of national professionals are not necessarily lower than P2/P3 international
staff, total staff costs are higher for internationals and some national staff
complained that they are not recognised as “full professionals”.
140
The generic job profile, after detailing CPM duties for one page of six functions contains a statement that “Out-posted CPMs will additionally (a) serve as the designated representative of IFAD in the country; (b) manage the Country Office, lead the IFAD country team and as such play a central role at the country level in actualizing the coordination of operational activities for development and (c) participate in and contribute to all international and national meetings/thematic groups meetings”. 141
The individual PES staff performance objectives for CPMs are generally grouped around the following broad categories of objectives: a) project design; b) portfolio performance/supervision/ implementation support; c) country programme management/ COSOP; and d) policy/knowledge management/partnership building. 142
IFAD internal review conducted by AUD of CPM PES, 2015.
Appendix EB 2016/119/R.10
72
271. IFAD’s salaries and benefits are competitive for national staff in the local markets.
Grading and incentives are ultimately a consideration of IFAD’s requirements in the
national and international markets and cost. In the CPO responses to the CLE E-
survey, 73 per cent reported salaries were competitive in the local market and only
15 per cent strongly disagreed.143
272. Career opportunities for national professionals. CPOs in offices which were
established prior to the deployment of a CPM had their responsibilities and profile
reduced with the arrival of the CPM. Nevertheless, 59 per cent of CPOs responding
to the CLE survey considered that there were adequate opportunities for career
development and only 12 per cent strongly disagreed. It is understood that to date
three national professionals have become international professionals with IFAD and
there are possibilities for career advancement in the international system at
country level with other agencies. IFAD experimented with a scheme where three
national professional officers were given the opportunity to work in another country
office for six months. The possibility to use national professionals more widely in
neighbouring countries enhances their experience but some international staff
suggested that many of the senior national staff are not ideal international officers,
but are ideal for ICOs, because of their knowledge of the country and their entrée
with Government. The Human Resources Division is also working on other
opportunities for career development available to national professional officers to
acquire new skills, knowledge and experience within and across departments,
functions and duty stations and are brought to their attention through briefing
sessions (e.g. in Kenya and United Arab Emirates in 2016). In addition to serving
in other countries, national officers may also serve at the headquarters on
temporary assignments.
273. Training of national ICO staff is inadequate, especially for General Service
staff. Seventy-four percent of CPOs considered training adequate in their
responses to the CLE questionnaire. Nevertheless, during workshops and country
visits, major frustrations were expressed with training. The challenge for IFAD in
integrating decentralized staff and informing them of IFAD varies substantially with
the organizational model which is pursued. ICOs were started with only national
staff. These staff knew little of IFAD and it was only through visiting missions, their
reading, and from occasional regional meetings that they got to know IFAD. With
the movement out from headquarters of existing CPMs, knowledge of IFAD came to
those ICOs where they were posted. Provision is now made for exposure of newly
recruited CPOs to headquarters and sometimes follow-up visits but in interviews
this was generally regarded as inadequate by both staff and supervisors.144 PMD is
organising and facilitating training opportunities for ICOs regionally and globally.
274. GS staff and to some extent national professional staff in ICOs are expected to use
IFAD ICT systems, input monitoring data. However, there is little training for them,
although some reported, in Africa and Latin America, that they had had visits from
HQ General Service staff who provided on the job training. Lacking is a structured
briefing and mentored training programme, some of which could be on-line.
Training would also be useful for national professionals and GS in both internal
procurement and HR procedures, security, and requirements for procurements
under loans and grants where CPMs are required to provide “no objection”. The
Human Resources Division is introducing new initiatives including face-to-face and
e-learning (team building, stress and conflict management, working in small and
143
Most CPOs are graded NOC, but for those few national professional staff at the top of the grade structure (D), there are limited opportunities for advancement, if this is viewed simply as promotion in IFAD (significant upgrading of posts would also have cost implications). Four national professionals are at the top grade (NOD) out of a total of 42. 144
Many CPOs reported a delay of over a year between their appointment and first visit to headquarters which was seldom for more than a week and interviews in headquarters and the regions confirmed that such briefing was often not well structured.

Appendix EB 2016/119/R.10
73
remote teams, presentation skills, impromptu speaking and meeting management,
language).
275. Most CPMs and other international professional staff were transferred to
ICOs from headquarters and had knowledge of IFAD. A problem has arisen
where duty stations are unattractive and IFAD had to recruit CPMs for the ICO from
outside (to date this has only occurred in a few cases).145 If IFAD moves towards
greater decentralization, more staff will be recruited directly into the decentralized
offices and a more structured approach to their induction and subsequent training
would be required. An internal IFAD review (Office of Audit and Oversight, 2015) of
briefing and training requirements for CPMs serving in-country indicated that they
felt they were the least prepared with respect to IFAD representation/diplomatic
protocol, replenishment/resource mobilization, and Head of Office security
responsibilities. The Management Development Programme for P4 and P5 IFAD
staff was rolled out in 2013 but only six outposted CPMs had participated by early
2015. Training on dealing with the media was provided in 2015 in Nairobi and
attended by two CPMs, one Programme Officer, three 3 CPOs and the Regional
Gender Coordinator.
276. Provision is made in the HR procedures for professional staff relocation, and
special post allowances have been paid to CPMs moving to ICOs, equivalent to
salary at the next higher grade. While transfer of professional staff to countries has
not always been easy, 63 percent of CPMs working in-country reported on the CLE
survey that incentives to move to an ICO were adequate (only 56 per cent of
headquarters staff held this view). All CPMs serving in-country and most other
international staff serving outside headquarters considered service in an ICO a
career enhancing move and a challenging professional opportunity, views shared by
headquarters staff. Ninety-two percent of CPMs serving in country considered there
were unresolved issues in reintegrating into headquarters following an assignment
in the field (of which 83 per cent strongly felt this), a view shared by their
headquarters colleagues, but this response is in the context of an expectation of
returning to headquarters (this is no more part of the mobility framework).146
277. IFAD has been cautious to implement significant change in location of staff or job
profiles and adjusting staffing at the headquarters (notably GS staff).147 In a
context where IFAD intends to move more rapidly towards functional reorganization
and to contain costs, experience from other organizations is pertinent.
278. Reorganization and decentralization has been undertaken in most of the MDBs and
much of the UN system. Measures have often included a mixture of incentives,
including for early retirement, severance pay, and willingness to terminate staff and
adjust job profiles. International programme staff in most operational UN agencies
are expected to move at least once every five years and there are similar
requirements in some IFIs.148 The period prior to reassignment is shorter for
hardship duty stations. The equivalents of CPMs in UN agencies cannot necessarily
expect to serve in headquarters as there are few or no equivalent posts.
279. According to the interviews, among the Rome based agencies, both WFP and FAO
have gone through periods of adjustment which have led to short to medium-term
145
Of the four cases of CPMs recruited from outside in 2016 to serve in an ICO, three came to HQ for 1-3 month briefing periods before taking up the assignment in the ICO (the fourth CPM had previously worked to IFAD as a JPO). During the time in HQ, they attended formal corporate training and at the same time were extensively briefed by their hiring division. 146
At the same time, the evaluation was provided examples of country frustration with high turnover of in-country CPMs. 147
On a positive note, in 2016, HRD and PMD have been carrying out a pilot mobility programme within PMD to evaluate the applicability of a managed and structured approach to mobility within IFAD and provide feedback to Senior Management (fourth quarter 2016) on findings and lessons learnt. It is also noted that mobility is part of the HR policy framework and every IFAD staff member now signs a contract that includes a geographical (for professional staff) and functional mobility clause. 148
In the UN system e.g. UNICEF; UNDP; WFP; FAO; some MDBs (e.g., World Bank).
Appendix EB 2016/119/R.10
74
deteriorations in staff relations but not necessarily in the longer-term. There have
been greater issues for Rome recruited general service staff than professionals. As
they have far larger staff size than IFAD, there was more opportunity to offer GS
staff internal transfers within Rome. They did however make those transfers across
the whole organization and had periods of total hiring freezes. Experience has
shown that staff need to be well informed of plans for change and why those
changes are necessary. In general, the decentralization approach of other
organizations could be described as more robust.149 At the same time, these
organizations took care to reduce Rome-based staff with early retirement and
agreed compensation packages.
280. In sum, IFAD’s salaries for national staff are competitive but there are limitations in
career opportunities. Orientation and training for national staff is not adequate.
Compared to other organizations, IFAD has been reluctant to force through
important changes in location of staff and job profile and the experience of Rome-
based agencies suggest that a more robust approach is possible. Given these gaps,
the rating for this dimension is thus moderately unsatisfactory.
D. Administrative and technical support functions and
decentralization of approval authorities
281. The Administrative, Human Resource and the Financial Operations Divisions are
centralised. There is only one case of partial decentralization of financial
management and loan administration and disbursement functions in the regional
office of Nairobi for ESA also covering part of WCA. The 2013/14 Decision of the
Executive Board150 on Country Presence151 excluded the development of further
regional and sub-regional offices providing financial and administrative services
until an Executive Board policy decision in 2015, which will now take place in
2016/17.
282. The experience with the decentralization of financial management
functions to Nairobi has been positive. IFAD is a smaller agency with less staff
in back-office functions and more multi-tasking at professional levels than
comparator organizations, but the out-posting of financial management
professionals has been found helpful by programme staff and projects where they
assist in East Africa in risk assessment and supervision and can provide advice to
projects (see Box 5). These functions could become more important, with the move
to improve the link between financial management and financial management
consultants, currently employed by the PMD regional divisions. In view of the
positive experience in Nairobi, there may be scope to decentralise additional
financial management officers to the regions, especially where the time zones and
travel times are significant (LAC and APR).152
149
Substantive reorganization processes at FAO and WFP have not been challenged in ILO Administrative Tribunal ruling on appeals. This CLE reviewed FAO and WFP appeals to the ILO Administrative Tribunal to which IFAD is also subject, in the period from 1996 to date. Three cases were identified of relevance for this CLE (in 2001, 2006 and 2016 respectively). The Tribunal noted when a substantive reorganization was taking place and in its judgements only ruled against the organizations when they failed to conform to their own rules in making transfers and terminations. The damages awarded in these cases were minor (up to US$ 25,000 approximately). 150
Following the December 2013 EB discussion approval was by communication in 2014. 151
EB 2013/110/R.5/Rev.1 IFAD Country Presence Strategy (2014-2015) 152
There are (August 2016), nine finance officer posts with regional responsibilities of whom two in Nairobi. They are assisted by two senior General Service staff (G6)

Appendix EB 2016/119/R.10
75
Box 5 Out-posted Financial Services in Nairobi
The CFS (now FMD) group operates independently of the rest of the Nairobi Office which falls under PMD and the direct reporting line is to the FMD ESA team leader based in Rome. The two professional staff working on financial management work primarily for PMD-ESA. Staff are better able to understand and deal with financial management issues than if they were outside the region. They participate more easily and cheaply in project design and supervision and can provide local training and mentoring. They travel for a total of about seven weeks a year each (expected to increase to eleven weeks in 2017). Two training workshops of 3-4 days duration were held in 2015 and ICO and project staff passing through Nairobi can arrange to meet and discuss issues with them. They do not consider it an issue that their supervisor is in Rome.
The CFS division is now being split in two with withdrawal processing and disbursement and maintaining IFAD's accounts (ACD) split from financial management (FMD). Staff now handle all documentation electronically working on two screens, which streamlines the process and reduces communication times and document printing and physical handling and improves archiving efficiency. It is expected that the unbundling of CFS and introduction of FMD as a standalone division may enable FMD Finance Officers in Nairobi to significantly increase their annual mission travel, which for outposted staff is less costly and also time saving.
Source: CLE interviews (2016)
283. General Service Staff serving in developing countries tend to be less costly than
those in Rome. While most of the regional MDBs are based in developing countries,
the World Bank and many UN agencies have concentrated back-office services in
procurement, payroll, human resources and withdrawal application processing to
low cost locations (usually a single one). For reasons principally of time zones,
some have also located auditors, human resource officers outside headquarters. A
cost-cutting option for IFAD could be thus to establish a shared services centre
offshore. However, the potential cost-saving effects would have to be assessed.153
According to the E-survey, there was some support for this from staff. The e-survey
asked whether administrative functions should be transferred to the regions and
lower-cost centres. A majority of responding headquarters staff did not agree with
this but 42 percent did agree. In the country offices, the majority of CPMs and CPO
agreed (60 and 81 percent respectively).
284. The Field Support Unit in the Corporate Services Department has been
performing a valuable function. The FSU works closely with the Programme
Management Department (PMD). It was found during interviews that the support of
the FSU was well appreciated by ICOs. The FSU has five professional and four
general service posts. It includes a seconded HR support officer and provides some
administrative support function for payment of host agencies. It manages the
capital costs of opening offices, the host agency service agreements and the host
country agreements. The FSU also has the responsibility for security and for
provision of capital investments for security in ICOs. The payment of rents for ICO
host agencies is now being centralised which will simplify the task of CPMs who
hold the ICO administrative budgets. In day to day negotiation at country level the
FSU works through the ICOs and relies on the relevant divisions of IFAD for
functions such as major procurements, RBA based agreements for computer and
vehicle purchase, and legal implications of host country agreements. Some of the
IFIs (e.g. ADB and the World Bank) were reported to have units with similar
functions to those of the FSU. Comparators in the UN system sometimes have
small offices for liaison or policy coordination on decentralization but these do not
generally parallel the functions of the FSU.
285. ICT and access to corporate IT systems was generally regarded as
satisfactory by staff serving in-country. There have been significant recent
improvements in IT and communications with respect to connectivity to the
153
As of August 2016 there were some 12 General Service Finance Assistants employed on processing withdrawals and on payroll of which 10 were in Rome.
Appendix EB 2016/119/R.10
76
internet voice and video conferencing and connectivity to corporate systems.154
Improvements are continuing and in a few situations may require bypassing
national systems.
286. The main challenges to full fruition of ICT advancements relate to local
infrastructure in the concerned countries and practical organizational items at IFAD.
For example, download and upload times in some countries continue to be so long
that transactions time-out and work becomes inefficient. Electric power cuts can
also be a problem. The single biggest remaining difficulty is the limited number of
transactions carried out by staff in the ICOs which means they do not become fully
familiar with the systems. For meetings, a frustration is the line dropping and the
time-lag in the connection. Another complaint is about the lack of attention by
headquarters staff to working across time zone differences, particularly when
organizing seminars and workshops in Rome.
287. Between 2013 and 2016, ADM implemented decentralized airplane ticketing in
countries in Eastern and Southern Africa (Kenya, Zambia, Mozambique, Ethiopia,
Tanzania), Latin America and the Caribbean (Guatemala, Peru, Bolivia, Brazil) and
Western and Central Africa (Ghana). Where decentralized ticketing is in place, ICOs
can benefit from enhanced services available in the country, automated systems,
and cheaper locally purchased tickets, especially for travel originating in countries
where the ICOs are located. ADM is planning to implement decentralized ticketing
in other locations where a local travel agent is available.
288. Technical Support: all categories of staff were generally satisfied with the
support received from technical specialists in headquarters. This
represented 83 percent of HQ staff and 94 percent of CPOs but a slightly lower
proportion of in-country CPMs: 72 percent. Technical support by IFAD headquarters
to the CPMs and ICOs is provided by the Policy and Technical Advisory Division
(PTA) and the Environment and Climate Division (ECD). Support also comes from
the regional divisions on economics and portfolio management and other aspects
including gender. There are national officers paid by the regional divisions for
gender and youth in Nairobi and Dakar to serve the ESA and WCA regions
respectively (reporting line is to the Head of Office - CPM).
289. There are a few cases of the expertise of a CPO serving other parts of the sub-
region, for example on procurement in Guatemala and India. Consultants continue
to be the main source of technical support for CPMs. In 2014, the total consultant
full-time equivalents for PMD regional divisions was 188 compared with 211 total
regional division staff. Many of these consultants are used on a repeat basis and
some have retainers.
290. The Policy and Technical Advisory Division (PTA) in the Programme Management
Department has 33 professional and higher level posts and 10 GS posts. In all
technical areas, except environment and climate change, it provides technical
support for the lending and grant programme and also has a role vis-à-vis
knowledge management and dissemination together with the Communications
Division, and a role in managing IFAD’s input to some global knowledge
programmes and related grants (reportedly, 20-30 per cent of staff time is spent
on global programmes and cooperation). The number of staff in core disciplines is
normally two to three.
291. PTA decentralised a land tenure specialist for a period to Nairobi but currently has
no decentralised staff. PTA argues that the small number of staff in each discipline
makes decentralization impossible and that it is important to maintain global lesson
learning and critical mass. PTA reports that the number of support missions in
which staff participate has risen markedly (from 2010 to 2015 annual design
154
The Financial Management Dashboard, an important tool for information sharing, is now accessible to outposted staff.
Appendix EB 2016/119/R.10
77
missions rose from 10 to 64; implementation support and supervision missions
from 20 to 101).
292. The Environment and Climate Division (ECD) currently supports the
implementation of one major donor funded programme “Adaptation for Small
holder Agriculture Programme (ASAP)” (US$ 367 million) and a GEF programme of
about US$ 700 million. In addition to the Director, four professionals are supported
on the IFAD administrative budget and a further three professionals are also
distributed between the regions from donor service charges.
293. The extent to which technical services could be decentralised, under the
existing model is limited by numbers of staff. ECD is exploring lower-cost
alternatives and, in a cost sharing arrangement with the regional divisions, is in the
process of appointing four national professionals to be posted in Jakarta, Nairobi,
Dakar and Lima. Regional divisions expressed appreciation for this flexibility.
294. Emerging from experience of other organizations and from interviews, alternative
options could include moving part of the PTA budget to the regional divisions for
use of staff on a call-down basis, an option which would provide both an incentive
and a signal as to which expertise is in demand. This type of matrix budgeting and
management has been used to some extent in IFIs, including the World Bank, and
in UN agencies. Consultant networks could also be further developed in hub
arrangements, linked to designated staff in PTA and ECD.
Decentralization of approval authority
295. IFAD has a centralized model of financial and administrative management.
The argument was that the small staffing size and capacity of most ICOs and the
low value and small size of their financial transactions make it more efficient to
locate the responsibility centrally for financial management in CFS (now FMD),
budget management at the PMD Divisional Director level, and administrative
management (i.e. for procurement, office space, etc.) in ADM and FSU.155 However,
the 2011 Country Presence Policy and Strategy envisaged stronger delegation of
authority and the 2014-2015 Country Presence Strategy stated the need for IFAD’s
PeopleSoft enterprise resource planning to support decentralization of financial and
administrative management to ICOs.156 After five years, progress has been slow.
296. In general, budget holder responsibility remains with the regional directors. A six-
month pilot initiative involving decentralization of budget and other administrative
responsibilities to the Vietnam hub started in 2016. The underlying rationale for the
pilot is the available staff capacity in the Vietnam hub and the functional capability
of IFAD transaction systems to support decentralized decision-making and
transaction processing. The CPM in Vietnam expressed general satisfaction with the
arrangement which he viewed as an improvement compared with the previous
situation. The assessment of the outcomes of the Vietnam pilot initiative will be an
important factor before further decisions on the decentralization of budget and
other administrative functions are taken.
297. Senior CPMs serving in country offices were found to be satisfied with the
delegation of the office budget but less so with the delegation of budget
holding authority.157 A little less than half of the staff at HQ and total staff in
ICOs found budget holding delegation in the “unsatisfactory zone” (Table 15). The
CPMs had an understanding of the size of the supervision budget available and
155
With regard to procurement, ADM has delegated authority for low-value procurement to PMD Directors who have the option to re-delegate this to their CPMs in the ICOs when the value involved is up to EUR 10,000 per transaction. 156
According to the 2011 Policy and Strategy, (par. 56-e): “Further delegation of authority and refinement of the accountability framework will take place as needed”, and (par 50): “The authority of country office staff will mirror the authority of staff within IFAD as a whole. Outposted CPMs have authority over decentralized budgets, while national staff require prior approval.” 157
The supervision and design budgets are annual variable cost-allocations managed by the Regional Divisions for travel. They do not include regular staff or the administrative budgets for ICOs, although savings on vacant posts are fungible and accrue to this allocation (allotment).

Appendix EB 2016/119/R.10
78
discretion in using it but this could require some needless negotiation with the front
office of their division and with the regional director, leading to inefficient use of
staff time and diminish both clarity and responsibility. It is easier for CPMs in
headquarters who have immediate access to Division Directors to resolve budget
and procurement issues.
298. Headquarter staff and CPOs, but not in-country CPMs, were generally satisfied with
delegation for local procurement for the office and contracting for services. In-
country CPMs considered that, for small transactions, segregation of authorities
should be of less concern and noted that their approval authorities were generally
lower than in other agencies and were limited to the ICO budget where
transactions were by their very nature small. On the other hand audits have noted
a lack of adequate controls in some ICOs for aspects such as use of vehicles.
Table 15 Organization Questionnaire Response Summary Satisfaction with corporate systems
Headquarters Staff CPMs Serving in Country CPOs
Unsatisf.
(1-3)
Satisf.
(4-6)
Unsatisf.
(1-3)
Satisf
(4-6)
Unsatisf.
(1-3)
Satisf.
(4-6)
Areas of Some Concern
Delegated budget holding authority
45% 55% 46% 54% 45% 55%
Supportive procurement and contracting system
37% 63% 52% 48% 20% 80%
Areas where things work well
IT and communication systems
14% 86% 26% 74% 12% 82%
Access to corporate systems 13% 87% 16% 84% 6% 94%
Responses to the CLE E-survey (2016).
299. Communication was found to be an area of concern for CPM-headed ICOs, in view
of the limited delegation for local in-country communication. They perceived that
this led to delays, lost opportunities and time consuming discussion with the
Communication Division in headquarters.158 Most other UN agencies and IFIs
delegate significantly more authority for local communication to their country
offices which is believed to support both their representational and promotional
roles and policy influence. Larger agencies often have a communication specialist
as a staff member in a country office. IFAD can not recruit a communication
specialist in all offices although it might be feasible to have a shared
communication consultant within a sub-regional hub arrangement.
300. In sum, provision of administrative, ICT and technical support to ICOs has been
satisfactory but there is room for further decentralization of support to projects in
financial management, procurement and some technical subject matter areas.
Although working level arrangements are in place, there are issues of limited
delegation of authority to senior CPMs for country budgets, local procurement,
consultant recruitment and communication at country level. The rating for
organization of administrative and technical support functions and decentralization
of authorities is moderately satisfactory.
301. On balance, the rating for efficiency is moderately satisfactory. This takes into
account the rating of moderately satisfactory for the management of
158
According to current practices, staff who have undergone training offered by COM are authorized to serve as IFAD spokespeople with the media, those who follow IFAD's social media guidelines are encouraged to engage in social media, those who obtain the approval of their respective director (since directors hold authority for publishing) and follow IFAD's publishing guidelines may develop publications and so on.

Appendix EB 2016/119/R.10
79
decentralization costs, for the institutional structure and organizational
arrangements, and for organization of administrative and technical support
functions and decentralization of authorities; but moderately unsatisfactory for
human resources aspects.
Key points
Opening country offices has not led to PMD and IFAD budget escalation. This was also thanks to the absorption of the budget previously dedicated to UNOPs supervision as well as to budget increases in 2008-2010. Available resources allowed PMD to ensure programme management and implementation support but not a commensurate enhancement in non-lending activities.
PMD staffing levels at headquarters have not been reduced as decentralization has proceeded. There is potential for cost-efficiency to be realized from sub-regional
hubs, although IFAD has not yet fully analyzed and explored it so far.
In about thirteen years, regional divisions have been able to establish 40 (39 operational) country offices. There has been no commensurate functional analysis and reorganization of the headquarters divisions. A CLE modelling exercise suggests that options are available to further improve cost efficiency.
Host country agreements were initially not emphasised but were later found to be important in some countries prior to the outposting of senior CPMs. Service-level agreements with host agencies have been a pragmatic decision to guarantee essential services and contain costs, even if the quality of services has been variable
In a context of high workload and constrained resources, while functions are reasonably clear between headquarters and ICOs, there is insufficient differentiation of expectations between varying ICO types and prioritization of functions for
individual countries.
There is room for further decentralization of support to projects in financial management, procurement and some technical subject matter areas. Although working level arrangements are in place, there are issues of limited delegation of authority to senior CPMs for country budgets, local procurement, consultant recruitment and communication: given the expectations set in the 2011 Country
Presence Policy and Strategy, progress has been slow in this area.
Ratings by evaluation criteria and sub-criteria. Efficiency
Evaluation criteria
Evaluation sub-criteria Rating
Efficiency A Management of Costs of Decentralization moderately satisfactory (4)
B Institutional Structure and Organizational Arrangements moderately satisfactory (4)
B.1 Current Arrangements for Country Offices and Regional Divisions
moderately satisfactory (4)
B.2 Host Agencies and Service-level Agreements moderately satisfactory (4)
B.3 Resources and Prioritization of ICO Functions moderately unsatisfactory (3)
C Human Resources Aspects moderately unsatisfactory (3)
D Administrative and Technical Support Functions and Decentralization of Approval Authorities
moderately satisfactory (4)
Overall rating for Efficiency moderately satisfactory (4)

Appendix EB 2016/119/R.10
80
VI. Conclusions and recommendations
A. Conclusions
302. The overall objectives and evolving design of the decentralization process
were relevant but with significant areas for improvement. Functions
assigned to ICOs were generally regarded as of high priority by both developing
country government representatives and IFAD staff. Many assumptions were well
justified but some not entirely valid, such as in the case of the “light touch”
approach and cost neutrality. In particular, these two assumptions were not
consistent with the broad set of objectives assigned to country offices, including
the support to non-lending activities. Combined with the priority assigned to
portfolio management and implementation support, this translated into under-
resourcing of non-lending activities. Although IFAD emphasised country presence,
it did not foresee significant adjustment in the respective overall roles of
headquarters and the country offices.
303. Findings from previous evaluations and the experience of other organizations have
been considered in the design and implementation of the decentralization but their
application has not been immediate and has thus been sub-optimal. The Executive
Board approved each step of the decentralization and has been active in oversight.
However, the monitoring system was weak, thus limiting the basis for both
Executive Board governance and internal management guidance.
304. Findings on operational performance and development results attest to
significant improvements. There is evidence that country offices played an
important role in better aligning IFAD’s country strategies and programmes with
local needs and priorities. Presence in the countries was a fundamental
cornerstone of IFAD’s agenda to engage in direct supervision and, even more so,
implementation support. Staff based in ICOs ensured follow-up, continuity of
support and problem-solving capacity to project teams, thus helping enhance
implementation quality. This led to enhanced project implementation performance,
notably for project effectiveness, as shown by the analysis of independent
evaluation ratings.
305. In terms of development results, the presence of country offices was associated
with improvements in overall rural poverty impacts and particularly impact on
household income and household food security and agricultural productivity.
Results in terms of gender equality and women’s empowerment were also higher in
countries with ICOs. Similarly, some improvements were noted in terms of
sustainability of benefits, innovation and scaling up and overall project
achievement. In sum, evidence available to this CLE validates the implicit “chain of
results” of the decentralization strategy. The latter has mainly operated through
country presence, programme design and implementation support, bolstering the
delivery of project’s immediate objectives and, thereupon, contributed to
development effectiveness.
306. So far decentralization has supported non-lending activities to a lesser
extent than originally envisaged. Non-lending activities were given prominence
in the decentralization process. While partnerships with governments and, to some
extent, with donors and non-governmental organizations were improved, there was
little evidence that programmatic collaboration with Rome-based agencies and UN
organizations increased as a result of country presence.
307. Enhancements in engagement and results in policy dialogue did not happen
consistently. Country presence opened up opportunities to build relationships and
trust with policy makers, participating in sector working groups and providing input
to policy discussions based on practical experience. However, because of limited
resources and competing priorities, relatively little ICO staff time was allocated to
policy dialogue and there was no specific administrative budget line for country
Appendix EB 2016/119/R.10
81
offices allocated to non-lending activities, meaning that these offices would need to
finance them through budget balances on other activities (e.g., supervision,
implementation support). This area was largely left to the interest of country office
staff. Policy dialogue experience was not one of the criteria adopted for their
selection. Moreover, as noted by the recent CLE on the Performance-based
Allocation System, IFAD has not made sufficient use of the rural-sector
performance assessment, a tool that can be revamped through country presence.
308. Similar issues of resource constraints affected ICOs’ capacity to engage in
knowledge management. In addition, there was no system in place to facilitate
access to country/project specific knowledge products. Country offices were not
provided with resources commensurate with the ambitions set in policy documents.
309. More in general, this CLE found that there was a mismatch between the
aspirations for ICOs on the part of both IFAD and its clients and the ability
of small offices to deliver the full range of desired services and notably non-
lending activities. Consistent with the guidance set in the 2011 Country Presence
Policy and Strategy, ICOs prioritised programmatic matters over non-lending
activities in allocating their time. Also, there has been little differentiation of
priorities in non-lending activities according to countries and ICOs, some of which
are very small but expected to be involved in the same scope of activities as
others. Guidance for ICOs was also limited on the involvement in representation
activities and inter-agency affairs, particularly in the UN system.
310. There is no clear evidence that CPM-led offices outperform CPO-led ones.
While there were some areas related to operational efficiency with higher
performance of CPM-led ICOs, this was not a generalized finding. Turn-over of CPM
and some lack of clarity of the division of labour and roles may help explain this
finding (in addition, few country offices had a CPM for a significant number of
years). Turn-over of CPMs and country office staff in general is a special concern in
countries affected by fragility situations, causing discontinuity in strategic guidance
and partnerships.
311. The fact remains that CPO-led ICOs played an important role in helping IFAD to
deliver better development outcomes in many areas. Noting their important role,
the CLE found that the orientation and training of CPOs, as well as that of national
staff in general, has been inadequate. At the time of their recruitment, these staff
knew little about IFAD and faced a steep learning curve. They were expected to use
IFAD ICT systems, input monitoring data, but little training was available to them.
312. Out-posted CPMs have some responsibilities that cannot be assumed by national
staff. At the same time, there is a limited number of CPMs at IFAD and the CPM-
based country presence model entails higher costs. This has implications for the
choice of future country presence modalities.
313. Cost neutrality was an over-optimistic goal but IFAD managed to keep
control over its administrative budget. Yet there are opportunities for
further cost- efficiency gains, as already observed by the 2013 CLE on
Efficiency. Opening country offices implied additional costs. Initially, by terminating
the supervision agreement with UNOPS, PMD absorbed the related budget which
made it possible to pay for direct supervision and country presence costs. From
2011 until 2015, PMD absorbed cost increases with a flat budget profile in nominal
terms. This does not appear to have significantly compromised capacity for
strategy and programme management but has not supported the achievement of
non-lending objectives as these activities have been penalised in terms of resource
allocation.
314. IFAD’s decentralization has evolved with a degree of experimentation but there
has not been in-depth analysis of which functions can be best carried out
by headquarters and which by ICOs or other decentralised offices and what

Appendix EB 2016/119/R.10
82
functions can be best undertaken by international professionals and by national
professionals at the country and sub-regional level. While country office staff size
increased significantly, PMD staffing levels at headquarters have not been reduced.
Compared to other organizations, IFAD has not implemented major headquarters
restructuring. The experience of Rome-based agencies suggest that a more robust
approach is possible.
315. There has not been a thorough analysis of costs implications of different
alternatives to country presence. At certain conditions, there is potential for cost-
efficiency to be realized from sub-regional hub offices which display lower per
country and per project costs compared with CPM-led ICOs. This has not yet been
fully explored. Instead, opening new offices entails sizeable additional costs but
limited increases in the portfolio coverage because countries with a larger loan
portfolio have already been covered. In addition to cost-efficiency considerations,
the sub-regional hub model offers a number of advantages from the programmatic
point of view (e.g. sub-regional and transboundary strategic positioning) as well as
from the perspective of stability of human resources, reducing isolation,
rationalizing staff and consultants and generating economies of scale, including for
administrative functions. A modelling exercise conducted by this CLE exemplifies
such opportunities.
316. IFAD evolved from a traditional highly centralised structure and business model.
The evolution from that model has been important and rapid but IFAD’s business
change process has initially emphasized expanding country presence and only
recently has it turned towards decentralization.
317. In consideration of the findings of this evaluation and the experience of other IFIs
and UN agencies, the main issue is now shifting from explaining the benefits
of decentralization towards justifying where and why to maintain
centralized organization, authority and processes. In particular, despite the
expectations set out in the 2011 Country Presence Policy and Strategy, this CLE
noted issues of limited delegation of authority to senior CPMs for country budgets,
local procurement, consultant recruitment and communication. Human resource
procedures have been updated to match out-posting requirements of professional
staff but there is space for improvement in providing incentives for outposting of
international staff, training and career development path for national staff. Also,
IFAD’s financial management systems do not capture the type of information that is
necessary to identify and strategically manage the costs associated with
decentralization.
318. Moving forward, if IFAD embarked on a sustained increase in the size of the
programme of loans and grants, under a zero-growth budget profile, this would
presumably lead to increasing volume of work and demand to the headquarters
and, even more so, to the country offices. Decentralization would need to be
deepened and strengthened, in order to be able to respond to these challenges, in
order to maintain and enhance the quality of operational performance and
development results.
B. Recommendations
319. Building on the findings and conclusions of this CLE, the goal of these
recommendation is to help IFAD enhance operational performance and, through
that, development results. They are meant to inform future strategies and plans for
decentralization, such as the corporate decentralization plan which Management
will present to the Executive Board in December 2016.
320. Recommendation 1. Strengthen IFAD’s country presence while pursuing
options for enhancive cost-efficiency. This priority was already identified by
the 2013 CLE on IFAD's Institutional Efficiency. After conducting a functional
analysis exercise, IFAD should strengthen its country/sub-regional presence and
capacity in the field by building “critical mass” and concentrating rather than

Appendix EB 2016/119/R.10
83
dispersing human and financial resources. In a parallel effort to enhance
effectiveness and efficiency, it should reduce staff at the headquarters and increase
staff in country offices, closer to the country programmes, particularly where
programmes are relatively large. The modelling exercise of this CLE exemplifies
possible approaches (see Efficiency and Annex VII). This will entail the following
measures:
321. 1.a Re-organize country presence around a selected number of sub-regional hubs,
supporting other country offices (CPO or CPM-led). Establishing of hubs should be
guided by functional analysis, taking into account, inter alia, size of the portfolio,
planned non-lending activities, country characteristics (e.g., accessibility via
international travels, ICT connectivity, and security) and opportunities to support
other offices. Hubs could be grown out of existing ICOs and reduce pressure to
establish new ones. Conversely, IFAD should be ready to downsize or close country
offices when portfolio size or other criteria do not justify their recurrent costs.
322. 1.b Based on a functional analysis exercise, identify options to rebalance staffing
levels from the headquarters (professional and GS) to regional hubs and country
offices which could perform some functions now performed by headquarters
regional divisions. Headquarters divisions will need to retain focused but functional
support teams including senior professionals which would also allow some rotation
between country-based CPMs and headquarters. While this change process may
entail initial investment costs, it should be devised so as to generate savings in
recurrent costs at PMD level.
323. 1.c Consider further decentralization of other functions (such as financial
management, based on the positive experience in Nairobi) to the regions,
especially LAC and APR which have time zone issues and high travel costs from
Rome. Consultants and national staff could also be managed sub-regionally for
support in such areas as procurement and financial management.
324. Recommendation 2. In order to achieve stronger development results,
better support to non-lending activities through decentralization is
needed. Benefiting from greater proximity with national stakeholders, in its
country strategies, IFAD should prepare a realistic agenda for non-lending activities
with specific resources allocated. This will entail the following measures:
325. 2.a Introduce, in country strategies, greater selectivity in the agenda for non-
lending activities, based on consultation with governments, participation in
coordination groups with other organization and interaction with non-government
actors. Differentiate the non-lending agenda and the expectations by type of
country office (e.g. CPO-led, CPM-led, hubs) and according to their resources. As
shown by the recent CLE on the Performance-based Allocation System, the annual
rural-sector performance assessment can be a tool for articulating non-lending
activities
326. 2.b Estimate the required resources (staff, type of expertise, financial) for non-
lending activities and establish a dedicated budget line for the same in country
offices and sub-regional hubs. Enhance collaboration and synergy between PTA,
SKD and country offices. Linkages should also be strengthened between country
programmes and the grant programme. Allocating a larger share of the grants to
country programmes, as already recommended by the CLE on the IFAD Grant
Policy (2014), would be an important step forward.
327. 2.c Include skills and professional experience in non-lending activities as criteria
for staff recruitment in country offices and monitor progress and achievements as a
part of the country office and staff performance evaluation process. Provide
opportunities for training opportunities as well as exchanges of experiences in non-
lending activities.

Appendix EB 2016/119/R.10
84
328. Recommendation 3. Enhance the efficiency of decentralized decision-
making in country offices and sub-regional hubs through stronger
delegation of authority. Within a strengthened decentralization setting, there
will be scope and need for further delegation of authority, notably for budget
holding (supported by sound internal financial control) and communication. This
will entail the following measures:
329. 3.a Based on an assessment of the pilot in Vietnam, prepare a plan (including
provisions for training and for internal financial control) for delegating further
budget holding authority to country directors, particularly when the same are also
heads of sub-regional hubs, as this entails a higher volume of transactions to be
approved.
330. 3.b Define a framework for further delegation of authority to country directors and
heads of sub-regional hubs as it concerns communication, as well as for
establishing a platform to facilitate access to analytical and knowledge products
prepared by country offices and project teams, including material prepared in local
languages, which should be easily tracked and retrieved.
331. Recommendation 4. Enhance staff incentives and capacity to operate in a
decentralized environment. IFAD needs to create an enabling environment for
decentralization by addressing incentives, skills and competencies of national and
international staff. This will entail the following measures:
332. 4.a Strengthen incentives for out-posted staff (e.g., monetary incentives,
opportunities for career advancements, other benefits), notably for those in
countries with fragility situations where frequent staff moves have the most
disruptive effects.
333. 4.b Expand and better structure the orientation and mentoring programme,
particularly for new staff (national and international), with little previous exposure
to IFAD. While training would naturally include the mandate, strategies and
policies of IFAD, there is also special need to train staff in the country offices on the
functionality of IT systems, security, internal procurement and requirements for
procurements under loans and grants where “no objection” from IFAD is required.
334. 4.c Given the demonstrated importance of their function, IFAD Management should
develop a plan to better recognise and empower CPOs, particularly those heading
country offices. This may involve developing better career management and
providing more training to develop the skills sets needed by CPOs, revisiting the
generic job profiles for NOA, NOB, NOC and NOD to ensure that the levels are
clearly defined, and more explicitly recognising and rewarding the work of CPOs.
335. Recommendation 5. Improve the quality of data, monitoring and self-
assessment. IFAD needs to generate and report data that allow Management and
EB to provide strategic guidance on decentralization, based on assessment of
performance and cost-efficiency of different options. The following priorities are
noted:
336. 5.a Adjust the IFAD accounting system so as to monitor more comprehensively the
cost of country programme management under different ICO configurations, which
has been so far presented in a fragmented manner (e.g., separately for country
staff costs, administrative costs, supervision costs) and report on them clearly in
the official documentation.
337. 5.b Reduce the number of indicators for ICO monitoring, revise the definition of
selected indicators (e.g., Table 2 Chapter III) and integrate them in IFAD-wide
management information systems and RIDE reporting.
338. 5.c Allow for a periodic revision of the IFAD Corporate Decentralization Plan and
report back to the Executive Board for further guidance.
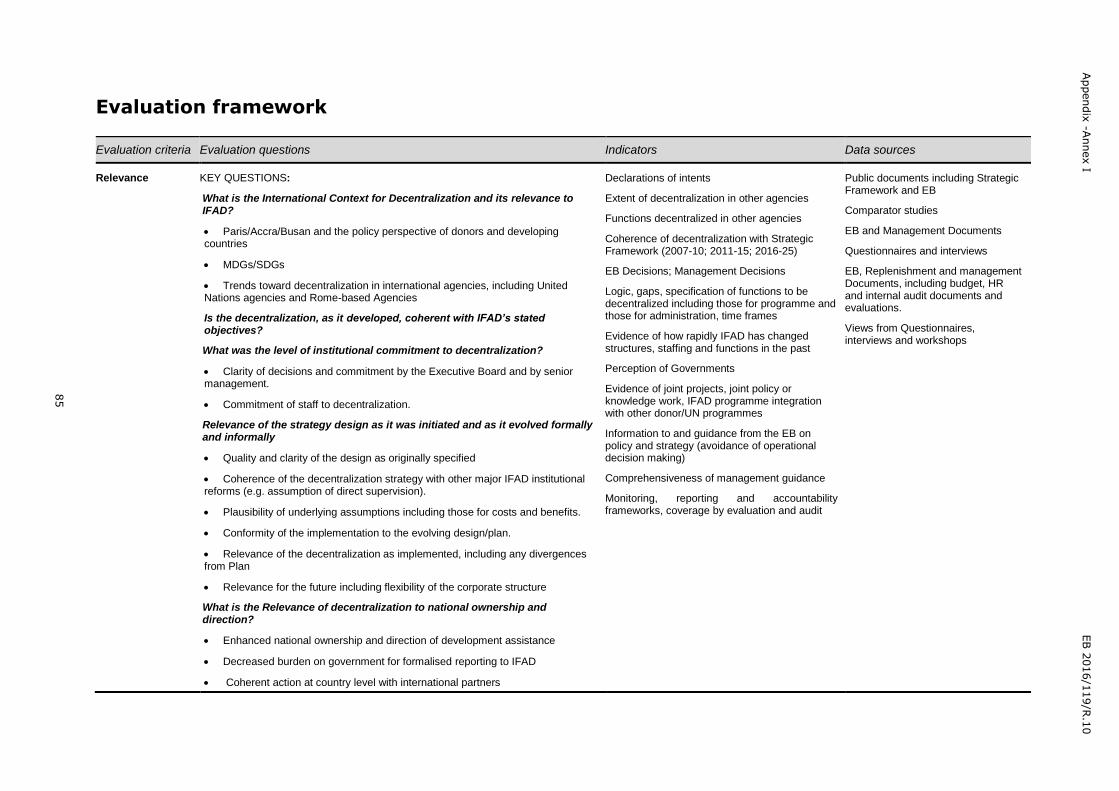
Appendix
-Annex I
EB 2
016/1
19/R
.10
85
Evaluation framework
Evaluation criteria Evaluation questions Indicators Data sources
Relevance KEY QUESTIONS:
What is the International Context for Decentralization and its relevance to IFAD?
Paris/Accra/Busan and the policy perspective of donors and developing countries
MDGs/SDGs
Trends toward decentralization in international agencies, including United Nations agencies and Rome-based Agencies
Is the decentralization, as it developed, coherent with IFAD’s stated objectives?
What was the level of institutional commitment to decentralization?
Clarity of decisions and commitment by the Executive Board and by senior management.
Commitment of staff to decentralization.
Relevance of the strategy design as it was initiated and as it evolved formally and informally
Quality and clarity of the design as originally specified
Coherence of the decentralization strategy with other major IFAD institutional reforms (e.g. assumption of direct supervision).
Plausibility of underlying assumptions including those for costs and benefits.
Conformity of the implementation to the evolving design/plan.
Relevance of the decentralization as implemented, including any divergences from Plan
Relevance for the future including flexibility of the corporate structure
What is the Relevance of decentralization to national ownership and direction?
Enhanced national ownership and direction of development assistance
Decreased burden on government for formalised reporting to IFAD
Coherent action at country level with international partners
Declarations of intents
Extent of decentralization in other agencies
Functions decentralized in other agencies
Coherence of decentralization with Strategic Framework (2007-10; 2011-15; 2016-25)
EB Decisions; Management Decisions
Logic, gaps, specification of functions to be decentralized including those for programme and those for administration, time frames
Evidence of how rapidly IFAD has changed structures, staffing and functions in the past
Perception of Governments
Evidence of joint projects, joint policy or knowledge work, IFAD programme integration with other donor/UN programmes
Information to and guidance from the EB on policy and strategy (avoidance of operational decision making)
Comprehensiveness of management guidance
Monitoring, reporting and accountability frameworks, coverage by evaluation and audit
Public documents including Strategic Framework and EB Comparator studies EB and Management Documents
Questionnaires and interviews EB, Replenishment and management Documents, including budget, HR and internal audit documents and evaluations.
Views from Questionnaires, interviews and workshops

Appendix
-Annex I
EB 2
016/1
19/R
.10
86
Evaluation criteria Evaluation questions Indicators Data sources
How appropriate was the Institutional governance for the decentralization including the Executive Board and Management?
Oversight and management.
Monitoring reporting and accountability.
Effectiveness KEY QUESTIONS:
To what extent has decentralization and the establishment of ICOs contributed to the achievement of IFAD’s institutional objectives?
How did decentralization contribute to preparing country strategies, loan/grant identification and preparation and project preparation of project?
How did decentralization contribute to better supervision and more efficient project implementation?
How did decentralization contribute to strengthening IFAD’s partnerships with in-country stakeholders?
Governments (including counterpart funding)
UN agencies and the local donor community
Enhanced harmonisation of IFAD’s programme with other donors and UN agencies, including the Rome based agencies.
Resource mobilisation and cofinancing
Non-government stakeholders (including civil society organisations representing farmers and beneficiaries and the private sector)
How did decentralization contribute to IFAD’s policy dialogue?
How did decentralization contribute to knowledge management?
How did decentralization contribute to innovation, replication and scaling up?
To what extent has decentralization contributed to achieving better development results including:
relevance, effectiveness and efficiency and overall results
impact on rural poverty
gender equity
Quality at entry ratings of the COSOPs
Survey perception ratings of, and feedback from, ICO case studies and regional consultation workshops on issues related to project design, implementation, partnerships, policy dialogue, knowledge management and capacity building.
Number of projects and value of IFAD financing in countries with country offices
Quantitative analysis of portfolio data (e.g., time from loan approval to entry into force and first disbursement; disbursement profile; average time for processing withdrawal applications; projects at risk; delays in implementation; project status report ratings for selected fiduciary aspects)
Analysis of indicators in the monitoring framework for outreach and scaling up, country programme development, partnership building, policy dialogue and knowledge management and innovation.
Analysis of indicators in the annual portfolio reviews (i.e., development achievement, food security, gender focus, poverty focus; climate and environment focus)
IOE project and country programme evaluation ratings.
Desk review, databases, project status reports, internal audit reports, evaluation reports, online survey, interviews, regional consultation workshops, ICO case studies. Grant-related documentation.
The quantitative analysis of the country office monitoring frameworks, portfolio data and online survey will be done for with and without and before and after (when possible) comparisons.
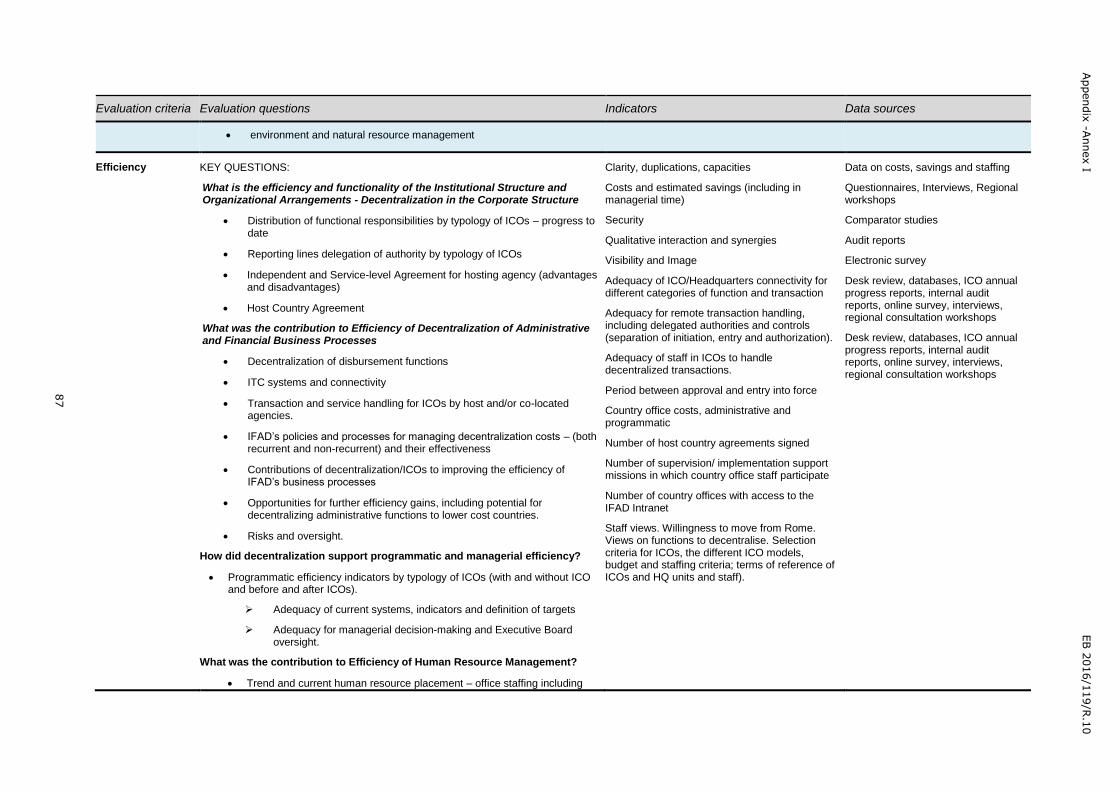
Appendix
-Annex I
EB 2
016/1
19/R
.10
87
Evaluation criteria Evaluation questions Indicators Data sources
environment and natural resource management
Efficiency KEY QUESTIONS:
What is the efficiency and functionality of the Institutional Structure and Organizational Arrangements - Decentralization in the Corporate Structure
Distribution of functional responsibilities by typology of ICOs – progress to date
Reporting lines delegation of authority by typology of ICOs
Independent and Service-level Agreement for hosting agency (advantages and disadvantages)
Host Country Agreement
What was the contribution to Efficiency of Decentralization of Administrative and Financial Business Processes
Decentralization of disbursement functions
ITC systems and connectivity
Transaction and service handling for ICOs by host and/or co-located agencies.
IFAD’s policies and processes for managing decentralization costs – (both recurrent and non-recurrent) and their effectiveness
Contributions of decentralization/ICOs to improving the efficiency of IFAD’s business processes
Opportunities for further efficiency gains, including potential for decentralizing administrative functions to lower cost countries.
Risks and oversight.
How did decentralization support programmatic and managerial efficiency?
Programmatic efficiency indicators by typology of ICOs (with and without ICO and before and after ICOs).
Adequacy of current systems, indicators and definition of targets
Adequacy for managerial decision-making and Executive Board oversight.
What was the contribution to Efficiency of Human Resource Management?
Trend and current human resource placement – office staffing including
Clarity, duplications, capacities
Costs and estimated savings (including in managerial time)
Security
Qualitative interaction and synergies
Visibility and Image
Adequacy of ICO/Headquarters connectivity for different categories of function and transaction
Adequacy for remote transaction handling, including delegated authorities and controls (separation of initiation, entry and authorization).
Adequacy of staff in ICOs to handle decentralized transactions.
Period between approval and entry into force
Country office costs, administrative and programmatic
Number of host country agreements signed
Number of supervision/ implementation support missions in which country office staff participate
Number of country offices with access to the IFAD Intranet
Staff views. Willingness to move from Rome. Views on functions to decentralise. Selection criteria for ICOs, the different ICO models, budget and staffing criteria; terms of reference of ICOs and HQ units and staff).
Data on costs, savings and staffing
Questionnaires, Interviews, Regional workshops
Comparator studies
Audit reports
Electronic survey
Desk review, databases, ICO annual progress reports, internal audit reports, online survey, interviews, regional consultation workshops
Desk review, databases, ICO annual progress reports, internal audit reports, online survey, interviews, regional consultation workshops

Appendix
-Annex I
EB 2
016/1
19/R
.10
88
Evaluation criteria Evaluation questions Indicators Data sources
consultants and use of host agency staff)
Staffing profile of ICOs including terms of reference (clarity) and match of staff with terms of reference in terms of seniority and capacities
Policies for international staff (selection, rotation, career and capacity development, maintaining country knowledge and Headquarters connectedness, incentives).
Policies for national staff, including potential for career development, knowledge of IFAD and staff improvement.
What were the overall costs and savings of decentralization?
Costs and savings by Headquarters Divisions and typology of ICOs (with and without ICO and before and after ICOs); functional breakdown below is desirable but will depend upon data availability.
By Development Support Function
Administrative and Financial Support Function
Costs of oversight of ICOs
Any duplication of functions and efficiency implications
Trends in objects of expenditure including travel, salaries, consultants and communications (ICOs and Headquarters Divisions)
Impact of cost drivers such as salary scales, mix of headquarters-based and local staff, and country requirements for security
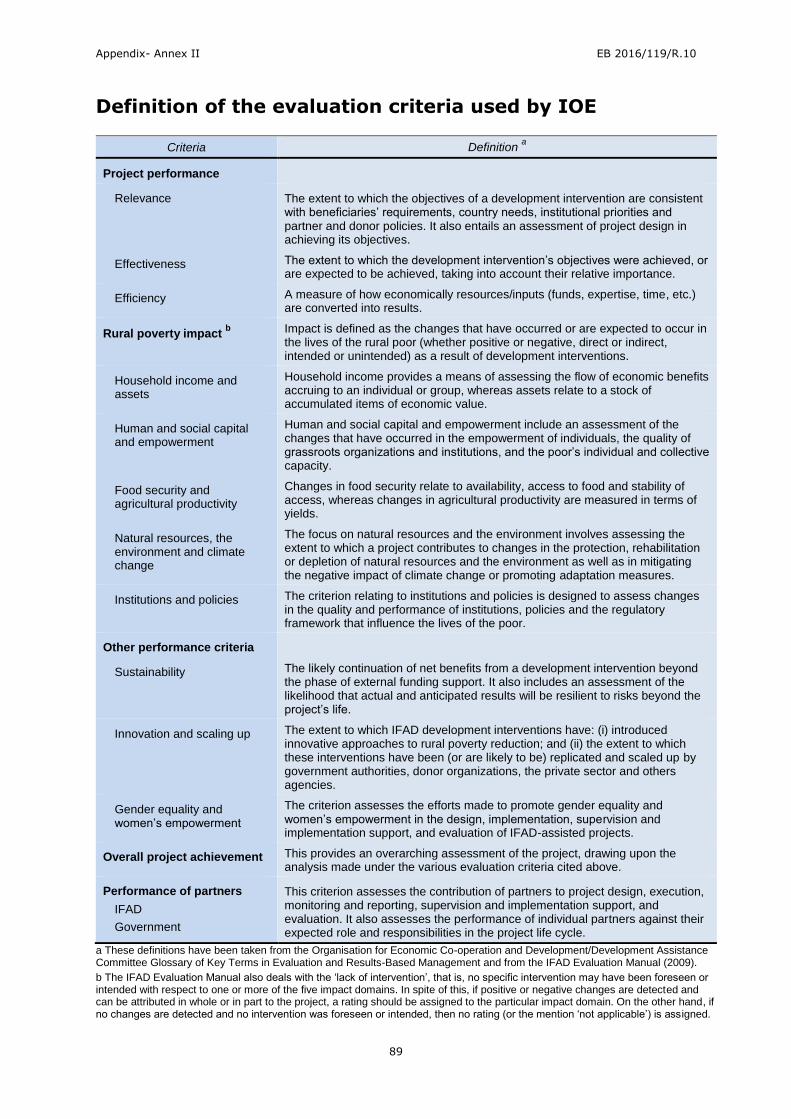
Appendix- Annex II EB 2016/119/R.10
89
Annex III
Definition of the evaluation criteria used by IOE
Criteria Definition a
Project performance
Relevance The extent to which the objectives of a development intervention are consistent with beneficiaries’ requirements, country needs, institutional priorities and partner and donor policies. It also entails an assessment of project design in achieving its objectives.
Effectiveness The extent to which the development intervention’s objectives were achieved, or are expected to be achieved, taking into account their relative importance.
Efficiency A measure of how economically resources/inputs (funds, expertise, time, etc.) are converted into results.
Rural poverty impact b Impact is defined as the changes that have occurred or are expected to occur in
the lives of the rural poor (whether positive or negative, direct or indirect, intended or unintended) as a result of development interventions.
Household income and assets
Household income provides a means of assessing the flow of economic benefits accruing to an individual or group, whereas assets relate to a stock of accumulated items of economic value.
Human and social capital and empowerment
Human and social capital and empowerment include an assessment of the changes that have occurred in the empowerment of individuals, the quality of grassroots organizations and institutions, and the poor’s individual and collective capacity.
Food security and agricultural productivity
Changes in food security relate to availability, access to food and stability of access, whereas changes in agricultural productivity are measured in terms of yields.
Natural resources, the environment and climate change
The focus on natural resources and the environment involves assessing the extent to which a project contributes to changes in the protection, rehabilitation or depletion of natural resources and the environment as well as in mitigating the negative impact of climate change or promoting adaptation measures.
Institutions and policies The criterion relating to institutions and policies is designed to assess changes in the quality and performance of institutions, policies and the regulatory framework that influence the lives of the poor.
Other performance criteria
Sustainability
The likely continuation of net benefits from a development intervention beyond the phase of external funding support. It also includes an assessment of the likelihood that actual and anticipated results will be resilient to risks beyond the project’s life.
Innovation and scaling up The extent to which IFAD development interventions have: (i) introduced innovative approaches to rural poverty reduction; and (ii) the extent to which these interventions have been (or are likely to be) replicated and scaled up by government authorities, donor organizations, the private sector and others agencies.
Gender equality and women’s empowerment
The criterion assesses the efforts made to promote gender equality and women’s empowerment in the design, implementation, supervision and implementation support, and evaluation of IFAD-assisted projects.
Overall project achievement This provides an overarching assessment of the project, drawing upon the analysis made under the various evaluation criteria cited above.
Performance of partners
IFAD
Government
This criterion assesses the contribution of partners to project design, execution, monitoring and reporting, supervision and implementation support, and evaluation. It also assesses the performance of individual partners against their expected role and responsibilities in the project life cycle.
a These definitions have been taken from the Organisation for Economic Co-operation and Development/Development Assistance Committee Glossary of Key Terms in Evaluation and Results-Based Management and from the IFAD Evaluation Manual (2009).
b The IFAD Evaluation Manual also deals with the ‘lack of intervention’, that is, no specific intervention may have been foreseen or intended with respect to one or more of the five impact domains. In spite of this, if positive or negative changes are detected and can be attributed in whole or in part to the project, a rating should be assigned to the particular impact domain. On the other hand, if no changes are detected and no intervention was foreseen or intended, then no rating (or the mention ‘not applicable’) is assigned.

Appendix- Annex III EB 2016/119/R.10
90
Evolution of IFAD’s decentralization
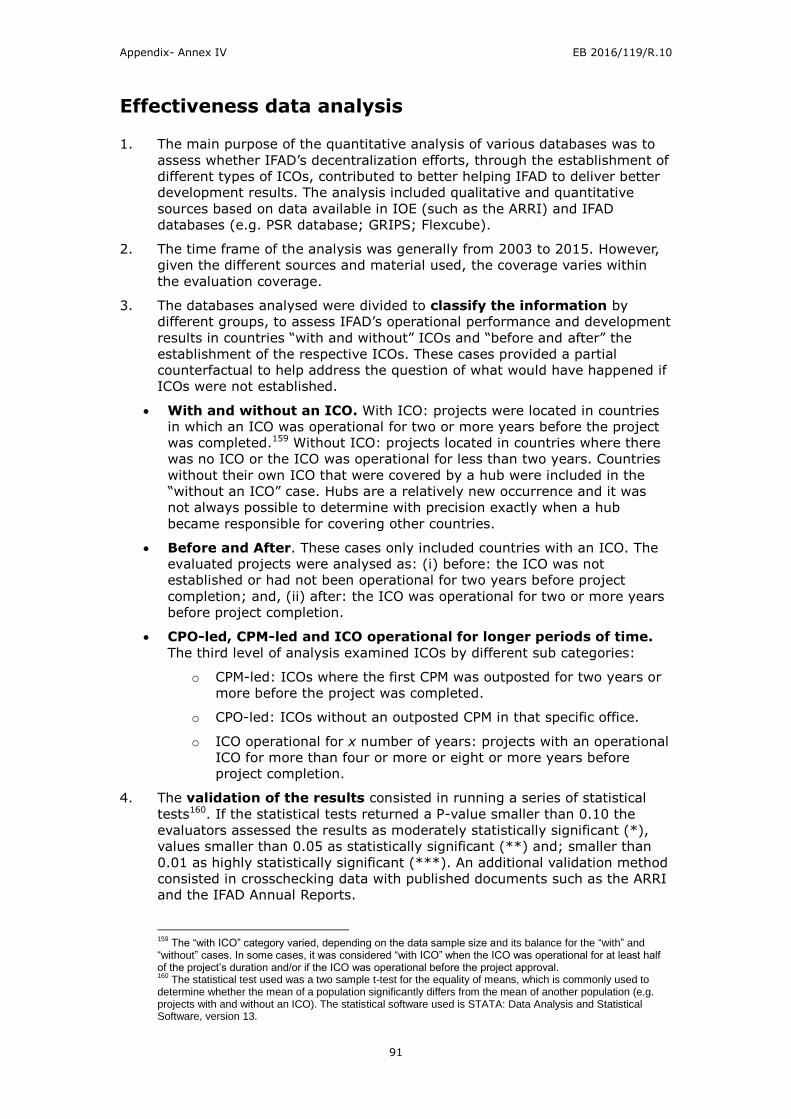
Appendix- Annex IV EB 2016/119/R.10
91
Effectiveness data analysis
1. The main purpose of the quantitative analysis of various databases was to
assess whether IFAD’s decentralization efforts, through the establishment of
different types of ICOs, contributed to better helping IFAD to deliver better
development results. The analysis included qualitative and quantitative
sources based on data available in IOE (such as the ARRI) and IFAD
databases (e.g. PSR database; GRIPS; Flexcube).
2. The time frame of the analysis was generally from 2003 to 2015. However,
given the different sources and material used, the coverage varies within
the evaluation coverage.
3. The databases analysed were divided to classify the information by
different groups, to assess IFAD’s operational performance and development
results in countries “with and without” ICOs and “before and after” the
establishment of the respective ICOs. These cases provided a partial
counterfactual to help address the question of what would have happened if
ICOs were not established.
With and without an ICO. With ICO: projects were located in countries
in which an ICO was operational for two or more years before the project
was completed.159 Without ICO: projects located in countries where there
was no ICO or the ICO was operational for less than two years. Countries
without their own ICO that were covered by a hub were included in the
“without an ICO” case. Hubs are a relatively new occurrence and it was
not always possible to determine with precision exactly when a hub
became responsible for covering other countries.
Before and After. These cases only included countries with an ICO. The
evaluated projects were analysed as: (i) before: the ICO was not
established or had not been operational for two years before project
completion; and, (ii) after: the ICO was operational for two or more years
before project completion.
CPO-led, CPM-led and ICO operational for longer periods of time.
The third level of analysis examined ICOs by different sub categories:
o CPM-led: ICOs where the first CPM was outposted for two years or
more before the project was completed.
o CPO-led: ICOs without an outposted CPM in that specific office.
o ICO operational for x number of years: projects with an operational
ICO for more than four or more or eight or more years before
project completion.
4. The validation of the results consisted in running a series of statistical
tests160. If the statistical tests returned a P-value smaller than 0.10 the
evaluators assessed the results as moderately statistically significant (*),
values smaller than 0.05 as statistically significant (**) and; smaller than
0.01 as highly statistically significant (***). An additional validation method
consisted in crosschecking data with published documents such as the ARRI
and the IFAD Annual Reports.
159
The “with ICO” category varied, depending on the data sample size and its balance for the “with” and “without” cases. In some cases, it was considered “with ICO” when the ICO was operational for at least half of the project’s duration and/or if the ICO was operational before the project approval. 160
The statistical test used was a two sample t-test for the equality of means, which is commonly used to determine whether the mean of a population significantly differs from the mean of another population (e.g. projects with and without an ICO). The statistical software used is STATA: Data Analysis and Statistical Software, version 13.

Appendix
- Annex IV
EB 2
016/1
19/R
.10
92
PCRV/PPA/PE ratings database
5. The PCRV/PPA data series was introduced for the first time in the 2013 ARRI and contains ratings from PCRVs, PPAs and impact
evaluations. The following data analysis includes Project Evaluations (PE) for projects completed after 2007. The database of the
PCRV/PPA/PE ratings for 156 evaluated projects.161 The database includes only completed projects from 2007 to 2015. Only since
2006 have all evaluations been based on a consistent methodology including the use of ratings. From the total sample, 96 projects
closed in 2007-2011 and 60 in 2012-2015.
With and Without Analysis
Table 1 Average score of the PCRV/PPA data series. Countries with ICO 2 years before the project was completed
Project Overall Achievement
Relevance Effectiveness Efficiency Average Project Performance
Partner Performance
IFAD Cooperating Institution
Government NG/ Other
Co-Financiers
Countries without ICOs 3.97 4.38 3.89 3.60 3.95 . 4.13 4.10 3.80 4.43 5.00
Number of observations 103 104 104 103 101 . 104 31 104 7 1
Countries with ICOs 4.29 4.58 4.40 3.83 4.26 . 4.40 4.31 3.98 4.75 4.50
Number of observations 52 52 52 52 52 . 52 13 52 4 5
Mean difference 0.32** 0.19 0.51*** 0.22 0.32** . 0.28*** 0.21 0.18 -.32 0.50
P value 0.0114 0.1680 0.0002 0.1513 0.0137 . 0.0101 0.4253 0.2049 0.7158 .
Total average 4.08 4.45 4.06 3.68 4.05 . 4.22 4.16 3.86 4.55 4.58
Source: ARRI database Note: ***, ** and * denote significance at 1%, 5%, and 10% level.
161
The database includes: 85 PCRVs, 39 PPAs, 2 IEs, and 30 PEs.
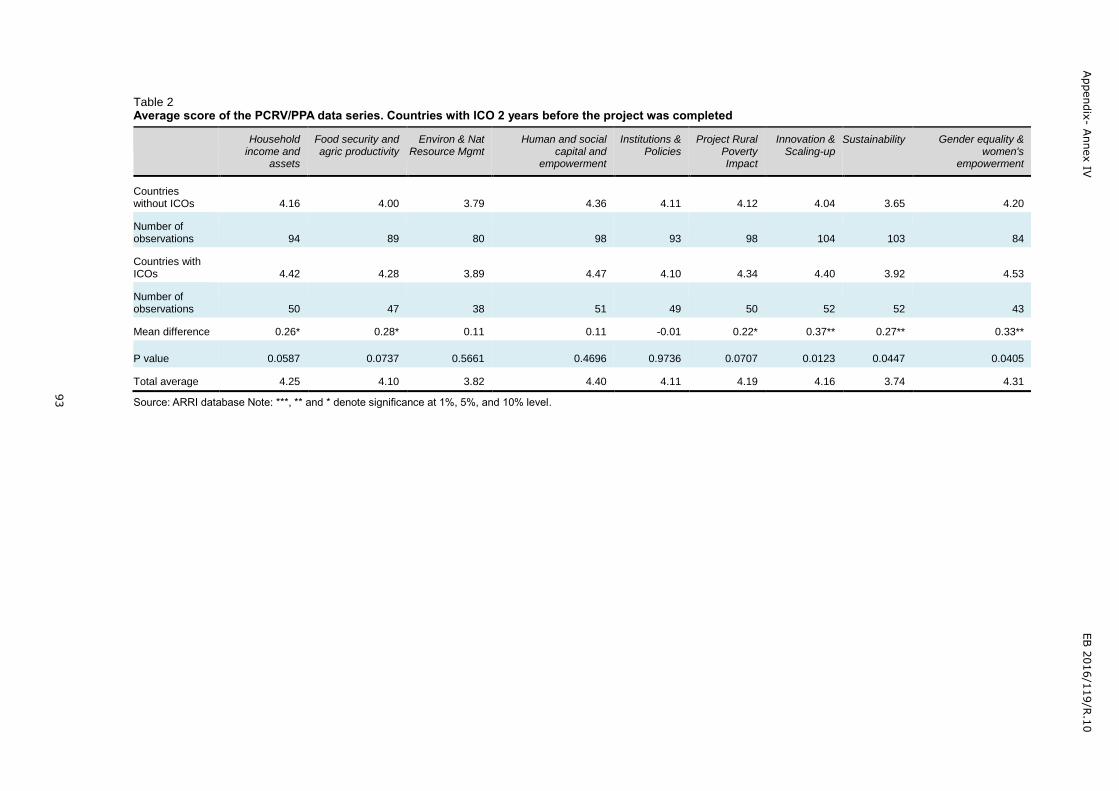
Appendix
- Annex IV
EB 2
016/1
19/R
.10
93
Table 2 Average score of the PCRV/PPA data series. Countries with ICO 2 years before the project was completed
Household income and
assets
Food security and agric productivity
Environ & Nat Resource Mgmt
Human and social capital and
empowerment
Institutions & Policies
Project Rural Poverty Impact
Innovation & Scaling-up
Sustainability Gender equality & women's
empowerment
Countries without ICOs 4.16 4.00 3.79 4.36 4.11 4.12 4.04 3.65 4.20
Number of observations 94 89 80 98 93 98 104 103 84
Countries with ICOs 4.42 4.28 3.89 4.47 4.10 4.34 4.40 3.92 4.53
Number of observations 50 47 38 51 49 50 52 52 43
Mean difference 0.26* 0.28* 0.11 0.11 -0.01 0.22* 0.37** 0.27** 0.33**
P value 0.0587 0.0737 0.5661 0.4696 0.9736 0.0707 0.0123 0.0447 0.0405
Total average 4.25 4.10 3.82 4.40 4.11 4.19 4.16 3.74 4.31
Source: ARRI database Note: ***, ** and * denote significance at 1%, 5%, and 10% level.
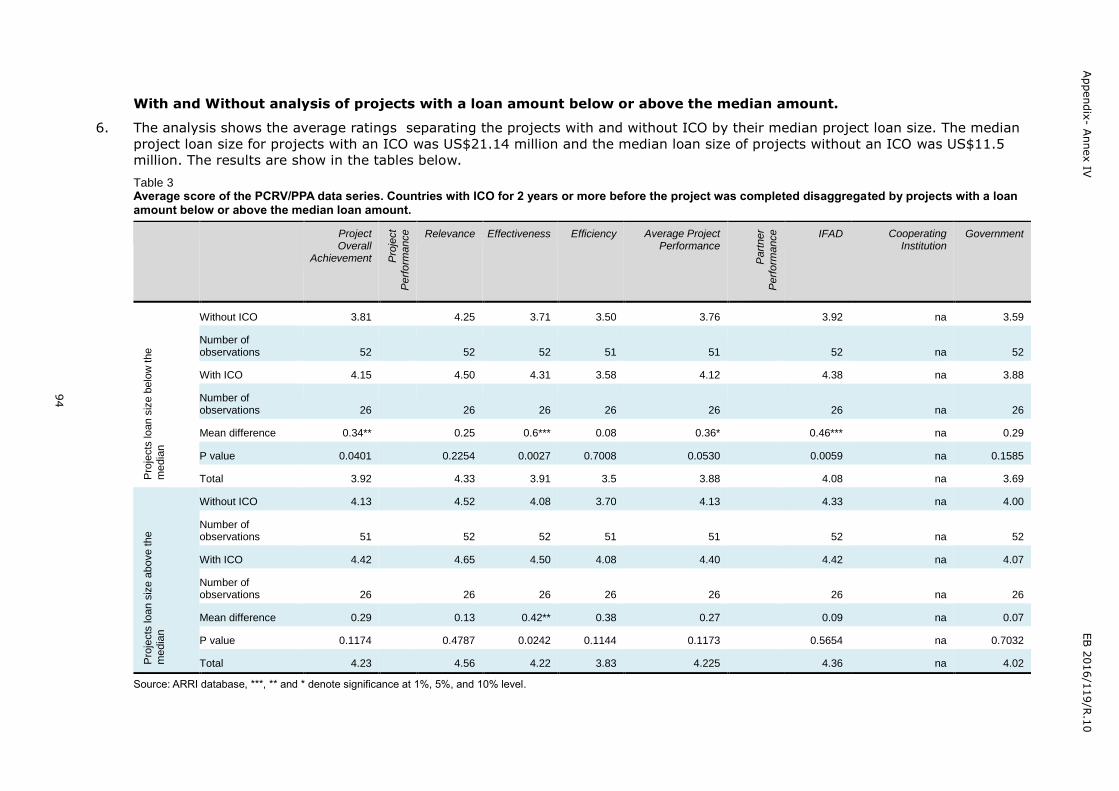
Appendix
- Annex IV
EB 2
016/1
19/R
.10
94
With and Without analysis of projects with a loan amount below or above the median amount.
6. The analysis shows the average ratings separating the projects with and without ICO by their median project loan size. The median
project loan size for projects with an ICO was US$21.14 million and the median loan size of projects without an ICO was US$11.5
million. The results are show in the tables below.
Table 3 Average score of the PCRV/PPA data series. Countries with ICO for 2 years or more before the project was completed disaggregated by projects with a loan amount below or above the median loan amount.
Project Overall
Achievement Pro
ject
Perf
orm
ance
Relevance Effectiveness Efficiency Average Project Performance
Part
ner
Perf
orm
ance
IFAD Cooperating Institution
Government
Pro
jects
lo
an s
ize b
elo
w the
me
dia
n
Without ICO 3.81
4.25 3.71 3.50 3.76 3.92 na 3.59
Number of observations 52 52 52 51 51 52 na 52
With ICO 4.15
4.50 4.31 3.58 4.12 4.38 na 3.88
Number of observations 26 26 26 26 26 26 na 26
Mean difference 0.34**
0.25 0.6*** 0.08 0.36* 0.46*** na 0.29
P value 0.0401 0.2254 0.0027 0.7008 0.0530 0.0059 na 0.1585
Total 3.92 4.33 3.91 3.5 3.88 4.08 na 3.69
Pro
jects
lo
an s
ize a
bove t
he
me
dia
n
Without ICO 4.13
4.52 4.08 3.70 4.13 4.33 na 4.00
Number of observations 51 52 52 51 51 52 na 52
With ICO 4.42
4.65 4.50 4.08 4.40 4.42 na 4.07
Number of observations 26 26 26 26 26 26 na 26
Mean difference 0.29
0.13 0.42** 0.38 0.27 0.09 na 0.07
P value 0.1174 0.4787 0.0242 0.1144 0.1173 0.5654 na 0.7032
Total 4.23 4.56 4.22 3.83 4.225 4.36 na 4.02
Source: ARRI database, ***, ** and * denote significance at 1%, 5%, and 10% level.

Appendix
- Annex IV
EB 2
016/1
19/R
.10
95
Table 4 Average score of the PCRV/PPA data series. Countries with ICO for 2 years or more before the project was completed disaggregated by projects with a loan amount below or above their median.
Household income and
assets
Food security and agric
productivity
Environ & Nat Resource
Mgmt
Human and social capital and
empowerment
Institutions & Policies
Project Rural
Poverty Impact
Overa
rchin
g
Fa
cto
rs
Innovation & Scaling-up
Sustainability Gender equality & women's
empowerment
Pro
jects
lo
an s
ize b
elo
w the m
edia
n Without ICO 3.91 3.76 3.67 4.12 4.04 3.96
3.94 3.57 4.09
Number of observations 47 47 37 50 46 49 52 51 44
With ICO 4.34 4.40 4.12 4.50 4.16 4.32
4.31 3.81 4.43
Number of observations 26 25 16.00 26 24 25 26 26 21
Mean difference 0.43** 0.64*** 0.45* 0.38* 0.12 0.36**
0.37** 0.24 0.34*
P value 0.0353 0.0021 0.0739 0.0697 0.5795 0.0260 0.0500 0.1425 0.0953
Total 4.07 3.98 3.81 4.25 4.08 4.08 4.06 3.65 4.2
Pro
jects
lo
an s
ize a
bove t
he m
edia
n Without ICO 4.40 4.26 3.88 4.60 4.17 4.27 4.13 4 4.33
Number of observations 47 42 43 48 47 49
52 52 40
With ICO 4.50 4.13 3.73 4.44 4.04 4.36 4.50 4 4.64
Number of observations 24 22 22 25 25 25
26 26 22
Mean difference 0.10 -0.13 -0.15 -0.16 -0.13 0.09 0.37 0 0.32
P value 0.5981 0.5899 0.5602 0.4882 0.6023 0.6559
0.1061 0 0.2237
Total 4.44 4.22 3.83 4.55 4.12 4.3 4.25 4 4.43
Source: ARRI database, ***, ** and * denote significance at 1%, 5%, and 10% level.
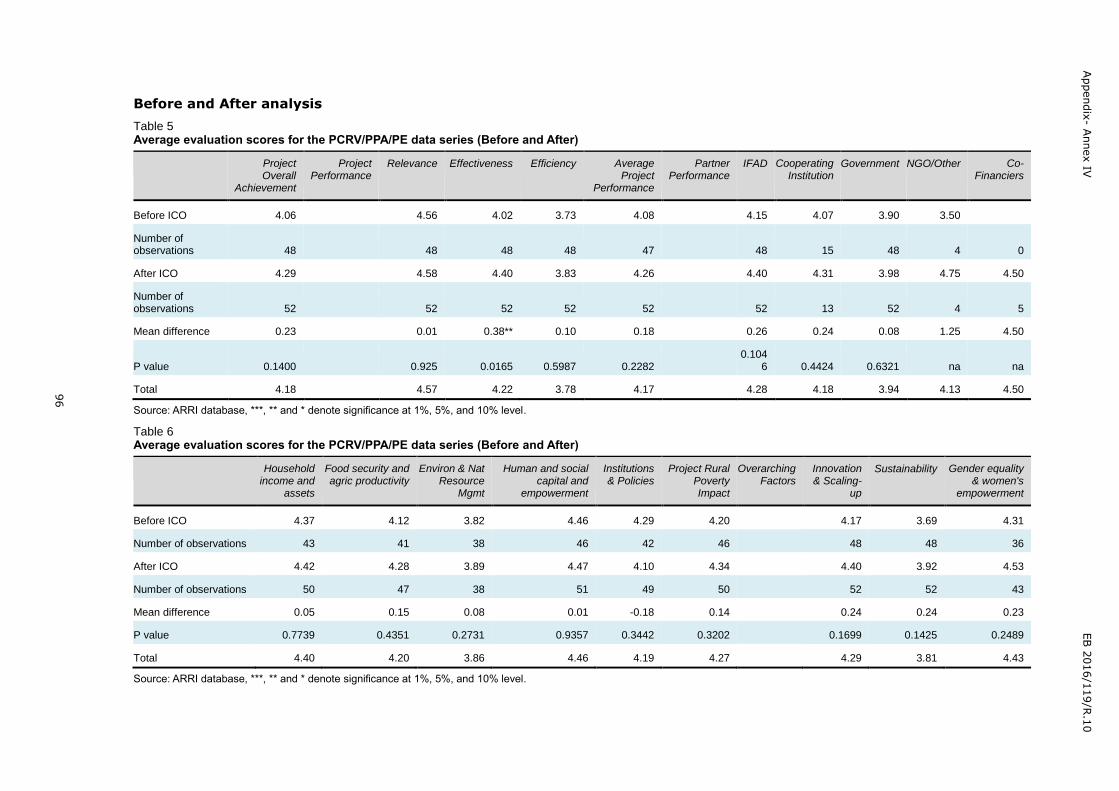
Appendix
- Annex IV
EB 2
016/1
19/R
.10
96
Before and After analysis
Table 5 Average evaluation scores for the PCRV/PPA/PE data series (Before and After)
Project Overall
Achievement
Project Performance
Relevance Effectiveness Efficiency Average Project
Performance
Partner Performance
IFAD Cooperating Institution
Government NGO/Other Co-Financiers
Before ICO 4.06
4.56 4.02 3.73 4.08
4.15 4.07 3.90 3.50
Number of observations 48
48 48 48 47
48 15 48 4 0
After ICO 4.29 4.58 4.40 3.83 4.26 4.40 4.31 3.98 4.75 4.50
Number of observations 52 52 52 52 52 52 13 52 4 5
Mean difference 0.23
0.01 0.38** 0.10 0.18
0.26 0.24 0.08 1.25 4.50
P value 0.1400 0.925 0.0165 0.5987 0.2282 0.104
6 0.4424 0.6321 na na
Total 4.18
4.57 4.22 3.78 4.17
4.28 4.18 3.94 4.13 4.50
Source: ARRI database, ***, ** and * denote significance at 1%, 5%, and 10% level.
Table 6 Average evaluation scores for the PCRV/PPA/PE data series (Before and After)
Household income and
assets
Food security and agric productivity
Environ & Nat Resource
Mgmt
Human and social capital and
empowerment
Institutions & Policies
Project Rural Poverty Impact
Overarching Factors
Innovation & Scaling-
up
Sustainability Gender equality & women's
empowerment
Before ICO 4.37 4.12 3.82 4.46 4.29 4.20
4.17 3.69 4.31
Number of observations 43 41 38 46 42 46
48 48 36
After ICO 4.42 4.28 3.89 4.47 4.10 4.34
4.40 3.92 4.53
Number of observations 50 47 38 51 49 50
52 52 43
Mean difference 0.05 0.15 0.08 0.01 -0.18 0.14
0.24 0.24 0.23
P value 0.7739 0.4351 0.2731 0.9357 0.3442 0.3202
0.1699 0.1425 0.2489
Total 4.40 4.20 3.86 4.46 4.19 4.27
4.29 3.81 4.43
Source: ARRI database, ***, ** and * denote significance at 1%, 5%, and 10% level.
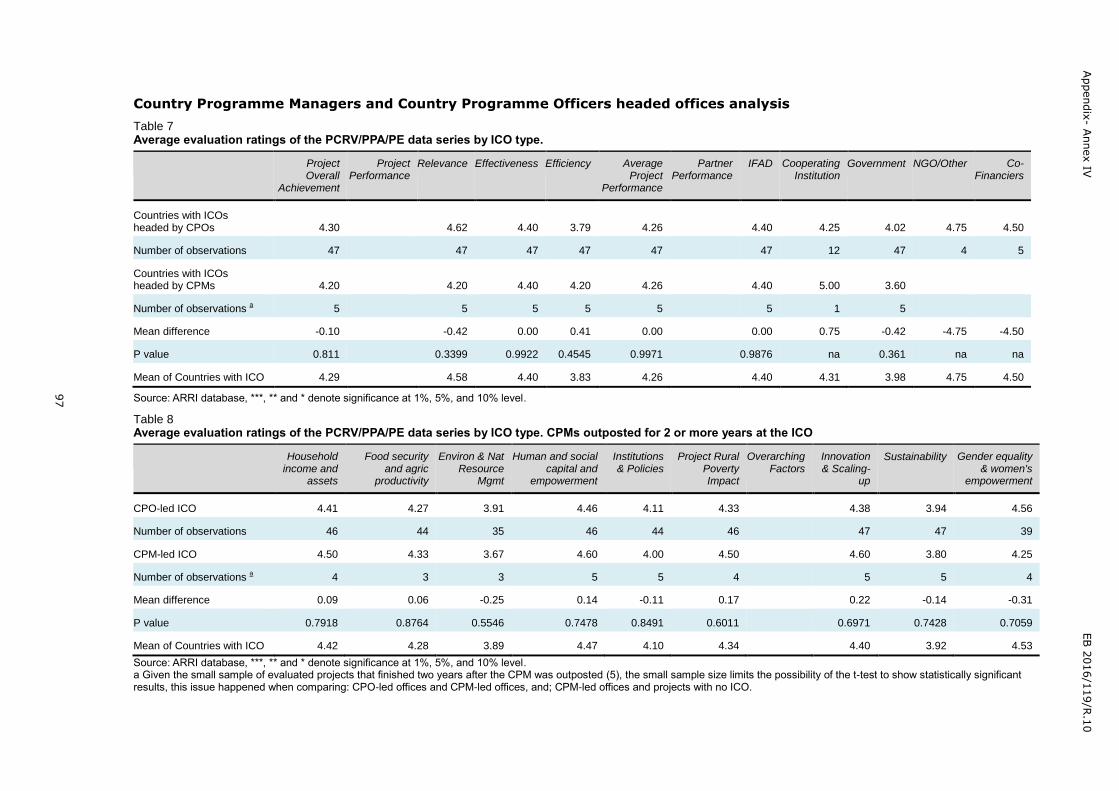
Appendix
- Annex IV
EB 2
016/1
19/R
.10
97
Country Programme Managers and Country Programme Officers headed offices analysis
Table 7 Average evaluation ratings of the PCRV/PPA/PE data series by ICO type.
Project Overall
Achievement
Project Performance
Relevance Effectiveness Efficiency Average Project
Performance
Partner Performance
IFAD Cooperating Institution
Government NGO/Other Co-Financiers
Countries with ICOs headed by CPOs 4.30 4.62 4.40 3.79 4.26 4.40 4.25 4.02 4.75 4.50
Number of observations 47 47 47 47 47 47 12 47 4 5
Countries with ICOs headed by CPMs 4.20 4.20 4.40 4.20 4.26 4.40 5.00 3.60
Number of observations a 5 5 5 5 5 5 1 5
Mean difference -0.10
-0.42 0.00 0.41 0.00
0.00 0.75 -0.42 -4.75 -4.50
P value 0.811
0.3399 0.9922 0.4545 0.9971
0.9876 na 0.361 na na
Mean of Countries with ICO 4.29
4.58 4.40 3.83 4.26
4.40 4.31 3.98 4.75 4.50
Source: ARRI database, ***, ** and * denote significance at 1%, 5%, and 10% level.
Table 8 Average evaluation ratings of the PCRV/PPA/PE data series by ICO type. CPMs outposted for 2 or more years at the ICO
Household income and
assets
Food security and agric
productivity
Environ & Nat Resource
Mgmt
Human and social capital and
empowerment
Institutions & Policies
Project Rural Poverty Impact
Overarching Factors
Innovation & Scaling-
up
Sustainability Gender equality & women's
empowerment
CPO-led ICO 4.41 4.27 3.91 4.46 4.11 4.33 4.38 3.94 4.56
Number of observations 46 44 35 46 44 46 47 47 39
CPM-led ICO 4.50 4.33 3.67 4.60 4.00 4.50 4.60 3.80 4.25
Number of observations a 4 3 3 5 5 4 5 5 4
Mean difference 0.09 0.06 -0.25 0.14 -0.11 0.17
0.22 -0.14 -0.31
P value 0.7918 0.8764 0.5546 0.7478 0.8491 0.6011
0.6971 0.7428 0.7059
Mean of Countries with ICO 4.42 4.28 3.89 4.47 4.10 4.34
4.40 3.92 4.53
Source: ARRI database, ***, ** and * denote significance at 1%, 5%, and 10% level. a Given the small sample of evaluated projects that finished two years after the CPM was outposted (5), the small sample size limits the possibility of the t-test to show statistically significant results, this issue happened when comparing: CPO-led offices and CPM-led offices, and; CPM-led offices and projects with no ICO.

Appendix
- Annex IV
EB 2
016/1
19/R
.10
98
Country Programme Evaluation ratings (2006 – 2015)
7. Using the ARRI database, the evaluation also assessed the performance of IFAD country programmes beyond the project level,
using the assessments contained in CPEs. A total of 36 CPEs have been produced since 2006 based on a consistent methodology including the use of ratings, which allows for the aggregation of results across country programmes. For this analysis the “with ICO” case includes those countries in which the ICO was operational for at least four years before the CPE was completed.
Table 9 CPE database for Countries in with and without ICO.
Score average Relevance Effectiveness Efficiency Overall project
performance
Rural poverty impact
Sustainability Innovations, replication
and scaling up
Gender Overall portfolio
achievement
Performance of IFAD
Performance of
Government
Performance of
cooperating institutions
Countries without ICOs 4.28 3.89 3.67 3.89 4.11 3.56 3.83 3.91 3.83 3.94 3.83 3.78
Number of observations 18 18 18 18 18 18 18 11 18 18 18 9
Countries with ICOs 4.61 4.17 3.83 4.29 4.41 3.89 4.33 4.69 4.29 4.50 4.17 4.00
Number of observations 18 18 18 17 17 18 18 13 17 18 18 6
Mean difference 0.33* 0.28 0.17 0.4** 0.30 0.33* 0.5** 0.78*** 0.46*** 0.55*** 0.33 0.22
P value 0.0726 0.1018 0.5025 0.0300 0.1127 0.0771 0.0108 0.0013 0.0091 0.0033 0.1151 0.1690
Total 4.44 4.03 3.75 4.08 4.26 3.72 4.08 4.33 4.06 4.22 4 3.87
Source: ARRI database, Note: ***, ** and * denote significance at 1%, 5%, and 10% level .
Table 10 CPE database for Countries in with and without ICO.
Score average Policy dialogue Partnership building Knowledge management Overall NLA COSOP relevance COSOP effectiveness COSOP performance
Countries without ICOs 3.33 3.78 3.78 3.72 3.82 3.54 3.75
Number of observations 18 18 18 18 17 13 16
Countries with ICOs 3.72 3.89 3.67 3.78 4.50 4.14 4.40
Number of observations 18 18 18 18 18 14 15
Mean difference 0.39 0.11 -0.11 0.06 0.68*** 0.60*** 0.65***
P value 0.1547 0.6177 0.6750 0.7684 0.0017 0.0063 0.0054
Total 3.53 3.83 3.72 3.75 4.17 3.85 4.06
Source: ARRI database, Note: ***, ** and * denote significance at 1%, 5%, and 10% level.
Appendix
- Annex IV
EB 2
016/1
19/R
.10
99
Portfolio Indicators
Cofinancing
8. Cofinancing includes: domestic contributions from recipient governments, from beneficiaries, and international resources from
bilateral and multilateral organizations. The levels of cofinancing are affected by many external factors and approvals vary greatly
from year to year. The objective of this analysis was to test whether there was a trend or any relation between the level of
cofinancing and the presence of an IFAD country Office. The analysis includes all IFAD investment projects approved from 2003 to
2015 (sample size: 427 projects). The “with ICO” case included projects approved in countries when ICOs were operational and in
the case of CPM-led ICOs if the CPM was outposted before project approval. The before and after ICO analysis included projects in
countries that were approved after the ICO became operational

Appendix
- Annex IV
EB 2
016/1
19/R
.10
100
Table 11 Average financing of IFAD Investment Projects (2003-2015) With and without ICOs
Domestic IFAD International
Without ICO 24% 58% 19%
Number of observations 270 270 270
With ICO 27% 59% 14%
Number of observations 157 157 157
Average difference 3%* 1% -5%**
p value 0.0860 0.5699 0.0275
Total Average 25% 58% 17%
Source: Grants and Investment Project System (Grips), Note: ***, ** and * denote significance at 1%, 5%, and 10% level .
Table 12 Average financing of IFAD Investment Project, 2003-2015 for CPO and CPM led ICOs
Domestic IFAD International
CPO-led 29% 59% 13%
Number of observations 121 121 121
CPM-led 21% 61% 19%
Number of observations 36 36 36
Average diff. CPM vs. CPO -8%*** 2% 6%
p value 0.0386 0.7246 0.2132
Total Average 27% 59% 14%
Source: Grants and Investment Project System (Grips), Note: ***, ** and * denote significance at 1%, 5%, and 10% level .
.

Appendix
- Annex IV
EB 2
016/1
19/R
.10
101
Table 13 Average financing of IFAD Investment Project, 2003-2015 before and after ICOs
Domestic IFAD International
Before ICO 20% 60% 19%
Number of observations 107 107 107
After ICO 27% 59% 14%
Number of observations 157 157 157
Average diff. After vs Before 7%*** -1% -6%*
p value 0.0013 0.6678 0.0525
Total Average 25% 60% 16%
Source: Grants and Investment Project System (Grips), Note: ***, ** and * denote significance at 1%, 5%, and 10% level.
Table 14 Average financing of IFAD Investment Project, 2003-2015 for ICOs that were operational for 5 years before project approval
Domestic IFAD International
Without ICO 24% 58% 19%
Number of observations 270 270 270
ICO opp 5y+ 29% 62% 8%
Number of observations 64 64 64
Average diff. ICO vs without ICO 6%* 5% -10%***
p value 0.0770 0.1797 0.0003
Total Average 25% 58% 17%
Source: Grants and Investment Project System (Grips), Note: ***, ** and * denote significance at 1%, 5%, and 10% level.
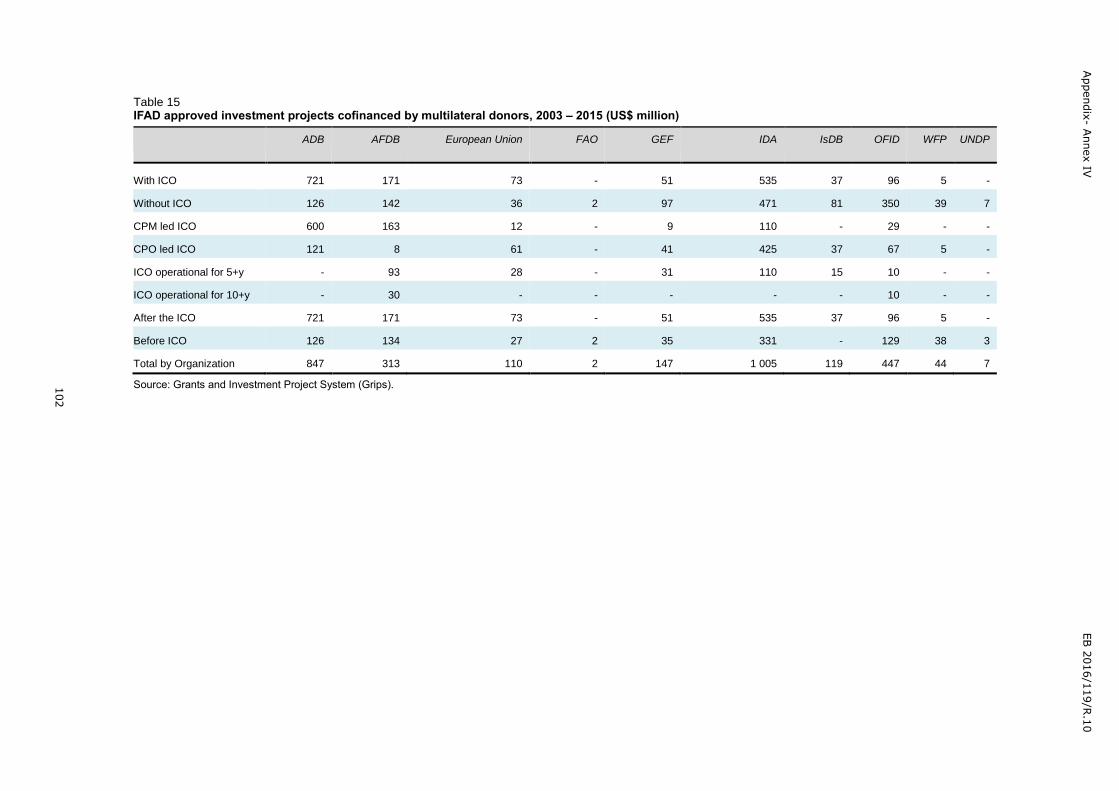
Appendix
- Annex IV
EB 2
016/1
19/R
.10
102
Table 15 IFAD approved investment projects cofinanced by multilateral donors, 2003 – 2015 (US$ million)
ADB AFDB European Union FAO GEF IDA IsDB OFID WFP UNDP
With ICO 721 171 73 - 51 535 37 96 5 -
Without ICO 126 142 36 2 97 471 81 350 39 7
CPM led ICO 600 163 12 - 9 110 - 29 - -
CPO led ICO 121 8 61 - 41 425 37 67 5 -
ICO operational for 5+y - 93 28 - 31 110 15 10 - -
ICO operational for 10+y - 30 - - - - - 10 - -
After the ICO 721 171 73 - 51 535 37 96 5 -
Before ICO 126 134 27 2 35 331 - 129 38 3
Total by Organization 847 313 110 2 147 1 005 119 447 44 7
Source: Grants and Investment Project System (Grips).

Appendix
- Annex IV
EB 2
016/1
19/R
.10
103
Policy Dialogue
9. The policy dialogue analysis consisted in extracting data from the country-level policy engagement in IFAD, the 2016 Management
review of policy engagement experience. As in the previous analysis, the data was divided by different criteria. The results are
shown in the tables below.
Table 16 With or without operational ICO after the COSOP was produced
COSOP Policy Dialogue Articulation Score
% of projects in a country's portfolio in which the design document describes policy engagement
Without ICO (Countries Where the ICO was Established After the COSOP Was Produced) 2.58 50%
Number of observations 45 47
With ICO (Countries Where the ICO was Established Before the COSOP Was Produced) 2.16 52%
Number of observations 25 25
Mean difference -0.42 2%
P value 0.1661 0.8023
Total average 2.4286 51%
Source: Country-level policy engagement in IFAD (2016).
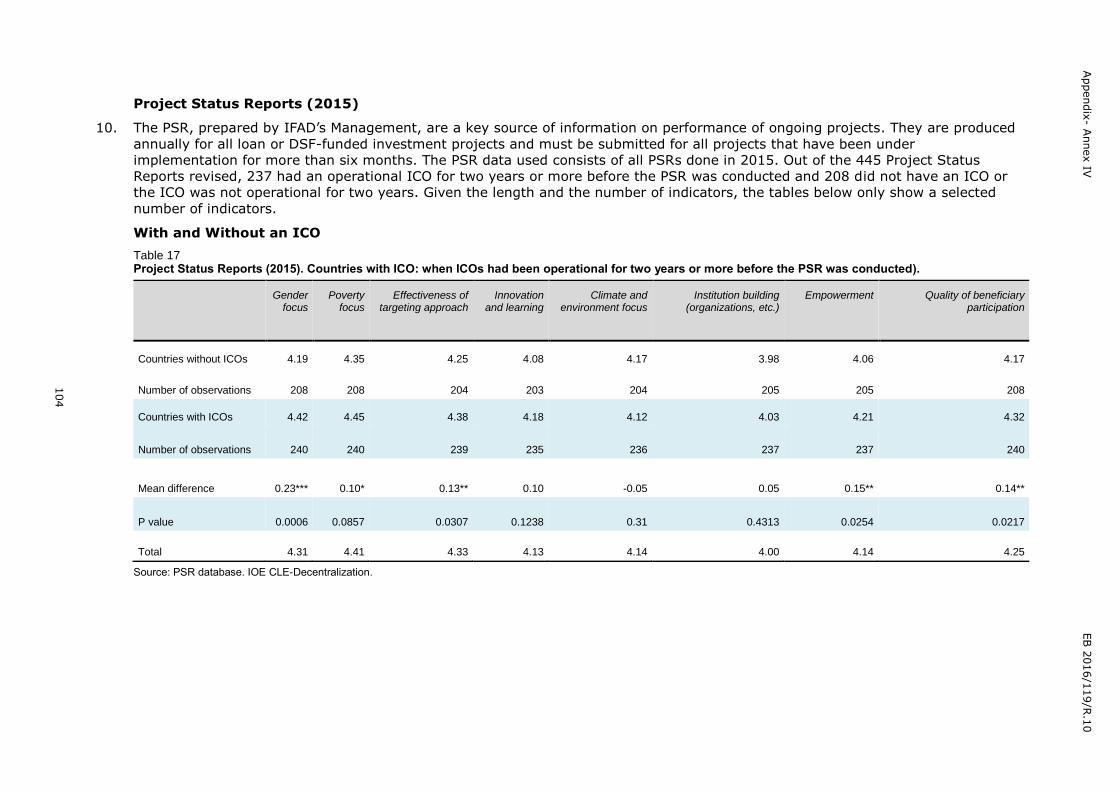
Appendix
- Annex IV
EB 2
016/1
19/R
.10
104
Project Status Reports (2015)
10. The PSR, prepared by IFAD’s Management, are a key source of information on performance of ongoing projects. They are produced
annually for all loan or DSF-funded investment projects and must be submitted for all projects that have been under
implementation for more than six months. The PSR data used consists of all PSRs done in 2015. Out of the 445 Project Status
Reports revised, 237 had an operational ICO for two years or more before the PSR was conducted and 208 did not have an ICO or
the ICO was not operational for two years. Given the length and the number of indicators, the tables below only show a selected
number of indicators.
With and Without an ICO
Table 17 Project Status Reports (2015). Countries with ICO: when ICOs had been operational for two years or more before the PSR was conducted).
Gender focus
Poverty focus
Effectiveness of targeting approach
Innovation and learning
Climate and environment focus
Institution building (organizations, etc.)
Empowerment Quality of beneficiary participation
Countries without ICOs 4.19 4.35 4.25 4.08 4.17 3.98 4.06 4.17
Number of observations 208 208 204 203 204 205 205 208
Countries with ICOs 4.42 4.45 4.38 4.18 4.12 4.03 4.21 4.32
Number of observations 240 240 239 235 236 237 237 240
Mean difference 0.23*** 0.10* 0.13** 0.10 -0.05 0.05 0.15** 0.14**
P value 0.0006 0.0857 0.0307 0.1238 0.31 0.4313 0.0254 0.0217
Total 4.31 4.41 4.33 4.13 4.14 4.00 4.14 4.25
Source: PSR database. IOE CLE-Decentralization.

Appendix
- Annex IV
EB 2
016/1
19/R
.10
105
Table 18 Project Status Reports (2015). Countries with ICO: when the ICO had been operational for two years or more before the PSR was conducted.
Responsiveness of service providers
Potential for scaling up and replication
Physical / financial assets
Food security Likelihood of achieving the development objectives (section B3
and B4)
Quality of natural asset improvement and climate
resilience
Countries without ICOs 4.11 4.28 4.02 3.99 4.09 4.03
Number of observations 208 200 205 205 208 205
Countries with ICOs 4.11 4.31 4.07 4.12 4.12 4.04
Number of observations 240 236 235 235 240 235
Mean difference 0.00 0.03 0.05 0.14 0.03 0.01
P value 0.9752 0.6632 0.4628 0.0327** 0.5963 0.8137
Total 4.11 4.29 4.05 4.06 4.10 4.04
Source: PSR database. IOE CLE-Decentralization.
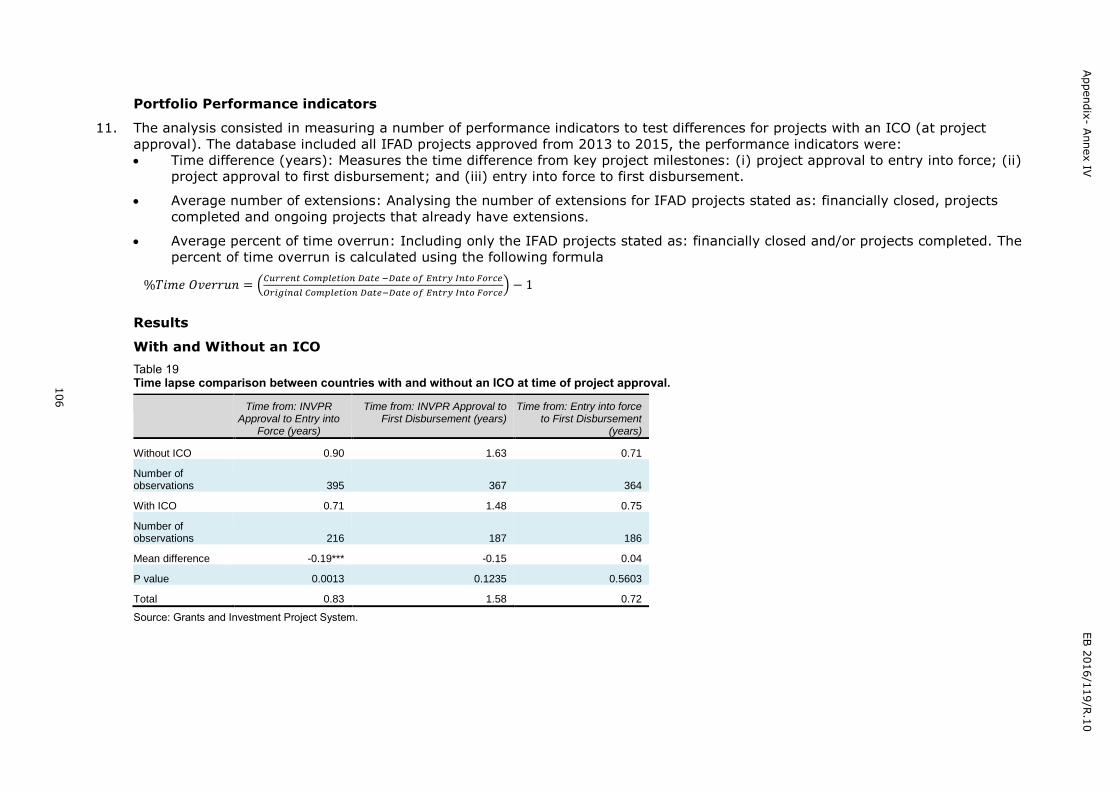
Appendix
- Annex IV
EB 2
016/1
19/R
.10
106
Portfolio Performance indicators
11. The analysis consisted in measuring a number of performance indicators to test differences for projects with an ICO (at project
approval). The database included all IFAD projects approved from 2013 to 2015, the performance indicators were:
Time difference (years): Measures the time difference from key project milestones: (i) project approval to entry into force; (ii)
project approval to first disbursement; and (iii) entry into force to first disbursement.
Average number of extensions: Analysing the number of extensions for IFAD projects stated as: financially closed, projects
completed and ongoing projects that already have extensions.
Average percent of time overrun: Including only the IFAD projects stated as: financially closed and/or projects completed. The
percent of time overrun is calculated using the following formula
%𝑇𝑖𝑚𝑒 𝑂𝑣𝑒𝑟𝑟𝑢𝑛 = (𝐶𝑢𝑟𝑟𝑒𝑛𝑡 𝐶𝑜𝑚𝑝𝑙𝑒𝑡𝑖𝑜𝑛 𝐷𝑎𝑡𝑒 −𝐷𝑎𝑡𝑒 𝑜𝑓 𝐸𝑛𝑡𝑟𝑦 𝐼𝑛𝑡𝑜 𝐹𝑜𝑟𝑐𝑒
𝑂𝑟𝑖𝑔𝑖𝑛𝑎𝑙 𝐶𝑜𝑚𝑝𝑙𝑒𝑡𝑖𝑜𝑛 𝐷𝑎𝑡𝑒−𝐷𝑎𝑡𝑒 𝑜𝑓 𝐸𝑛𝑡𝑟𝑦 𝐼𝑛𝑡𝑜 𝐹𝑜𝑟𝑐𝑒) − 1
Results
With and Without an ICO
Table 19 Time lapse comparison between countries with and without an ICO at time of project approval.
Time from: INVPR Approval to Entry into
Force (years)
Time from: INVPR Approval to First Disbursement (years)
Time from: Entry into force to First Disbursement
(years)
Without ICO 0.90 1.63 0.71
Number of observations 395 367 364
With ICO 0.71 1.48 0.75
Number of observations 216 187 186
Mean difference -0.19*** -0.15 0.04
P value 0.0013 0.1235 0.5603
Total 0.83 1.58 0.72
Source: Grants and Investment Project System.

Appendix
- Annex IV
EB 2
016/1
19/R
.10
107
Before and After ICO
Table 20 Time lapse comparison for countries before and after the establishment of the ICO
Time from: INVPR Approval to Entry into
Force (years)
Time from: INVPR Approval to First Disbursement (years)
Time from: Entry into force to First Disbursement (years)
Before ICO 0.91 1.62 0.70
Number of observations 152 151 151
After the ICO 0.71 1.48 0.75
Number of observations 219 187 187
Mean difference -0.21** -0.13 0.05
P value 0.0115 0.2502 0.5652
Total 0.79 1.54 0.73
Source: Grants and Investment Project System.
CPM and CPO headed offices and projects with ICOs for a longer period of time
Table 21 Time lapse comparison CPO-led and CPM-led offices at project approval
Time from: INVPR Approval to Entry into
Force (years)
Time from: INVPR Approval to First Disbursement (years)
Time from: Entry into force to First Disbursement (years)
CPO led ICO 0.77 1.62 0.81
Number of observations 170 153 152
CPM led ICO 0.48 0.88 0.44
Number of observations 46 34 34
Mean difference -0.29*** -0.74*** -0.37***
P value 0.0002 0.00001 0.00001
Total 0.66 1.33 0.64
Source: Grants and Investment Project System.

Appendix
- Annex IV
EB 2
016/1
19/R
.10
108
Table 22 Time lapse comparison of ICOs operational for longer period of time
Time from: INVPR Approval to Entry into Force (years)
Time from: INVPR Approval to First Disbursement (years)
Time from: Entry into force to First Disbursement (years)
ICO operational for 5+y 0.57 1.43 0.84
Number of observations 78 70 70
ICO operational for 10+y 0.38 1.01 0.63
Number of observations 20 18 18
CPM led office for 2+y 0.38 0.92 0.53
Number of observations 25 23 23
Average (with ICOs) 0.71 1.48 0.75
Number of observations 218 189 188
Source: Grants and Investment Project System.
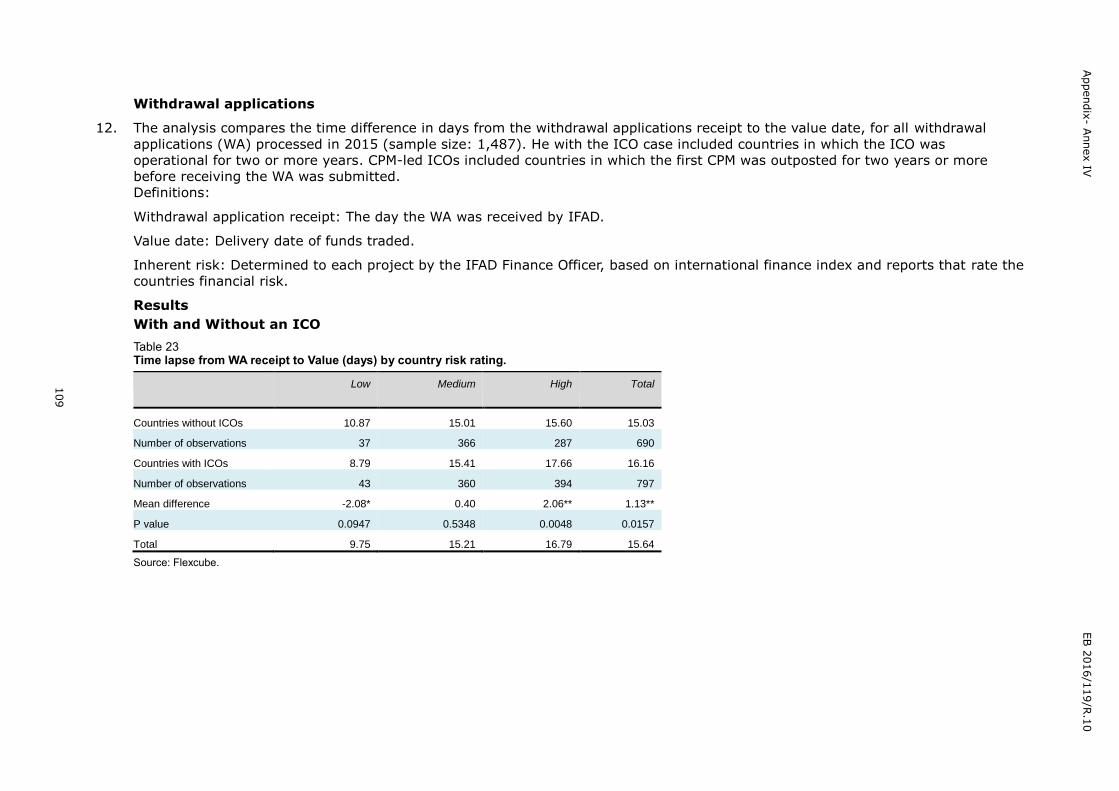
Appendix
- Annex IV
EB 2
016/1
19/R
.10
109
Withdrawal applications
12. The analysis compares the time difference in days from the withdrawal applications receipt to the value date, for all withdrawal
applications (WA) processed in 2015 (sample size: 1,487). He with the ICO case included countries in which the ICO was
operational for two or more years. CPM-led ICOs included countries in which the first CPM was outposted for two years or more
before receiving the WA was submitted.
Definitions:
Withdrawal application receipt: The day the WA was received by IFAD.
Value date: Delivery date of funds traded.
Inherent risk: Determined to each project by the IFAD Finance Officer, based on international finance index and reports that rate the
countries financial risk.
Results
With and Without an ICO
Table 23 Time lapse from WA receipt to Value (days) by country risk rating.
Low Medium High Total
Countries without ICOs 10.87 15.01 15.60 15.03
Number of observations 37 366 287 690
Countries with ICOs 8.79 15.41 17.66 16.16
Number of observations 43 360 394 797
Mean difference -2.08* 0.40 2.06** 1.13**
P value 0.0947 0.5348 0.0048 0.0157
Total 9.75 15.21 16.79 15.64
Source: Flexcube.

Appendix
- Annex IV
EB 2
016/1
19/R
.10
110
Table 24 Time lapse from WA receipt to Value (days) by country risk rating for CPM and CPO-led ICOs
Low Medium High Total
Countries with CPO 7.42 15.53 17.38 16.06
Number of observations 27 187 252 466
Countries with CPM 11.09 15.27 18.16 16.31
Number of observations 16 173 142 331
Mean difference 3.67** -0.26 0.78 0.25
P value 0.0228 0.7687 0.3992 0.6940
Total 8.79 15.41 17.66 16.16
Source: Flexcube.
Table 25 Time lapse from WA receipt to Value (days) by country risk ratings when the ICO was operational for four years or more
Low Medium High Total
Countries without ICOs 10.87 15.01 15.84 15.23
Number of observations 37 389 406 832
Countries with ICOs 8.79 15.44 18.20 16.16
Number of observations 43 337 275 655
Mean difference -2.08* 0.43 2.36*** 0.93**
P value 0.0947 0.4985 0.001 0.0456
Total 9.75 15.21 16.79 15.64
Source: Flexcube.
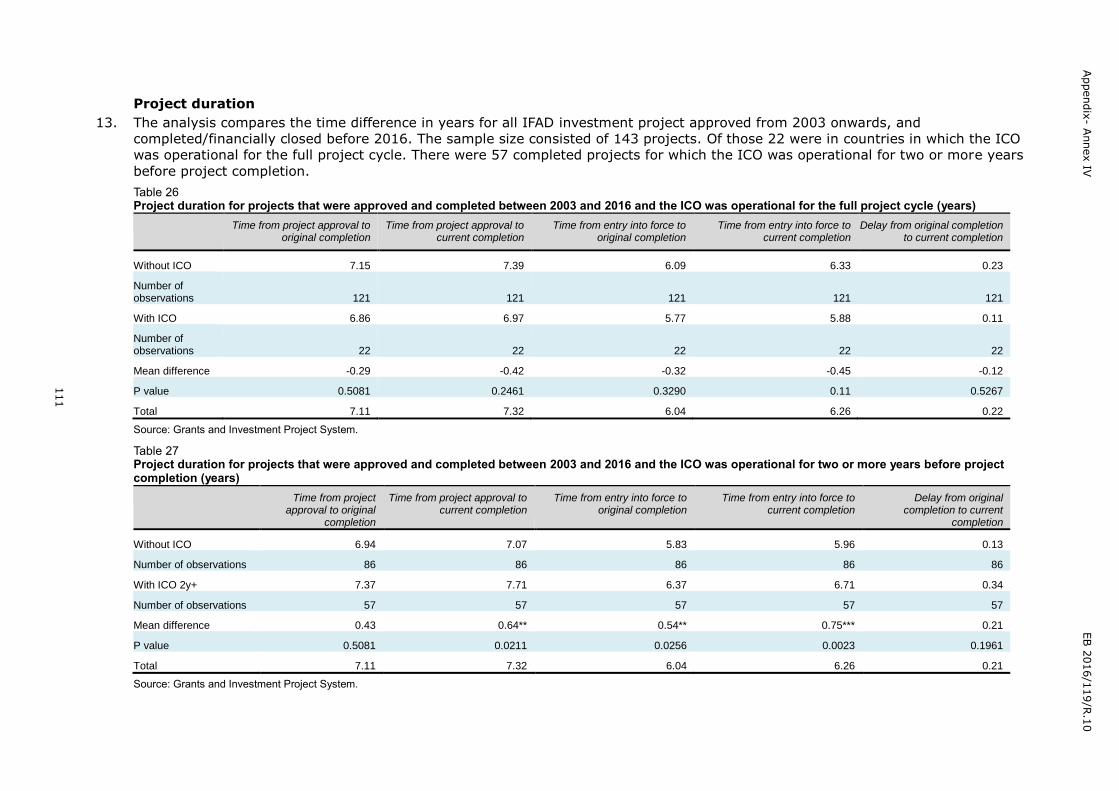
Appendix
- Annex IV
EB 2
016/1
19/R
.10
111
Project duration
13. The analysis compares the time difference in years for all IFAD investment project approved from 2003 onwards, and
completed/financially closed before 2016. The sample size consisted of 143 projects. Of those 22 were in countries in which the ICO
was operational for the full project cycle. There were 57 completed projects for which the ICO was operational for two or more years
before project completion.
Table 26 Project duration for projects that were approved and completed between 2003 and 2016 and the ICO was operational for the full project cycle (years)
Time from project approval to original completion
Time from project approval to current completion
Time from entry into force to original completion
Time from entry into force to current completion
Delay from original completion to current completion
Without ICO 7.15 7.39 6.09 6.33 0.23
Number of observations 121 121 121 121 121
With ICO 6.86 6.97 5.77 5.88 0.11
Number of observations 22 22 22 22 22
Mean difference -0.29 -0.42 -0.32 -0.45 -0.12
P value 0.5081 0.2461 0.3290 0.11 0.5267
Total 7.11 7.32 6.04 6.26 0.22
Source: Grants and Investment Project System.
Table 27 Project duration for projects that were approved and completed between 2003 and 2016 and the ICO was operational for two or more years before project completion (years)
Time from project approval to original
completion
Time from project approval to current completion
Time from entry into force to original completion
Time from entry into force to current completion
Delay from original completion to current
completion
Without ICO 6.94 7.07 5.83 5.96 0.13
Number of observations 86 86 86 86 86
With ICO 2y+ 7.37 7.71 6.37 6.71 0.34
Number of observations 57 57 57 57 57
Mean difference 0.43 0.64** 0.54** 0.75*** 0.21
P value 0.5081 0.0211 0.0256 0.0023 0.1961
Total 7.11 7.32 6.04 6.26 0.21
Source: Grants and Investment Project System.

Appendix
- Annex IV
EB 2
016/1
19/R
.10
112
The ongoing project portfolio and coverage by ICOs
14. The following tables show the ICO coverage of the active investment project portfolio and value of IFAD financing (US$) by: (i)
projects in countries with ICOs; (ii) projects covered through ICOs; and (iii) estimated number and value of projects that would be
covered by all the approved ICOs. Table 28 Number of ongoing project portfolio through ICOs * (July 2016)
Number of ongoing projects % of projects (active portfolio) in countries currently with ICO
% of projects (active portfolio) that would be covered by the 49 approved ICOs
APR 65 80% 94%
ESA 44 75% 91%
LAC 35 37% 66%
NEN** 37 43% 57%
WCA 44 66% 95%
Total 225 64% 72%
Source: Grants and Investment Project System. *Ongoing project portfolio consists of: approved projects and projects available for disbursement. **Yemen ICO is considered as operational
Table 29 Value of ongoing project portfolio coverage through ICOs* (July 2016)
Total approved IFAD financing (US$)
% of the Approved IFAD financing to projects in countries currently with ICO
% of the Approved IFAD financing that would be covered by the 49 approved ICOs
APR 2 132 477 288 89% 96%
ESA 1 409 249 837 89% 93%
LAC 532 897 801 49% 55%
NEN** 803 309 217 55% 69%
WCA 1 230 155 296 80% 89%
Total 6 108 089 439 79% 87%
Source: Grants and Investment Project System. *Amounts include loans and DSF grants for investment projects (US$) **Yemen ICO is considered as operational

Appendix
- Annex IV
EB 2
016/1
19/R
.10
113
Project Status Reports (2015) – subset portfolio operational indicators
15. The PSR data consists of all PSR produced in 2015. Out of the 445, 237 PSRs were in countries in which an ICO had been
operational for two years or more years before the PSR was produced and 208 did not have an ICO or the ICO was operational for
less than two years. The below tables include the PSR scores of a set of operational indicators.
Table 30 PSRs, countries with ICO: when ICO were operational for two years or more before the PSR was produced.
Effectiveness lag Quality of financial management
Acceptable disbursement rate
Counterpart funds
Compliance with financing covenants
Compliance with procurement
Performance of M&E
Countries without ICOs 9.73 4.11 3.61 4.23 4.21 4.07 3.80
Number of observations 208 207 208 208 208 208 208
Countries with ICOs 10.55 3.98 3.34 4.15 4.19 4.00 3.95
Number of observations 237 240 240 240 240 240 240
Mean difference 0.82 -0.14 -0.26 -0.08 -0.02 -0.07 0.15
P value 0.3548 0.0448 0.0339 0.3514 0.7181 0.3185 0.0349
Total 10.17 4.04 3.46 4.19 4.20 4.03 3.88
Source: PSR database. IOE CLE-Decentralization.
Table 31 PSRs, countries with ICO: when ICO was operational for two years or more before the PSR was produced.
Overall implementation progress
Quality of project management
Coherence between AWPB & implementation
Exit strategy (readiness and quality)
Quality and timeliness of audits
Countries without ICOs 4.01 4.14 3.83 3.81 4.33
Number of observations 208 208 205 189 208
Countries with ICOs 4.06 4.09 3.79 3.92 4.16
Number of observations 240 240 240 221 240
Mean difference 0.04 -0.06 -0.04 0.11 -0.16
P value 0.4784 0.4232 0.5611 0.1261 0.0217
Total 4.04 4.11 3.81 3.87 4.24
Source: PSR database. IOE CLE-Decentralization.
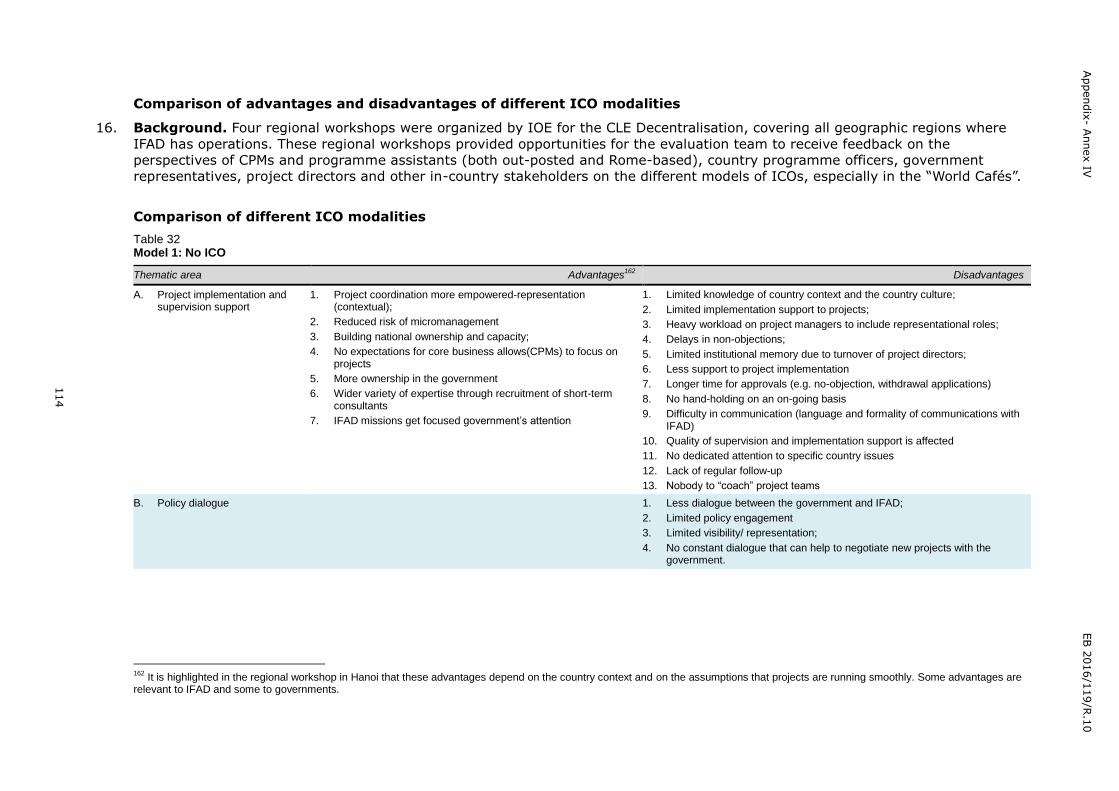
Appendix
- Annex IV
EB 2
016/1
19/R
.10
114
Comparison of advantages and disadvantages of different ICO modalities
16. Background. Four regional workshops were organized by IOE for the CLE Decentralisation, covering all geographic regions where
IFAD has operations. These regional workshops provided opportunities for the evaluation team to receive feedback on the
perspectives of CPMs and programme assistants (both out-posted and Rome-based), country programme officers, government
representatives, project directors and other in-country stakeholders on the different models of ICOs, especially in the “World Cafés”.
Comparison of different ICO modalities
Table 32 Model 1: No ICO
Thematic area Advantages162
Disadvantages
A. Project implementation and supervision support
1. Project coordination more empowered-representation (contextual);
2. Reduced risk of micromanagement
3. Building national ownership and capacity;
4. No expectations for core business allows(CPMs) to focus on projects
5. More ownership in the government
6. Wider variety of expertise through recruitment of short-term consultants
7. IFAD missions get focused government’s attention
1. Limited knowledge of country context and the country culture;
2. Limited implementation support to projects;
3. Heavy workload on project managers to include representational roles;
4. Delays in non-objections;
5. Limited institutional memory due to turnover of project directors;
6. Less support to project implementation
7. Longer time for approvals (e.g. no-objection, withdrawal applications)
8. No hand-holding on an on-going basis
9. Difficulty in communication (language and formality of communications with IFAD)
10. Quality of supervision and implementation support is affected
11. No dedicated attention to specific country issues
12. Lack of regular follow-up
13. Nobody to “coach” project teams
B. Policy dialogue 1. Less dialogue between the government and IFAD;
2. Limited policy engagement
3. Limited visibility/ representation;
4. No constant dialogue that can help to negotiate new projects with the government.
162
It is highlighted in the regional workshop in Hanoi that these advantages depend on the country context and on the assumptions that projects are running smoothly. Some advantages are relevant to IFAD and some to governments.

Appendix
- Annex IV
EB 2
016/1
19/R
.10
115
Thematic area Advantages162
Disadvantages
C. Partnership building 1. Allows Government to be strengthened 1. Limited engagement/ interaction with partners;
2. Limited accountability to the partners /government;
3. Lack of coordination between Government and IFAD;
4. Credibility with the Government affected (due to limited knowledge of local reality);
5. IFAD’s development agenda /leadership in the sector is affected;
6. IFAD is vulnerable to criticism by development partners and IFAD may be perceived as irrelevant.
D. Knowledge management 1. Limited opportunities for the programs to learn & share lessons.
E. HR and delegation of authority 1. Skills developed/enhanced;
2. More possibilities of career development and/or changing jobs inside the organization
1. High workload for CPM;
2. High consultancy costs to follow up with implementation support;
3. Limited flexibility in decision making;
4. Slow decision making processes.
F. Administrative management 1. Less time needed for some administrative internal processes given that they are in the same time zone and can do a stronger follow up;
2. Encourages use of IT for communication;
3. Less burden on IFAD administrative staff in Headquarters of IFAD
1. Increases administrative and logistical burden on Government
G. Cost 1. No establishment cost for IFAD
2. No administrative expenses for managing an office;
3. Provides opportunity for IFAD to find creative solutions/cost effective alternatives
4. If IFAD opts for budget support / basket funding, ICO not needed (particularly for small portfolio)
1. High supervision costs.
2. Increase in travel costs and burden on CPM
H. Others cross-cutting issues 1. More engagement at corporate level, including CPM has more interaction between the other IFAD divisions.
2. Multi-country coverage (HQ based CPM could cover more than one country)
1. Less focus on clients and more on IFAD HQ;
2. Issue of communication due to language and time difference.
3. Not being present in some of the county key moments.
4. Less county-level engagement
Source: Regional Workshop 2016.

Appendix
- Annex IV
EB 2
016/1
19/R
.10
116
Table 33 Model 2: ICO – led by national staff
Thematic area Advantages Disadvantages
A. Project implementation and supervision support
1. Good connection and contact with government and familiar with national procedure and policy. Providing updates of country context to HQ;
2. Regular update of projects/COSOP and regular report to the Government and IFAD
3. Local knowledge and language, enabling faster/easier communication;
4. Timely and better preparation of supervision and project support missions;
5. Proper support to visiting mission (country specific);
6. Easy approval of non-objection (shorter delays);
7. Timely follow-up of recommendation of supervision;
8. Better and easier identification of local consultants;
9. Contributions to COSOP & project design;
10. Builds confidence/trust among projects/government;
11. Continuity of portfolio and institutional memory;
12. Opportunities for better linkage with loans and grants;
13. Better environment for taking new initiative
B. Policy dialogue 1. Network among donors (country specific), policy dialogue issues can be addressed;
2. Easier intervention and participation to policy formulation and dialogue.
1. Exposure to pressure/political interference;
2. No proper policy engagement
3. Lack of access to services and support from different divisions in IFAD HQ (e.g. LEG, CFS)
4. Country behaviour to international and national staff may be different
C. Partnership building 1. Ensure some country presence and visibility of IFAD
2. Knowledge/network of government and vice versa;
3. Briefing with government/development partners on IFAD policy;
4. Liaison with government (informal/formal);
5. Partnership with private sector/ institution;
6. Integration with cooperating groups and partners.
D. Knowledge management 1. Updated knowledge and understanding of IFAD procedures.
E. HR and delegation of authority 1. Stronger continuity of CPOs than CPMs
2. The CPM helps to do IFAD internal procedures from HQ while providing guidance and help to the CPO.
3. More freedom (CPO/CPM dynamics for initiative)
1. High expectations / hierarchy / beyond TORs, responsibility/accountability. Mismatch between the job descriptions and regional tasks
2. Frustrations-tasks vs commensurate (grade/status)
3. Guidance / mentorship / backup limited
4. Lack of clarity in rules for hauling a CPA support
5. Heavy workload for CPO

Appendix
- Annex IV
EB 2
016/1
19/R
.10
117
Thematic area Advantages Disadvantages
6. Lack of career opportunities;
7. Limited delegation of authority (decision at the end is done by the CPM);
8. Very little mobility capacity for the CPOs.
9. CPO led office leads to a situation of conflict of interest or conflict of allegiance for the CPO between government and IFAD.
10. Initial investment in training and professional development is missing
11. When the CPO is the head of the office, clear TORs should be developed and disseminated to the Government.
F. Administrative management
1. Lack of support at the country level. Responsible for all administrative functions on the office (Burden)
2. Dangers that the country office is like a post office. Slow down all processing as it is an additional layer
G. Cost 1. Cost effective
2. Low cost compared to CPM or sub regional offices.
3. Lower cost, compared with the more complicated model (e.g.
CPM-led model)
1. Less value for money
H. Others cross-cutting issues 1. Capacity building of CPO;
2. Good connection and cooperation with HQ through the CPM.
3. Possible exposure to the neighbouring countries
1. CPO being alone and overloaded/missed concurrent opportunities & tasks;
2. Resolving diplomatic issues;
3. Misunderstood by HQ & government (caught in-between);
4. Potential conflict of interest given that the office is managed by a national officer;
5. CPO led office leads to a situation of conflict of interest or conflict of allegiance for the CPO between government and IFAD;
6. Lack of access to services and support from different divisions in IFAD HQ (e.g. LEG, CFS);
7. Lack of participation in decision making meetings for resources allocation and other strategic planning issues in HQ;
Source: Regional Workshop 2016.

Appendix
- Annex IV
EB 2
016/1
19/R
.10
118
Table 34 Model 3 – ICO led by out-posted CPM
Thematic area Advantages Disadvantages
A. Project implementation and supervision support
1. Improve the quality of project design;
2. Better programme implementation;
3. Proximity and alignment of IFAD with the country;
4. Continuous project follow up and Close follow up of project-at-risk
5. Easy to take preventive action (Help solve small problems at an early stage, before the issues getting more seriously)
6. Better crisis response, and more understanding or country interpretation;
7. Can identify and solve problems more quickly – speed up decision making process
8. Greater alignment with COSOP with national priorities/policies
9. CPMs can develop a better network of the local consultants and have better local knowledge;
10. Supporting value chain development and small scale business
1. Ownership by the government;
2. Less understanding of the country day to day situation;
3. Need for increased support from HQ (e.g. procurement, financial management);
4. Language can be an issue;
5. Risk of “going native”. CPMs becoming more like government staff instead of IFAD staff;
6. CPMs may micro manage the work of project directors;
Note:
Dependent on the quality of CPMs
B. Policy dialogue 1. Partnership with government/ private sector/ institution;
2. Participation in policy dialogue by regular dialogue with government;
3. Accessibility from the government part;
4. Establishment of mutual accountability;
5. Greater alignment with COSOP with national priorities/policies
6. Raise the profile of ICO at HQ and government
C. Partnership building 1. Build partnerships between development partners (although this can also apply to the CPO-led model) and government partners
2. Greater alignment with COSOP with national priorities/policies
3. Raise the profile of ICO at HQ and government
1. High expectation from all partners;
2. Time spent “co-opted” by local duties - need for maturity and empowerment
D. Knowledge management 1. Knowledge management improves (learning & sharing);
2. Improved efficiency and increased coverage and in-depth of non-lending activities
1. Less possibilities for learning from other countries
E. HR and delegation of authority
1. Proximity for decision making=> quick and easy
2. Reduction of the workload of the ICO
3. Faster decision making for operational matters.
4. Better division of labour between CPM/CD and CPO
1. CPO’s capacity is limited (in some cases);
2. Micro management;
3. CPM serving other countries;
4. Time focus, the CPO and CPM may duplicate work load;
5. Little delegation of authority;
6. Need to have a standard job description for CPMs on duration parameters /sufficient incentives on disadvantaged countries/regions;
7. Notion of rotation has to be part of the model;
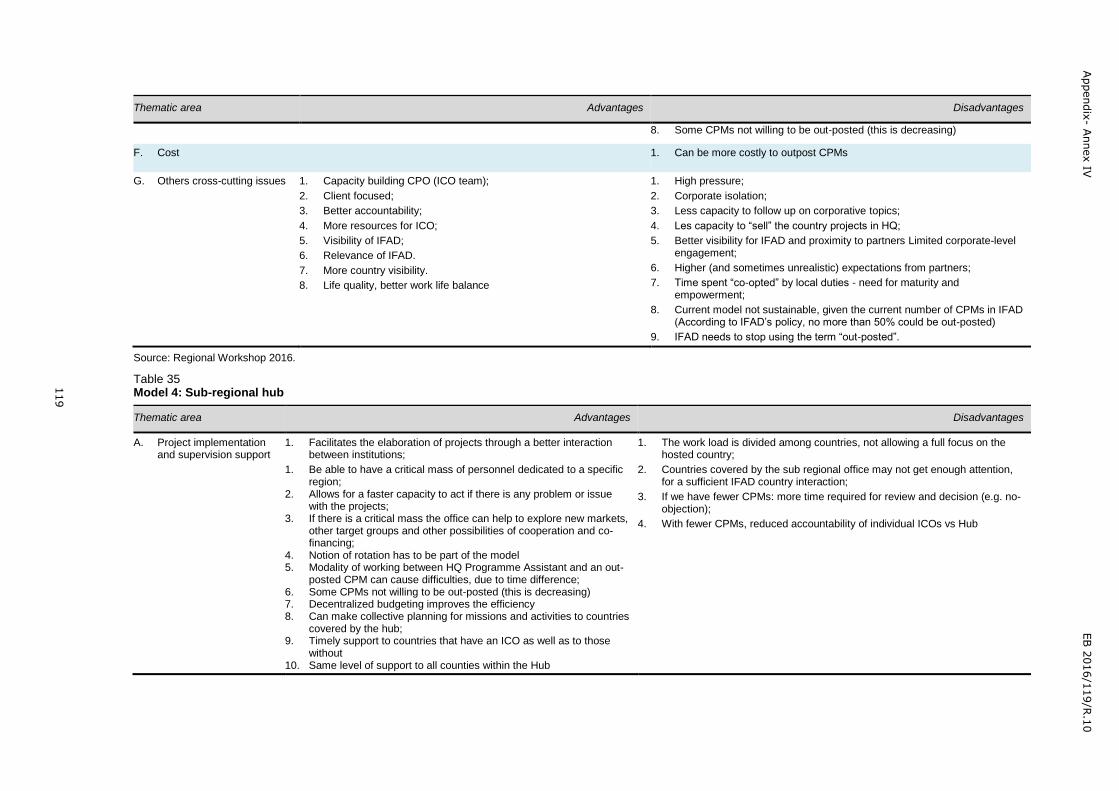
Appendix
- Annex IV
EB 2
016/1
19/R
.10
119
Thematic area Advantages Disadvantages
8. Some CPMs not willing to be out-posted (this is decreasing)
F. Cost
1. Can be more costly to outpost CPMs
G. Others cross-cutting issues 1. Capacity building CPO (ICO team);
2. Client focused;
3. Better accountability;
4. More resources for ICO;
5. Visibility of IFAD;
6. Relevance of IFAD.
7. More country visibility.
8. Life quality, better work life balance
1. High pressure;
2. Corporate isolation;
3. Less capacity to follow up on corporative topics;
4. Les capacity to “sell” the country projects in HQ;
5. Better visibility for IFAD and proximity to partners Limited corporate-level engagement;
6. Higher (and sometimes unrealistic) expectations from partners;
7. Time spent “co-opted” by local duties - need for maturity and empowerment;
8. Current model not sustainable, given the current number of CPMs in IFAD (According to IFAD’s policy, no more than 50% could be out-posted)
9. IFAD needs to stop using the term “out-posted”.
Source: Regional Workshop 2016.
Table 35 Model 4: Sub-regional hub
Thematic area Advantages Disadvantages
A. Project implementation and supervision support
1. Facilitates the elaboration of projects through a better interaction between institutions;
1. Be able to have a critical mass of personnel dedicated to a specific region;
2. Allows for a faster capacity to act if there is any problem or issue with the projects;
3. If there is a critical mass the office can help to explore new markets, other target groups and other possibilities of cooperation and co-financing;
4. Notion of rotation has to be part of the model 5. Modality of working between HQ Programme Assistant and an out-
posted CPM can cause difficulties, due to time difference; 6. Some CPMs not willing to be out-posted (this is decreasing) 7. Decentralized budgeting improves the efficiency 8. Can make collective planning for missions and activities to countries
covered by the hub; 9. Timely support to countries that have an ICO as well as to those
without 10. Same level of support to all counties within the Hub
1. The work load is divided among countries, not allowing a full focus on the hosted country;
2. Countries covered by the sub regional office may not get enough attention, for a sufficient IFAD country interaction;
3. If we have fewer CPMs: more time required for review and decision (e.g. no-objection);
4. With fewer CPMs, reduced accountability of individual ICOs vs Hub
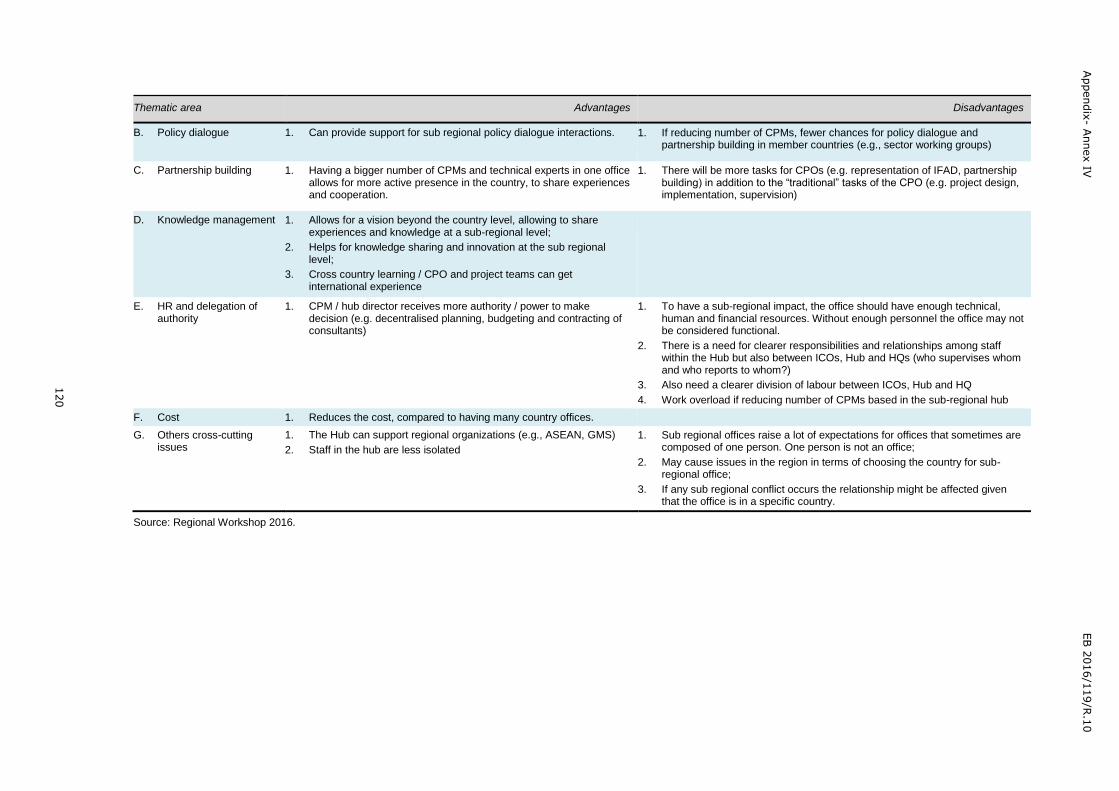
Appendix
- Annex IV
EB 2
016/1
19/R
.10
120
Thematic area Advantages Disadvantages
B. Policy dialogue 1. Can provide support for sub regional policy dialogue interactions.
1. If reducing number of CPMs, fewer chances for policy dialogue and partnership building in member countries (e.g., sector working groups)
C. Partnership building 1. Having a bigger number of CPMs and technical experts in one office allows for more active presence in the country, to share experiences and cooperation.
1. There will be more tasks for CPOs (e.g. representation of IFAD, partnership building) in addition to the “traditional” tasks of the CPO (e.g. project design, implementation, supervision)
D. Knowledge management 1. Allows for a vision beyond the country level, allowing to share experiences and knowledge at a sub-regional level;
2. Helps for knowledge sharing and innovation at the sub regional level;
3. Cross country learning / CPO and project teams can get international experience
E. HR and delegation of authority
1. CPM / hub director receives more authority / power to make decision (e.g. decentralised planning, budgeting and contracting of consultants)
1. To have a sub-regional impact, the office should have enough technical, human and financial resources. Without enough personnel the office may not be considered functional.
2. There is a need for clearer responsibilities and relationships among staff within the Hub but also between ICOs, Hub and HQs (who supervises whom and who reports to whom?)
3. Also need a clearer division of labour between ICOs, Hub and HQ
4. Work overload if reducing number of CPMs based in the sub-regional hub
F. Cost 1. Reduces the cost, compared to having many country offices.
G. Others cross-cutting issues
1. The Hub can support regional organizations (e.g., ASEAN, GMS)
2. Staff in the hub are less isolated
1. Sub regional offices raise a lot of expectations for offices that sometimes are composed of one person. One person is not an office;
2. May cause issues in the region in terms of choosing the country for sub-regional office;
3. If any sub regional conflict occurs the relationship might be affected given that the office is in a specific country.
Source: Regional Workshop 2016.

Appendix
- Annex IV
EB 2
016/1
19/R
.10
121
Table 36 Model 5: Regional office (the case of country office in Nairobi)
Thematic area Advantages Disadvantages
A. Project implementation and supervision support
1. Reducing work load in Rome
2. Proximity to project area
B. Policy dialogue 1. Policy dialogue, experience on local aspects. knowledge of best practices
C. Partnership building 1. Established networks at country level.
D. Knowledge management 1. Enables information sharing within the region.
E. HR and delegation of authority 1. Posting into IRON (M&E, Environment specialist). 1. Over stretched with demands from the region & HQ;
2. Cross departmental Management of Human resources
3. Heavy workload for country directors;
4. Different reporting lines across divisions;
5. Double structure (IFAD HQ & Country office)
F. Cost and financial management
1. Reduced transaction cost 1. Establishment cost
G. Others cross-cutting issues 1. Capacity building/pool of competencies & expertise;
2. Linkages (easy outreach to neighbouring countries)
1. Limited attention to other countries
2. Language barrier
3. Unclear definition of a regional office
Source: Regional Workshop 2016.

Appendix- Annex V EB 2016/119/R.10
122
Appendix
- Annex IV
EC 2
016/9
5/W
.P.2
Evaluation Electronic Survey Results
1. The methodology for the CLE Decentralisation included the design, implementation
and analysis of an electronic survey. The objective was to receive feedback on the
role and function of IFAD and its country offices. The survey was launched on 5
May 2016 using Survey Monkey and was closed on 29 June 2015. The total survey
population included 1,987 people. Of these 502 where: (i) IFAD Executive Board
members, (ii) IFAD senior management; and (iii) IFAD professional staff. The 1,485
non-IFAD people in the population included: (i) government counterparts, (ii) IFAD
project managers, (iii) the in-country donor community and (iv) non-government
national stakeholders.
2. To ensure a good response rate, several measures were taken including: (i)
translation of the questionnaires into IFAD’s four official languages, (ii)
personalization of communications; and (iii) several follow-ups. There were 1,184
responses, equivalent to a net response rate of 62%.163, 164 There were 1,022
complete returns (324 for Executive Board Members and IFAD staff and 698 for
non-IFAD recipients) when the survey was closed in June (51 per cent response
rate for completed questionnaires – 65 per cent for IFAD and 47 per cent for non-
IFAD recipients). Because of the large number of respondents, the survey results
are robust.
3. Data analysis. Given the variety of respondents, the survey had some indicative
questions which, depending on their answer, led respondents to specific questions
that were directly relevant to them. This indicative set of questions also helped to
categorize and disaggregate the results by the different groups of respondents. The
results shown below are not disaggregated by all the sub categories; rather they
are only disaggregated by IFAD respondents and non-IFAD respondents.
4. Depending on the formulation of the survey questions, the rating scale can be
interpreted in the following way: 1 = highly unsatisfactory/highly disagree; 2 =
unsatisfactory/disagree; 3 = moderately unsatisfactory/moderately disagree; 4 =
moderately satisfactory/moderately agree; 5 = satisfactory/agree; 6 = highly
satisfactory/strongly agree. The disaggregation of key survey responses by the
rating scale/level of agreement helps to display the survey results.
5. A statistical significance test was done for key results165 to determine whether
differences were statistically significant for subgroups of respondents. Note that
***, ** and * denote significance at the 1%, 5%, and 10% levels.
163
Of the 1,987 invitations sent, 74 bounced or opted out. To calculate the response rate the evaluators only included the number of invitations received 1,913. 164
The American Association of Public Opinion Research (AAPOR) states that errors of estimate cannot be calculated for surveys in which the respondents are self-selected because the statistical theory on which survey errors of estimate is based assumes random selection. Respondents for this survey were selected from among those who have volunteered to participate in the CLE decentralization online surveys. The data was not weighted to reflect the demographic composition of the survey population. Because the responses were from those who self-selected for participation rather than a probability sample, no estimates of sampling error can be calculated. All sample surveys and polls may be subject to multiple sources of error, including, but not limited to sampling error, coverage error and measurement error. 165
Two sample t-test for the equality of means. The statistical software used is STATA: Data Analysis and Statistical Software, version 13.
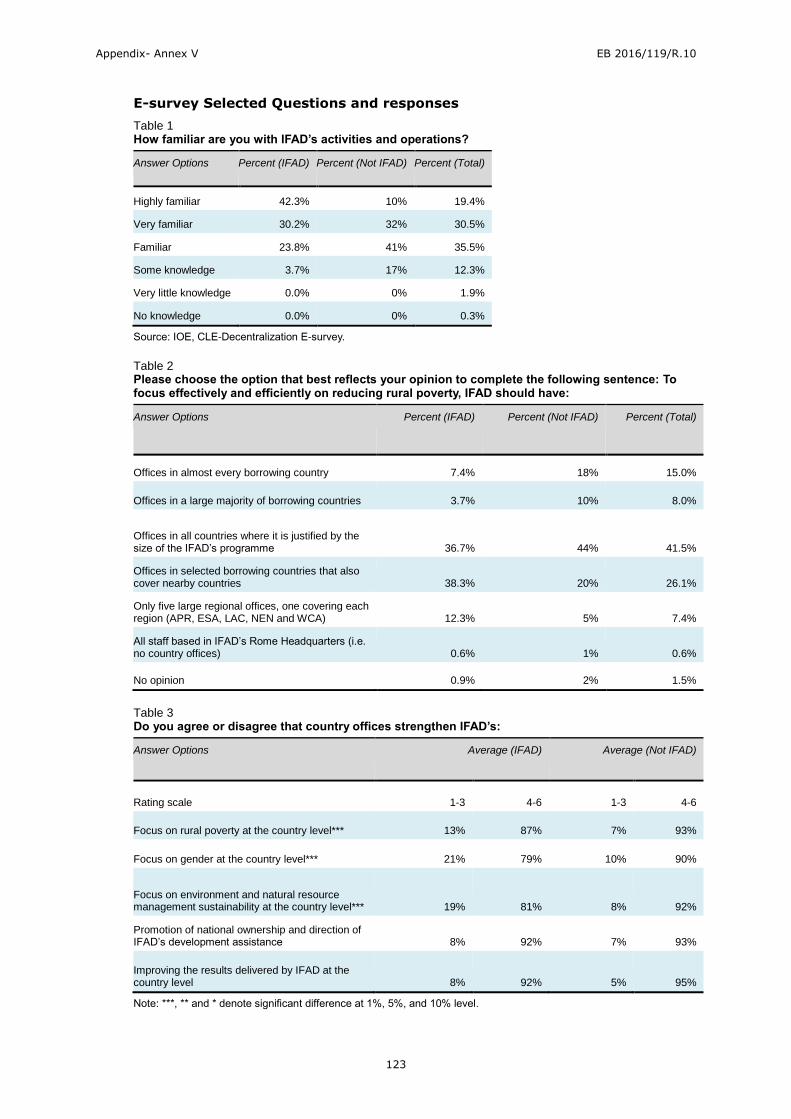
Appendix- Annex V EB 2016/119/R.10
123
Appendix
- Annex IV
EC 2
016/9
5/W
.P.2
E-survey Selected Questions and responses
Table 1 How familiar are you with IFAD’s activities and operations?
Answer Options Percent (IFAD) Percent (Not IFAD) Percent (Total)
Highly familiar 42.3% 10% 19.4%
Very familiar 30.2% 32% 30.5%
Familiar 23.8% 41% 35.5%
Some knowledge 3.7% 17% 12.3%
Very little knowledge 0.0% 0% 1.9%
No knowledge 0.0% 0% 0.3%
Source: IOE, CLE-Decentralization E-survey.
Table 2 Please choose the option that best reflects your opinion to complete the following sentence: To focus effectively and efficiently on reducing rural poverty, IFAD should have:
Answer Options Percent (IFAD) Percent (Not IFAD) Percent (Total)
Offices in almost every borrowing country 7.4% 18% 15.0%
Offices in a large majority of borrowing countries 3.7% 10% 8.0%
Offices in all countries where it is justified by the size of the IFAD’s programme 36.7% 44% 41.5%
Offices in selected borrowing countries that also cover nearby countries 38.3% 20% 26.1%
Only five large regional offices, one covering each region (APR, ESA, LAC, NEN and WCA) 12.3% 5% 7.4%
All staff based in IFAD’s Rome Headquarters (i.e. no country offices) 0.6% 1% 0.6%
No opinion 0.9% 2% 1.5%
Table 3 Do you agree or disagree that country offices strengthen IFAD’s:
Answer Options Average (IFAD) Average (Not IFAD)
Rating scale 1-3 4-6 1-3 4-6
Focus on rural poverty at the country level*** 13% 87% 7% 93%
Focus on gender at the country level*** 21% 79% 10% 90%
Focus on environment and natural resource management sustainability at the country level*** 19% 81% 8% 92%
Promotion of national ownership and direction of IFAD’s development assistance 8% 92% 7% 93%
Improving the results delivered by IFAD at the country level 8% 92% 5% 95%
Note: ***, ** and * denote significant difference at 1%, 5%, and 10% level.

Appendix- Annex V EB 2016/119/R.10
124
Appendix
- Annex IV
EC 2
016/9
5/W
.P.2
Table 4 Please indicate the level of priority that you would assign to the following potential functions of an IFAD country office:
Answer Options Average (IFAD)
Average (Not IFAD)
Average (Total)
Country strategy and programme development*** 5.2 5.08 5.1
Aligning IFAD’s assistance with country development priorities 5.3 5.29 5.3
Identifying and designing good projects focused on reducing rural poverty 5.3 5.33 5.3
Strengthening IFAD’s grant programme*** 4.3 4.89 4.7
Project implementation support*** 5.5 5.12 5.2
Government relations and partnership building*** 5.3 5.15 5.2
Partnership building with civil society*** 4.9 4.73 4.8
Partnership building with the private sector* 4.9 4.75 4.8
Partnership building and coordination with international development partners working in the country (i.e., UN agencies; International Financial Institutions; bilateral donors) 5.0 5.04 5.0
Providing inputs for policy engagement to the government (policy dialogue) related to agriculture and rural development. 5.2 5.08 5.1
Developing and making available information (knowledge management)*** 4.7 4.95 4.9
Contributing to the development of national capacity building (capacity-development)** 4.8 5.07 5.0
Following-up for sustainability and scaling up results 5.0 5.12 5.1
Resource mobilization and cost-sharing for IFAD projects*** 4.7 4.90 4.8
IFAD representation 4.9 4.98 5.0
Note: ***, ** and * denote significant difference at 1%, 5%, and 10% level.
Table 5 Please rate the overall performance of the IFAD Country Office that you are most familiar with?
Average (IFAD)
Average (Not IFAD)
Total
4.88 4.87 4.87
Table 6 Please indicate whether you agree or disagree with the following statements
Answer Options Average (IFAD) Average (Not IFAD)
Rating scale 1-3 4-6 1-3 4-6
IFAD’s country office has sufficient staff to deliver its mandate*** 64% 36% 50% 50%
IFAD’s country office has sufficient resources to deliver its mandate 54% 46% 38% 62%
IFAD’s country office has sufficient expertise to deliver its mandate*** 46% 54% 29% 71%
Note: ***, ** and * denote significant difference at 1%, 5%, and 10% level.
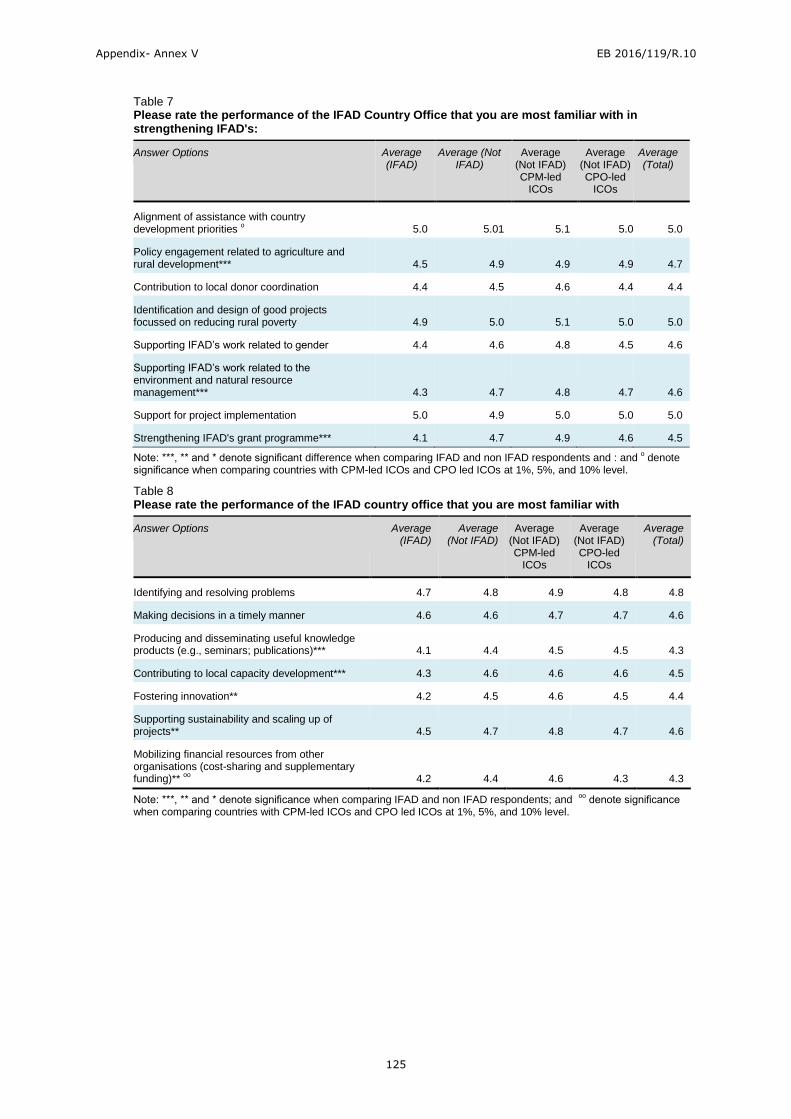
Appendix- Annex V EB 2016/119/R.10
125
Appendix
- Annex IV
EC 2
016/9
5/W
.P.2
Table 7 Please rate the performance of the IFAD Country Office that you are most familiar with in strengthening IFAD's:
Answer Options Average (IFAD)
Average (Not IFAD)
Average (Not IFAD) CPM-led
ICOs
Average (Not IFAD) CPO-led
ICOs
Average (Total)
Alignment of assistance with country development priorities
o 5.0 5.01 5.1 5.0 5.0
Policy engagement related to agriculture and rural development*** 4.5 4.9 4.9 4.9 4.7
Contribution to local donor coordination 4.4 4.5 4.6 4.4 4.4
Identification and design of good projects focussed on reducing rural poverty 4.9 5.0 5.1 5.0 5.0
Supporting IFAD’s work related to gender 4.4 4.6 4.8 4.5 4.6
Supporting IFAD’s work related to the environment and natural resource management*** 4.3 4.7 4.8 4.7 4.6
Support for project implementation 5.0 4.9 5.0 5.0 5.0
Strengthening IFAD's grant programme*** 4.1 4.7 4.9 4.6 4.5
Note: ***, ** and * denote significant difference when comparing IFAD and non IFAD respondents and : and o denote
significance when comparing countries with CPM-led ICOs and CPO led ICOs at 1%, 5%, and 10% level.
Table 8 Please rate the performance of the IFAD country office that you are most familiar with
Answer Options Average (IFAD)
Average (Not IFAD)
Average (Not IFAD) CPM-led
ICOs
Average (Not IFAD) CPO-led
ICOs
Average (Total)
Identifying and resolving problems 4.7 4.8 4.9 4.8 4.8
Making decisions in a timely manner 4.6 4.6 4.7 4.7 4.6
Producing and disseminating useful knowledge products (e.g., seminars; publications)*** 4.1 4.4 4.5 4.5 4.3
Contributing to local capacity development*** 4.3 4.6 4.6 4.6 4.5
Fostering innovation** 4.2 4.5 4.6 4.5 4.4
Supporting sustainability and scaling up of projects** 4.5 4.7 4.8 4.7 4.6
Mobilizing financial resources from other organisations (cost-sharing and supplementary funding)**
oo 4.2 4.4 4.6 4.3 4.3
Note: ***, ** and * denote significance when comparing IFAD and non IFAD respondents; and oo
denote significance when comparing countries with CPM-led ICOs and CPO led ICOs at 1%, 5%, and 10% level.
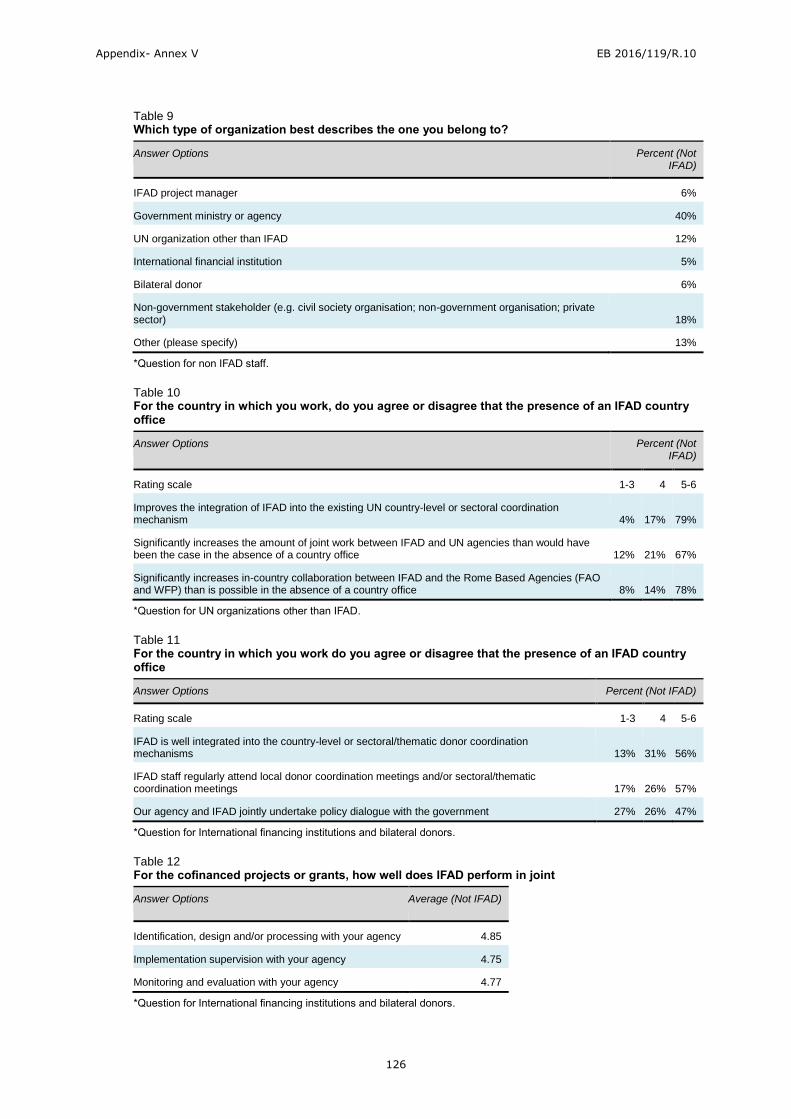
Appendix- Annex V EB 2016/119/R.10
126
Appendix
- Annex IV
EC 2
016/9
5/W
.P.2
Table 9 Which type of organization best describes the one you belong to?
Answer Options Percent (Not IFAD)
IFAD project manager 6%
Government ministry or agency 40%
UN organization other than IFAD 12%
International financial institution 5%
Bilateral donor 6%
Non-government stakeholder (e.g. civil society organisation; non-government organisation; private sector) 18%
Other (please specify) 13%
*Question for non IFAD staff.
Table 10 For the country in which you work, do you agree or disagree that the presence of an IFAD country office
Answer Options Percent (Not IFAD)
Rating scale 1-3 4 5-6
Improves the integration of IFAD into the existing UN country-level or sectoral coordination mechanism 4% 17% 79%
Significantly increases the amount of joint work between IFAD and UN agencies than would have been the case in the absence of a country office 12% 21% 67%
Significantly increases in-country collaboration between IFAD and the Rome Based Agencies (FAO and WFP) than is possible in the absence of a country office 8% 14% 78%
*Question for UN organizations other than IFAD.
Table 11 For the country in which you work do you agree or disagree that the presence of an IFAD country office
Answer Options Percent (Not IFAD)
Rating scale 1-3 4 5-6
IFAD is well integrated into the country-level or sectoral/thematic donor coordination mechanisms 13% 31% 56%
IFAD staff regularly attend local donor coordination meetings and/or sectoral/thematic coordination meetings 17% 26% 57%
Our agency and IFAD jointly undertake policy dialogue with the government 27% 26% 47%
*Question for International financing institutions and bilateral donors.
Table 12 For the cofinanced projects or grants, how well does IFAD perform in joint
Answer Options Average (Not IFAD)
Identification, design and/or processing with your agency 4.85
Implementation supervision with your agency 4.75
Monitoring and evaluation with your agency 4.77
*Question for International financing institutions and bilateral donors.

Appendix- Annex V EB 2016/119/R.10
127
Appendix
- Annex IV
EC 2
016/9
5/W
.P.2
Table13 How well does IFAD perform in terms of
Answer Options Average (Not IFAD)
Reaching out to and consulting with non-government stakeholders 4.87
Involving non-government stakeholders in designing its operations 4.68
Involving non-government stakeholders in assessing the results and impact of its operations 4.62
Monitoring and evaluation of IFAD projects 4.99
*Question for non-government stakeholders.
Table 14 For your cofinanced project or grant how well does IFAD perform?
Answer Options Average (Not IFAD)
Effectively supports your project office 5.15
Provides timely feedback and decisions 4.97
Actively helps your project office to raise and resolve issues with the government 5.00
Provides clear explanations and training about IFAD’s policies and procedures 4.67
Helps to reduce IFAD’s reporting requirements (e.g., makes reports more concise and easier to prepare) 4.79
Assists with project monitoring and reporting 4.76
*Question for IFAD project managers.
Table 15 Does your country have an IFAD country office?
Answer Options Percent (IFAD) Percent (Not IFAD)
Yes 63%
No 37%
*Question for government officials.
Table 16 Were you involved in IFAD’s operations before the country office was established?
Answer Options Percent (Not IFAD)
Yes 40%
No 60%
*Question for government officials.
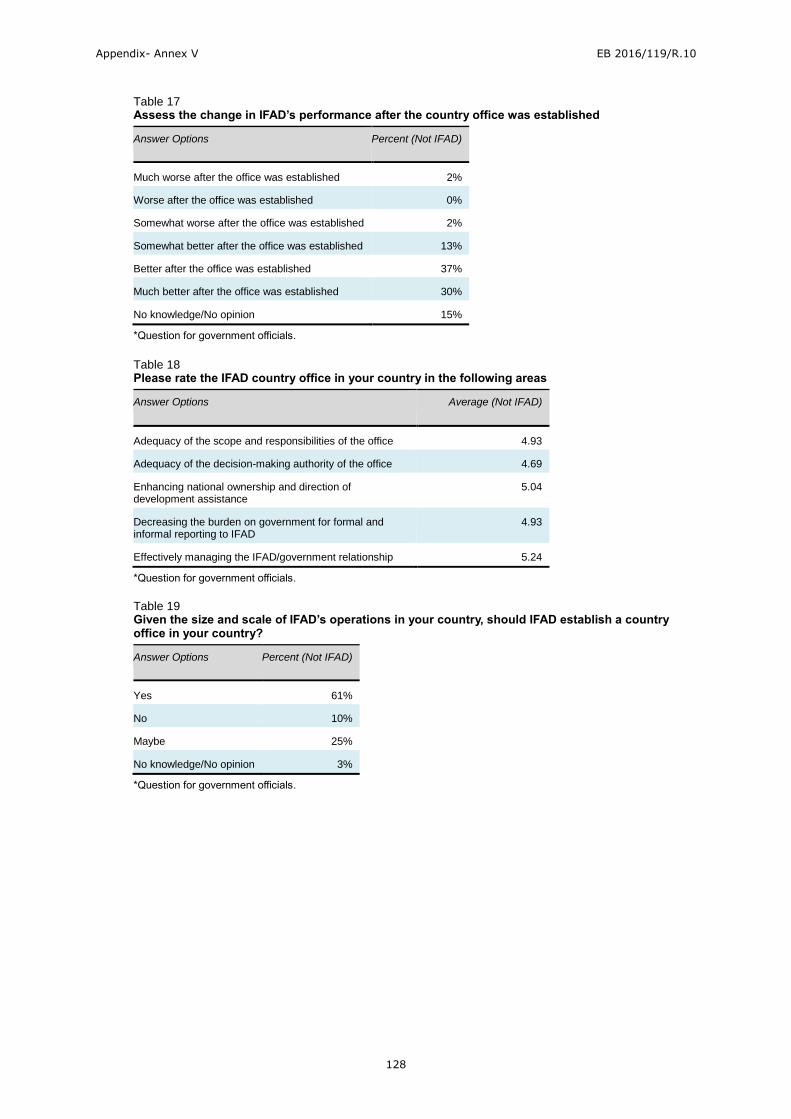
Appendix- Annex V EB 2016/119/R.10
128
Appendix
- Annex IV
EC 2
016/9
5/W
.P.2
Table 17 Assess the change in IFAD’s performance after the country office was established
Answer Options Percent (Not IFAD)
Much worse after the office was established 2%
Worse after the office was established 0%
Somewhat worse after the office was established 2%
Somewhat better after the office was established 13%
Better after the office was established 37%
Much better after the office was established 30%
No knowledge/No opinion 15%
*Question for government officials.
Table 18 Please rate the IFAD country office in your country in the following areas
Answer Options Average (Not IFAD)
Adequacy of the scope and responsibilities of the office 4.93
Adequacy of the decision-making authority of the office 4.69
Enhancing national ownership and direction of development assistance
5.04
Decreasing the burden on government for formal and informal reporting to IFAD
4.93
Effectively managing the IFAD/government relationship 5.24
*Question for government officials.
Table 19 Given the size and scale of IFAD’s operations in your country, should IFAD establish a country office in your country?
Answer Options Percent (Not IFAD)
Yes 61%
No 10%
Maybe 25%
No knowledge/No opinion 3%
*Question for government officials.
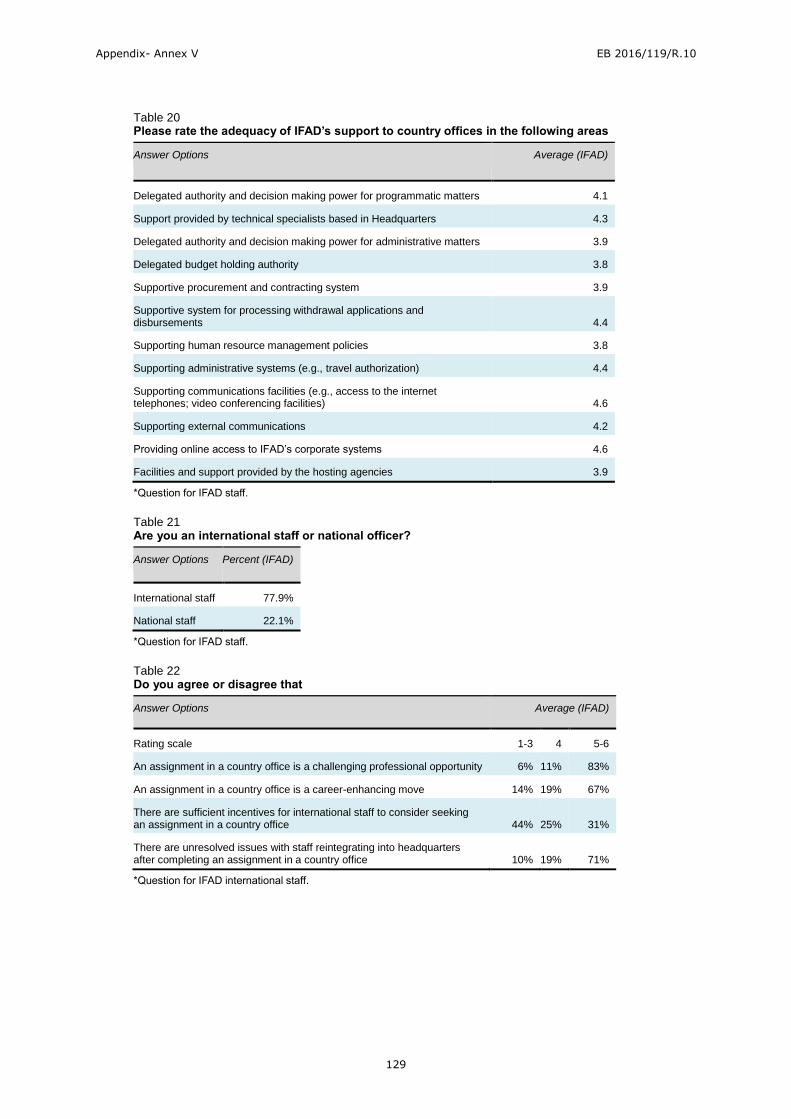
Appendix- Annex V EB 2016/119/R.10
129
Appendix
- Annex IV
EC 2
016/9
5/W
.P.2
Table 20 Please rate the adequacy of IFAD’s support to country offices in the following areas
Answer Options Average (IFAD)
Delegated authority and decision making power for programmatic matters 4.1
Support provided by technical specialists based in Headquarters 4.3
Delegated authority and decision making power for administrative matters 3.9
Delegated budget holding authority 3.8
Supportive procurement and contracting system 3.9
Supportive system for processing withdrawal applications and disbursements 4.4
Supporting human resource management policies 3.8
Supporting administrative systems (e.g., travel authorization) 4.4
Supporting communications facilities (e.g., access to the internet telephones; video conferencing facilities) 4.6
Supporting external communications 4.2
Providing online access to IFAD’s corporate systems 4.6
Facilities and support provided by the hosting agencies 3.9
*Question for IFAD staff.
Table 21 Are you an international staff or national officer?
Answer Options Percent (IFAD)
International staff 77.9%
National staff 22.1%
*Question for IFAD staff.
Table 22 Do you agree or disagree that
Answer Options Average (IFAD)
Rating scale 1-3 4 5-6
An assignment in a country office is a challenging professional opportunity 6% 11% 83%
An assignment in a country office is a career-enhancing move 14% 19% 67%
There are sufficient incentives for international staff to consider seeking an assignment in a country office 44% 25% 31%
There are unresolved issues with staff reintegrating into headquarters after completing an assignment in a country office 10% 19% 71%
*Question for IFAD international staff.

Appendix- Annex V EB 2016/119/R.10
130
Appendix
- Annex IV
EC 2
016/9
5/W
.P.2
Table 23 Do you agree or disagree that
Answer Options Average (IFAD)
Rating scale 1-3 4 5-6
IFAD’s salary structure and benefits are competitive in the local market 27% 36% 37%
There are adequate opportunities for career development 37% 23% 40%
There are adequate training opportunities 32% 30% 38%
I feel part of the IFAD family 15% 15% 70%
*Question for IFAD national staff.
Table 24 Approximately how many times a year do you meet with the following local stakeholders
Answer Options Average (IFAD)
% meet once or
more a week
% once or more time a
month
% meet once or more times a
year % Never
Officials in central government ministries/agencies 10% 45% 43% 3%
Officials in local government ministries/agencies 5% 28% 65% 2%
Project officers for IFAD projects 24% 31% 44% 1%
Rome based UN agencies 1% 40% 53% 6%
Other UN agencies 1% 33% 61% 5%
Bilateral donors 0% 26% 66% 8%
International Financial Institutions 0% 20% 70% 10%
Nongovernment stakeholders 3% 28% 62% 7%
Private sector partners 2% 21% 68% 9%
Beneficiaries 4% 32% 61% 3%
Visit a project site 2% 30% 64% 4%
*Question for CPMs and CPOs.
Table 25 Do you agree or disagree that there is a clear definition of the roles and responsibilities between the country office and headquarters and a matching definition of the delegated authorities and accountabilities for:
Answer Options Average (IFAD)
Rating scale 1-3 4 5-6
Substantive programmatic matters 24% 27% 49%
Administrative, financial and human resource authorities 35% 27% 38%
*Question for IFAD staff and IFAD Executive Board Members.
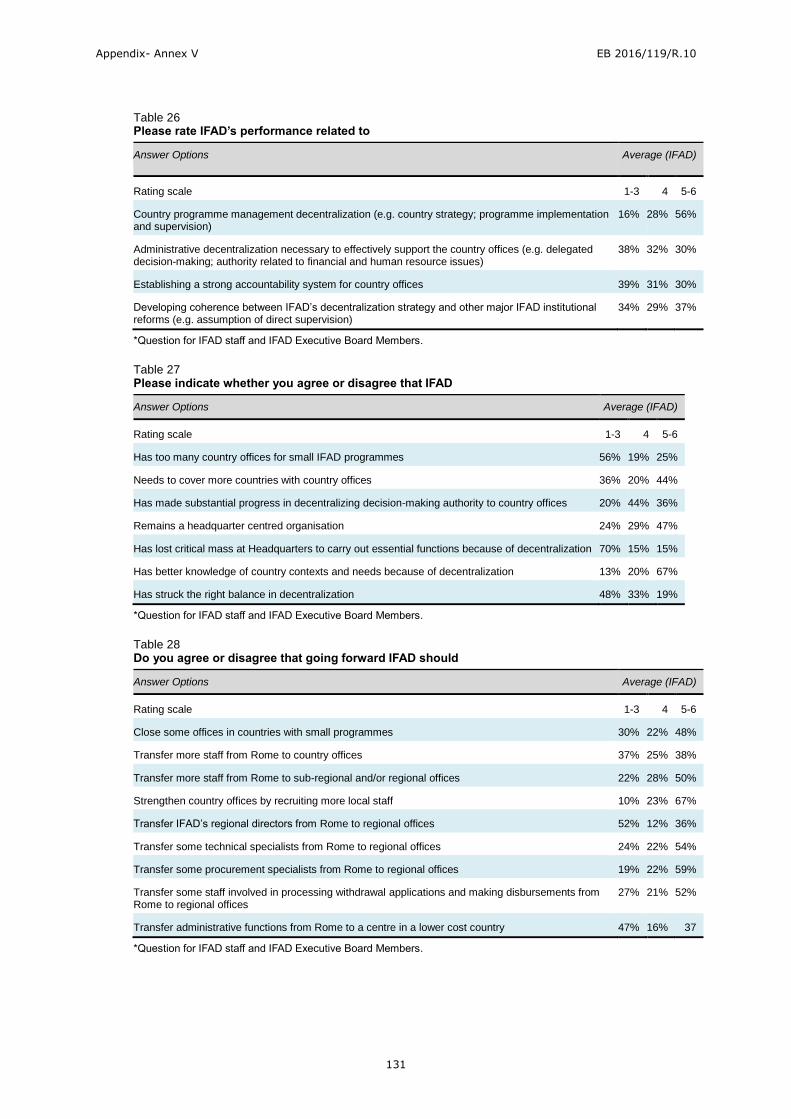
Appendix- Annex V EB 2016/119/R.10
131
Appendix
- Annex IV
EC 2
016/9
5/W
.P.2
Table 26 Please rate IFAD’s performance related to
Answer Options Average (IFAD)
Rating scale 1-3 4 5-6
Country programme management decentralization (e.g. country strategy; programme implementation and supervision)
16% 28% 56%
Administrative decentralization necessary to effectively support the country offices (e.g. delegated decision-making; authority related to financial and human resource issues)
38% 32% 30%
Establishing a strong accountability system for country offices 39% 31% 30%
Developing coherence between IFAD’s decentralization strategy and other major IFAD institutional reforms (e.g. assumption of direct supervision)
34% 29% 37%
*Question for IFAD staff and IFAD Executive Board Members.
Table 27 Please indicate whether you agree or disagree that IFAD
Answer Options Average (IFAD)
Rating scale 1-3 4 5-6
Has too many country offices for small IFAD programmes 56% 19% 25%
Needs to cover more countries with country offices 36% 20% 44%
Has made substantial progress in decentralizing decision-making authority to country offices 20% 44% 36%
Remains a headquarter centred organisation 24% 29% 47%
Has lost critical mass at Headquarters to carry out essential functions because of decentralization 70% 15% 15%
Has better knowledge of country contexts and needs because of decentralization 13% 20% 67%
Has struck the right balance in decentralization 48% 33% 19%
*Question for IFAD staff and IFAD Executive Board Members.
Table 28 Do you agree or disagree that going forward IFAD should
Answer Options Average (IFAD)
Rating scale 1-3 4 5-6
Close some offices in countries with small programmes 30% 22% 48%
Transfer more staff from Rome to country offices 37% 25% 38%
Transfer more staff from Rome to sub-regional and/or regional offices 22% 28% 50%
Strengthen country offices by recruiting more local staff 10% 23% 67%
Transfer IFAD’s regional directors from Rome to regional offices 52% 12% 36%
Transfer some technical specialists from Rome to regional offices 24% 22% 54%
Transfer some procurement specialists from Rome to regional offices 19% 22% 59%
Transfer some staff involved in processing withdrawal applications and making disbursements from Rome to regional offices
27% 21% 52%
Transfer administrative functions from Rome to a centre in a lower cost country 47% 16% 37
*Question for IFAD staff and IFAD Executive Board Members.

Appendix- Annex VI EB 2016/119/R.10
132
Appendix
- Annex IV
EC 2
016/9
5/W
.P.2
IFAD country offices
Table 1 List of IFAD country offices
Region Approved
(December 2015)
Actually established
(November 2015)
Effective/operational
(November 2015)
APR 13
Afghanistan
Bangladesh
Cambodia
China
India
Indonesia
Lao PDR
Myanmar
Nepal
Pakistan
Philippines
Sri Lanka
Viet Nam
11
Bangladesh
Cambodia
China
India
Indonesia
Lao PDR
Nepal
Pakistan
Philippines
Sri Lanka
Viet Nam
11
Bangladesh
Cambodia
China
India
Indonesia
Lao PDR
Nepal
Pakistan
Philippines
Sri Lanka
Viet Nam
ESA 10
Burundi
Ethiopia
Kenya
Madagascar
Malawi
Mozambique
Rwanda
Uganda
United Republic of Tanzania
Zambia
9
Burundi
Ethiopia
Kenya
Madagascar
Mozambique
Rwanda
Uganda
United Republic of Tanzania
Zambia
9
Burundi
Ethiopia
Kenya
Madagascar
Mozambique
Rwanda
Uganda
United Republic of Tanzania
Zambia
LAC 7
Bolivia (Plurinational State of)
Brazil
Colombia
Guatemala
Haiti
Panama
Peru
6
Bolivia (Plurinational State of)
Brazil
Guatemala
Haiti
Panama (closed in 2013)
Peru
5
Bolivia (Plurinational State of)
Brazil
Guatemala
Haiti
Peru
NEN 6
Egypt
Kyrgyzstan/Tajikistan
Morocco
Sudan
Turkey
4
Egypt
Morocco
Sudan
Yemen
4
Egypt
Morocco
Sudan
Yemen
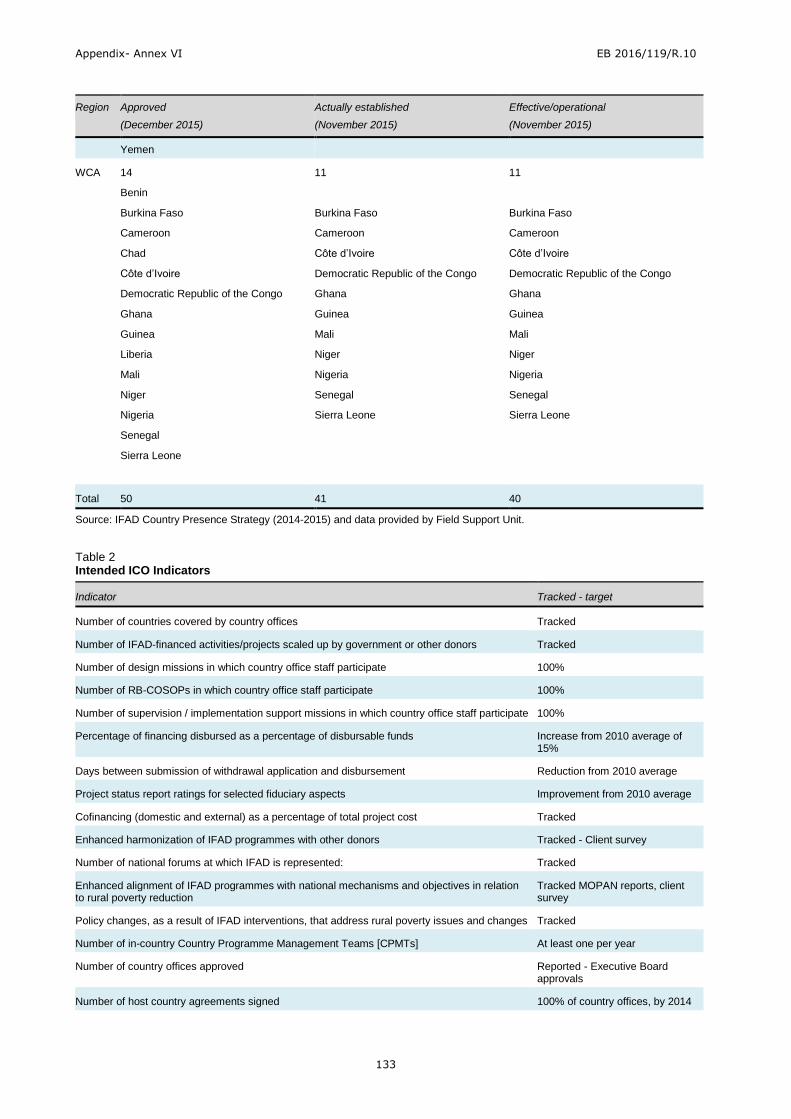
Appendix- Annex VI EB 2016/119/R.10
133
Appendix
- Annex IV
EC 2
016/9
5/W
.P.2
Region Approved
(December 2015)
Actually established
(November 2015)
Effective/operational
(November 2015)
Yemen
WCA 14
Benin
Burkina Faso
Cameroon
Chad
Côte d’Ivoire
Democratic Republic of the Congo
Ghana
Guinea
Liberia
Mali
Niger
Nigeria
Senegal
Sierra Leone
11
Burkina Faso
Cameroon
Côte d’Ivoire
Democratic Republic of the Congo
Ghana
Guinea
Mali
Niger
Nigeria
Senegal
Sierra Leone
11
Burkina Faso
Cameroon
Côte d’Ivoire
Democratic Republic of the Congo
Ghana
Guinea
Mali
Niger
Nigeria
Senegal
Sierra Leone
Total 50 41 40
Source: IFAD Country Presence Strategy (2014-2015) and data provided by Field Support Unit.
Table 2 Intended ICO Indicators
Indicator Tracked - target
Number of countries covered by country offices Tracked
Number of IFAD-financed activities/projects scaled up by government or other donors Tracked
Number of design missions in which country office staff participate 100%
Number of RB-COSOPs in which country office staff participate 100%
Number of supervision / implementation support missions in which country office staff participate 100%
Percentage of financing disbursed as a percentage of disbursable funds Increase from 2010 average of 15%
Days between submission of withdrawal application and disbursement Reduction from 2010 average
Project status report ratings for selected fiduciary aspects Improvement from 2010 average
Cofinancing (domestic and external) as a percentage of total project cost Tracked
Enhanced harmonization of IFAD programmes with other donors Tracked - Client survey
Number of national forums at which IFAD is represented: Tracked
Enhanced alignment of IFAD programmes with national mechanisms and objectives in relation to rural poverty reduction
Tracked MOPAN reports, client survey
Policy changes, as a result of IFAD interventions, that address rural poverty issues and changes Tracked
Number of in-country Country Programme Management Teams [CPMTs] At least one per year
Number of country offices approved Reported - Executive Board approvals
Number of host country agreements signed 100% of country offices, by 2014

Appendix- Annex VI EB 2016/119/R.10
134
Appendix
- Annex IV
EC 2
016/9
5/W
.P.2
Indicator Tracked - target
Period between note verbale sent and agreement signed Tracked
Country office costs available – administrative and programmatic Complete by end-2011
Number of international staff posted to country offices Monitor
Source: Update on IFAD’s Country Presence. EB 2016/117/R.4.
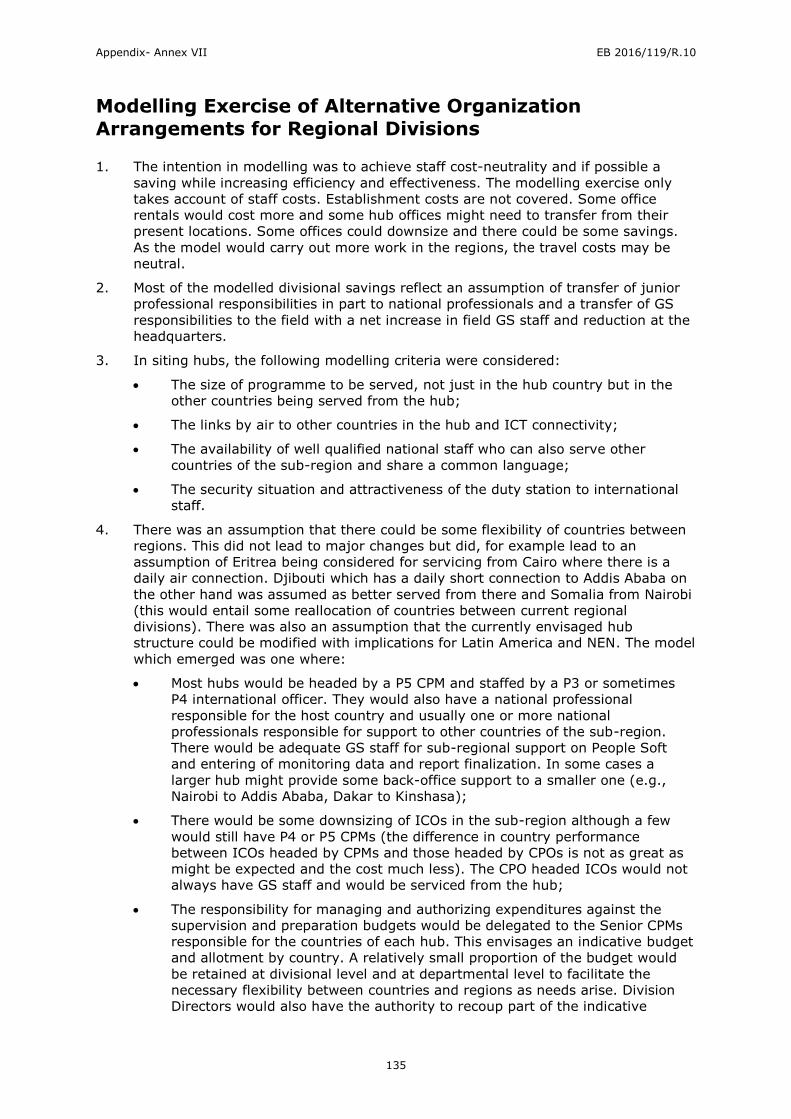
Appendix- Annex VII EB 2016/119/R.10
135
Appendix
- Annex IV
EC 2
016/9
5/W
.P.2
Modelling Exercise of Alternative Organization
Arrangements for Regional Divisions
1. The intention in modelling was to achieve staff cost-neutrality and if possible a
saving while increasing efficiency and effectiveness. The modelling exercise only
takes account of staff costs. Establishment costs are not covered. Some office
rentals would cost more and some hub offices might need to transfer from their
present locations. Some offices could downsize and there could be some savings.
As the model would carry out more work in the regions, the travel costs may be
neutral.
2. Most of the modelled divisional savings reflect an assumption of transfer of junior
professional responsibilities in part to national professionals and a transfer of GS
responsibilities to the field with a net increase in field GS staff and reduction at the
headquarters.
3. In siting hubs, the following modelling criteria were considered:
The size of programme to be served, not just in the hub country but in the
other countries being served from the hub;
The links by air to other countries in the hub and ICT connectivity;
The availability of well qualified national staff who can also serve other
countries of the sub-region and share a common language;
The security situation and attractiveness of the duty station to international
staff.
4. There was an assumption that there could be some flexibility of countries between
regions. This did not lead to major changes but did, for example lead to an
assumption of Eritrea being considered for servicing from Cairo where there is a
daily air connection. Djibouti which has a daily short connection to Addis Ababa on
the other hand was assumed as better served from there and Somalia from Nairobi
(this would entail some reallocation of countries between current regional
divisions). There was also an assumption that the currently envisaged hub
structure could be modified with implications for Latin America and NEN. The model
which emerged was one where:
Most hubs would be headed by a P5 CPM and staffed by a P3 or sometimes
P4 international officer. They would also have a national professional
responsible for the host country and usually one or more national
professionals responsible for support to other countries of the sub-region.
There would be adequate GS staff for sub-regional support on People Soft
and entering of monitoring data and report finalization. In some cases a
larger hub might provide some back-office support to a smaller one (e.g.,
Nairobi to Addis Ababa, Dakar to Kinshasa);
There would be some downsizing of ICOs in the sub-region although a few
would still have P4 or P5 CPMs (the difference in country performance
between ICOs headed by CPMs and those headed by CPOs is not as great as
might be expected and the cost much less). The CPO headed ICOs would not
always have GS staff and would be serviced from the hub;
The responsibility for managing and authorizing expenditures against the
supervision and preparation budgets would be delegated to the Senior CPMs
responsible for the countries of each hub. This envisages an indicative budget
and allotment by country. A relatively small proportion of the budget would
be retained at divisional level and at departmental level to facilitate the
necessary flexibility between countries and regions as needs arise. Division
Directors would also have the authority to recoup part of the indicative
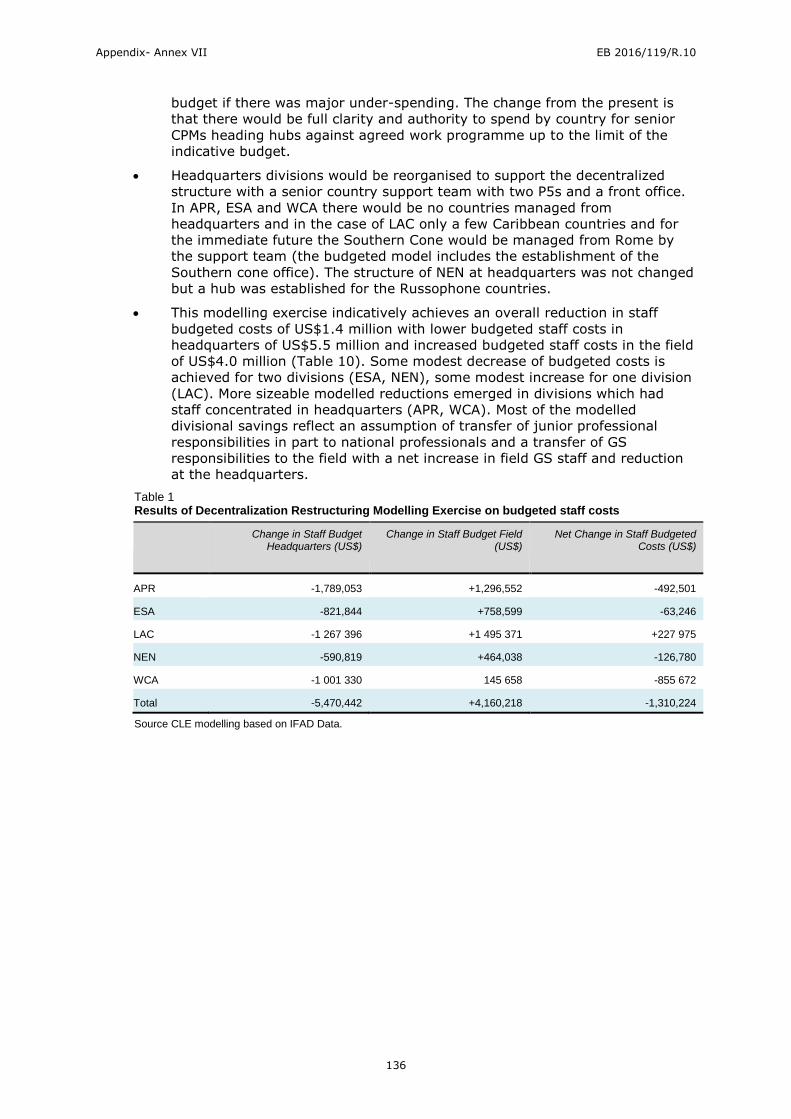
Appendix- Annex VII EB 2016/119/R.10
136
Appendix
- Annex IV
EC 2
016/9
5/W
.P.2
budget if there was major under-spending. The change from the present is
that there would be full clarity and authority to spend by country for senior
CPMs heading hubs against agreed work programme up to the limit of the
indicative budget.
Headquarters divisions would be reorganised to support the decentralized
structure with a senior country support team with two P5s and a front office.
In APR, ESA and WCA there would be no countries managed from
headquarters and in the case of LAC only a few Caribbean countries and for
the immediate future the Southern Cone would be managed from Rome by
the support team (the budgeted model includes the establishment of the
Southern cone office). The structure of NEN at headquarters was not changed
but a hub was established for the Russophone countries.
This modelling exercise indicatively achieves an overall reduction in staff
budgeted costs of US$1.4 million with lower budgeted staff costs in
headquarters of US$5.5 million and increased budgeted staff costs in the field
of US$4.0 million (Table 10). Some modest decrease of budgeted costs is
achieved for two divisions (ESA, NEN), some modest increase for one division
(LAC). More sizeable modelled reductions emerged in divisions which had
staff concentrated in headquarters (APR, WCA). Most of the modelled
divisional savings reflect an assumption of transfer of junior professional
responsibilities in part to national professionals and a transfer of GS
responsibilities to the field with a net increase in field GS staff and reduction
at the headquarters.
Table 1 Results of Decentralization Restructuring Modelling Exercise on budgeted staff costs
Change in Staff Budget Headquarters (US$)
Change in Staff Budget Field (US$)
Net Change in Staff Budgeted Costs (US$)
APR -1,789,053 +1,296,552 -492,501
ESA -821,844 +758,599 -63,246
LAC -1 267 396 +1 495 371 +227 975
NEN -590,819 +464,038 -126,780
WCA -1 001 330 145 658 -855 672
Total -5,470,442 +4,160,218 -1,310,224
Source CLE modelling based on IFAD Data.
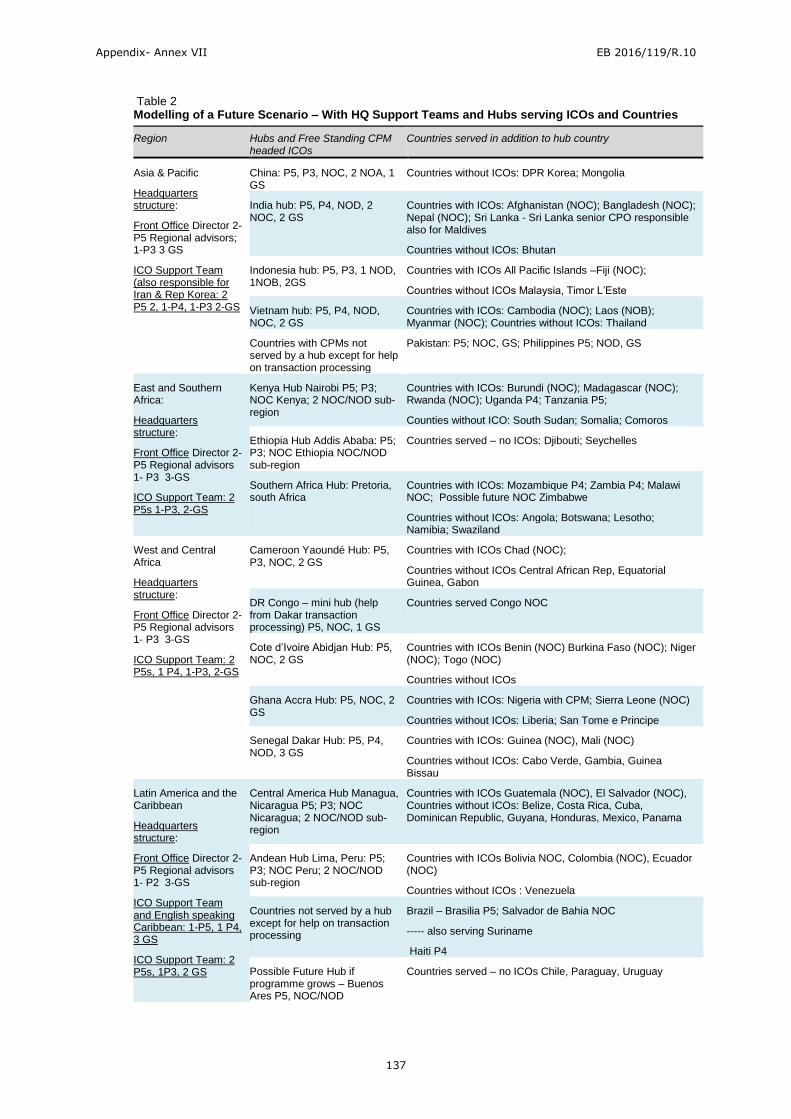
Appendix- Annex VII EB 2016/119/R.10
137
Appendix
- Annex IV
EC 2
016/9
5/W
.P.2
Table 2 Modelling of a Future Scenario – With HQ Support Teams and Hubs serving ICOs and Countries
Region Hubs and Free Standing CPM headed ICOs
Countries served in addition to hub country
Asia & Pacific
Headquarters structure:
Front Office Director 2-P5 Regional advisors; 1-P3 3 GS
ICO Support Team (also responsible for Iran & Rep Korea: 2 P5 2, 1-P4, 1-P3 2-GS
China: P5, P3, NOC, 2 NOA, 1 GS
Countries without ICOs: DPR Korea; Mongolia
India hub: P5, P4, NOD, 2 NOC, 2 GS
Countries with ICOs: Afghanistan (NOC); Bangladesh (NOC); Nepal (NOC); Sri Lanka - Sri Lanka senior CPO responsible also for Maldives
Countries without ICOs: Bhutan
Indonesia hub: P5, P3, 1 NOD, 1NOB, 2GS
Countries with ICOs All Pacific Islands –Fiji (NOC);
Countries without ICOs Malaysia, Timor L’Este
Vietnam hub: P5, P4, NOD, NOC, 2 GS
Countries with ICOs: Cambodia (NOC); Laos (NOB); Myanmar (NOC); Countries without ICOs: Thailand
Countries with CPMs not served by a hub except for help on transaction processing
Pakistan: P5; NOC, GS; Philippines P5; NOD, GS
East and Southern Africa:
Headquarters structure:
Front Office Director 2-P5 Regional advisors 1- P3 3-GS
ICO Support Team: 2 P5s 1-P3, 2-GS
Kenya Hub Nairobi P5; P3; NOC Kenya; 2 NOC/NOD sub-region
Countries with ICOs: Burundi (NOC); Madagascar (NOC); Rwanda (NOC); Uganda P4; Tanzania P5;
Counties without ICO: South Sudan; Somalia; Comoros
Ethiopia Hub Addis Ababa: P5; P3; NOC Ethiopia NOC/NOD sub-region
Countries served – no ICOs: Djibouti; Seychelles
Southern Africa Hub: Pretoria, south Africa
Countries with ICOs: Mozambique P4; Zambia P4; Malawi NOC; Possible future NOC Zimbabwe
Countries without ICOs: Angola; Botswana; Lesotho; Namibia; Swaziland
West and Central Africa
Headquarters structure:
Front Office Director 2-P5 Regional advisors 1- P3 3-GS
ICO Support Team: 2 P5s, 1 P4, 1-P3, 2-GS
Cameroon Yaoundé Hub: P5, P3, NOC, 2 GS
Countries with ICOs Chad (NOC);
Countries without ICOs Central African Rep, Equatorial Guinea, Gabon
DR Congo – mini hub (help from Dakar transaction processing) P5, NOC, 1 GS
Countries served Congo NOC
Cote d’Ivoire Abidjan Hub: P5, NOC, 2 GS
Countries with ICOs Benin (NOC) Burkina Faso (NOC); Niger (NOC); Togo (NOC)
Countries without ICOs
Ghana Accra Hub: P5, NOC, 2 GS
Countries with ICOs: Nigeria with CPM; Sierra Leone (NOC)
Countries without ICOs: Liberia; San Tome e Principe
Senegal Dakar Hub: P5, P4, NOD, 3 GS
Countries with ICOs: Guinea (NOC), Mali (NOC)
Countries without ICOs: Cabo Verde, Gambia, Guinea Bissau
Latin America and the Caribbean
Headquarters structure:
Front Office Director 2-P5 Regional advisors 1- P2 3-GS
ICO Support Team and English speaking Caribbean: 1-P5, 1 P4, 3 GS
ICO Support Team: 2 P5s, 1P3, 2 GS
Central America Hub Managua, Nicaragua P5; P3; NOC Nicaragua; 2 NOC/NOD sub-region
Countries with ICOs Guatemala (NOC), El Salvador (NOC), Countries without ICOs: Belize, Costa Rica, Cuba, Dominican Republic, Guyana, Honduras, Mexico, Panama
Andean Hub Lima, Peru: P5; P3; NOC Peru; 2 NOC/NOD sub-region
Countries with ICOs Bolivia NOC, Colombia (NOC), Ecuador (NOC)
Countries without ICOs : Venezuela
Countries not served by a hub except for help on transaction processing
Brazil – Brasilia P5; Salvador de Bahia NOC
----- also serving Suriname
Haiti P4
Possible Future Hub if programme grows – Buenos Ares P5, NOC/NOD
Countries served – no ICOs Chile, Paraguay, Uruguay

Appendix- Annex VII EB 2016/119/R.10
138
Appendix
- Annex IV
EC 2
016/9
5/W
.P.2
Region Hubs and Free Standing CPM headed ICOs
Countries served in addition to hub country
Near East, North Africa, Central Asia and Europe
NEN model does not restructure Headquarters and in addition to the budgeted ICO in Turkey, establishes a hub in Bishkek, Tajikistan to serve the central Asian Russophone countries (headquarters is reduced by 1 P5, 1 P3, and 2 senior GS. Bishkek is staffed with 1 P5, 1 P3, 1 NOC and 2 GS. The CPM headed ICO in Cairo is envisaged as taking responsibility for Eritrea to which there is a daily flight connection and might take some responsibilities for Sudan to which it also has a daily short flight connection. Somalia would be handled from Nairobi and Djibouti from Addis Ababa.
Source CLE modelling based on IFAD Data.
Table 3 Post change summary
Change in HQ number of posts HQ
Change in number of
Posts Field
Net Change in Total number of
Posts Region
Change in HQ number of posts HQ
Change in number of
Posts Field
Net Change in Total
number of Posts Region
APR 0-D1 0 D1 0 D1 ESA 0-D1 0-D1 0-D1
-2 P5 +2-P5 0-P5 1- P5 -1-P5 0-P5
-2 P4 +2-P4 0P4 -1 P4 +1 P4 0-P4
- 2 P3 +2-P3 0-P3 -1P3 +2-P3 +1-P3
-1 P2 0-P2 -1 -1 P2 -1-P2 -2-P2
+4-NOD +4-NOD +3-NOD +3-NOD
-1-NOC -1-NOC +4-NOC +4-NOC
0-NOB 0-NOB 0-NOB 0-NOB
-3-NOA -3-NOA
-2 G6 0-G6 -2-G6 -1G6 0-G6 -1G6
0 G5 0-G5 0-G5 -3G5 -1-G5 -4G5
-4 G4 +2-G4 -2-G4 -1G4 +3-G4 +2-G4
0 G3 +4-G3 +4-G3 -1G3 0-G3 -1G3
LAC 0-D1 0-D1 0-D1 NEN 0-D1 0-D1 0-D1
-2 P5 +2-P5 +0-P5 -1 P5 +1-P5 0-P5
O-P4 -2-P4 -2-P4 O-P4 0-P4 0-P4
-2- P3 +2-P3 0-P3 -1- P3 +1-P3 0-P3
-2-P2 0 -2-P2 0-P2 0-P2 0-P2
+3-NOD +3-NOD 0-NOD 0-NOD
+8-NOC +8-NOC +2-NOC +2-NOC
-1-NOB -1-NOB 0-NOB 0-NOB
-0-NOA 0-NOA 0-NOA 0-NOA
O -G6 0-G6 0-G6 -1 -G6 0-G6 -1-G6
-1-G5 0-G5 0-G5 -1-G5 0-G5 -1-G5
-1-G4 +1-G4 +1-G4 0-G4 +1-G4 +1-G4
0 G3 +3-G3 +3-G3 0-G3 +1-G3 +1-G3
WCA 0-D1 0-D1 0-D1 Grand Total
0-D1 0-D1 0-D1
+1-P5 +1P5 +2P-5 -3-P5 +7-P5 +4-P5

Appendix- Annex VII EB 2016/119/R.10
139
Appendix
- Annex IV
EC 2
016/9
5/W
.P.2
Change in HQ number of posts HQ
Change in number of
Posts Field
Net Change in Total number of
Posts Region
Change in HQ number of posts HQ
Change in number of
Posts Field
Net Change in Total
number of Posts Region
-1-P4 0 -1 P4 -4-P4 +3-P4 -1-P4
0-P3 -1P3 -1P3 -6-P3 +6-P3 0-P3
-3-P2 -2P2 -5P2 -6-P2 -3-P2 -9-P2
+1NOD +1NOD +11-NOD +11-NOD
+4NOC +4NOC +17-NOC +17-NOC
0-NOB 0-NOB
-3-G6 -1G6 -4G6 -3-NOA -3-NOA
-3-G5 +3G4/G5 0 G5 -7-G6 -1G-6 -8-G6
0 G4 +3G3 +3G3 -15-G3/G5 +21-G3/G5 +6-G3/G5
Source: CLE modelling.

Appendix- Annex VIII EB 2016/119/R.10
140
Appendix
- Annex IV
EC 2
016/9
5/W
.P.2
Report of the Senior Independent Advisor Richard Manning
1. I was retained by the Independent Office of Evaluation of IFAD (IOE) to act as a
Senior Independent Advisor for the Corporate-level evaluation on IFAD's
Decentralization Experience.
Activities
2. My first task was to review the Approach Paper. I found this in the main to be well-
constructed. My comments were mainly to ensure that the approach to the CLE did
not contain any assumption that decentralization was necessarily an appropriate
policy for IFAD and so risk skewing the findings. I appreciated that the Board had
given consistent support to decentralization over a long period, but it is important
that an evaluation looks at the evidence without presuppositions.
3. In September, I then reviewed the emerging draft report. Again, I was encouraged
by its quality. Although I gave the Evaluation Department quite a number of
comments on the draft, which were substantially accepted, I found it logically
constructed, demonstrating an impressive search for relevant evidence and with
findings and conclusions that appeared very reasonable in the light of that
evidence. The final version has the same virtues, now with a number of
improvements of detail.
Comments on Methodology
4. It is necessarily difficult to construct unarguable conclusions from an evaluation in
the absence of a fully-robust counterfactual. In this case, such a counterfactual is
not available, since one cannot test decentralization and its absence in the same
population of countries over the same period. The methodology used by the CLE,
while comparing performance and cost in decentralized and centralized situations in
different countries or in different time periods, therefore buttresses the results of
that analysis with the use of surveys of staff and (importantly) of host country
governments and other stakeholders, including through regional workshops and
interviews with key informants. I support this diversified approach, which provides
a form of triangulation that strengthens the findings from the comparative analysis.
Comments on Findings and Conclusions
5. As I have said above, the findings and conclusions seem to me to follow directly
from the evidence. It is perhaps useful for me to add to that brief judgement some
points from my own direct experience in decentralization in Department for
International Development (DFID) and its predecessor agencies in the 1990s and
the early years of this century, and from observing other agencies, both those that
have embraced decentralization (from the World Bank to Japan International
Cooperation Agency) and those that have kept to a model without a direct country
presence (such as Global Alliance for Vaccines and Immunization and the Global
Fund for AIDS, TB and Malaria).
6. The finding that some assumptions about the decentralization process were not
realistic chimes with the experience of at least some other agencies. Cost neutrality
is a tough target, and some cost increase may indeed be justified if effectiveness
increases more than proportionately. In fact, in IFAD’s case, costs were seemingly
quite well controlled overall. And while a degree of experimentation with alternative
country presence modalities may well be a sound policy, it should certainly lead to
a clear standardized corporate approach sooner rather than later. In DFID and its
predecessors, the necessity of reforming the roles and responsibilities of HQ was,
after a fair amount of trial and error, fully recognized; and I consider the need for
this an important finding of the CLE.
Appendix- Annex VIII EB 2016/119/R.10
141
Appendix
- Annex IV
EC 2
016/9
5/W
.P.2
7. It is on the other hand very encouraging that there seems to be a wider recognition
by staff of the value of decentralization. In my experience, this is a good test of
whether the process is seen to be delivering results.
8. It is encouraging, but not at all surprising, to see that decentralization appears to
have contributed to improved operational performance, whether of COSOPs, of
project implementation support or of project effectiveness.
9. I welcome the frank recognition of the three caveats which apply to all the
judgements on outcomes and development results:
many factors other than the work of ICOs influence project performance;
there are few projects that were identified, designed, approved, implemented
and evaluated after an ICO was established;
the establishment of country offices was not assigned randomly and it cannot
be assumed that countries with and without ICOs share the same salient
characteristics.
10. As noted above, the CLE has done well in triangulating evidence from several
different sources in order to take account of these limitations.
11. I would just note that some care is needed in interpreting the word ‘significant’,
much used in the assessment of effectiveness. The report does an excellent job of
highlighting which differences are statistically significant, which is a robust and
widely accepted measure. How far improvements are to be seen as ‘significant’ in
terms, say, of percentage increase in outcomes, is however a matter of judgement.
For example, while the report finds that ‘Average project performance ratings were
significantly [in the statistical sense] higher with ICOs’, the fact that the rating
rises from 3.95 to 4.26 on a five-point scale (i.e., about 5%) might or might not be
seen as a ‘significant’ increase. Of course, if IFAD were to see really transformative
increases in project outcomes from decentralization, that would probably suggest
that the HQ-based system was seriously dysfunctional, which is unlikely to have
been the case. To find, as the report does, useful but moderate percentage
improvement in many outcomes is to my knowledge fairly typical of
decentralization also in other agencies.
12. The report seems to me to do a good job of explaining why the impact of country
presence was notable in the case of partnership building but more limited for
knowledge management and policy dialogue.
13. The assessment of IFAD’s contribution to development results seems very fair.
Again, the limitations above apply, and some (but not all) of the statistically
significant improvements are again quite modest.
14. I was interested to read the comments on differences between country offices led
by international and by national staff, which turned out to be quite minor. Most
agencies place international staff at the head of most offices, while also drawing
heavily on the skills and experience of national staff. I fully support, from my own
experience, the positive comments about the role that national staff can be
encouraged to play, within an appropriate framework set either by HQ or by locally
or regionally-posted international staff.
15. The analysis of efficiency shows that, overall, costs of decentralization have been
well controlled, though not fully cost-neutral. The report has done good service in
trying to bring together cost data in a way that permits useful analysis, and is right
to express concerns about how well the costs have been monitored (a conclusion
that is not unique to IFAD). I also welcome the encouragement to explore some
readjustment of headquarters functions and staff as an avenue to provide more
resources to the country offices and to reap efficiency gains. It should however be
borne in mind that in some areas there may be a need for some selective
Appendix- Annex VIII EB 2016/119/R.10
142
Appendix
- Annex IV
EC 2
016/9
5/W
.P.2
strengthening of HQ functions. For example, there may be a need to strengthen
internal audit particularly where financial responsibilities are delegated, as may
well be desirable.
16. The analysis of the costs of the various models is thought-provoking. My
experience would support the exploration of sub-regional approaches where the
size of individual country programmes is modest (as often the case for IFAD), and
also the caution about unrestricted expansion of country presence.
17. I welcome the attention given in the report to HR aspects, which are always an
important issue in structural change. Based on my own experience, I particularly
welcome the proposals to invest in national staff and to consider their career
progression, and to manage sensitively but firmly any necessary shrinkage of some
categories of HQ staff.
18. The conclusions and recommendations seem to me to follow well from the analysis.
Conclusion
19. I commend the report to readers as well-designed, well-written and strongly
evidence-based. I should add that it is very much to the credit of the team that this
complex evaluation has been completed so quickly.

Appendix- Annex IX EB 2016/119/R.10
143
Appendix
- Annex IV
EC 2
016/9
5/W
.P.2
Selected References
IFAD documents
IFAD. 2000. Partnership for Eradicating Rural Poverty: Report of the Consultation to
Review the Adequacy of the Resources Available to IFAD 2000-2002. GC 24/L.3.
Rome: IFAD
IFAD. 2002. A guide for Project M&E. Rome: IFAD
IFAD. 2002. IFAD Field Presence and In-Country Capacity. REPL.VI/5/C.R.P.2. Rome:
IFAD
IFAD. 2003. Field Presence Pilot Programme. EB 2003/80/R.4. Rome: IFAD
IFAD. 2003. IFAD’s Field Presence and In-Country Capacity. EB 2003/79/R.3/Rev.1.
Rome: IFAD
IFAD. 2004. Human Resources Policy. EB 2004/82/R.28/Rev.1. Rome: IFAD
IFAD. 2006. Guidelines for Project Completion. Rome: IFAD
IFAD. 2006. President’s Report on IFAD Policy on Supervision and Implementation
Support. EB 2006/89/R.4/Rev.1. Rome: IFAD
IFAD. 2007. Activity Plan for IFAD’s Country Presence. EB 2007/92/R.47. Rome: IFAD
IFAD. 2007. IFAD Policy for Direct Supervision and Implementation Support. Rome: IFAD
IFAD. 2007. Report on IFAD’s Development Effectiveness. EB 2007/92/R.9/Rev.1. Rome:
IFAD
IFAD. 2008. Progress Report and Activity Plan for IFAD’s Country Presence. EB
2008/95/R.9/Rev.1. Rome: IFAD
IFAD. 2008. Report on IFAD’s Development Effectiveness. EB 2008/95/R.8/Rev.1. Rome:
IFAD
IFAD. 2009. IFAD's 2010 Results-based Programme of Work and Administrative and
Capital Budgets, and the Office of Evaluation's Three-year (2010-2012) Rolling Work
Programme and 2010 Resource Issues. EB 2009/98/R.2. Rome: IFAD
IFAD. 2009. Progress Report and Activity Plan for IFAD’s Country Presence. EB
009/98/R.11. Rome: IFAD
IFAD. 2010. Evaluation Reports on Country Presence: Excerpts of Texts. EB
2010/101/C.R.P.3. Rome: IFAD
IFAD. 2010. IFAD's 2011 Results-based Programme of Work and Administrative and
Capital Budgets, and the IFAD Office of Evaluation's Results-based Work Programme
and Budget for 2011 and Indicative Plan for 2012-2013. EB 2010/101/R.2/Rev.1.
Rome: IFAD
IFAD. 2010. Progress Report and Activity Plan for IFAD’s Country Presence. EB
2010/101/R.15. Rome: IFAD
IFAD. rev. 2011. Agreement Establishing IFAD. Rome: IFAD
IFAD. 2011. IFAD Country Presence Policy and Strategy. EB 2011/102/R.10/Rev.2.
Rome: IFAD
IFAD. 2011. IFAD Country Presence Policy – Update. EB 2011/103/R.8/Rev.1. Rome:
IFAD
IFAD. 2011. IFAD's 2012 Results-based Programme of Work and Administrative and
Capital budgets, and the Independent Office of Evaluation of IFAD's Results-based

Appendix- Annex IX EB 2016/119/R.10
144
Appendix
- Annex IV
EC 2
016/9
5/W
.P.2
Work Programme and Budget for 2012 and Indicative Plan for 2013-2014. EB
2011/104/R.2/Rev.1. Rome: IFAD
IFAD. 2011. Self-Assessment Report: IFAD Country Presence Programme. EB
2011/102/R.10/Add.2. Rome: IFAD
IFAD. 2012. IFAD Partnership Strategy. Rome: IFAD
IFAD. 2012. IFAD's 2013 Results-based Programme of Work and Regular and Capital
Budgets, the IOE Results-based Work Programme and Budget for 2013 and Indicative
Plan for 2014-2015, and the HIPC and PBAS Progress Reports. Rome: IFAD
IFAD. 2013. Country-level Policy Engagement: Opportunity and Necessity. Rome: IFAD
IFAD. 2013. IFAD's 2014 Results-based Programme of Work and Regular and Capital
Budgets, the IOE Results-based Work Programme and Budget for 2014 and Indicative
Plan for 2015-2016, and the HIPC and PBAS Progress Reports. EB 2013/110/R.2.
Rome: IFAD
IFAD. 2013. IFAD Country Presence Strategy (2014-2015). EB 2013/110/R.5/Rev.1.
Rome: IFAD
IFAD. rev. 2013. Policies and Criteria for IFAD Financing. Rome: IFAD
IFAD. 2014. IFAD’s 2015 Results-based Programme of Work and Regular and Capital
Budgets, the IOE Results-based Work Programme and Budget for 2015 and Indicative
Plan for 2016-2017, and the HIPC and PBAS Progress Reports. EB 2014/113/R.2.
Rome: IFAD
IFAD. 2015. Brokering Development: Enabling Factors for Public-Private-Producer
Partnerships in Agricultural Value Chains. Rome: IFAD
IFAD. 2015. IFAD Annual Report. Rome: IFAD
IFAD. 2015. Scaling Up Results. Rome: IFAD
IFAD. 2016. Country-level Policy Engagement in IFAD: A Review of Experience. Rome:
IFAD
IFAD. 2016. Evaluation Manual Second Edition. Rome: IFAD
IFAD. 2016. Update on IFAD’s Country Presence. EB 2016/117/R.4. Rome: IFAD
IFAD. 2016. IFAD Strategic Framework 2016-2025. Enabling Inclusive and Sustainable
Rural Transformation. EB 2015/116/R.4/Rev.1. Rome: IFAD
IFAD. 2016. IFAD’s 2016 Results-based Programme of Work and Regular and Capital
Budgets, the IOE Results-based Work Programme and Budget for 2016 and Indicative
Plan for 2017-2018, and the HIPC and PBAS Progress Reports. GC 39/L.4. Rome:
IFAD
IFAD and Farmers’ Organizations. 2016. Partnership in Progress: 2014 – 2015. Rome:
IFAD
IOE Evaluation Reports
IFAD. 2005. An Independent External Evaluation of the International Fund for
Agricultural Development. Office of Evaluation. Rome: IFAD.
IFAD. 2007. Evaluation of IFAD’s Field Presence Pilot Programme. Rome: IFAD
IFAD. 2010. IFAD’s Capacity to Promote Innovation and Scaling Up. Corporate-level
Evaluation. Independent Office of Evaluation. Rome: IFAD
IFAD. 2011. Country Programme Evaluation for the Republic of Kenya. Independent
Office of Evaluation. Rome: IFAD
Appendix- Annex IX EB 2016/119/R.10
145
Appendix
- Annex IV
EC 2
016/9
5/W
.P.2
IFAD. 2012. Annual Report on Results and Impact of IFAD Operations in 2011.
Independent Office of Evaluation. Rome: IFAD
IFAD. 2012. Country Programme Evaluation for the Socialist Republic of Viet Nam.
Independent Office of Evaluation. Rome: IFAD
IFAD. 2013. IFAD’s Institutional Efficiency and Efficiency of IFAD-funded Operations.
Corporate-level Evaluation. Independent Office of Evaluation. Rome: IFAD
IFAD. 2013. IFAD’s Supervision and Implementation Support Policy. Corporate-level
Evaluation. Independent Office of Evaluation. Rome: IFAD
IFAD. 2014. IFAD Policy for Granting Financing. Corporate-level Evaluation. Independent
Office of Evaluation. Rome: IFAD
IFAD. 2014. Annual Report on Results and Impact of IFAD Operations in 2013.
Independent Office of Evaluation. Rome: IFAD
IFAD. 2015. Annual Report on Results and Impact of IFAD Operations in 2014.
Independent Office of Evaluation. Rome: IFAD
IFAD. 2015. Country Programme Evaluation for the United Republic of Tanzania.
Independent Office of Evaluation. Rome: IFAD
IFAD. 2016. IFAD’s Performance-based Allocation System. Corporate-level Evaluation.
Independent Office of Evaluation. Rome: IFAD
External documents
African Development Bank (AfDB). 2009. Independent Evaluation of the Decentralization
Strategy and Process at the African Development Bank. Abidjan: AfDB
AfDB. 2011. Decentralization Roadmap. Abidjan: AfDB.
AfDB. 2015. Annual report 2014. Abidjan: AfDB
AfDB. 2009. Independent Evaluation of the Decentralization Strategy and Process at the
African Development Bank: AfDB.
AfDB. March 2011. Decentralization roadmap: AfDB
AfDB. June 2014. Mid-Term Review of AfDB Decentralization. Summary: AfDB
Asian Development Bank (ADB). 2007. Resident Mission Policy and Related Operations:
Delivering Services to Clients. Manila: ADB
ADB. 2013. Decentralization: Progress and Operational Performance. Manila: ADB
ADB. 2014. Annual Report 2013. Manila: ADB
ADB. 2007. Resident Mission Policy and Related Operations: Delivering Services to
Clients: AsDB
ADB. 2008. Review of Resident Missions’ Operations: AsDB
ADB. 2013. Decentralization: Progress and Operational Performance
ADB. Midterm Review of Strategy 2020 Action Plan. 2014. EBRD.
Boris Ewenstein, Wesley Smith, and Ashvin Sologar. 2015. Changing change
management. McKinsey Digital
Carolyn Aiken and Scott Keller. 2009. The irrational side of change management.
McKinsey Quarterly
Appendix- Annex IX EB 2016/119/R.10
146
Appendix
- Annex IV
EC 2
016/9
5/W
.P.2
Dalberg. 2012. Decentralization Experiences at Multilateral Development Banks:
Summary of findings for contributors to Dalberg’s research on behalf of the Inter-
American Development Bank. PowerPoint presentation.
Development Bank of Latin America. 2016. Investor Presentation. Caracas, Venezuela
EBRD's Experience with Resident Offices. 2016: EBRD
FAO. 2004. Independent Evaluation of FAO’s Decentralization. PC 92/6a) – FC 108/18.
Rome: FAO
FAO. 2007. Report of the Independent External Evaluation of FAO. C2007/7A.1-Rev.1.
Rome: FAO
FAO. 2011. FAO Decentralized Offices, Where Knowledge Becomes Action. Rome.
FAO. 2015. Decentralised Offices: Where Knowledge Becomes Action: FAO
FAO. 2004. Independent Evaluation of FAO's Decentralization: FAO
FAO. 2015. Synthesis of the evaluations of FAO’s Regional and Subregional Offices.
Office of Evaluation: FAO
IADB. 2012. Corporate Evaluation. Results of the Realignment 2014: IADB, Dalberg.
Jerry M. Silverman. 1992. Public Sector Decentralization: Economic Policy and Sector
Investment Programs. Volume 188. World Bank
McKinsey& Company. 2010. Global Survey Results: What successful transformations
share.
Montana, P. and Charnov, B. 1993. Management: A Streamlined Course for Students and
Business People. Hauppauge, New York.
OECD. 2010. Glossary of Key Terms in Evaluation and Results Based Management. Paris:
OECD.
Rondinelli, et al. 1981. Government Decentralization in Comparative Perspective:
Developing Countries. International Review of Administrative Science. 47(2).
UNDP. 2014. Changing with the World, UNDP strategic plan (2014 - 2017). New York:
UNDP
UNSPECIFIED. 1974. World Food Conference, Rome, 5 to 16 November 1974.
Communication from the Commission to the Council. SEC (74) 4955 final. Brussels.
WFP. 2003. Full Report of the Review of WFP’s. Rome: WFP
WFP. 2003. Review of WFP’s Decentralization Initiative. Rome: WFP
WFP. 2007. Has Decentralization Met the World Food Programme’s Operational Needs?
WFP. 2009. Review of Management and Administration in the World Food Programme.
World Bank. 2012. The Matrix System at Work: An Evaluation of the World Bank’s
Organizational Effectiveness. Washington, D.C.: World Bank
World Bank. 2015. World Bank Annual Report 2015. Washington, D.C.: World Bank
World Bank. 2012.The Matrix System at Work: An Evaluation of the World Bank’s
Organizational Effectiveness: World Bank.
Appendix- Annex X EB 2016/119/R.10
147
Appendix
- Annex IV
EC 2
016/9
5/W
.P.2
List of key persons met
IFAD
Kanayo Nwanze, President
Michel Mordasini, Vice President
Lakshmi Menon, Associate Vice-President, CSD
Perin Saint Ange, Associate Vice-President, PMD
Josefina Stubbs, Associate Vice-President, SKD
Henock Kifle, Associate Vice President and Chief of Staff, OPV
Rasit Pertev, former Secretary of IFAD
Saheed Adegbite, Director, BOD
Margarita Astralaga, Director, ECD
Thomas Bousios, Director, ICT
Khalida Bouzar, Director, NEN
Adolfo Brizzi, Director, PTA
Ides De Willebois, Director, WCA
Ruth Farrant, Director, Financial Management Division, CFS
Sana Jatta, Director, ESA
Luis Jimenez-Mcinnis, Director, PRM
Joaquin Lozano, Director, LAC
Matthias Meyerhans, Director, ADM
Pierre Moreau-Peron, Director, HRD
Ashwani Muthoo, Director, GER
Adam Ahmed Mohamed Abdelgadir, Country Programme Manager, NEN
Hanafi Abdelhaq, Country Programme Manager, NEN
Moses Abukari, Country Programme Manager, WCA
Valantine Achancho, Programme Officer, ESA
Adenike Ajagunna, Programme Assistant, LAC
Caroline Alupo, Regional Finance Officer, CFS
Yolando Arban, Country Programme Officer, APR
Sylvie Arnoux, Senior Legal Officer, LEG
Vivian Azore, Country Programme Assistant, APR
Gisella Barbieri, Administrative Associate, LAC
Kaushik Barua, Programme Officer, NEN
Frew Behabtu Bedasso, Country Programme Officer, ESA
Valentina Berardini, Administrative Services Analyst (Records Management), ADM
Willem Wefers Bettink, Lead Partnership and Resource Mobilization Manager, PRM
Roman Bezuszko, Technical Support Assistant, ICT
Appendix- Annex X EB 2016/119/R.10
148
Appendix
- Annex IV
EC 2
016/9
5/W
.P.2
Caroline Bidault, Country Programme Manager, LAC
Nigel Brett, Portfolio Advisor, APR
Sara Bridges, Portfolio Analyst, PMD
Rocio Chirinos, Programme Assistant, LAC
Daniela Cirillo, Administrative Assistant, ESA
Duygu Celik, Organizational Development Officer, BOD
Kevin Cleaver, former Associate Vice-President, PMD
Ludovic Pascal Conditamde, Country Programme Officer, WCA
Robert Creswell, Loans and Grants Manager, CFS
May David, Administrative Assistant, NEN
Rocio Del Pilar, Programme Assistant, LAC
Yvonne Diethelm, Programme Assistant, APR
Han Ulac Demirag, Country Programme Manager, ESA
Paola di Stefano, Programme Assistant, NEN
Khalid El Harizi, former Advisor, PMD
Hani Elsadani, Head of IRON and Country Director Kenya, ESA
Khadidja Doucoure, Regional Gender Coordinator, WCA
Antonella Favia, Senior Administrative Officer, FSU
Kelly Feenan, Costumer Services Administrator, ICT
Glayson Ferrari Dos Santos, Country Programme Manager, LAC
Mirka Ferrise, Administrative Assistant, LAC
Ilaria Firmian, Environment and Climate Knowledge Officer, ECD
Daniela Frau, System and Data Officer, CFS
Edward Gallagher, Senior Budget Specialist, BOD
Klarisse Guerra, Programme Assistant, LAC
Christian Hakiba, Programme officer, ESA
David Hatcher, Senior Finance Specialist, CFS
James Heer, Broadcast Communication Manager, COM
Edward Heinemann, Lead Technical Specialist, PTA
Magaly Luisa Herrera, Programme Assistant, LAC
Sandrine Jacqueson, Programme Assistant, NEN
Vrej Jijyan, Programme Officer, NEN
Mwatima Juma, Country Programme Officer, ESA
Mariatu Kamara, Country Programme Officer, WCA
Mikael Kauttu, Programme Officer, NEN
Laureta Kazanxhiu, Accounting Officer, CFS
Liu Ke, Associate Country Programme Officer, APR
Sennai Kebedom, Administrative Associate, NEN

Appendix- Annex X EB 2016/119/R.10
149
Appendix
- Annex IV
EC 2
016/9
5/W
.P.2
Paula Kim, Senior Operation Adviser, FSU
Sara Kouakou, Portfolio Officer, PMD
Theophilus Larbi, Country Programme Officer, WCA
Jessica Lattughi, Budget Associate, APR
Shahin Lauritzen, former Associate Vice President, FOD
Harold Liversage, Lead Technical Specialist, PTA
Annabelle Celine Lhommeau, Country Programme Manager, NEN
Sandro Luzzietti, Procurement Manager, ADM
Elisa Mandelli, Junior Professional Officer, PTA
Mia Madsen, Junior Professional Officer, NEN
Helen Maree Gillman, Senior Knowledge Management Specialist, SKD
Alessandro Marini, Country Programme Manager, ESA
Lisandro Martin, Lead Programme Manager, PMD
Isabella Mazzarella, Programme Assistant, NEN
Sakphouseth Meng, Country Programme Officer, APR
Sarah Mirmotahari, HR Officer, FSU
Meera Mishra, Country Programme Officer, APR
Anna Ramona Mongibello, Operations Analyst, FSU
Lakshmi Moola, Country Programme Manager, APR
Pontian Muhwezi, Country Programme Officer, ESA
Bernadette Mukonyora, Programme Analyst, ESA
Nerina Muzurovic, Knowledge Management Officer, NEN
Joseph Nganga, Country Programme Officer, ESA
Karine Nikiema, Country Programme Assistant, WCA
Marcelin Norvilus, Country Programme Officer, LAC
Khanh Nguyen, Country Programme Assistant, APR
Hoai Thu Nguyen, Associate Country Officer, APR
Thanh Tung Nguyen, Country Programme Officer, APR
Luyaku Nsimpasi, Country Programme Manager, WCA
Aimable Ntukanyagwe, Country Programme Officer, ESA
Rasha Omar, Country Director for India, APR
Willy Ong, Application Service Administrator, ICT
Soulivanh Pattivong, Country Programme Officer, APR
Soulivanh Pattivong, Country Programme Officer, APR
Henning Pedersen, Country Programme Manager and Country Director Hanoi Hub, APR
Lauren Phillips, Senior Technical Specialist, PTA
Francisco Pichon, Country Programme Manager, ESA
Laura Puletti, Programme Assistant, APR
Appendix- Annex X EB 2016/119/R.10
150
Appendix
- Annex IV
EC 2
016/9
5/W
.P.2
Jesus Quintana, Sub-regional Coordinator, LAC
Thomas Rath, Country Programme Manager, ESA
Claus Reiner, Country Programme Manager, LAC
Tomas Rosada, Regional Economist and Country Programme Manager, LAC
Allegra Saitto, Manager, Accounting & Financial Reporting, CFS
Dina Saleh, Country Programme Manager, NEN
Rami Salman, Country Programme Manager, NEN
Clare Sambrook Bishop, Lead Technical Specialist- Gender and Social Inclusion, PTA
Maria Luisa Saponaro, Consultant, LAC
Abdelkarim Sma, Regional Economist, NEN
Elizabeth Ssendiwala, Regional Gender and Youth Coordinator, ESA
Beate Stalsett, Web and Internal Communication Officer, COM
Isabelle Stordeur, Programme Associate, NEN
Ahmed Subahi, Country Programme Officer, NEN
Yinhong Sun, Country Programme Officer, APR
Bethlehem Tafesse, Administrative Assistant, NEN
Kotb Tarek, Country Programme Officer, NEN
Barseba Tekle, Administrative Associate, ESA
Benoit Thierry, Country Programme Manager, APR
Brian Thomson, Knowledge Management and Communication Manager, ECD
Hardi Vieira, Country Programme Officer, LAC
Evaluation Committee of IFAD Executive Board
Vimlendra Sharan, former Chair of Evaluation Committee, Alternate Permanent
Representative of the Republic of India to the United Nations Food and Agriculture
Agencies in Rome (India)
Margot Skarpeteig, Evaluation Committee member, member. Deputy Permanent
Representative of Permanent Mission of Norway to the UN Agencies in Rome, FAO, WFP
and IFAD
Government representatives
Soumiya Chbar, Chef Project, Agence pour le Développement Agricole, Morocco
Xaypladeth Choulamany, Director General, Department of Planning and Cooperation,
Ministry of Agriculture and Forestry, Vientiane, Laos
Valentín Cobeñas, Director de financiamiento, Dirección general de Endeudamiento y
Tesoro Público, Ministerio de Finanzas, Perú
Rory Dacumos, National Economic and Development Authority, Philippines
Angela Danson, Ministry of Agriculture, Ghana
Hugo Dután, Gerente del Programa del Buen Vivir Rural, Ministerio de Agricultura y
Ganaderia, Acuacultura y Pesca, Ecuador
Appendix- Annex X EB 2016/119/R.10
151
Appendix
- Annex IV
EC 2
016/9
5/W
.P.2
Adamar Estrada, National Programme Coordinator, Department of Agriculture,
Philippines
Hugo Alexander Flores, Viceministro, Ministerio de Agricultura y Ganadería, Republica de
el Salvador
Jing Fu, Director, Division of Finance and Statistics, Department of International
Financial Cooperation, Ministry of Finance, China
Florante G. Igtiben, Assistant Director, Pubic Investment Staff, National Economic and
Development Authority, Philippines
Yrah Kriselle, International Finance Group, Department of Finance, Philippines
Miroljub Krunić, Assistant Minister, Ministry of Finance and Treasury, Bosnia and
Herzegovina
John Kuchaka, Principle Finance Management Officer, Ministry of Finance and Planning,
Tanzania
Sharián López Cox, Analista de Preinversión y Cooperación Nacional e Internacional
Ministerio de Agricultura, Ganadería, Acuacultura y Pesca, Ecuador
Alexander Lotuashvili, Head of International Organizations Project Implementation
Department, Ministry of Agriculture, Georgia
Luisa R. Magbojos, Senior Economic Development Specialist, National Economic and
Development Authority, Philippines
Moussa Maiga, Directeur général des études et des statistiques sectorielles, Burkina Faso
Dinna Manlangli, M&E staff, National Economic and Development Authority, Philippines
Margarita Mateu Bullón, Directora, Dirección de Desarrollo Agrario, Agrorural, Perú
Mónica Lily Mendoza Esprella, Analista Financiera/responsable de la cartera FIDA,
Viceministro de inversión Pública y Ministerio de Planificación y Desarrollo de Bolivia
Santiago Milona Placencia, Dirección Nacional de Seguimiento y Evaluación del
Financiamiento Público, Encargado del portafolio del FIDA, Ministerio de Finanzas,
Ecuador
Diego Andrés Mora Garcia, Subdirector, Dirección de Desarrollo Rural Sostenible,
Departamento Nacional de Planeación, Colombia
Gerald Mugabe, Ministry of Finance and Economic Planning, Rwanda
Tingting Mu, Deputy Director, Division of Finance and Statistics, Department of
International Financial Cooperation, Ministry of Finance, China
Fuad Muhaisen, Assistant Secretary General for Projects, Ministry of Agriculture, Jordan
Minh Tien Nguyen, Director General, Chief of National Coordination Office of the National
Target Programme on New Rural Development, Ministry of Agriculture and Rural
Development, Vietnam
John C . Ogol, Senior Officer, Development Assistance and Regional Cooperation
Department, Ministry of Finance, Planning and Economic Development, Uganda
Walter Ogwindo, Senior Deputy Director, Resource Mobilisation Department, the National
Treasury, Kenya
Robert Ouédraogo, Secrétaire Général du Ministère de l'Agriculture et des
Aménagements Hydrauliques, Burkina Faso
Susan Perez, Project Development Officer, Department of Agrarian Reform, Philippines
Duong Quynh Le, Head of Multilateral Division, Department of Debt Management and
External Finance, Ministry of Finance, Vietnam
Appendix- Annex X EB 2016/119/R.10
152
Appendix
- Annex IV
EC 2
016/9
5/W
.P.2
Rhonel M. Santos, Monitoring and Evaluation, National Economic and Development
Authority, Philippines
Marcelo Silva, ex Coordinador General Técnico, Proyecto (PDCC), Instituto Nacional de
Economía Popular y Solidaria (IEPS), Ecuador
Cesar Francisco Sotomayor Calderón, Viceministro, Viceministerio de Políticas Agrarias,
Ministerio de Agricultura y Riego, Perú
Andinet Tadesse Guangul, Senior Expert Representative, Ministry of Finance and
Economic Cooperation, Ethiopia
Nazaire Thiombiano, Directeur Général de la Coopération a.i. du Ministère de l'Economie,
des Finances et du Développement, Burkina Faso
Adama Toure, Directeur de la formulation des politiques, Burkina Faso
Donalyn U. Minimo, Multilateral Assistance Division, Department of Finance, Philippines
Juan Francisco Valencia, Director Nacional de Seguimiento y Evaluación del
Financiamiento Público, Ministerio de Finanzas, Ecuador
Consuelo Velasco Loza, Dirección Nacional de Seguimiento y Evaluación del
Financiamiento Público, seguimiento a las operaciones, registro y desembolso, Ministerio
de Finanzas, Ecuador
Nguyen Yen Hai, Deputy Director General, Foreign Economic Relations Department,
Ministry of Planning and Investment, Hanoi, Vietnam
De'er Yi, Office of Public Financing Department, Inner Mongolia Autonomous Region,
China
Peng Zhengyuan, Director, IFI Division IV, Department of International Financial
Cooperation, Ministry of Finance, China
Project staff
Samia Akroush, Project Director, Rural Economic Growth and Employment Project
(REGEP), Jordan
Omer Mohammed Awad Elseed, Project Manager, Supporting Small-scale Traditional
Rainfed, Producers in Sinnar State Project(SUSTAIN), Sudan
Lali Durmishidze, Project Manager, Agriculture Modernization, Market Access and
Resilience Project ((AMMAR), Georgia
Mostafa El Sayad, Executive Director, Sustainable Agriculture Investments and
Livelihoods Project (SAIL) , Egypt
Adama Kabore, Coordonnateur du Projet Neer-Tamba, Burkina Faso
Lance Kashugyera, Project Manager, Project for Financial Inclusion in Rural Areas
(PROFIRA), Uganda
Moses Kembe, Programme Coordinator Smallholder Dairy Commercialization Programme
(SDCP), Kenya
Hok Kimthourn, Secretariat Support Team Manager, Agricultural Services Programme for
Innovation, Resilience and Extension (ASPIRE), General Directorate of Agriculture,
Cambodia
Attah- Antwi Kwasi, Coordinator, Rural Enterprises project (REP), Ghana
Meshack Okoth Makongoso, Monitoring and Evaluation Officer, Programme Coordinator
Smallholder Dairy Commercialization Programme (SDCP), Nairobi

Appendix- Annex X EB 2016/119/R.10
153
Appendix
- Annex IV
EC 2
016/9
5/W
.P.2
Ngagne Mbao, Coordinator, Programme d'Appui au Développement Agricole et a
l'Entreprenariat Rural (PADAER), Senegal
Phetvilay Meuanedouang, Programme Advisor/Team Leader, Southern Laos Food and
Nutrition Security and Market Linkages programme (FNML), Department of Planning and
Cooperation , Ministry of Agriculture and Forestry, Laos
Alfred Mutebwa, Program Manager, Project for Rural Income through Exports (PRICE),
Rwanda
Faith Muthoni Livingston, Programme Coordinator, Upper Tana Natural Resources
Management Programme (UTaNRMP), Kenya,
Dixon Ngwende, Project Coordinator, Rural Livelihood and Economic Enhancement
Programme (RLEEP), Malawi
Antonieta Noli Hinostroza, former Coordinator of Sierra Norte Project, Perú
Halil Omanovic, Director, Project Coordinator Unit, Federation of Bosnia and Herzegovina
Herman Ongiko, Undersecretary in Department of Agrarian Reform and Interim, Project
Director for Convergence on Value Chain Enhancement for Rural Growth and
Empowerment (CONVERGE), Philippines
Agustin Perez Andrich, Coordinador Técnico, Programa de Desarrollo Rural Incluyente
(PRODERI), Argentina
Sisovath Phadanouvong, National Programme Coordinator, Strategic Support for Food
Security and Nutrition Programme (SSFSNP), Department of Planning and Cooperation,
Ministry of Agriculture and Forestry, Laos
Sapta Putra Ginting, Project Director, Coastal Community Development Project (CCDP),
Ministry of Marine Affairs and Fisheries, Indonesia
Luis Delfín Saez Guillen, Coordinador, Proyecto Sierra y Selva Alta, Ministerio de
Agricultura y Riego, Perú
Haika Shayo, Coordinator, Rural Micro, Small and Medium Enterprise Support
Programme, Tanzania
Jose Mercedes Sialer Pasco, former Executive Director of Sierra Sur Project and
Executive Director of Aliados Project, Perú
Zenaida M. Silao, Interim Project Coordinator, Fisheries, Coastal Resources and
Livelihood Project (FishCORAL)Philippines
Walter Swai, MIVARF Coordinator, Marketing Infrastructure, Value Addition & Rural
Finance Project, Tanzania
Mohamed Tejan Kella, Coordinator, Rehabilitation and Community- Based Poverty
Reduction Project (RCPRP) and Rural Finance and Community Improvement Programme
(RFCIP), Sierra Leone
Nguyen Truc Son, Project Director, Provincial Project Management Unit Adaptation in the
Mekong Delta in Tra Vinh Province (AMD), Vietnam
Ha Van Hoa, Project Coordinator, Tam Nong Support Project (TNSP), Tuyen Quang
Province, Vietnam
U Kyaw Win, Project Director, Fostering Agricultural Revitalization in Myanmar Project
(FARM), Ministry of Agriculture, Livestock and Irrigation, Myanmar
Ato Markos Wondie, Project Coordinator, Community-based Integrated Natural
Resources Management Project (CBINReMP), Bureau of Agriculture and natural
Resources, Ethiopia
Koudrègma Zongo, Coordonnateur du Projet, Programme d’appui et de Promotion du
Secteur Privé en Milieu Rural (PASPRU), Burkina Faso
Appendix- Annex X EB 2016/119/R.10
154
Appendix
- Annex IV
EC 2
016/9
5/W
.P.2
ADB
Joven Balbosa, Country Officer, Philippine Country Office, ADB
Richard Bolt, Country Director, Philippines Country Office, ADB
Andrew Brubaker, Senior Evaluation Specialist, Independent Evaluation Department,
ADB
Karen Chua, Associate Operations Officer, Southeast Asia Department, ADB
Paul Curry, Principal Operations Coordination Specialist, Pacific Department, ADB
Muhammad Ehsan Khan, Advisor and Head, Unit for Institutional Coordination, Budget,
Personnel, and Management Systems Department, ADB
Jose Orlando Garcia, Unit for Institutional Coordination, Budget, Personnel, and
Management Systems Department, ADB
Gia Hong, Budget and Management Services Division, Budget, Personnel, and
Management Systems Department, ADB
Sirpa Jarvenpaa, Director, Operations Planning and Coordination Division, Strategy and
Policy Department, ADB
Kathie Julian, Advisor, Central and West Asia Department, ADB
Madeleine Maloles, Unit for Institutional Coordination, Budget, Personnel, and
Management Systems Department, ADB
Marzia Mongiorgi-Lorenzo, Unit Head, Project Administration, Environment, Natural
Resources and Agriculture Division, Southeast Asia Department, ADB
Binh T. Nguyen, Senior Evaluation Specialist, Independent Evaluation Department, ADB
Valerie Reppelin-Hill, Director, Strategy, Policy, and Interagency Relations Division, ADB
David Salter, Senior Natural Resources and Agriculture Specialist, Environment, Natural
Resources and Agriculture Division Southeast Asia Department, ADB
Sona Shrestha, Country Specialist, Philippine Country Office, ADB
Akmal Siddiq, Director, Environment, Natural Resources and Agriculture Division, ADB
Edita T. Tayao-Castro, Environment, Natural Resources and Agriculture Division,
Southeast Asia Department, ADB
Kinzang Wangdi, Budget and Management Services Division, Budget, Personnel, and
Management Systems Department, ADB
Nishan Zhang, Advisor and Head, Portfolio, Results, Safeguards and Social Sector Unit,
ADB
Eugenue Zhukov, Director, Budget and Management Services Division, Budget,
Personnel, and Management Systems Department, ADB
UNDP
Jorge Alvarez, UNDP Programme Officer, UNDP Perú
Fermin Bataller, Finance and Procurement, UNDP Philippines
Jesus Capulong, Operations Team Leader, UNDP Philippines
Awa Dabo, Country Director, UNDP Tanzania
Maria del Carmen Sacasa, Coordinadora Residente Naciones Unidas, UNDP Perú
Appendix- Annex X EB 2016/119/R.10
155
Appendix
- Annex IV
EC 2
016/9
5/W
.P.2
Nguyen Tien Phong, Assistant Country Director, Head of Poverty & Social Development
Unit, Vietnam
Titus Osundina, Deputy Country Director, UNDP Tanzania
Edo Stork, Representante Residente Adjunto del PNUD, UNDP Perú
José Herman Wabo, Directeur Adjoint des Opérations du PNUD, Burkina Faso
FAO
Jong Ha Bae, FAO Representative, FAO Vietnam
Jose Luis Fernandez, FAO Representative, FAO Philippines
Bamba Kassoum, Assistant Programme, FAO Burkina Faso
Mamuka Meskhi, Assistant Representative, FAO Georgia
Aristeo A. Portugal, Programme Assistant FAO Representative, FAO Philippines
John Preissing, Country Representative, FAO Peru
World Bank
Nathan M. Belete, Practice Manager, East Asia & Pacific Region, Agriculture, World Bank
Livia Benavides, Country Operations Adviser for Bolivia, Chile, Ecuador, Peru and
Venezuela, World Bank
Sarah Simons, Senior Agriculture Specialist, World Bank Tanzania
Griselle F. Vega, Rural Development Specialist, World Bank Peru
WFP
Jerry Bailey, WFP Deputy Representative, WFP Tanzania
Ai Jichang, Government Partnership Officer, WFP China
Jin Shiyin, Finance Assistant, WFP China
Other Agencies and Private Sector
Javier Ayala, Corporate Lead – Global Inclusive Business Services SNV Netherlands
Development Organisation
Kharmina Anit, Researcher World Agroforestry Centre
Felix Bergel, Director de Recursos Financieros Institucionales Banco de Desarrollo de
América Latina
Arma Bertuso, Senior Research Associate International Potato Institute
Minh Bui Van, Programme Officer SNV Netherlands Development Organisation
Olivier Bürki, Regional Director South Caucasus Counsellor
Santiago Camino, Experto en Desarrollo Rura Ecuador
Per Carstedt, Chief Executive Officer Agro EcoEnergy Tanzania Limited
Hija Choyo, Procurement officer United Nations Volunteers
André Devaux, Representante Regional para América Latina y el Caribe Centro
Internacional de la Papa
Appendix- Annex X EB 2016/119/R.10
156
Appendix
- Annex IV
EC 2
016/9
5/W
.P.2
Issaka Kargougou, Directeur Maison de l'Entreprise du Burkina Faso
Geoffrey Kirenga, Chief Executive Officer Southern Agricultural Growth Corridor of
Tanzania
Digna O. Manzanilla Scientist and Coordinator International Rice Research Institute
Ban Van Minh Minh Be, Agricultural Product Exporting and Processing Company Vietnam
Miguel Ordinola Coordinador de Proyectos LAC en Perú Centro Internacional de la Papa
Oscar Ortiz Director de Investigación y Desarrollo Centro Internacional de la Papa
Eva María Otero Dorado, Responsable de Programas Oficina Técnica de Cooperación
Agencia Española de Cooperación Internacional para el Desarrollo, Ecuador
Sylvestre Ouedraogo Conseiller de TREE AID Burkina Faso
Alberto Paniagua, Director Ejecutivo Fondo de Promoción de las Areas Naturales
Protegidas del Perú
Pedro Riera, Ejecutivo Dirección de Recursos Financieros Institucionales
Ismael T. Sawadogo Directeur Maison de l'Entreprise du Burkina Faso
Beka Tagauri, Head of Program Technical Cooperation
Annette M. Tobias, Assistant Scientist International Rice Research Institute
David Tsiklaurim Region Director Office of Economic Growth USAID Georgia
Nguyen Van Thien Nhat Thien Canna Processing Com