
Presentation Finale
58
Group IV VINASUN’S ENTRY TO CAMBODIA BUSINESS PLAN
Transcript of Presentation Finale

Group IV
VINASUN’S ENTRY TO CAMBODIA
BUSINESS PLAN

1. INTRODUCTION
2. COMPANY
DESCRIPTION
3. MARKET
ANALYSIS
4. MARKETING/
SALES STRATEGY
5. R&D
6. STAFFING
& OPERATIONS
7. FINANCIAL
ANALYSIS
8. SOCIAL
BENEFITS

Part I. Introduction
1.Overview of taxi industry
2.Main objectives 3.Contents
4. Data 5. Limitations 6. Methods

1. Overview of taxi industry
Vietnam’s taxi transportation sector in Ho Chi Minh City has grown at an impressive 16% (CAGR) in terms of cab numbers

• Company profile, external scanning and its market position
• Financial analysis • SWOT analysis • Two potential projects
3. Contents
2. Main objectives
We collect the data from financial statements of Vinasun in the years:
2008, 2009, 2010, 2011 and 2012
4. Data 4. Data

5. Limitations • Some date is difficult to find or count, inadequate and not well-
proportioned.
• Vinasun Corporation also does business on many other sectors
6. Methods • Financial analysis
solvency, stability, liquidity and profitability • SWOT analysis
strengths, weaknesses, opportunities, threats

Part II. Company Description
• Company profile • External scanning

1. Company profile
A. History
• Established in June 15, 1995 • Initial charter capital of 300 million VND • Taxi business into operation since Jan 27, 2003 • One of the 2 leaders in HCMC (50%), Binh Duong
(60%) and Dong Nai (50%) • Officially listed on the Hose in Mar, 2008
Charter capital of VND 170 billion. • Around 2,845 taxi at the end of December 2009
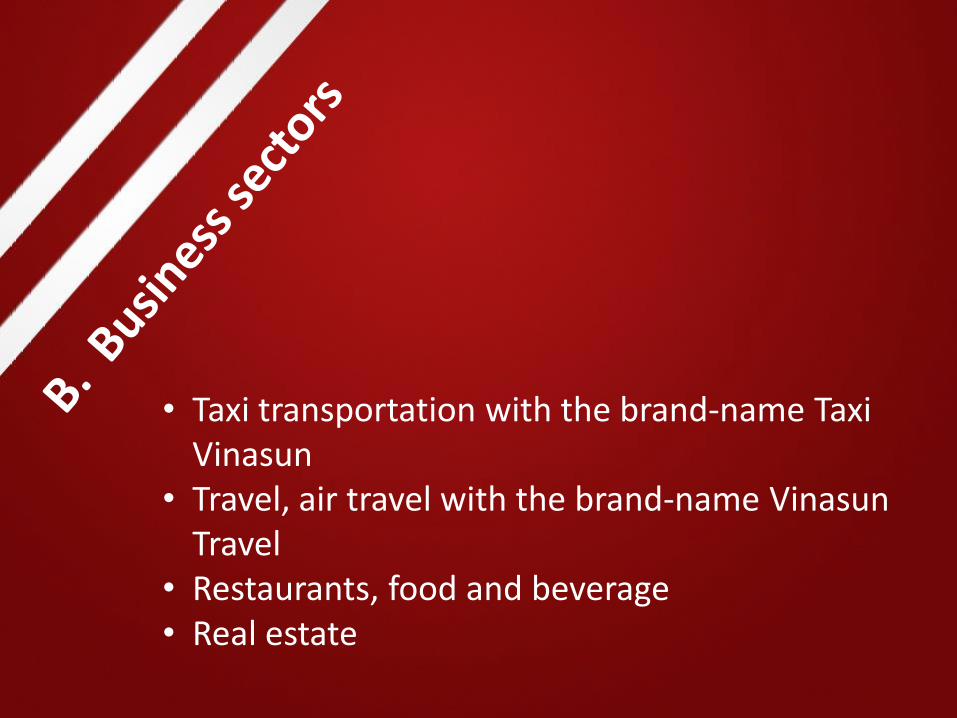
• Taxi transportation with the brand-name Taxi Vinasun
• Travel, air travel with the brand-name Vinasun Travel
• Restaurants, food and beverage • Real estate

2. External scanning
A. HCMC’s Taxi Industry
• 16% CAGR in terms of cab
numbers, from 6,000 in 2005 to 12,550 as of May 2010.
• Expected to maintain an average growth rate of 10% annually 2010 - 2015
In terms of revenue per day,
VND 1.32m per day per
cab, 26% higher than Mai Linh’s VND 1.05m
CAGR Compound Annual
Growth Rate

B. Supply and demand of VN market
Supply In HCMC, taxis are a second means of public transportation after bus. May 2010, 36 enterprises and cooperatives 12,550 registered taxis transporting 400,000 passengers per day. 2,000-3,000 illegal taxis

Generally, Vietnam’s roads are poor. Despite new highway construction, 13.5% of the road network is considered to be in good condition
Demand • rising petrol prices
• unavoidable traffic jams
• environmental pollution

• Solid position in the market: • 42%-market-share position in HCM, • 60% market share in Dong Nai and • 60% market share in Binh Duong • Top two sector players
(Mai Linh taxi is the main competitor of Vinasun) • The company plans to have around 1,000 new cabs per
year for the next three years
C. Market position

D. Major competitors
Over 10,000 registered taxis and around 2,000 unlicensed
ones in HCMC.
VNS has more than 4,000 vehicles, 8000 employees and around 1,500 pick-up points in
Ho Chi Minh City, Binh Duong and Dong Nai

1. Target Market 2. Total Market
Valuation 3. Market Trends
Part III. Market Analysis
4. Profile of Competitors 5. Competitive Advantage 6. Benefits to Clients

1. Target Market

1. Target Market
- Capital city
- Total area: 678.46 km2
- Population: 1,501,725 (2012)
- Density: 2213/km2
- Gender Ratio Male: 47%, Female: 53%
- GDP per capita (PPP): 2400USD (2012)
- Investment ៖ ¾ of industrial investments in the whole country
- Transportation ៖ ¾ of the whole country - Tourism ៖ 950,000 people/year
- Airport: Phnom Penh International Airport

950,000/Year
Market segmentation
The old: over 50 The children: under 18
Adults: 18-50
47%
53%

2. Total Market Valuation
3. Target Company revenue
USD 1,250,000 million per year
Approximately over 2 million people to serve

So
many
But
very
few
4. Market trend

High real income per capita
Large number of tourist annually
An international airport
Taxi is to be more popular in daily life
in Phnom Penh

5. Profile of Competitors
Premium Luxury Taxi 8% Chettra
taxi
(14%) Engligh and Khmer
speaking drivers
Vichet
taxi
(9%) 24 hours service
everyday
35%
Others
Low price, High quality 23%
Standard taxi 14%

6. Competitive Advantage
Reasonable
Competitive
and
Accurately calculated
PRICE
New technologies or systems
Qualified drivers

7. Benefits to Clients

Part IV. Marketing/ Sales strategies
1. Product and marketing strategy
2. Sales and distribution network
3. Pricing 4. Communications

Economic Development
Dominance of Tourism Industry
Faster and more reliable transportation services
Limited routes, slow and inconvenient
buses and tuk-tuks
Product and Marketing Strategies

Priority: International and domestic tourists
• Nearly 1 million foreign visitors/year
• Financially capable
• High demand
Current taxi brands: • Unprofessional • Discourteous
• Premium quality at medium price
• Innovative and forward thinking
• Emphasis on customer service
• Value proposition lies in promptness
Positioning
Target market
Competition

Implementation
• Implement meter system
• Diversify payment methods
• Zoned taxi dispatch system
1. First come/first served system of dispatching
2. Speed up the entire system
• Purchase hot pick-up spots: 1. International airport, hotels, restaurants, bars and tourist
attraction sights
• Training costs reduced through apprenticeship programs
• Monthly inspection of vehicles

Sales and Distribution
Direct • Convenience for customers is the key point • Utilize three more sales channels including online sales via website,
shop-at-home television shows and mail order catalogs
Indirect Sales agents Revenue sharing partners

Pricing Category Quantity Cost/unit Total
Salary
Taxi drivers 50 VND 5 million
Supporting Staff 20 VND 3 million
Administrators 3 VND 3 million
Security 2 VND 2 million
Maintenance & Insurance
VND 100 million
Petrol VND 50 million/
month
Total Investment
VND 50 billion
Cost-plus Pricing

Value-based Pricing
Public Taxi Motorcycle Trailers/Remorks/T
uk-tuks Metered Taxi Unmetered Taxi
Characteristics
Global Taxi, Trans-choice Taxi and Taxi Association offer on-call 24/7 taxi service
and are generally available only on-call
More common are unmarked, unmetered taxis, usually Camry, which can be
arranged through hotels or travel agents
Prices vary depending on the number of passengers and where you pick up the Tuktuk.
Pricing
Starts at 4000 Riel (1 USD) for 2
kilometers. Then 400 Riel (0.1 USD) per 200 meters
Usually cost 25-35 USD per day and
a minimum of 4-5 USD for short trips
Cost around 2-4 USD for short trips and 13-15 USD for the whole day around
the city centre
3000Riel (0.75 USD) for the first 2 kilometers, then 300 Riel (0.075 USD) per 200 meters

Public relations Charity
Employee encouragement Entertainment and social PR
Advertising Newspapers, outdoor banners and
the Internet
Promotion Affiliate marketing
Direct mailings Facebook and TripAdvisor promotion
Offline promotion Personal contact with customers Long-term relationship with firms and companies on regular and low-price basis

Part V. Research and Development
1. Technology Roadmap 2. Research and Development 3. Technical Partners 4. IP, Patents, Copyrights, Brands

• Year 2014: Buying whole new cabs
• Maintenance: Each year
• Repairs: if necessary
• Replacement: Each 5 years if any cars is not up to standard
• Remote instruction and notification: Through switchboard
Technology Roadmap

Research and Development
• Build a customer-care deparment (quality-control) that shall be in direct
contact with customers to solve any complaints, reflections or other
problems.
• Carry out market research by online surveys, direct questionnaires and
interviews each year to know the assessment of customers.
• After 5 operating years, we are to expand our services to rent cars for private
travel

IP, Patents, Copyrights, Brands
Technical Partners Cam Auto Repair - Car Repair and
Maintenance - Garage services
No. 220, St. 122, 12156 Phom Penh,
Cambodia

Part VI. Staffing and Operation
1. Management (including Board) Organization Chart
2. Staffing
1. Training Plans 2. Operations

1. Management (including Board) Organisation Chart
Board of Directors
(Vietnam)
HR
Department
Marketing
Department
Finance Department
Customer Care
Department
General Director
(Cambodia)

2. Staffing
50 Qualified drivers: - English & Khmer speaking
- Male
- Standard driving license
- Morality
- No previous conviction
- Good-looking
- Physically and mentally healthy
20 Officers answering
phonecalls from customers
3 Experienced accountants
2 Marketing
experts

• A short-term English course for Cambodian employees
• Customer relationship: How to treat customers the best
• Problem solving: real-life problems and circumstances and
give instructions
Training Plans One month before launching services on
the market

Operations
• Headquarter: Vietnam
• Office: Phnom Penh,
Cambodia
• Equipment: Metered
cars, telephones,
computers, printers, etc.
• Infrastructure: Office
buildings in Phnom
Penh

Part VII. Financial Analysis

Current financial situation
1. Financial structure: Liability and Equity
2. Liquidity ratios 3. Asset Turn Over
ratios
4. Debt ratios 5. Profitability ratios 6. Market value ratios

1. Debt-to-Equity ratio (H1) Liabilities Equity H1
2008 408,164,216,027 532,683,294,969 0.77
2009 597,556,474,847 712,058,985,725 0.84
2010 906,539,072,128 819,573,429,619 1.11
2011 924,224,759,679 855,867,573,557 1.08
2012 841,833,361,734 936,132,304,116 0.90
2013 858,197,948,769 1,153,446,987,822 0.74
H1 indicates the level of financial autonomy of a firm
0.74 in 2013 represents a decreased dependence on long term debts of Vinasun
healthier financial position lower H1
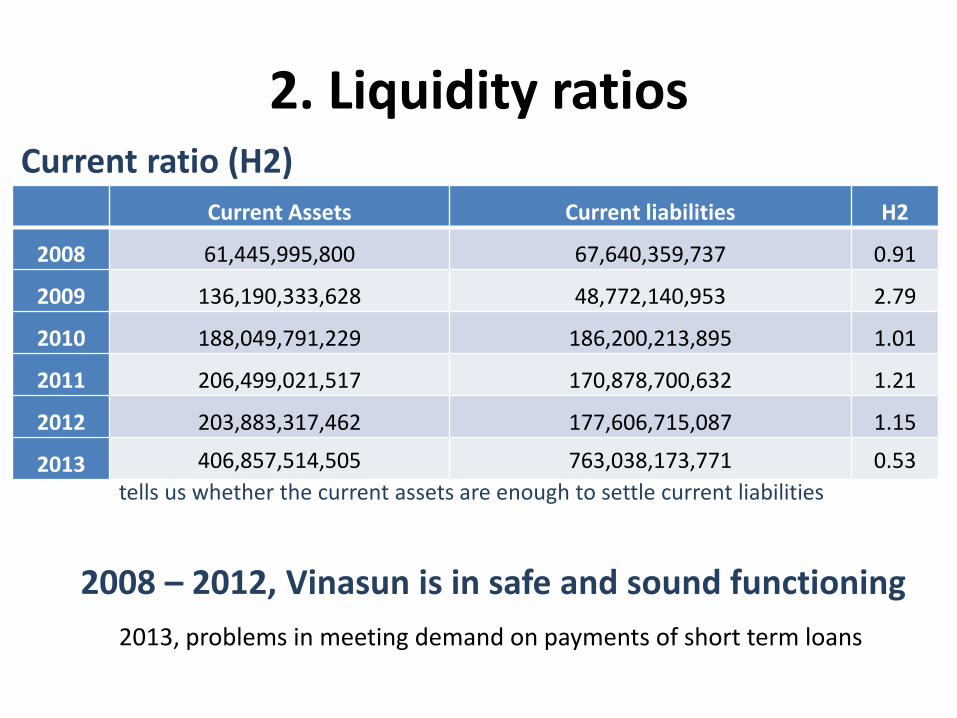
2. Liquidity ratios
tells us whether the current assets are enough to settle current liabilities
Current Assets Current liabilities H2
2008 61,445,995,800 67,640,359,737 0.91
2009 136,190,333,628 48,772,140,953 2.79
2010 188,049,791,229 186,200,213,895 1.01
2011 206,499,021,517 170,878,700,632 1.21
2012 203,883,317,462 177,606,715,087 1.15
2013 406,857,514,505 763,038,173,771 0.53
Current ratio (H2)
2008 – 2012, Vinasun is in safe and sound functioning
2013, problems in meeting demand on payments of short term loans

the approximate amount of time that it takes for a
business to
receive payments
owed, in terms of receivables, from
its customers and clients
A, Average collection period (H3)
3. Asset Turn Over ratios

Account receivable Average sales per day H3
2008 218,324,859,596 5,725,049,577 38.14
2009 3,732,896,540 519,889,752 7.18
2010 347,991,712,382 7,616,069,856 45.70
2011 398,956,980,610 8,448,659,059 47.22
Account receivable Average sales per day H3
2008 17,554,001,550 2,268,930,811 7.737
2009 22,518,738,652 2,927,678,397 7.692
2010 46,227,623,796 4,497,295,174 10.279
2011 49,394,473,998 6,231,035,476 7.927
2012 55,503,477,827 7,433,728,605 7.466
2013 162,963,097,759 8,652,219,178 18.835
Vinasun Corporation
Mai Linh Group
=> Average collection period of Vinasun is relatively low in comparison with Mai Linh

Total Asset Turnover (H4)
Vinasun is generating more and more sales from its assets
0.88 0.82
0.26
1.32 1.52 1.57
0
0.5
1
1.5
2
2008 2009 2010 2011 2012 2013
Total assets turnover
H4

4. Debt ratios
Time interest earned ratio (H5)
EBIT Interest Expense H5
2008 114.640.169.386 36.584.694.169 3,13
2009 180.322.817.526 36.502.111.477 4,94
2010 321.133.080.699 80.383.133.473 4,00
2011 302.729.363.506 124.736.616.068 2,43
2012 316.889.928.463 112.890.048.568 2,81
2013 368,005,756,609 65,959,185,078 5.58
the ratio is always higher than 2.00, which means that the firm’s ability to pay off its cost of capital is very
HIGH
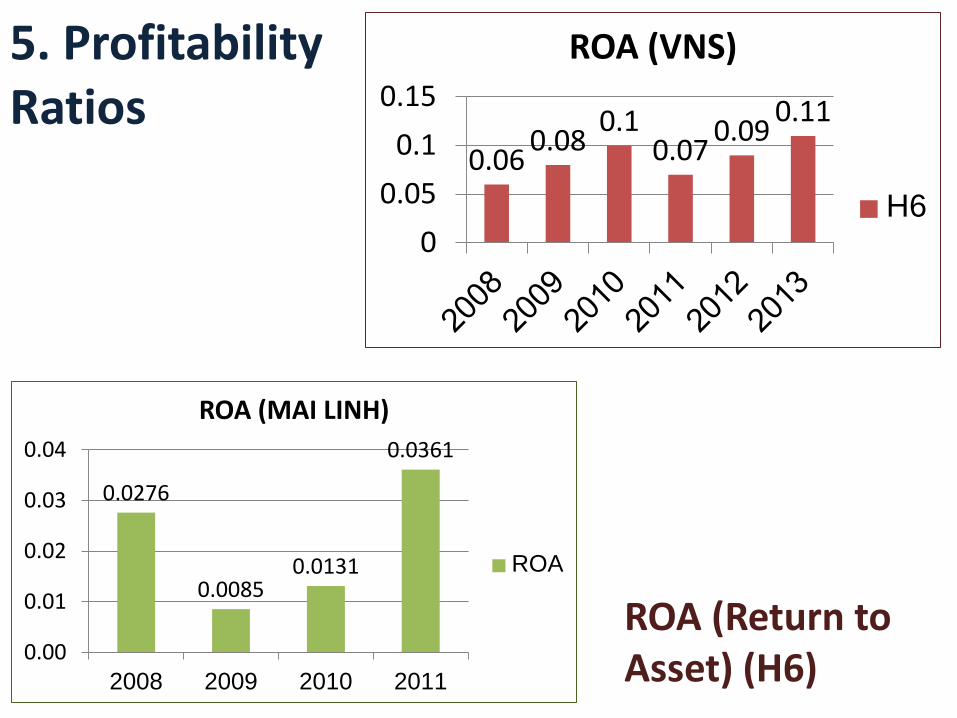
0.06 0.08
0.1 0.07
0.09 0.11
0
0.05
0.1
0.15
ROA (VNS)
H6
0.0276
0.0085 0.0131
0.0361
0.00
0.01
0.02
0.03
0.04
2008 2009 2010 2011
ROA (MAI LINH)
ROA
5. Profitability Ratios
ROA (Return to Asset) (H6)

Earning to Share (H7)
-50.00%
0.00%
50.00%
100.00%
2009 2010 2011 2012 2013
% EPS growth(VNS)
% EPS growth
-63.31%
27.94%
197.32%
-100%
0%
100%
200%
300%
2009 2010 2011
% EPS growth (MAI LINH)
% EPSgrowth

6. Market value ratios
A, P/E ratio (Price to earnings ratio) (H8)
7
5
6.7 5.9
0
2
4
6
8
2009 2010 2011 2012
P/E ratio
P/E ratio
the P/E ratio in 2009 was 7, then fluctuated around 6 for the rest of
time, which is relatively high and generally a good sign for
stock holders, especially when considering the effect of global economic crisis in the present

B, M/B multiples (Market to book ratio) (H9)
0.973536036 1.154455446
1.388985849
0
0.2
0.4
0.6
0.8
1
1.2
1.4
1.6
2009 2010 2011
M/B multiples
M/B multiples
M/B ratio >1, so evaluation process of Vinasun is fairly accurate and updated

Project Cambodia
Assumptions:
The area of Phnom
Penh: 376km2
(ten times smaller than that of
Hanoi (3345 km2)).
50 new cabs

The salvage value : 𝟏
𝟓 of the value of the initial investment
in the tenth year
The estimated revenue in year 1:
VND 25 billion
Working capital: 15 billion VND
Growth rate:
40% in the revenue in the first 3 years

Part VIII. Social Benefits

Access to a variety of community facilities and services
Impulse of the tourism industry

THANK YOU FOR YOUR ATTENTION!
IF YOU HAVE ANY QUESTIONS, PLEASE FEEL FREE TO ASK!