Results Presentation 1Q16
12
-
Upload
tim-ri -
Category
Investor Relations
-
view
10.910 -
download
0
Transcript of Results Presentation 1Q16

2 Results Presentation
Investor Relations
R 000 G 070 B 145
R 235 G 000 B 040
R 000 G 081 B 135
R 000 G 110 B 184
R 000 G 156 B 222
R 244 G 209 B 000
R 243 G 150 B 016
R 231 G 055 B 140
R 220 G 104 B 075
R 158 G 004 B 073
R 197 G 189 B 193
R 116 G 175 B 039
R 000 G 000 B 000
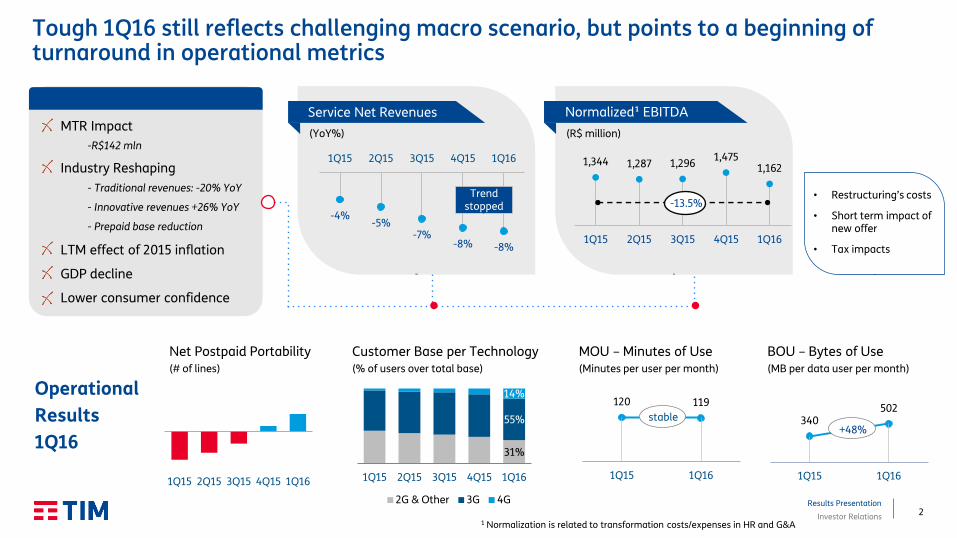
Tough 1Q16 still reflects challenging macro scenario, but points to a beginning of turnaround in operational metrics
Operational
Results
1Q16
Net Postpaid Portability (# of lines)
Customer Base per Technology (% of users over total base)
1 Normalization is related to transformation costs/expenses in HR and G&A
Service Net Revenues
(YoY%) (R$ million)
Normalized¹ EBITDA
MOU – Minutes of Use (Minutes per user per month)
1Q15 2Q15 3Q15 4Q15 1Q16
MTR Impact
-R$142 mln
Industry Reshaping
- Traditional revenues: -20% YoY
- Innovative revenues +26% YoY
- Prepaid base reduction
LTM effect of 2015 inflation
GDP decline
Lower consumer confidence
• Restructuring’s costs
• Short term impact of new offer
• Tax impacts
-4% -5%
-7% -8% -8%
1Q15 2Q15 3Q15 4Q15 1Q16
Trend stopped
1,344 1,287 1,296 1,475
1,162
1Q15 2Q15 3Q15 4Q15 1Q16
-13.5%
BOU – Bytes of Use (MB per data user per month)
120 119
1Q15 1Q16
340 502
1Q15 1Q16
+48% stable
31%
55%
14%
1Q15 2Q15 3Q15 4Q15 1Q16
2G & Other 3G 4G

3 Results Presentation
Investor Relations
R 000 G 070 B 145
R 235 G 000 B 040
R 000 G 081 B 135
R 000 G 110 B 184
R 000 G 156 B 222
R 244 G 209 B 000
R 243 G 150 B 016
R 231 G 055 B 140
R 220 G 104 B 075
R 158 G 004 B 073
R 197 G 189 B 193
R 116 G 175 B 039
R 000 G 000 B 000
Fast reaction in multiple fronts, positioned for recovery path
Keep investment focus
+394 new cities with 4G vs. 1Q15
4G leadership position
Increasing customer base value
Off-net to all plans & focus on
mobile bundle
Defending results from tax impact
Actions to offset
ICMS increase
Workforce Restructuring program
Adapting to market reality
Company repositioning
New brand launch: quality,
innovation, customer experience
~10% of customer base in the new
portfolio
Price repositioning to compensate tax
Rightsizing workforce
On track with Efficiency Plan
> R$ 1 bln in efficiency (2015-17)
~40% of program achieved in 1Q16
New phase launched in 2Q16
Infrastructure Offer Portfolio Efficiency Actions Positioning

4 Results Presentation
Investor Relations
R 000 G 070 B 145
R 235 G 000 B 040
R 000 G 081 B 135
R 000 G 110 B 184
R 000 G 156 B 222
R 244 G 209 B 000
R 243 G 150 B 016
R 231 G 055 B 140
R 220 G 104 B 075
R 158 G 004 B 073
R 197 G 189 B 193
R 116 G 175 B 039
R 000 G 000 B 000
63
439
1,414 1,860
1Q15 1Q16
Infrastructure deployment towards data continues unabated
Coverage
Capacity
Quality
82% of urban
population with 3G
and 60% with 4G
#1 in 4G coverage
89% of total sites
within our own
infrastructure
Continuously
improving network
quality
Sites
Connected
with Fiber
Cities Sites (000)
194 Cities with MBB Project
94%
97%
95%
Feb-15 May-15 Aug-15 Nov-15 Feb-16
90% 97%
80%
Feb-15 May-15 Aug-15 Nov-15 Feb-16
Mobile
Broadband
Instant
Speed1
Mobile
Broadband
Average
Speed2
1 SMP10: Measures connection speed at any given time
above Anatel’s target. Minimum required of 95% of
measurements above target.
2 SMP11: Average connection speed registered within
the month. Required to provide at least 80% of the
contracted speed.
Anatel’s target
+32%
~3,800 ~4,800
1Q15 1Q16
+26%
10.7 12.5
1Q15 1Q16
4G
3G +17%
4G
3G
7x 4.0 8.0
2x
5 Results Presentation
Investor Relations
R 000 G 070 B 145
R 235 G 000 B 040
R 000 G 081 B 135
R 000 G 110 B 184
R 000 G 156 B 222
R 244 G 209 B 000
R 243 G 150 B 016
R 231 G 055 B 140
R 220 G 104 B 075
R 158 G 004 B 073
R 197 G 189 B 193
R 116 G 175 B 039
R 000 G 000 B 000
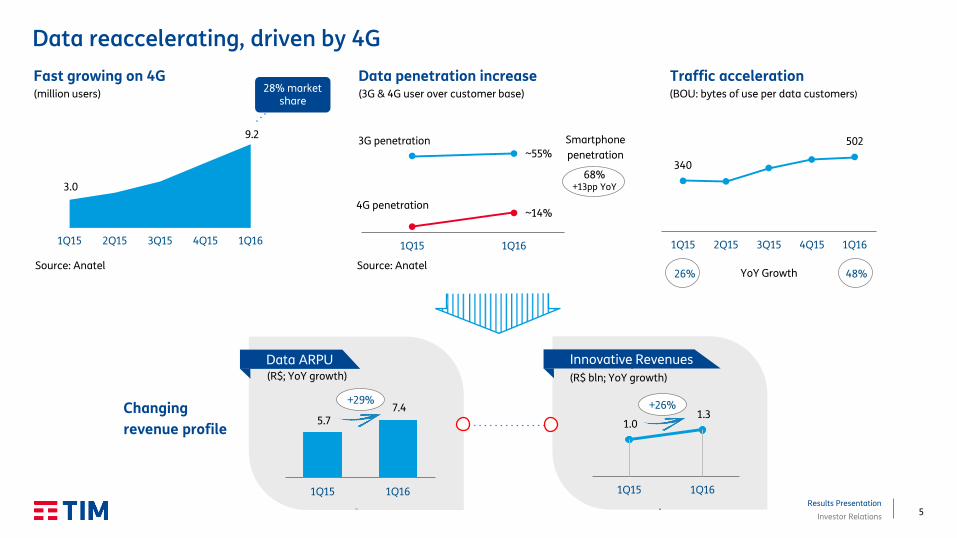
28% market share
Data reaccelerating, driven by 4G
Fast growing on 4G
Changing
revenue profile
Data penetration increase Traffic acceleration (BOU: bytes of use per data customers) (million users)
4G penetration
3G penetration
Innovative Revenues
(R$ bln; YoY growth) (R$; YoY growth)
Source: Anatel
340
502
1Q15 2Q15 3Q15 4Q15 1Q16
26% 48% YoY Growth
(3G & 4G user over customer base)
Source: Anatel
Data ARPU
1.0 1.3
1Q15 1Q16
5.7 7.4
1Q15 1Q16
68% +13pp YoY
Smartphone
penetration
+29% +26%
3.0
9.2
1Q15 2Q15 3Q15 4Q15 1Q16
~55%
~14%
1Q15 1Q16
6 Results Presentation
Investor Relations
R 000 G 070 B 145
R 235 G 000 B 040
R 000 G 081 B 135
R 000 G 110 B 184
R 000 G 156 B 222
R 244 G 209 B 000
R 243 G 150 B 016
R 231 G 055 B 140
R 220 G 104 B 075
R 158 G 004 B 073
R 197 G 189 B 193
R 116 G 175 B 039
R 000 G 000 B 000
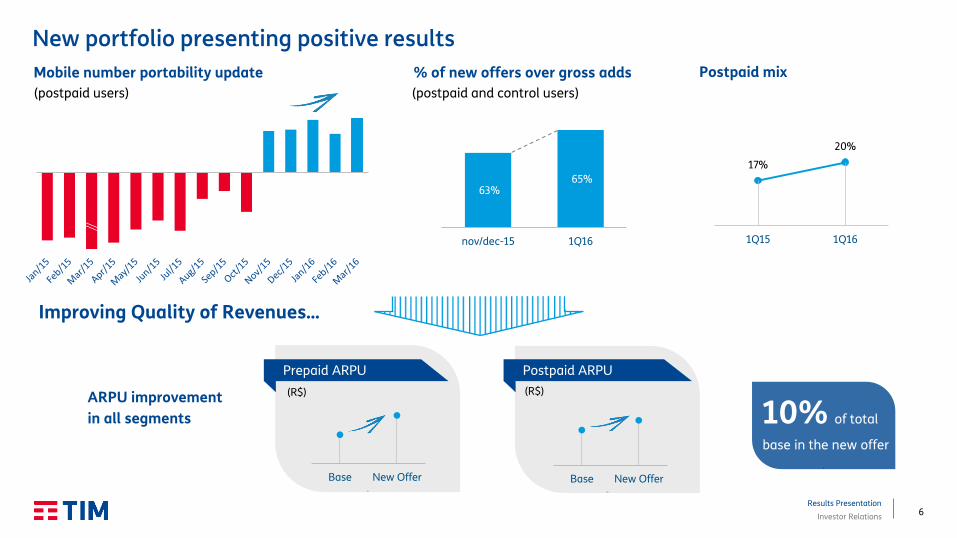
Base New OfferBase New Offer
New portfolio presenting positive results
Mobile number portability update
Improving Quality of Revenues…
ARPU improvement
in all segments 10% of total
base in the new offer
% of new offers over gross adds
Prepaid ARPU Postpaid ARPU
(postpaid users)
(R$) (R$)
17%
20%
1Q15 1Q16
Postpaid mix
63% 65%
nov/dec-15 1Q16
(postpaid and control users)
7 Results Presentation
Investor Relations
R 000 G 070 B 145
R 235 G 000 B 040
R 000 G 081 B 135
R 000 G 110 B 184
R 000 G 156 B 222
R 244 G 209 B 000
R 243 G 150 B 016
R 231 G 055 B 140
R 220 G 104 B 075
R 158 G 004 B 073
R 197 G 189 B 193
R 116 G 175 B 039
R 000 G 000 B 000
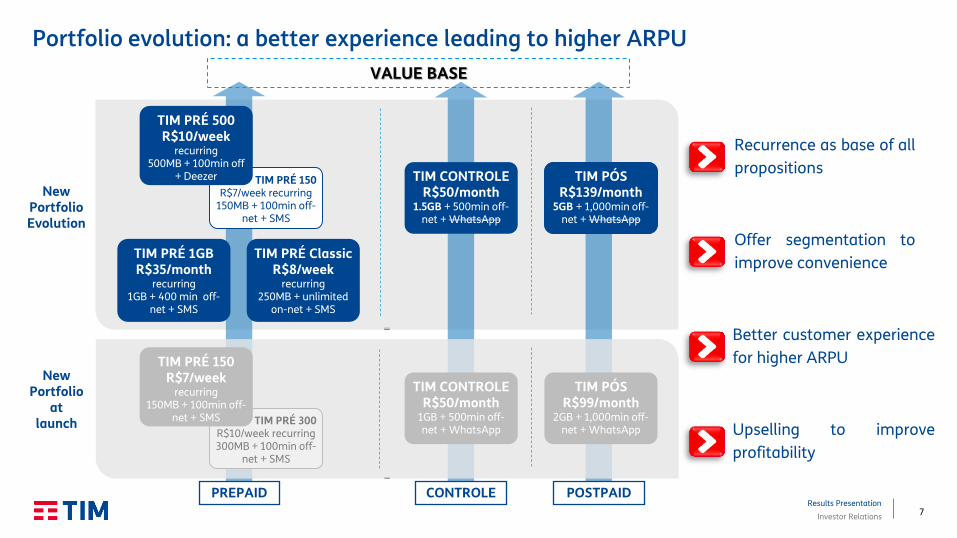
POSTPAID PREPAID
Portfolio evolution: a better experience leading to higher ARPU
TIM PRÉ 150 R$7/week recurring
150MB + 100min off-net + SMS
TIM PRÉ 500 R$10/week
recurring 500MB + 100min off
+ Deezer
TIM PRÉ Classic R$8/week
recurring 250MB + unlimited
on-net + SMS
TIM PRÉ 1GB R$35/month
recurring 1GB + 400 min off-
net + SMS
CONTROLE
TIM CONTROLE R$50/month
1.5GB + 500min off-net + WhatsApp
TIM PÓS R$139/month
5GB + 1,000min off-net + WhatsApp
Recurrence as base of all
propositions
VALUE BASE
Offer segmentation to
improve convenience
Better customer experience
for higher ARPU
New Portfolio Evolution
TIM PRÉ 300 R$10/week recurring 300MB + 100min off-
net + SMS
TIM PRÉ 150 R$7/week
recurring 150MB + 100min off-
net + SMS
TIM CONTROLE R$50/month
1GB + 500min off-net + WhatsApp
TIM PÓS R$99/month
2GB + 1,000min off-net + WhatsApp
New Portfolio
at launch Upselling to improve
profitability
8 Results Presentation
Investor Relations
R 000 G 070 B 145
R 235 G 000 B 040
R 000 G 081 B 135
R 000 G 110 B 184
R 000 G 156 B 222
R 244 G 209 B 000
R 243 G 150 B 016
R 231 G 055 B 140
R 220 G 104 B 075
R 158 G 004 B 073
R 197 G 189 B 193
R 116 G 175 B 039
R 000 G 000 B 000
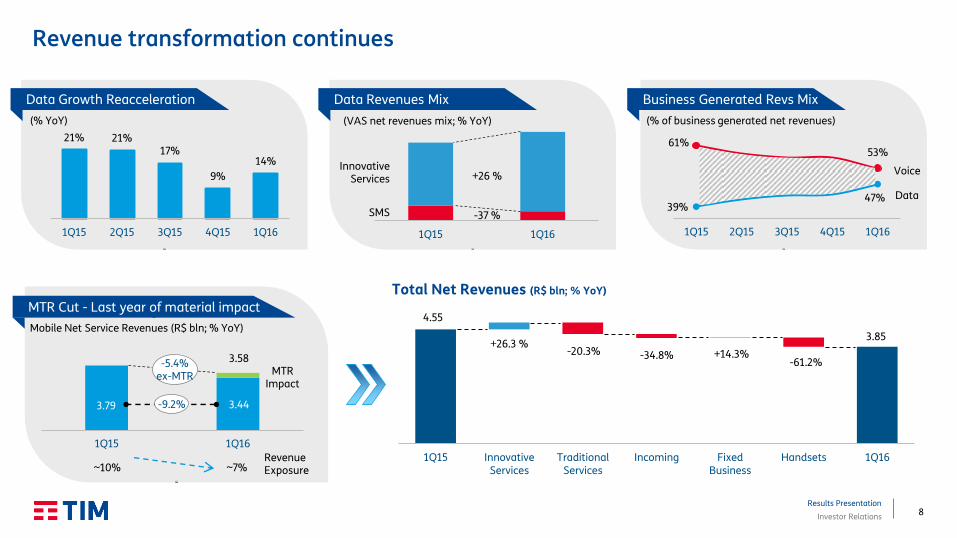
1Q15 1Q16
Revenue transformation continues
Business Generated Revs Mix Data Revenues Mix Data Growth Reacceleration
MTR Cut - Last year of material impact
Total Net Revenues (R$ bln; % YoY)
4.55
3.85 +26.3 %
-20.3% -34.8% +14.3% -61.2%
1Q15 InnovativeServices
TraditionalServices
Incoming FixedBusiness
Handsets 1Q16
21% 21% 17%
9%
14%
1Q15 2Q15 3Q15 4Q15 1Q16
(% YoY)
SMS
Innovative Services +26 %
-37 %
Mobile Net Service Revenues (R$ bln; % YoY)
-5.4% ex-MTR
Revenue Exposure
39% 47%
61% 53%
1Q15 2Q15 3Q15 4Q15 1Q16
Data
MTR Impact
Voice
3.79
3.58
3.44
(% of business generated net revenues)
1Q15 1Q16
-9.2%
(VAS net revenues mix; % YoY)
~7% ~10%
9 Results Presentation
Investor Relations
R 000 G 070 B 145
R 235 G 000 B 040
R 000 G 081 B 135
R 000 G 110 B 184
R 000 G 156 B 222
R 244 G 209 B 000
R 243 G 150 B 016
R 231 G 055 B 140
R 220 G 104 B 075
R 158 G 004 B 073
R 197 G 189 B 193
R 116 G 175 B 039
R 000 G 000 B 000
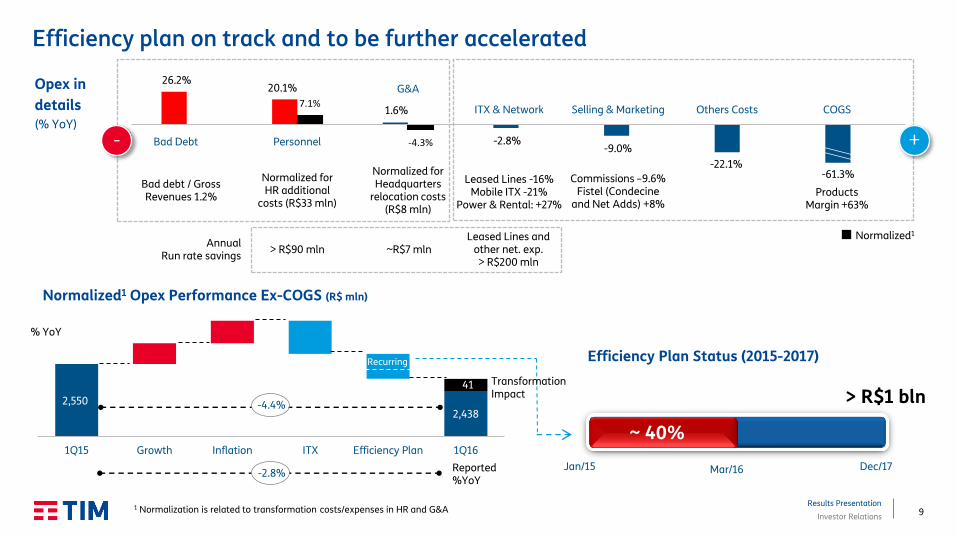
26.2% 20.1%
1.6%
-2.8% -9.0%
-22.1% -61.3%
7.1%
-4.3% Personnel
Efficiency plan on track and to be further accelerated
Normalized1 Opex Performance Ex-COGS (R$ mln)
2,550 2,438
41
1Q15 Growth Inflation ITX Efficiency Plan 1Q16
Efficiency Plan Status (2015-2017)
Jan/15 Dec/17
> R$1 bln
Mar/16
~ 40%
Recurring
% YoY
-4.4%
Reported %YoY
1 Normalization is related to transformation costs/expenses in HR and G&A
-2.8%
Transformation Impact
Normalized for HR additional
costs (R$33 mln)
Opex in
details (% YoY)
Selling & Marketing ITX & Network
G&A
COGS
Bad Debt
Commissions –9.6% Fistel (Condecine
and Net Adds) +8%
Leased Lines -16% Mobile ITX -21%
Power & Rental: +27%
Normalized for Headquarters
relocation costs (R$8 mln)
Products Margin +63%
Bad debt / Gross Revenues 1.2%
Normalized1
-
> R$90 mln Annual
Run rate savings ~R$7 mln
Leased Lines and other net. exp. > R$200 mln
+
Others Costs
10 Results Presentation
Investor Relations
R 000 G 070 B 145
R 235 G 000 B 040
R 000 G 081 B 135
R 000 G 110 B 184
R 000 G 156 B 222
R 244 G 209 B 000
R 243 G 150 B 016
R 231 G 055 B 140
R 220 G 104 B 075
R 158 G 004 B 073
R 197 G 189 B 193
R 116 G 175 B 039
R 000 G 000 B 000
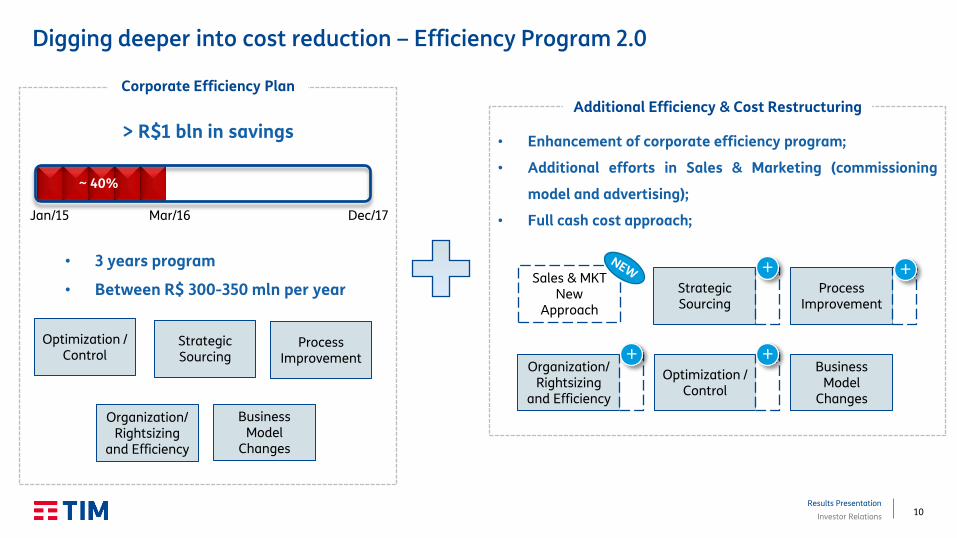
Process Improvement
Digging deeper into cost reduction – Efficiency Program 2.0
Optimization / Control
Strategic Sourcing
Organization/ Rightsizing
and Efficiency
Process Improvement
Business Model
Changes
> R$1 bln in savings
Jan/15 Dec/17
Business Model
Changes
• 3 years program
• Between R$ 300-350 mln per year
Mar/16
Corporate Efficiency Plan
Additional Efficiency & Cost Restructuring
• Enhancement of corporate efficiency program;
• Additional efforts in Sales & Marketing (commissioning
model and advertising);
• Full cash cost approach;
+ Sales & MKT
New Approach
Optimization / Control
+
Strategic Sourcing
+
Organization/ Rightsizing
and Efficiency
+
~ 40%

11 Results Presentation
Investor Relations
R 000 G 070 B 145
R 235 G 000 B 040
R 000 G 081 B 135
R 000 G 110 B 184
R 000 G 156 B 222
R 244 G 209 B 000
R 243 G 150 B 016
R 231 G 055 B 140
R 220 G 104 B 075
R 158 G 004 B 073
R 197 G 189 B 193
R 116 G 175 B 039
R 000 G 000 B 000
1.34
1.12 1.16
-8% -1% +63%
+41 mln
1Q15 ∆ Other OPEX
ProductsMargin
1Q16 Reported TransformationCosts / Expenses
1Q16 Normalized
1Q15 1Q16
317
128
1Q15 1Q16
Defending margin despite tough environment
Net Debt Net Profit
MTR Cut - Last year of material impact EBITDA Evolution (R$ bln; % YoY)
EBITDA Margin
29.1% 29.5%
Normalized1 EBITDA (R$ bln; % YoY)
Normalized¹ EBITDA Exposure
-9.1% ex-MTR
-60%
7.9
3.5
4.4
Debt Cash Net Debt
(R$ bln)
Net Debt / 12M EBITDA: 0.54x
MTR Impact
1.34 1.16
1.22
1 Normalization is related to transformation costs/expenses in HR and G&A
(R$ mln)
Voice & Data Contribution Margin
Impact of off-net offers, investment
for repositioning & future growth
-13.5%
30.2%
-16.6%
-13.5%
1 ~14% ~8%
12 Results Presentation
Investor Relations
R 000 G 070 B 145
R 235 G 000 B 040
R 000 G 081 B 135
R 000 G 110 B 184
R 000 G 156 B 222
R 244 G 209 B 000
R 243 G 150 B 016
R 231 G 055 B 140
R 220 G 104 B 075
R 158 G 004 B 073
R 197 G 189 B 193
R 116 G 175 B 039
R 000 G 000 B 000
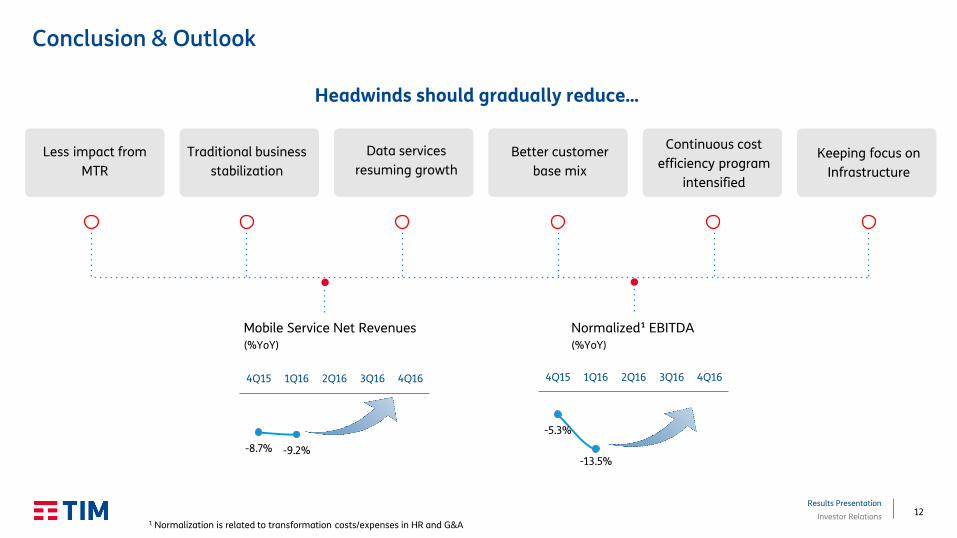
Conclusion & Outlook
Less impact from
MTR
-8.7% -9.2%
4Q15 1Q16 2Q16 3Q16 4Q16
-5.3%
-13.5%
4Q15 1Q16 2Q16 3Q16 4Q16
Mobile Service Net Revenues (%YoY)
Normalized¹ EBITDA (%YoY)
1 Normalization is related to transformation costs/expenses in HR and G&A
Headwinds should gradually reduce…
Traditional business
stabilization
Data services
resuming growth
Better customer
base mix
Continuous cost
efficiency program
intensified
Keeping focus on
Infrastructure