SUSCEPTIBILIDAD GENÉTICA A LA OBESIDAD · KEL LDLR 255 Mb Obq2 ACP1 APO B GCKR POMC PRKAR2 UCP2/3...
123
SUSCEPTIBILIDAD GENÉTICA A LA OBESIDAD Prof. J. Alfredo Martínez
Transcript of SUSCEPTIBILIDAD GENÉTICA A LA OBESIDAD · KEL LDLR 255 Mb Obq2 ACP1 APO B GCKR POMC PRKAR2 UCP2/3...

SUSCEPTIBILIDAD GENÉTICA
A LA OBESIDAD
Prof. J. Alfredo Martínez

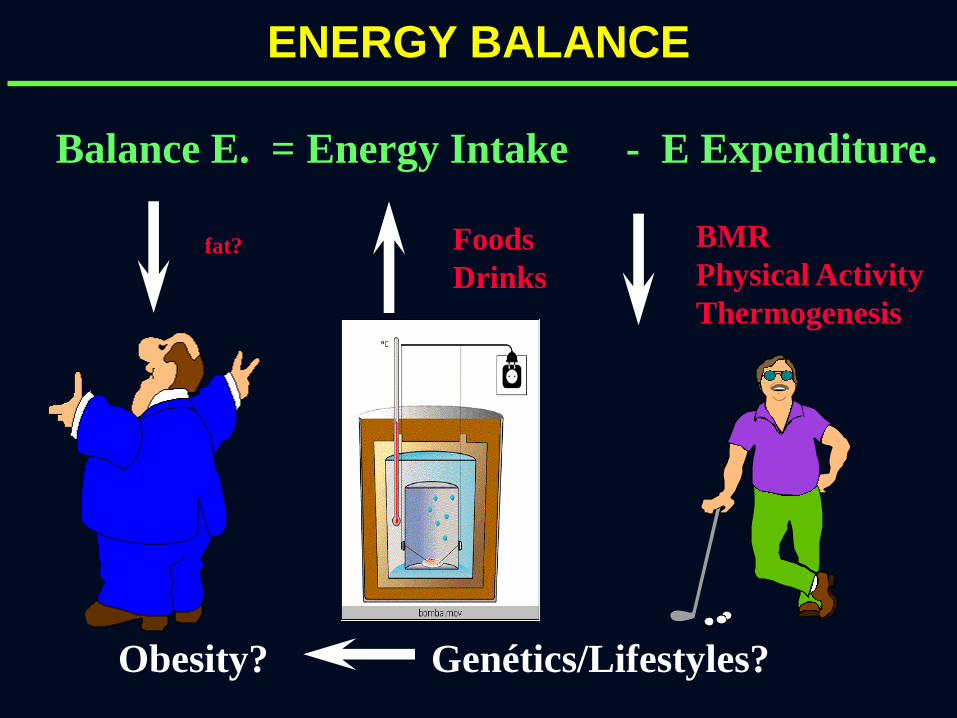
BMR
Physical Activity
Thermogenesis
ENERGY BALANCE
Balance E. = Energy Intake - E Expenditure.
Foods
Drinks fat?
Obesity? Genétics/Lifestyles?

INTAKE NEEDS
Energy Balance
Efferent Signals Afferent Signals
CNS
Neuropeptides
Genétics / habits / neuroendocrine status
mins VITs R
estr
uctu
re

Genética
Introducción
EXCESO DE GRASA
CORPORAL
OBESIDAD
DEFINICIÓN DE OBESIDAD
Fact. ambientales
Estilo de vida
+ + +
INGESTA
ENERGÉTICA GASTO
ENERGÉTICO
Fact.
neuroendocrinos
- -
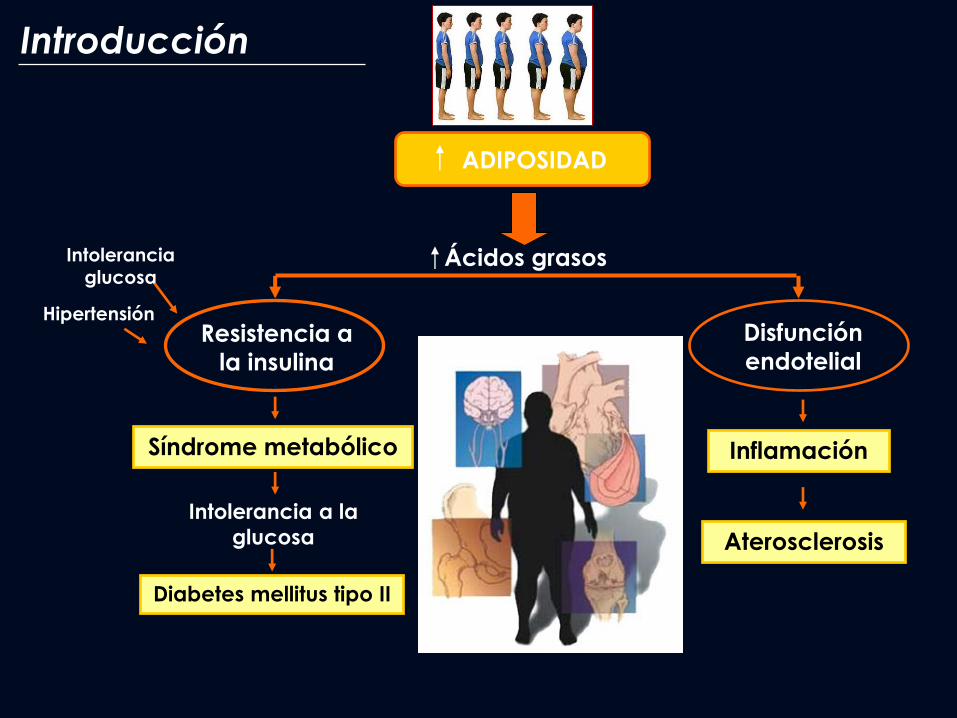
ADIPOSIDAD
Ácidos grasos
Síndrome metabólico
Intolerancia a la
glucosa
Diabetes mellitus tipo II
Inflamación
Hipertensión
Intolerancia glucosa
Aterosclerosis
Resistencia a
la insulina
Disfunción
endotelial
Introducción

DNA RNA PROTEINS
Transcription Translation
Gene Expression= f(DNA Environmental factors)
GENOTYPE PHENOTYPE

Regulatory Elements Estructural Functions
Proteíns
NUTRIENTS FUNCTIONS
Energy
Nutrients

GENE EXPRESSION NUTRITIONAL CONTROL
Fatty Acids
Retinoids
Vitamin D
Glucose
Energy
Transcriptión mRNA DNA Proteíns Translation
Amino ácids
Iron
Selenium
Postranslation
Minerals
Vitamins

GENE EXPRESSION CONTROL: MECHANISMS
Cascade
Kinases
Mechanisms : - Receptors (membrane/nucleus)
Nutrients
Nutrients
Nutrients &
Metabolites
- Metabolism intermediate
FT
- Transcription Factors (FT): affinity & concentrations
RE

Mendelian Syndromes
• Autosomal dominant
• Autosómico recessive
•X-linked
Animal models
•Genetically obese animals
•Transgénic Animals
• Q Trait Loci (QTL)
Association and Linkage Studies
• Candidate genes
• Family segregatiobn
GENE OBESITY RESEARCH

GENETIC LINKAGE
Phenotype
Framingham Canada Norway
BMI BMI/Skinfolds BMI
n r2
n r2
n r2
Spouses 1163 0,19 3138 0,12 23936 0,12
Parent/child 4027 0,23 7194 0,20 43586 0,20
Sibblings 992 0,28 3924 0,34 19157 0,24

MENDELIAN SYNDROMES
MIM number Disorder Locus
Autosomal Dominant
100800 Achondroplasia (ACH) 4p16.3
122000 Posterior Polymorphous Corneal Dystrophy (PPCD) 20q11
176270 Prader-Willi Syndrome (PWS) 15q11.2-q12
181450 Schinzel syndrome/Ulnar-mammary syndrome (UMS) 12q23-q24.1
Autosomal Recessive
Bardet-Biedl Syndrome (BBS)
209901 BBS1 11q13
209900 BBS2 16q21
600151 BBS3 3p13-p12
600374 BBS4 15q22.3-q23
216550 Cohen Syndrome (CHS1)
X-LINKED
301900 Borjeson-Forssman-Lehman Syndrome (BFLS) Xq26-q27
303110 Choroideremia with deafness and obesity Xq21
309585 Wilson-Turner Syndrome (WTS) Xq21.1-q22
312870 Simpson-Golabi-Behmel (SGBS) Xq26

PERSONALIZED NUTRITION ? YES, PLEASE
Genetic make-up can determine
unique nutritional requirements
and responses to different
foods.and nutrients
Based on:
- The sequencing of the human genome,
- subsequent analyses of human genetic variation,
-studies that associate gene variants with disease markers
-Impact of nutrition/nutrients on gene expression
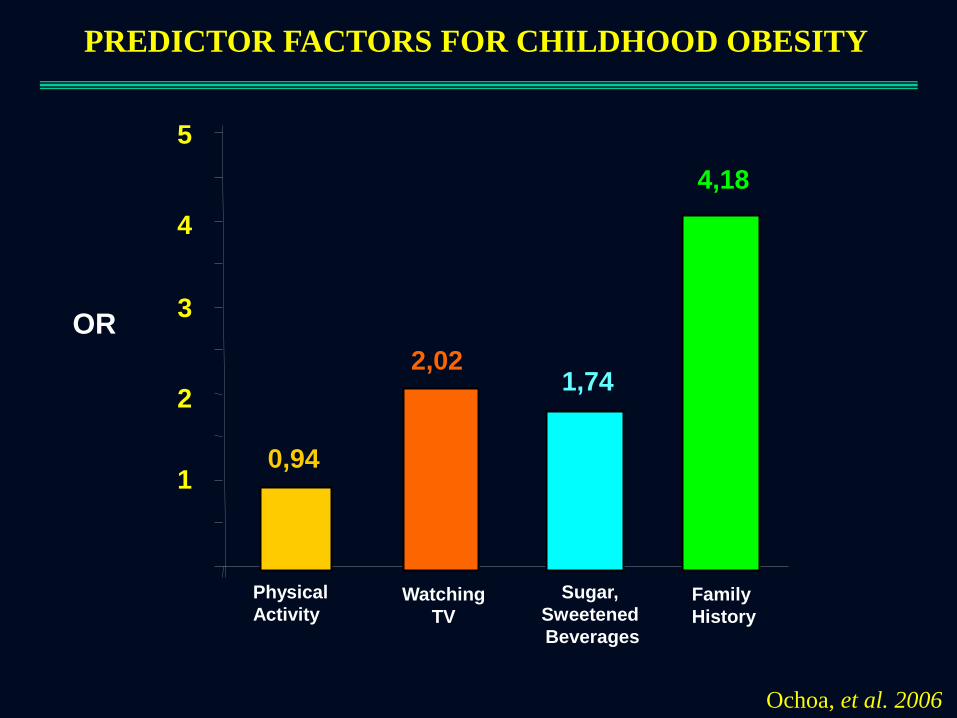
PREDICTOR FACTORS FOR CHILDHOOD OBESITY
Ochoa, et al. 2006
0,94
1,74
OR
2,02
Physical
Activity
Sugar,
Sweetened
Beverages
Watching
TV
Family
History
4,18
1
3
4
2
5

Trp64Arg MUTATION OF THE 3
ADRENOCEPTOR
0,83
0,84
0,85
0,86
0,87
0,88
0,89
0,9
0,91
0,92
Un
its
CORBALAN, et al. 2000
0,86
0,90
C.R.
0,87
0,91
TT (-) TA+AA (+)
C/C
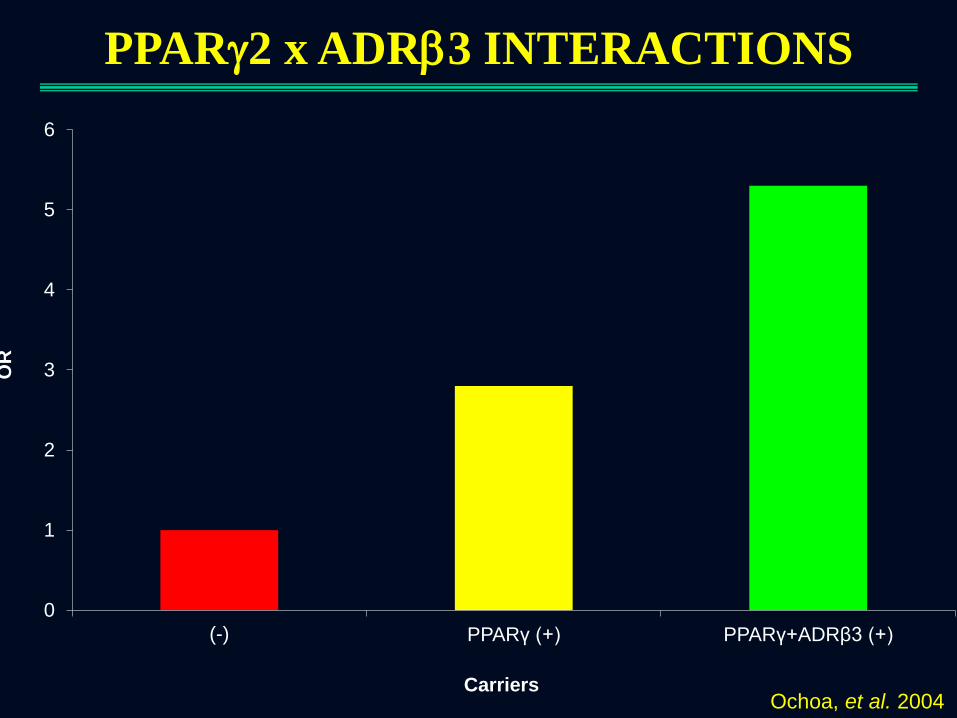
PPARg2 x ADR3 INTERACTIONS
0
1
2
3
4
5
6
(-) PPARү (+) PPARү+ADRβ3 (+)
OR
Carriers Ochoa, et al. 2004

Data acquisition
OMICS & GWAS
Sequentiation microarrays


Nontransmissible
Genetic
Cultural
transmission
Genotype Phenotype (Obesity)
Nontransmissible
Cultural
transmission Genetic
45%
Nontransmissible
30% Cultural
transmission
25% Genetic

Nutrition
P. Activity
Hormones
Nervous System
Homeostasis
Environment
GENETICS
HOMEOSTASIS: CAUSAL INTERACTIONS

• ADIPOGENESIS: PPAR, C/EBP5, PKA, AP2,, RXR,...
• THERMOGENESIS: 3AR, 2AR, UCPS,...
• APPETITE: NPY, LEP, CCK, MC4R, POMC, OREX,..
•OTHERS:. FTO, IL6
METABOLISM RELATED GENES
Do1
LEPR
HS
3B1
ATP1A2
D1S202
Nidd/gk6
1 4 6 7 8
155 Mb
bw/gk1 Mob-4
CHS1
ADRB3
LPL
Do6
9 10 11
UMS
12
ESD
2 3 5
236 Mb
PigQTL
ACH
UCP 1
Do6
CPE
203 Mb 183 Mb
TNFir24
Do2
GLO1
Obq2
171Mb
Mob-2 LEP
Do3
145 Mb 144 Mb
Mob-1
Niddm1
APOA4
Nidd/gk5
144 Mb
DRD2
BBS1
SURTUB
Mob-1
Obq1 D11S419
143 Mb
Weight 1
85Mb
114 Mb
13 18
109 Mb
14
Mob-3
Mob-1
98 Mb
BBS4
16 17
92 Mb
Niddm3
19
67 Mb
Do6
Obq1
20
72 Mb
PPCD
Mob-5 ADA
ASIP
21
50 Mb
22
56 Mb
P1 bw/gk1
28 Mb
Y Bw2
Choroideremia
WTS
SGBS
BFLS
X
164 Mb
Bw3
Bw1
KEL
LDLR
255 Mb
Obq2
ACP1
APO B
GCKR
POMC
PRKAR2 UCP2/3
MC4/5R
106 Mb
15
Do2
PWS
BBS4
LIPC
214 Mb
Nidd/gk1
BBS3
APOD
PPAR
194 Mb
GRL
Mob-4
PC1
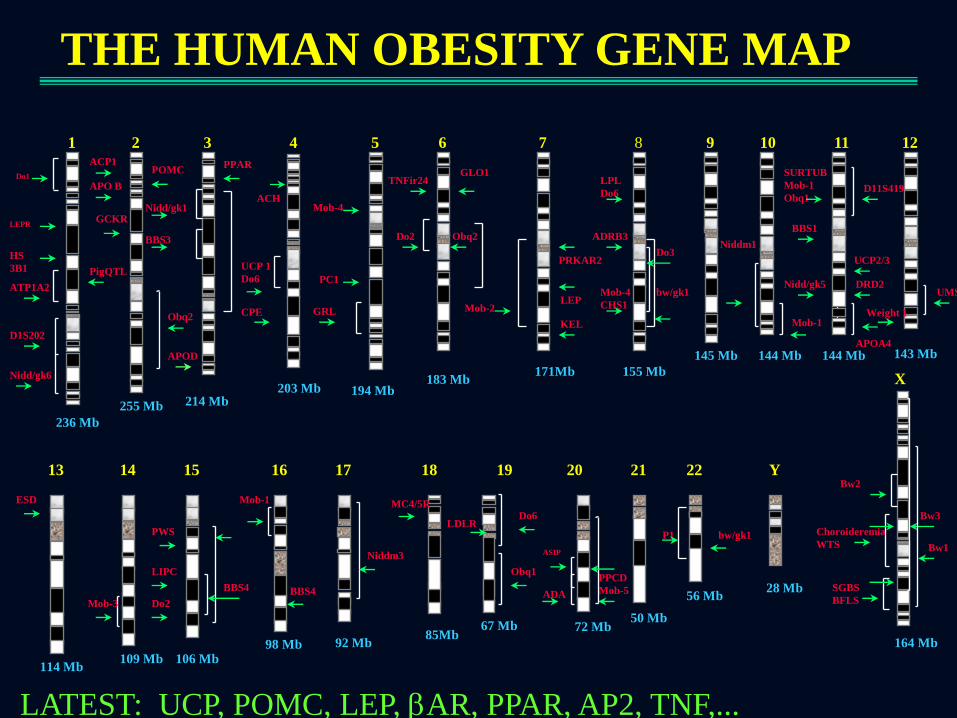
LATEST: UCP, POMC, LEP, AR, PPAR, AP2, TNF,...
THE HUMAN OBESITY GENE MAP

TOOLS: Microchip Scanning Macronutrient Metabolism
Fold Code Name
~49.2 D45862 Leptin, ob
15.7 J02773 Low molecular weight FABP
7.3 J00713 Carboxypeptidase-a- 5 ~6.7 U64451 Short-branched chain acyl-CoA DH precursor ~4.9 AF063302 Carnitine palmitoyltransferase I beta
~4.6 AF034577 Pyruvate dehydrogenase kinase isoenzyme 4 4.1 M95591 Squalene synthetase 3.3 S69874 Fatty acid-binding protein (FABP) 3.2 K03249 Enoyl-CoA-hydratase-3-hydroxyacyl-CoA DH 3 AB002558 Glycerol 3-phosphate dehydrogenase 2.9 AB005743 Fatty acid transporter 2.8 L07114 Apolipoprotein B 2.5 U20643 Aldolase A
2.5 M26594 Malic enzyme 2.4 M60322 Aldose reductase 2.2 S56481 Beta 3-adrenergic receptor 2.2 S81497 Lysosomal acid lipase 2.2 J02585 Liver stearyl-CoA desaturase 2.2 X15580 6-phosphofructo-2-kinase/fructose-2,6-bisphosphatase 2.2 L12016 Tricarboxylate transport protein 2.2 U32314 Pyruvate carboxylase
2.2 D10354 Alanine aminotransferase
2.2 L25331 Lysyl hydroxylase 2.1 D43623 Carnitine palmitoyltransferase I like protein 2 D10655 Dihydrolipoamide acetyltransferase
2 AF035943 Uncoupling protein-3
Transcription factor
3.7 AB015724 Nuclear receptor binding factor-1
2.8 X12752 DNA binding protein C/EBP 2.5 S77528 C/EBP-related transcription factor 2.1 AB011365 PPAR-gamma protein 2 AF022081 Small nuclear RING finger protein 2 X13167 NF-1 like DNA-binding protein
Hormone receptor and signal transduction
~10.7 M96159 Adenylyl cyclase type V
4 S79241 Oxytocin receptor 3.6 U93880 Insulin receptor substrate-3 (IRS-3) 3 K03045 Retinol-binding protein (RBP) 2.9 D38036 Truncated TSH receptor 2.9 Z83757 Growth hormone receptor
2 X92069 P2X5 receptor (ATP-gated ion channels) 2.8 E12286 GM2 activator protein
2.7 X17053 Immediate-early serum-responsive JE
2.6 S74351 Protein tyrosine phosphatase 2.6 X06107 Insulin-like growth factor I 2.5 M64300 Signal-related kinase (ERK2) 2.4 D85183 SHPS-1 (protein tyrosine phosphatase)
2.4 L13619 Insulin-induced growth-respons protein 2.4 L35767 Very low density lipoprotein receptor, 2.3 S49003 Short isoform growth hormone receptor
2.3 D85435 Protein kinase C delta-bindig protein 2.2 D89655 Scavenger receptor class B
2.2 U21101 Cyclic GMP stimulated phosphodiesterase 2.2 J03819 Thyroid (T3) hormone receptor 2 AF022952 Vascular endothelial growth factor B 2 S50461 Signal-transducing G protein alpha 12 subunit 2 L25633 Neuroendocrine-specific protein 2 M12492 Type II cAMP-dependent PK regulatory subunit
Cellular cytoskeleton
~4.9 K00512 Myelin basic protein
~4.0 AF004811 Moesin 3.5 X60351 Alpha B-crystallin
3.1 AF041373 Clathrin assembly protein short form 2.7 U50717 Synaptic density protein PSD-93 2.5 M83196 Microtubule-associated protein 1A
corresponds to a transcript absent in the control group (basal line).
Macronutrient Metabolism
Fold Code Name
-22.5 AF001898 Aldehyde dehydrogenase (ALDH)
-22.1 AB009999 CDP-diacylglycerol synthase
~-20.0 AB017260 High-affinity carnitine transporter -19.0 D37920 Squalene epoxidase
-9.1 L25387 Phosphofructokinase C
~-6.4 AB010428 Acyl-CoA hydrolase
-6.0 S68135 GLUT1
-3.8 M18467 Aspartate aminotransferase
-2.9 AF080468 Glycogen storage disease type 1b protein
-2.8 S49760 Diacylglycerol kinase
-2.6 X04979 Apolipoprotein E
-2.4 M93297 Ornithine aminotransferase
-2.2 L07736 Carnitine palmitoyl-transferase I
Redox and stress proteins
-7.8-34.1 S82820 Glutathione S-transferase Yc2 subunit -4.8-6.2 X62660 Glutathione S-transferase subunit 8
-4.2 M11794 Metallothionein-2 and metallothionein-1
-2.6-3.2 X02904 Glutathione S-transferase P subunit
Transcription factor
-25.2 U78102 Krox20 ó EGR-2(early growth response protein 2)
-5.2 X94246 Pax-8 protein
-2.7 M91802 Homeobox protein (Hox 1.11)
Hormone and signal transduction
-117.5 S49491 Proenkephalin ~-92.3 J04488 Prostaglandin D synthetase
~-47.3 D63772 Neuronal high affinity glutamate transporter
~-8.6 M12450 Vitamin D binding protein
-4.1 U57715 FGF receptor activating protein FRAG1
-2.8 U48596 MAP kinase kinase kinase 1 (MEKK1)
-2.3 L06096 Inositol trisphosphate receptor subtype 3 (IP3R-3)
-2.3 U53184 Estrogen-responsive uterine -2.3 X59132 Secretin receptor
-2.2 D64045 Phosphatidylinositol 3-kinase p85 alpha subunit
-2.1 AF014009 Acidic calcium-independent phospholipase A2
-2 M91599 Fibroblast growth factor receptor subtype 4
Cellular cytoskeleton
~-21.4 X81448 Keratin 18
~-12.2 M93638 Keratin 5
~-6.6 AF013247 Beta-A4 crystallin
~-3.8 M59936 Connexin-31
-3.2 X67788 Ezrin p81
-2.3 X81449 Keratin 19
corresponds to a transcript absent in the obese group (basal line).
+ -


NUTRIGENOMICS: Personalized nutrition based on genotype.
?
Nutrigenomics is the study of molecular relationships between nutrition and the response
of genes, with the aim of extrapolating how such subtle changes can affect human health .

GENOTYPE & NUTRITION INTERACTIONS
Phenotype GENE
Expression Nutrition

0
0,5
1
1,5
2
2,5
3
Re
lati
ve
Un
its
UCP3
Control (30 d)
Cafetería (30 d)
**
PPARg2
**
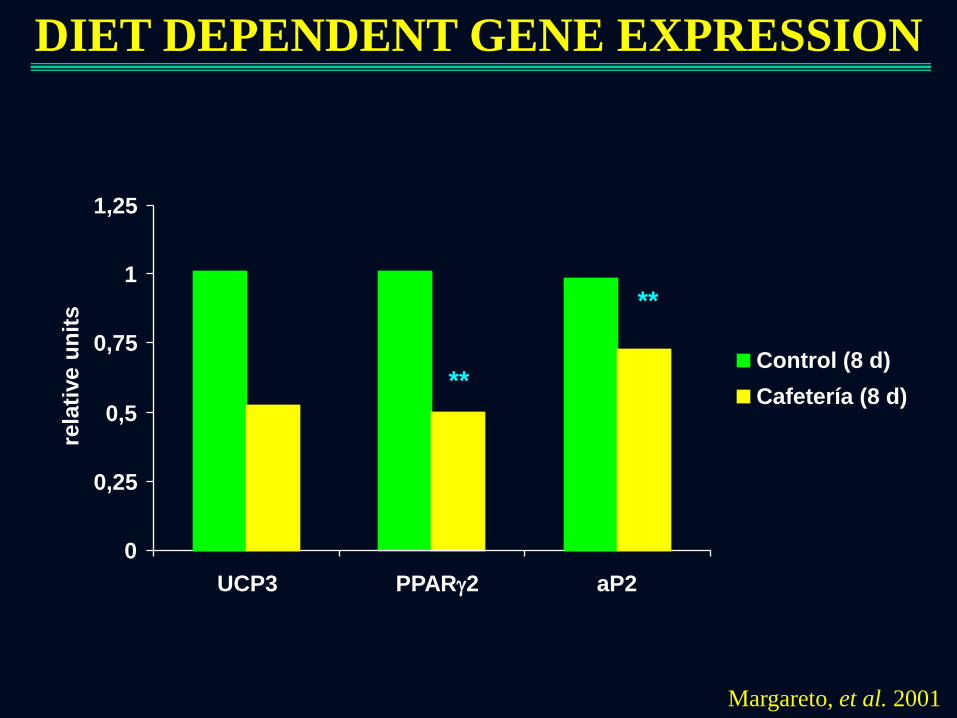
DIET DEPENDENT GENE EXPRESSION
aP2
Margareto, et al. 2001
**
PPARg2
0
0,25
0,5
0,75
1
1,25
rela
tive
un
its
UCP3
Control (8 d)
Cafetería (8 d)
DIET DEPENDENT GENE EXPRESSION
aP2
**
Margareto, et al. 2001
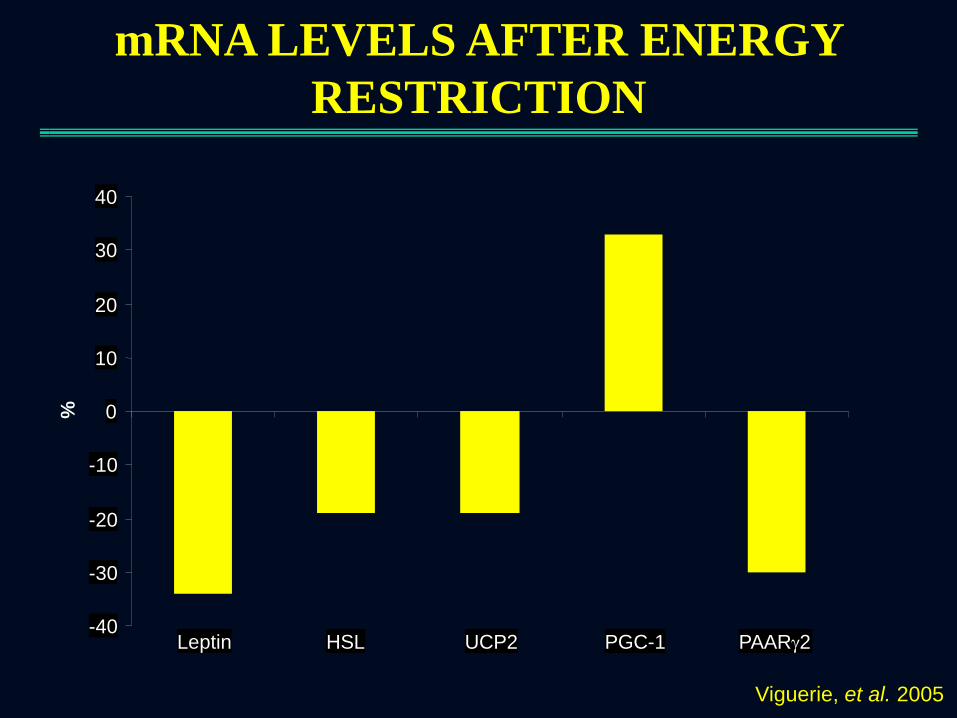
mRNA LEVELS AFTER ENERGY
RESTRICTION
-40
-30
-20
-10
0
10
20
30
40
Leptin HSL UCP2 PGC-1 PAARg2
%
Viguerie, et al. 2005

FAT INTAKE AND mRNA LEVELS AFTER
ENERGY RESTRICTION
Viguerie, et al. 2005
-40
-30
-20
-10
0
10
20
30
40
% high-fat
low-fat
Leptin HSL UCP2 PGC-1 PAARg2


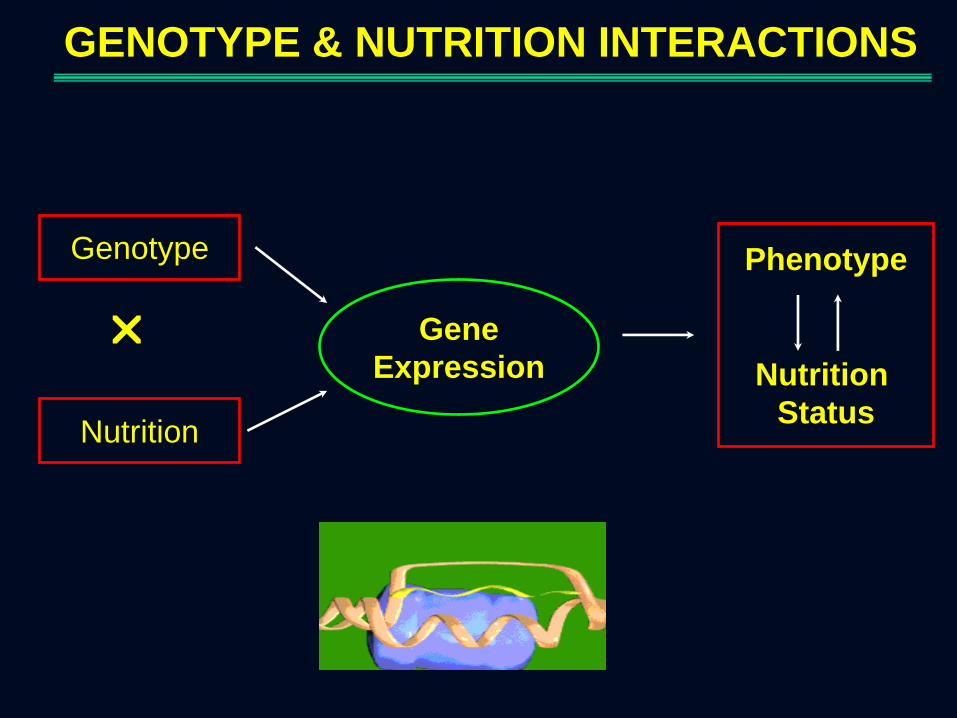
Genotype
Nutrition
Gene
Expression
GENOTYPE & NUTRITION INTERACTIONS
Phenotype
Nutrition
Status

BMI, FAT INTAKE AND GENOTYPE
INTERACTIONS
-2.5
-1.5
-0.5
0.5
1.5
2.5
3.5
4.5
5.5
6.5
7.5
<2,1 2.3 2.6 2.9 3.1 3.3 3.6 3.9 4.2 >4,2
Ch
an
ge
s in
BM
I
Fat intake (MJ)
Ow/Op Ow=overweight at baseline Ow/Np Nw=normal weight at baseline
Nw/Op Op=obese parents Nw/Np Np=normal weight parents
SORENSEN, et al. 1997
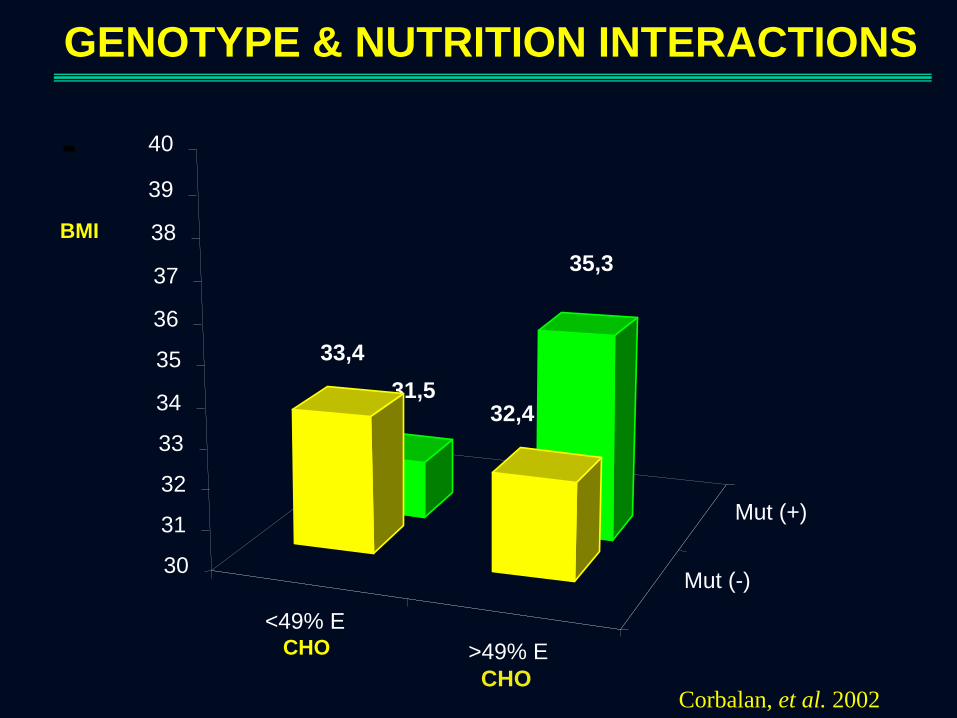
GENOTYPE & NUTRITION INTERACTIONS
Corbalan, et al. 2002
30
31
32
33
34
35
36
37
38
39
40
<49% E CHO >49% E
CHO
Mut (-)
Mut (+)
BMI
31,5
35,3
33,4
32,4

1 2 3 4 5
Energy Derived from fat (Quintiles)
0
1
2
3
4
5
6
Od
ds
Rati
o
GENOTYPE X NUTRIENT (FAT) INTERACTIONS
Memisoglu, et al. 2003
Non carriers
Carriers (Pro12Ala)
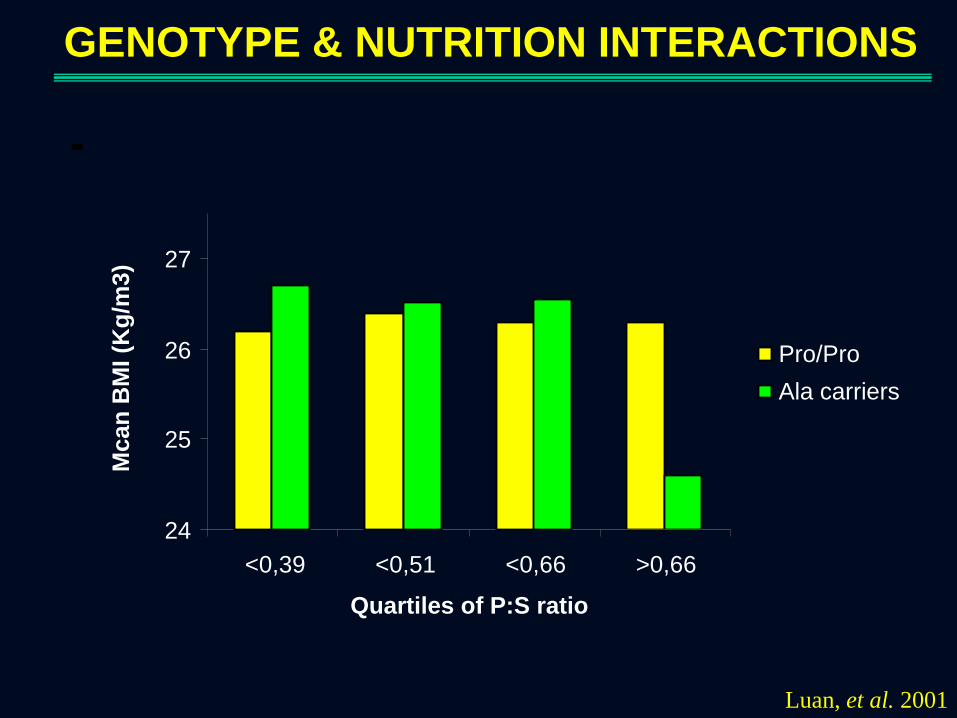
Luan, et al. 2001
>0,66
24
25
26
27
Mcan
BM
I (K
g/m
3)
<0,39 <0,51 <0,66
Quartiles of P:S ratio
Pro/Pro
Ala carriers
GENOTYPE & NUTRITION INTERACTIONS

APPROACHES AGAINST OBESITY
Nutritional and Diet Theraphy
Drugs Treatments
Physical Activity Programmes
Bariatric Surgery
Others: Personalized.........
....................................Nutrition

POLYMORPHISM IN THE APOLIPOPROTEIN A5 GENE
Aberle, et al. 2005
BMI
(Kg/m2)
23
24
25
26
29
28
27
30
TT
C allele carriers
0 6 12
Time (weeks)
29,1
26,5
25
27,9
28,1 27,8

PERILIPIN GENE AND WEIGHT LOSS
Corella, et al. 2005
10
7,70
GG
0,97
AA
6
2
8
4
Weight
Loss
(%)

LIPC – 514>CT POLYMORPHISM AND FIBRE
INTAKE (TERTILES)
Santos, et al. 2006
1
0,5
0.5
OR
0,5
First
Tertil
Third
Tertil
Second
Tertil
1

UCP3 HAPLOTYPES IMPACT ON WEIGHT LOSS
Cha, et al. 2006
4,3
5,6 6
2
8
4
Weight
Loss
(Kg)
4,7
C/C R/R C/R

PPAR x ADRB2 interaction
E. L. Rosado, et al. 2006
10
5,65
Pro 12 Pro
Glu 27 Glu
8
Pro 12 Ala
Gln 27 Glu
6
2
8
4
Weight
Loss
(Kg)

ADIPOQ – 11377 C>G POLIMORPHISM INFLUENCE ON
WEIGHT LOSS
Sorensen, et al. 2006
1,2
Low fat
1
High-fat
Weight
Loss
(Kg)
Heterozygous Homozygous
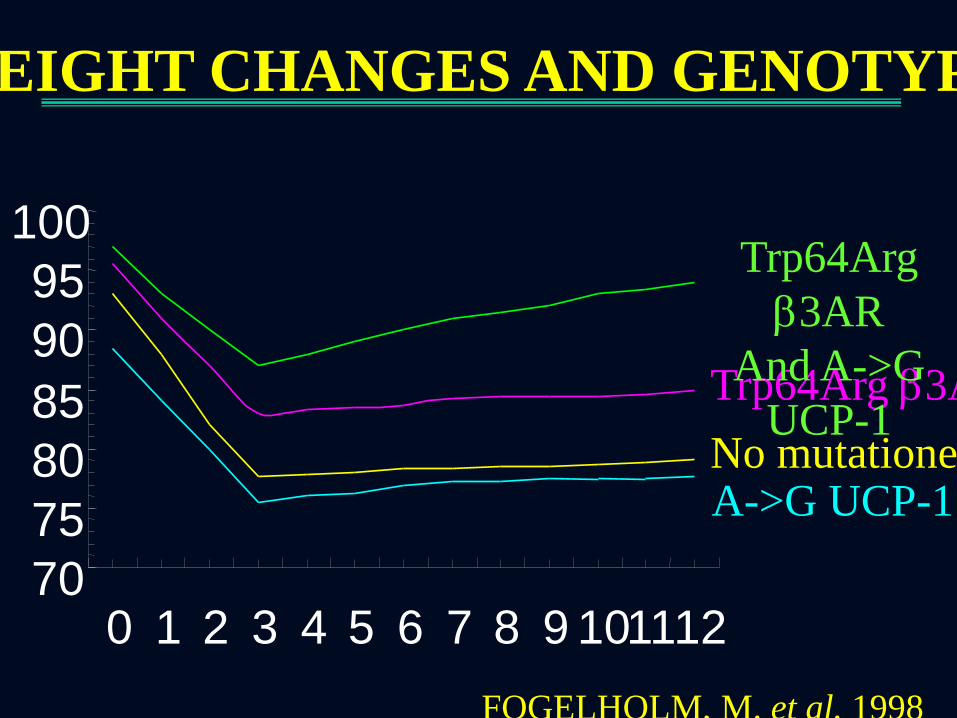
100
70
75
80
85
90
95
0 1 2 3 4 5 6 7 8 9 10 11 12
Trp64Arg 3AR
No mutationes A->G UCP-1
Trp64Arg
3AR
And A->G
UCP-1
FOGELHOLM, M. et al. 1998
WEIGHT CHANGES AND GENOTYPE

BODY WEIGHT REDUCTION AND GENETIC VARIANTS:
IL-6 AND PPAR-G2
Goyenechea, et al. 2006
96
Baseline
(day0) Endpoint
(day 70)
92
88
94
90
Body
Weight
(Kg.)
86
98
100
102
1 year after
LED (week 62)
* +
C+Ala-
C+Ala+
C-Ala-


GPS * Energy intake interaction
P= 0.0020
15
20
25
30
35
Pe
rcen
tage
of bo
dy fa
t
1000 2000 3000 4000
TOTAL ENERGY INTAKE
low GPS (<=7 risk alleles) high GPS (>7 risk alleles)
Ajustado por sexo, edad y factor de actividad física

GPS * Protein intake interaction
P= 0.0027
15
20
25
30
Pe
rcen
tage
of bo
dy fa
t
0 50 100 150 200
PROTEIN intake
low GPS (<=7 risk alleles) high GPS (>7 risk alleles)
P= 0.0316
20
22
24
26
28
30
Pe
rcen
tage
of bo
dy fa
t
0 50 100 150 200
ANIMAL PROTEIN intake
low GPS (<=7 risk alleles) high GPS (>7 risk alleles)
P= 0.0034
20
21
22
23
24
25
Pe
rcen
tage
of bo
dy fa
t
10 20 30 40 50 60
VEGETABLE PROTEIN intake
low GPS (<=7 risk alleles) high GPS (>7 risk alleles)
Ajustado por sexo, edad, factor de actividad física e ingesta energética

GPS * Fat intake interaction
P= 0.0292
20
22
24
26
Pe
rcen
tage
of bo
dy fa
t
0 50 100 150 200
FAT intake
low GPS (<=7 risk alleles) high GPS (>7 risk alleles)
P= 0.0151
22
23
24
25
26
Pe
rcen
tage
of bo
dy fa
t
10 20 30 40 50
AGS intake
low GPS (<=7 risk alleles) high GPS (>7 risk alleles)
P= 0.0024
18
20
22
24
26
Pe
rcen
tage
of bo
dy fa
t
0 10 20 30 40
AGP intake
low GPS (<=7 risk alleles) high GPS (>7 risk alleles)
Ajustado por sexo, edad, factor de actividad física e ingesta energética

GPS * CHO-Fibre intake interaction
P= 0.0078
21
22
23
24
25
26
Pe
rcen
tage
of bo
dy fa
t
0 100 200 300 400 500
CARBOHYDRATES intake
low GPS (<=7 risk alleles) high GPS (>7 risk alleles)
P= 0.0304
21
22
23
24
25
26
Pe
rcen
tage
of bo
dy fa
t
0 100 200 300
COMPLEX CARBOHYDRATES intake
low GPS (<=7 risk alleles) high GPS (>7 risk alleles)
P= 0.0394
18
20
22
24
26
Pe
rcen
tage
of bo
dy fa
t
10 20 30 40 50 60
FIBER intake
low GPS (<=7 risk alleles) high GPS (>7 risk alleles)
Ajustado por sexo, edad, factor de actividad física e ingesta energética
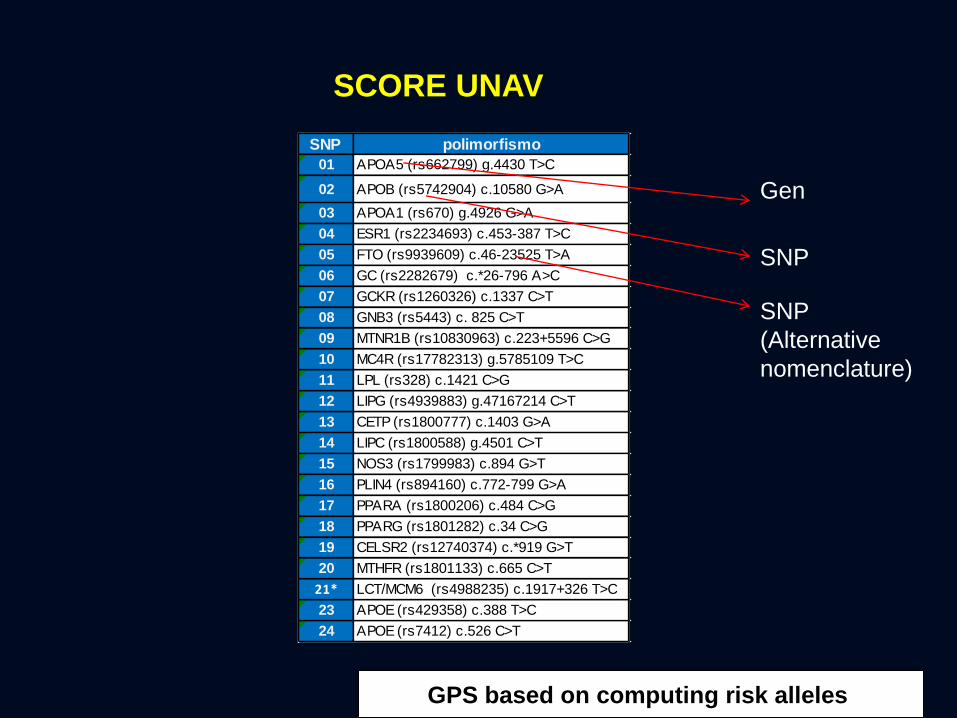
SCORE UNAV
SNP polimorfismo
01 APOA5 (rs662799) g.4430 T>C
02 APOB (rs5742904) c.10580 G>A
03 APOA1 (rs670) g.4926 G>A
04 ESR1 (rs2234693) c.453-387 T>C
05 FTO (rs9939609) c.46-23525 T>A
06 GC (rs2282679) c.*26-796 A>C
07 GCKR (rs1260326) c.1337 C>T
08 GNB3 (rs5443) c. 825 C>T
09 MTNR1B (rs10830963) c.223+5596 C>G
10 MC4R (rs17782313) g.5785109 T>C
11 LPL (rs328) c.1421 C>G
12 LIPG (rs4939883) g.47167214 C>T
13 CETP (rs1800777) c.1403 G>A
14 LIPC (rs1800588) g.4501 C>T
15 NOS3 (rs1799983) c.894 G>T
16 PLIN4 (rs894160) c.772-799 G>A
17 PPARA (rs1800206) c.484 C>G
18 PPARG (rs1801282) c.34 C>G
19 CELSR2 (rs12740374) c.*919 G>T
20 MTHFR (rs1801133) c.665 C>T
21* LCT/MCM6 (rs4988235) c.1917+326 T>C
23 APOE (rs429358) c.388 T>C
24 APOE (rs7412) c.526 C>T
Gen
SNP
SNP
(Alternative
nomenclature)
GPS based on computing risk alleles
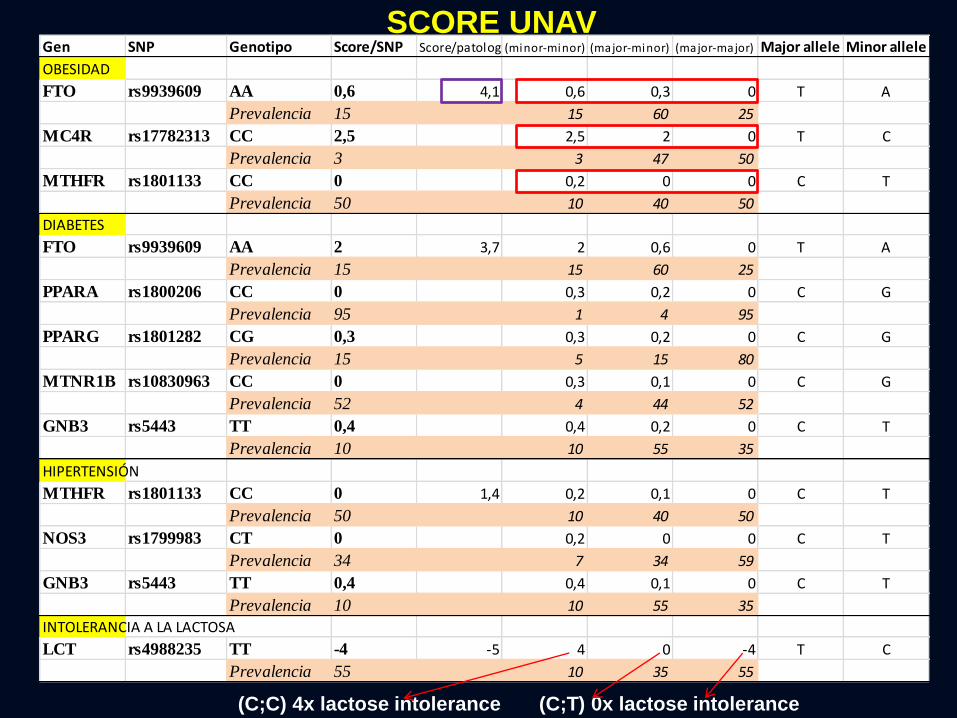
Gen SNP Genotipo Score/SNP Score/patolog (minor-minor) (major-minor) (major-major) Major allele (1)Minor allele (2)
OBESIDAD
FTO rs9939609 AA 0,6 4,1 0,6 0,3 0 T A
Prevalencia 15 15 60 25
MC4R rs17782313 CC 2,5 2,5 2 0 T C
Prevalencia 3 3 47 50
MTHFR rs1801133 CC 0 0,2 0 0 C T
Prevalencia 50 10 40 50
DIABETES
FTO rs9939609 AA 2 3,7 2 0,6 0 T A
Prevalencia 15 15 60 25
PPARA rs1800206 CC 0 0,3 0,2 0 C G
Prevalencia 95 1 4 95
PPARG rs1801282 CG 0,3 0,3 0,2 0 C G
Prevalencia 15 5 15 80
MTNR1B rs10830963 CC 0 0,3 0,1 0 C G
Prevalencia 52 4 44 52
GNB3 rs5443 TT 0,4 0,4 0,2 0 C T
Prevalencia 10 10 55 35
HIPERTENSIÓN
MTHFR rs1801133 CC 0 1,4 0,2 0,1 0 C T
Prevalencia 50 10 40 50
NOS3 rs1799983 CT 0 0,2 0 0 C T
Prevalencia 34 7 34 59
GNB3 rs5443 TT 0,4 0,4 0,1 0 C T
Prevalencia 10 10 55 35
INTOLERANCIA A LA LACTOSA
LCT rs4988235 TT -4 -5 4 0 -4 T C
Prevalencia 55 10 35 55
(C;C) 4x lactose intolerance (C;T) 0x lactose intolerance
(T;T) -4x lactose tolerance
SCORE UNAV

Gen SNP Major allele (1)Minor allele (2)INTERACCIONES
APOA1 rs670 G A Si GG (3) Si su dieta es rica en grasas o si su ingesta de grasas monoinsaturadas, como el aceite de oliva, es muy elevada, usted tiene mayor predisposición que la mayoría de la población para desarrollar diabetes tipo 2, obesidad e hipertensión. Le recomendamos una dieta algo más baja en grasas para prevenir estas posibles consecuencias.
APOA1 rs670 G A Si AA (1) Una dieta rica en ácidos grasos de tipo poliinsaturado es especialmente beneficiosa en su caso para incrementar los niveles de colesterol HDL, protectores frente a la enfermedad cardiovascular. Le recomendamos una dieta rica en pescado azul y con presencia de frutos secos, especialmente nueces o avellanas.
LIPC rs1800588 C T Si TT (1) Una dieta rica en grasas monoinsaturadas le ayudará a reducir sus niveles de colesterol LDL y, por lo tanto, el riesgo cardiovascular. Le recomendamos que una parte importante de su ingesta de grasas provenga de aceite de oliva o bien de girasol alto oleico. Algunos frutos secos como avellanas y nueces de macadamia, o el aguacate, también son ricos en este tipo de grasas.
MTHFR rs1801133 C T Si TT (1) Si la ingesta de ácido fólico no es elevada, usted tiene más riesgo que la mayoría de la población de presentar niveles elevados de homocisteína. Este metabolito está implicado en un aumento del riesgo a sufrir enferemedad cardiovascular. Por lo tanto, le recomendamos una dieta rica en ácido fólico (legumbres, verduras y frutas). Además, le puede ayudar que una parte importante de las grasas que consuma sean de tipo poliinsaturado n-3, abundante en el pescado azul y las nueces.
NOS3 rs1799983 C T Si TT (1) Los ácidos grasos de tipo n-3 son particularmente beneficiosos en su caso para mantener bajo control el riesgo de sufrir enfermedad cardiovascular y sus niveles de lípidos en sangre. Le recomendamos una dieta en la que abunde el pescado azul y las nueces.
PLIN rs894160 G A Si AA (1) Una dieta rica en grasas saturadas (de origen animal, en especial carnes grasas y lácteos enteros, y también en productos de bollería) y pobre en hidratos de carbono (pasta, arroz, pan) aumenta su predisposición a desarrollar resitencia a la insulina y diabetes de tipo 2. Le recomendamos que no abuse del consumo de grasas saturadas.
PPARA rs1800206 C G Si GG (1) Si su dieta es rica en grasas y especialmente en grasas saturadas (carnes grasas y lácteos enteros), su predisposición a sufrir enfermedad cardiovascular aumenta más que en el resto de la población. Le recomendamos que en su dieta no abunden este tipo de alimentos. Además, si su dieta es pobre en ácidos grasos polinsaturados aumenta su predisposición a desarrollar hipercolesterolemia. Le recomendamos que incluya en su dieta habitual los aceites de semillas (girasol, soja), el pescado azul y los frutos secos (en especial nueces).
PPARG rs1801282 C G Si GG (1) Si su dieta es pobre en ácidos grasos monoinsaturados (en especial aceite de oliva o girasol alto oléico, pero también frutos secos) y rica en grasas saturadas (carnes grasas y lacteos enteros) tiene mayor predisposición que la mayoría de la población a desarrollar resistencia a la insulina y diabetes tipo 2. Le recomendamos que incremente la proporción de grasas monoinsaturadas en su dieta en detrimento de las saturadas.
SCORE UNAV
GENE-DIET INTERACTIONS
Si su dieta es rica en grasas o si su ingesta de grasas monoinsaturadas, como el aceite de oliva, es muy elevada, usted
tiene mayor predisposición que la mayoría de la población para desarrollar diabetes tipo 2, obesidad e hipertensión.
Le recomendamos una dieta algo más baja en grasas para prevenir estas posibles consecuencias.

Nutriepigenetics
Epigenetic processes modulate gene activity and expression
without changes in the DNA nucleotide sequence

DNA Methylation and Histone modification. (From Molecular Development - Epigenetics by
Dr Mark Hill.)
Epigenetic modifications
http://www.youtube.com/watch?v=eYrQ0EhVCYA&NR=1

- DNA methylation
Addition or removal of a methyl group (CH3), predominantly where cytosine is
followed by a guanine (CpGs).
-Post-translational modifications on N-terminal tails of histones,
phosphorylation, sumoylation, ubiquitination, acetylation, and methylation
These modifications alter chromatin structure to influence gene expression.
In general, tightly folded chromatin (heterochromatin) tends to be
shut down, or not expressed, while more open Chromatin (euchromatin) is
functional, or expressed.
-Other mechanims
Gene expression maybe modified by miRNA, transposons, etc
Epigenetic Phenomena

Epigenetic modifications

Interactions of Foods/Nutrients & Epigenetic Genes modulate metabolism
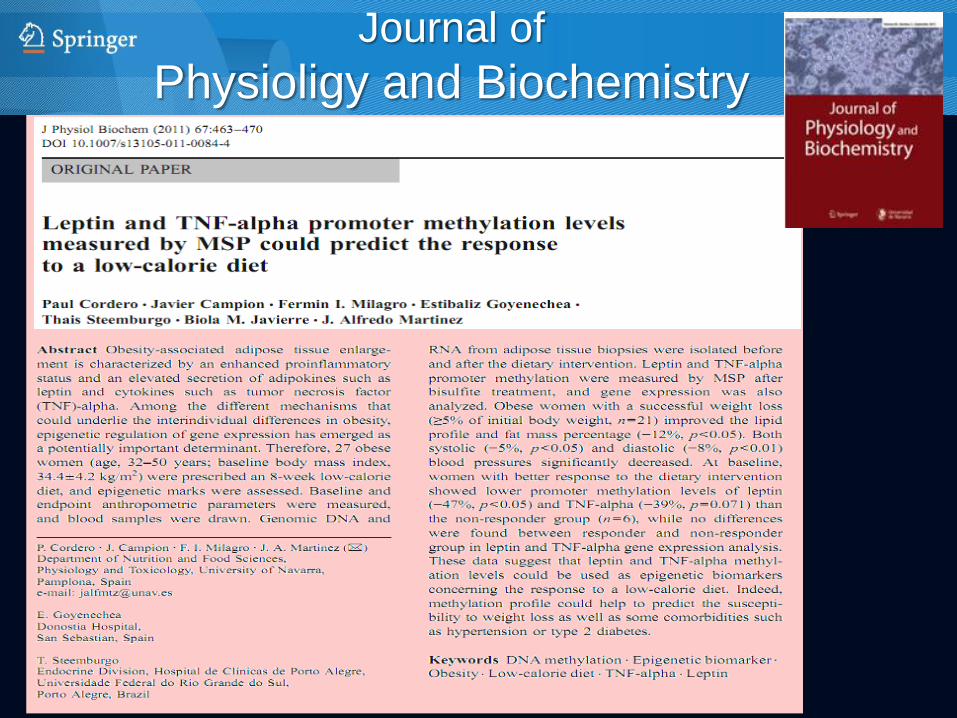
Journal of
Physioligy and Biochemistry
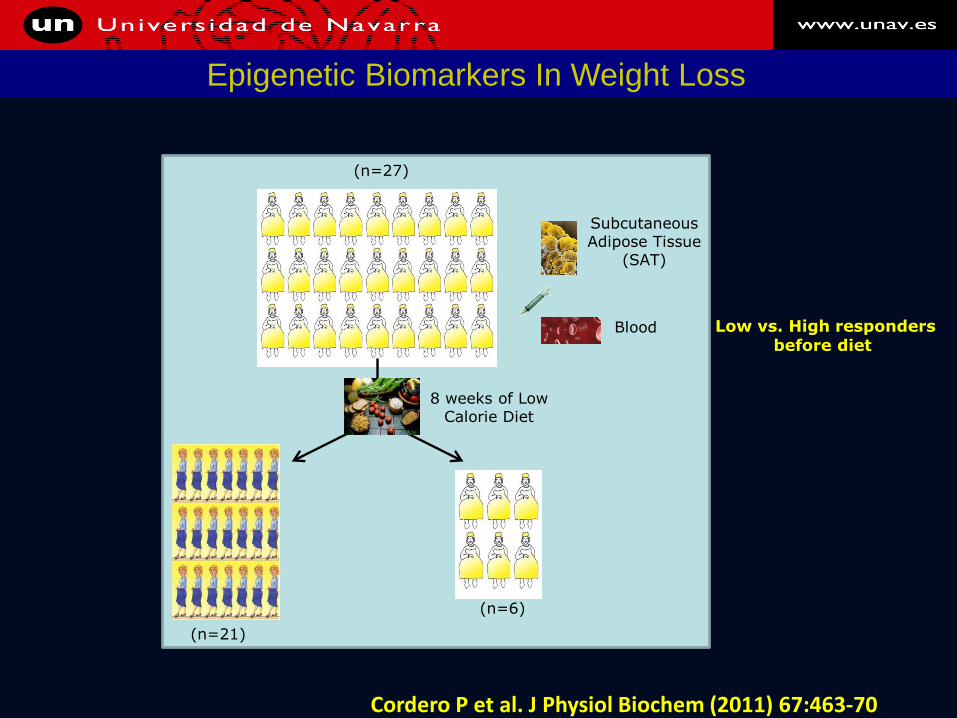
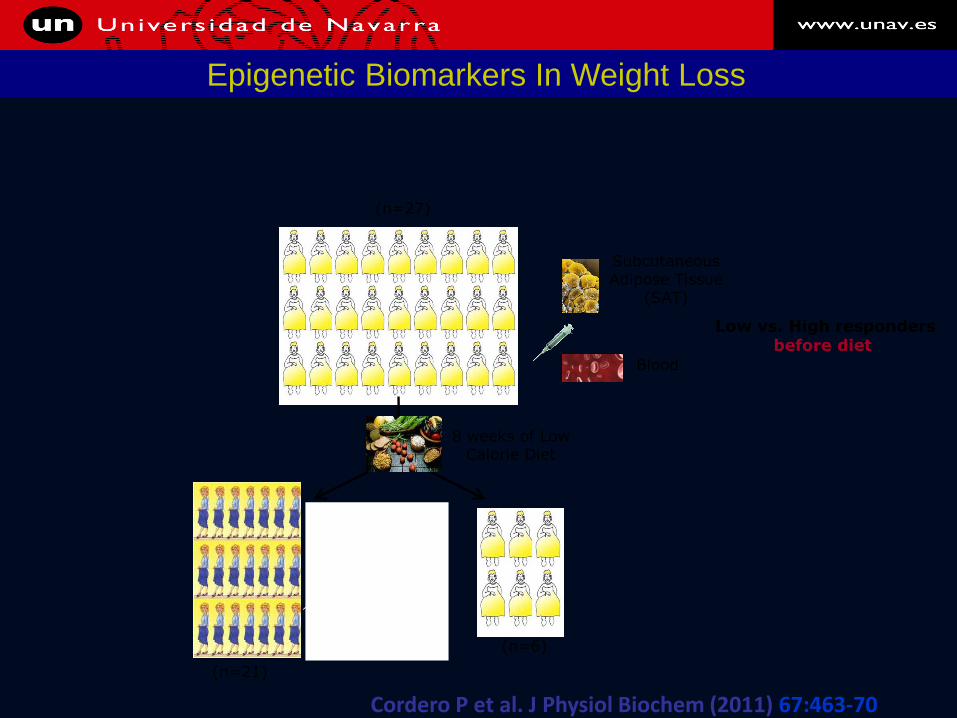
8 weeks of Low Calorie Diet
(n=6)
(n=21)
(n=27)
Subcutaneous Adipose Tissue
(SAT)
SAT
Blood
Blood
Low vs. High responders before diet
Epigenetic Biomarkers In Weight Loss
Cordero P et al. J Physiol Biochem (2011) 67:463-70
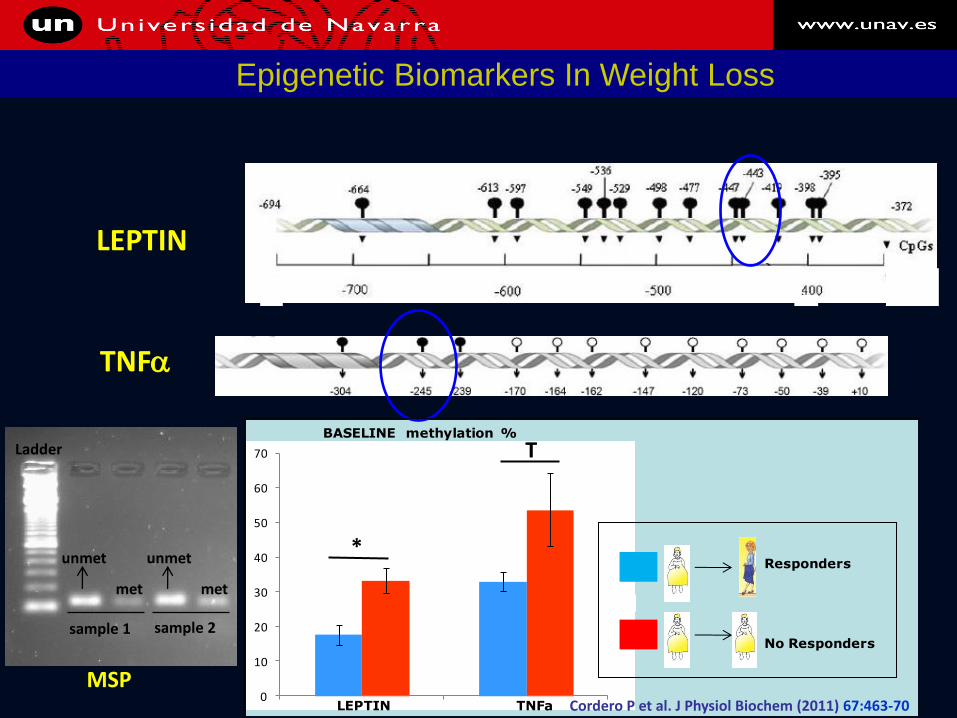
LEPTIN
TNFa
0
10
20
30
40
50
60
70
Leptina TNF-alfa
Respuesta
No respuesta
*
TBASELINE methylation %
LEPTIN TNFa
Responders
No Responders
Ladder
sample 1 sample 2
met
unmet unmet
met
MSP
Epigenetic Biomarkers In Weight Loss
Cordero P et al. J Physiol Biochem (2011) 67:463-70


8 weeks of hypocaloric diet
Before
After
Illumina Microarray
Milagro FI et al. FASEB J (2011)
Epigenetic Biomarkers In Weight Loss

Microarray Changes by the diet
70 CpG hypermrth
100 CpG hypometh
Before vs. After diet
(20 % variation p < 0.05)
0
0,1
0,2
0,3
0,4
0,5
0,6
0,7
0,8
0,9
APOA5 PTEN GNAS H19 IL26
Inicial
Final
***
***
***
***
***
(% methylation)
APOA5 PTEN GNAS H19 IL26
Methylation changes induced by an energy restricted diet
Milagro FI et al. FASEB J (2011).
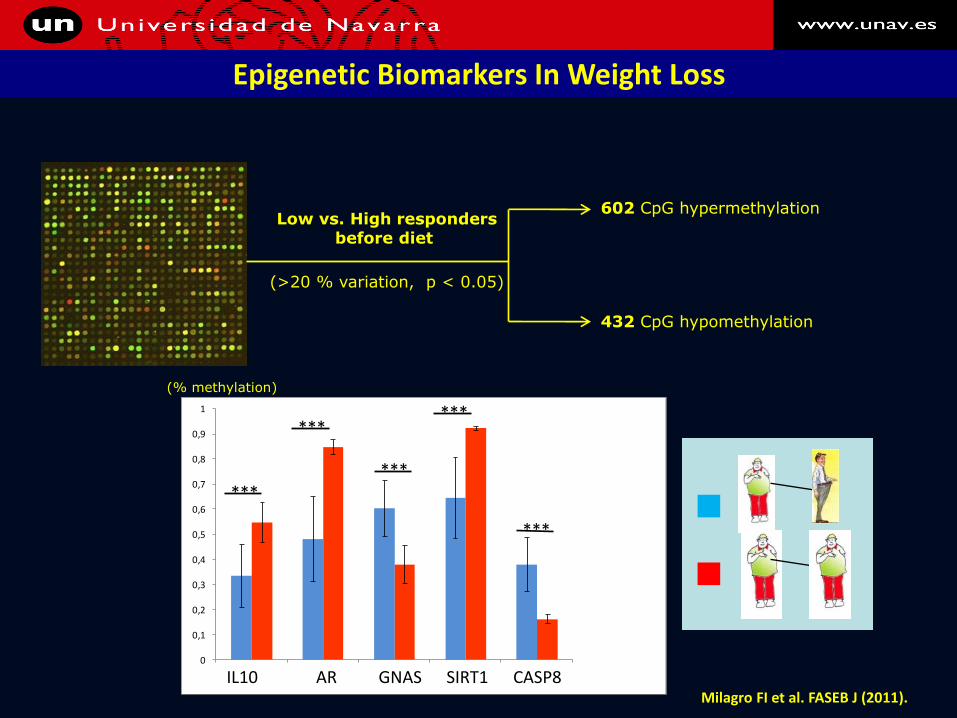
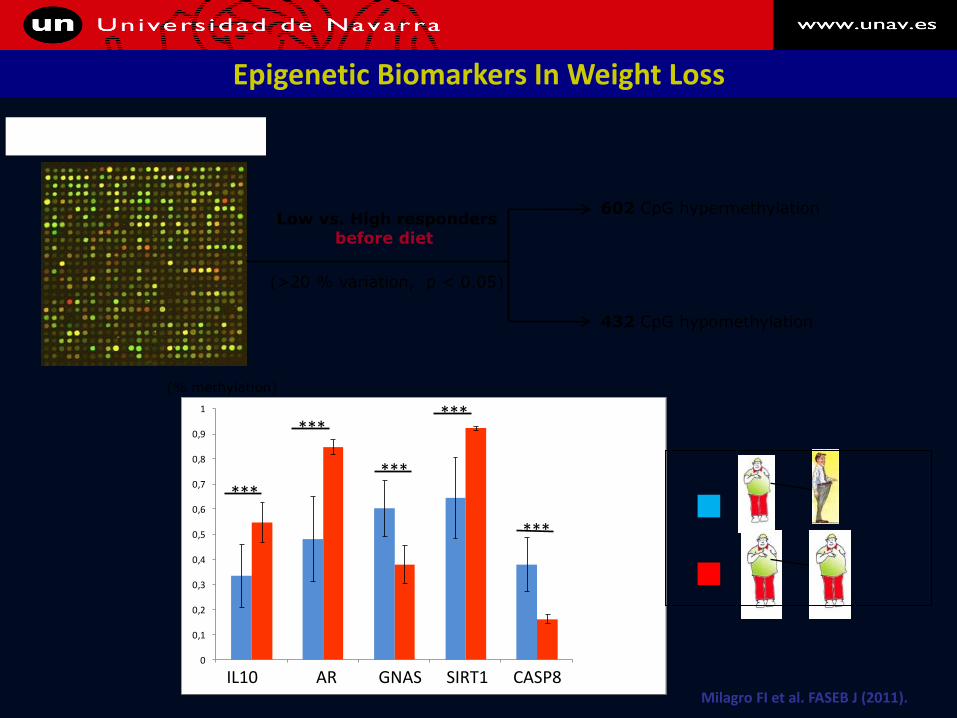
602 CpG hypermethylation
432 CpG hypomethylation
Low vs. High responders before diet
(>20 % variation, p < 0.05)
0
0,1
0,2
0,3
0,4
0,5
0,6
0,7
0,8
0,9
1
IL10 AR GNAS SIRT1 CASP8
Respuesta
No respuesta
***
***
***
***
***
(% methylation)
IL10 AR GNAS SIRT1 CASP8
Epigenetic Biomarkers In Weight Loss
Milagro FI et al. FASEB J (2011).


Differential DNA methylation patterns between high and low responders to a weight loss intervention in overweight or obese adolescents: the EVASYON study
Martí et al FASEB J. 2013
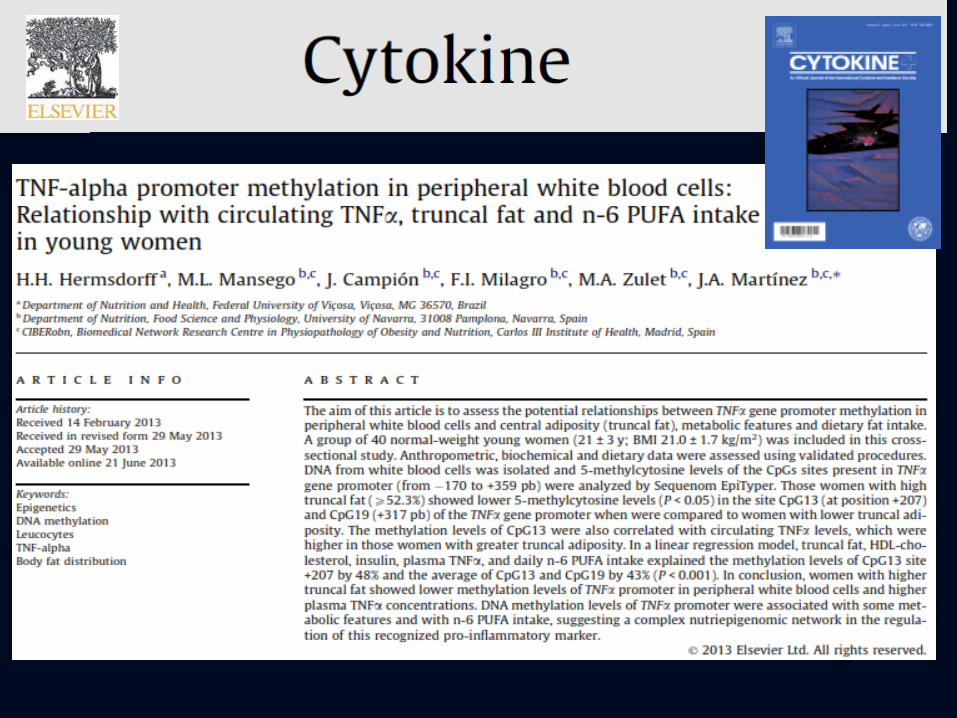
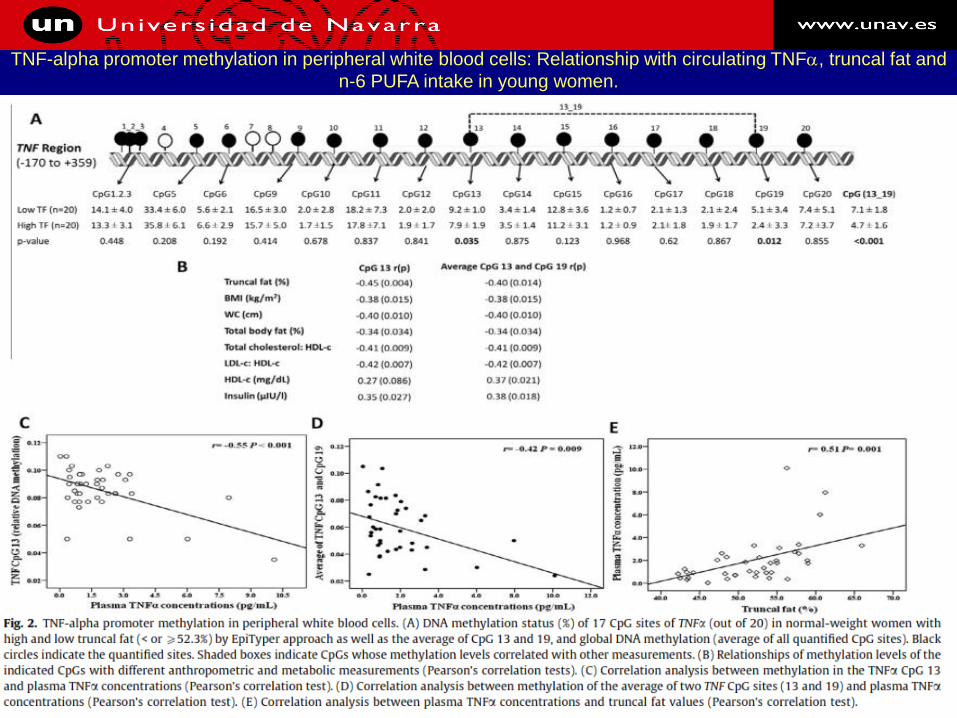
TNF-alpha promoter methylation in peripheral white blood cells: Relationship with circulating TNFa, truncal fat and
n-6 PUFA intake in young women.


CLOCK, PER2 and BMAL1 DNA methylation: association with obesity and metabolic
syndrome characteristics and monounsaturated fat intake.
•Milagro et al Chronobiol Int. 2012 Nov;29(9):1180-94

CLOCK, PER2 and BMAL1 DNA methylation: association with obesity and metabolic syndrome
characteristics and monounsaturated fat intake.
•Milagro et al Chronobiol Int. 2012 Nov;29(9):1180-94
•FIGURE 4.
•Partial correlations between the percentages of methylation of CLOCK CpG 1 and CLOCK CpG 8 with the percentages of MUFA (3A) and PUFA (3B) in the diet, after adjusting total fat intake by the BMI of each subject.


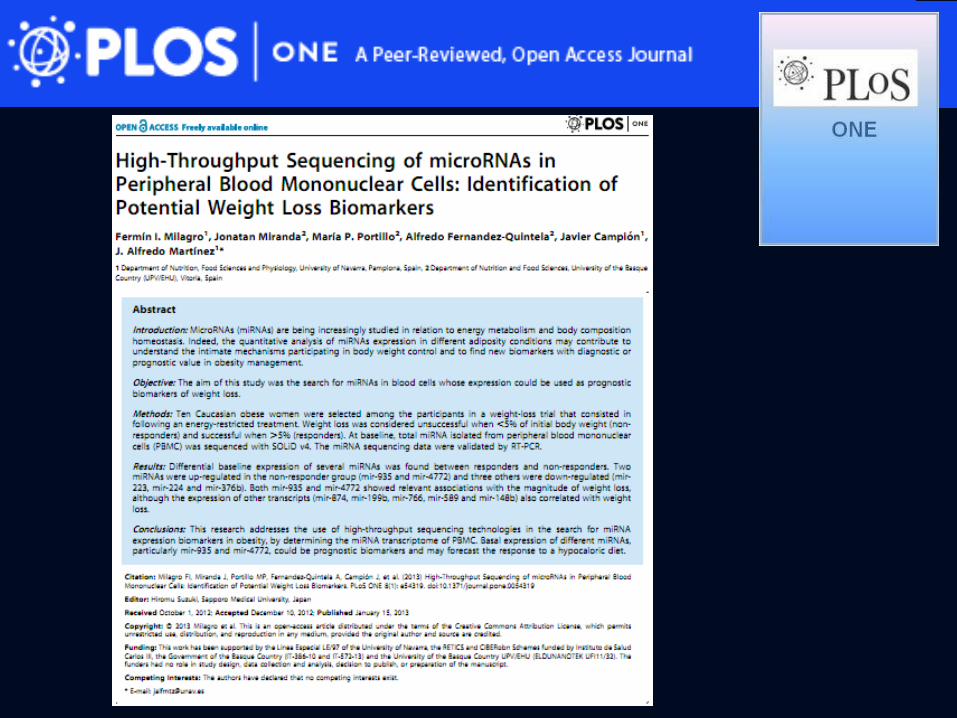
High-Throughput Sequencing of microRNAs in Peripheral Blood Mononuclear Cells: Identification of Potential Weight Loss Biomarkers
Martínez et al PLoS One. 2013;8(1)

PROGRAMACIÓN PERINATAL Y ENF. CRÓNICAS
NUTRITION, PERINATAL PROGRAMING AND DISEASE
Genetics Genomics Epigenetics

Nutrition and Health
San Sebastián/Donostia 2009

But genetics/epigenetcs is only the tip of the iceberg

Conclussion?

Rather than there being an „optimal‟ human diet, there are a range of adequate
diets which depend upon individual biological and cultural variation.
EPIGENETIC MARKS GENETIC BACKGROUND
PHYSICAL ACTIVITY
LIKES AND DISLIKES ALLERGIES AND INTOLERANCES
FAMILY HISTORY
PREVIOUS DISEASES CULTURE
Precision diet
PERSONALIZED NUTRITION

Conclussions
Genoma: 30.000 genes (millions polymorphisms)
GENOME
Gene expression = f (DNA environmental factors )
Applications: - Personalized nutrient requirements
- diagnoses of metabolic diseases
- Nutritional prescriptions (Prevention/therapy)


PERSONALIZED WEIGHT MANAGEMENT
INDIVIDUALIZED NUTRITION


•Buenos Aires, Argentina, 20-25 October 2017

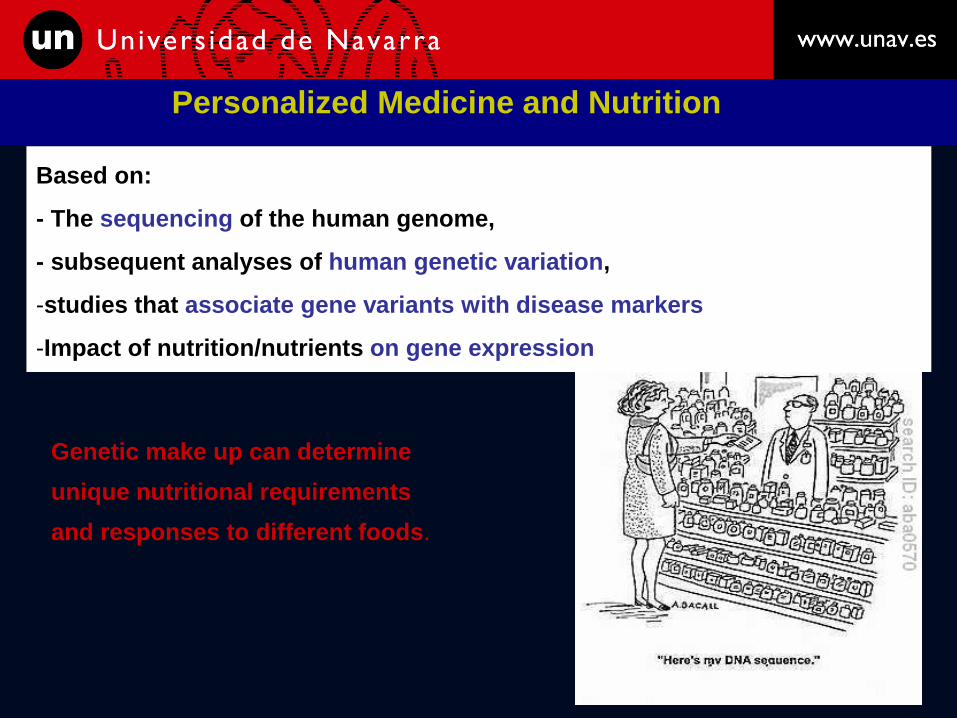
Personalized Medicine and Nutrition
Genetic make up can determine
unique nutritional requirements
and responses to different foods.
Based on:
- The sequencing of the human genome,
- subsequent analyses of human genetic variation,
-studies that associate gene variants with disease markers
-Impact of nutrition/nutrients on gene expression
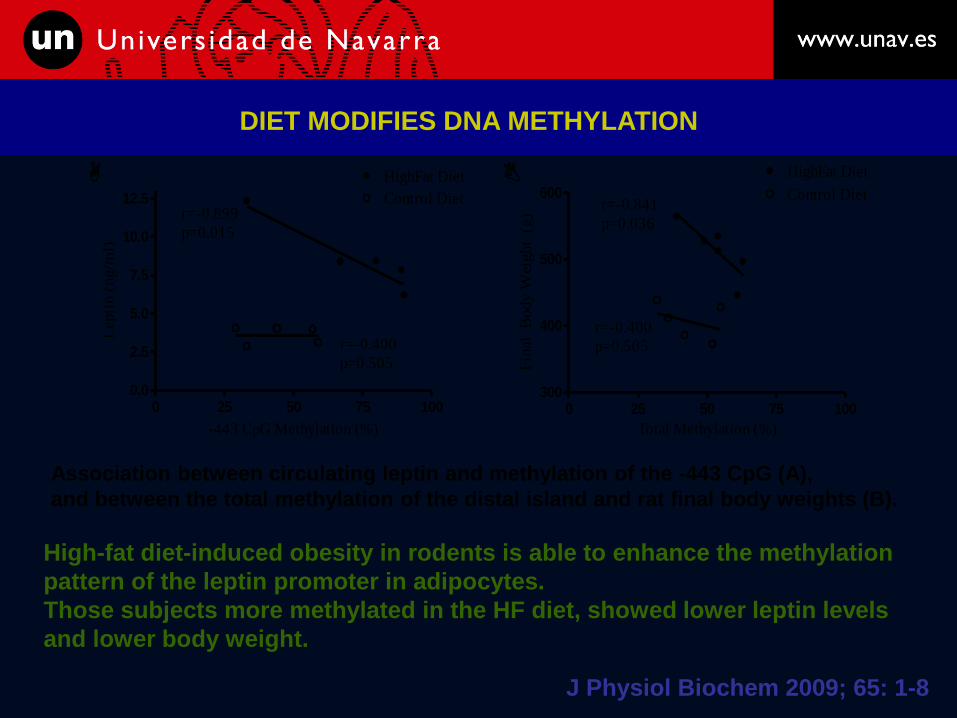
0 25 50 75 1000.0
2.5
5.0
7.5
10.0
12.5 Control Diet
HighFat Diet
r=-0.899
p=0.015
r=-0.400
p=0.505
-443 CpG Methylation (%)
Lepti
n (
ng/m
l)
0 25 50 75 100300
400
500
600 Control Diet
HighFat Diet
r=-0.841
p=0.036
r=-0.400
p=0.505
Total Methylation (%)
Fin
al
Body W
eig
ht
(g)
A B
Association between circulating leptin and methylation of the -443 CpG (A),
and between the total methylation of the distal island and rat final body weights (B).
High-fat diet-induced obesity in rodents is able to enhance the methylation
pattern of the leptin promoter in adipocytes.
Those subjects more methylated in the HF diet, showed lower leptin levels
and lower body weight.
DIET MODIFIES DNA METHYLATION
J Physiol Biochem 2009; 65: 1-8

Wonders:
1- How the dietary-induced epigenetic marks could be inherited and influence
the obesity susceptibility and metabolic alterations of the offspring ?.
2- How the diet could influence the epigenetic pattern (DNA methylation)
of gene promoters and epigenetics could be concerned with obesity ?.
3- How the epigenetic marks related with inflammation could be used as
biomarkers of disease risk or weight loss/weight gain susceptibility ?.
Nutriepigenomics

Campión J, Milagro FI and Martinez JA. TNF-alpha promoter methylation as a predictive biomarker for weight-loss response.
Obesity 2009; 17: 1293-7.
Does epigenetically-mediated inflammatory regulation participate in body
weight control?
Could the epigenetic control of inflammation-related gene promoters be
implicated in the susceptibility to lose body weight by a hypocaloric diet?
Is inflammation-related epigenetic status a good marker of weight loss?
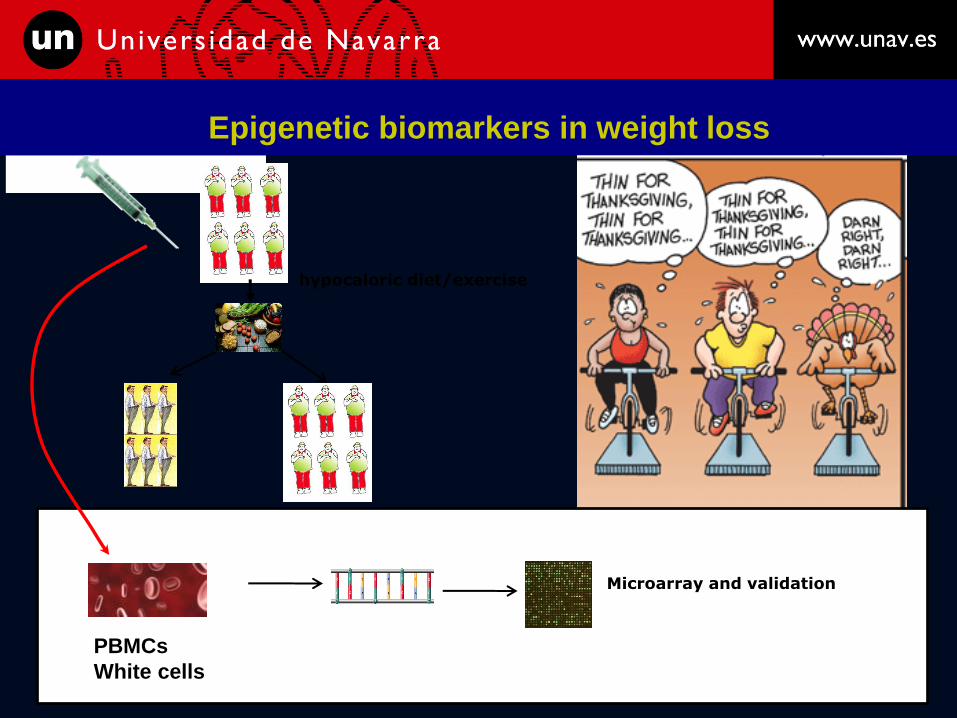
hypocaloric diet/exercise
Microarray and validation
PBMCs
White cells
Epigenetic biomarkers in weight loss
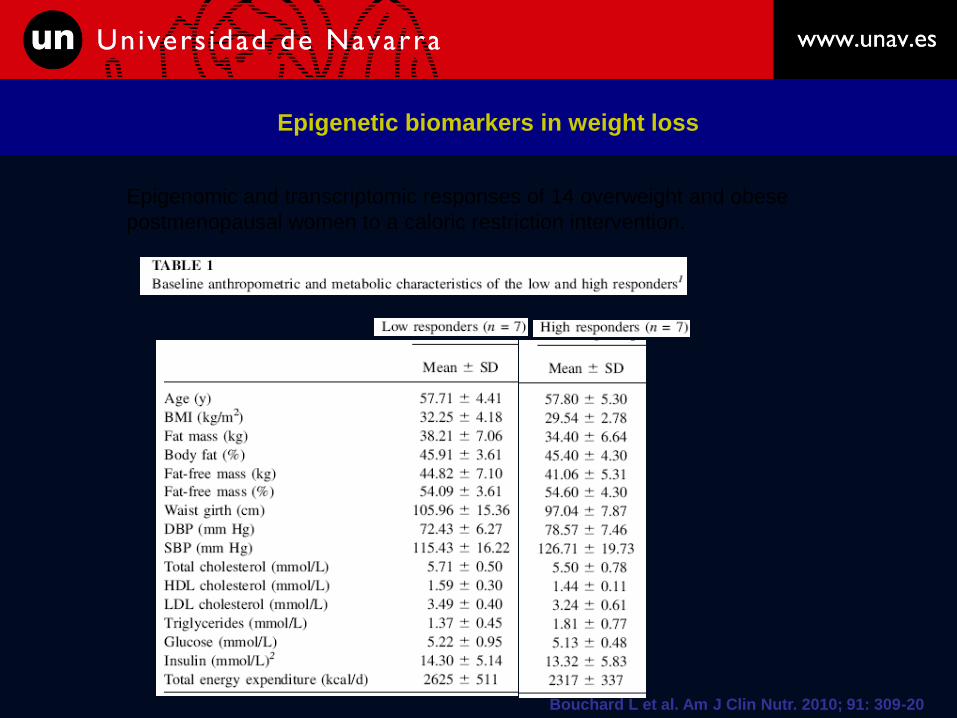
Bouchard L et al. Am J Clin Nutr. 2010; 91: 309-20
Epigenetic biomarkers and weight loss
Epigenomic and transcriptomic responses of 14 overweight and obese
postmenopausal women to a caloric restriction intervention.
Epigenetic biomarkers in weight loss
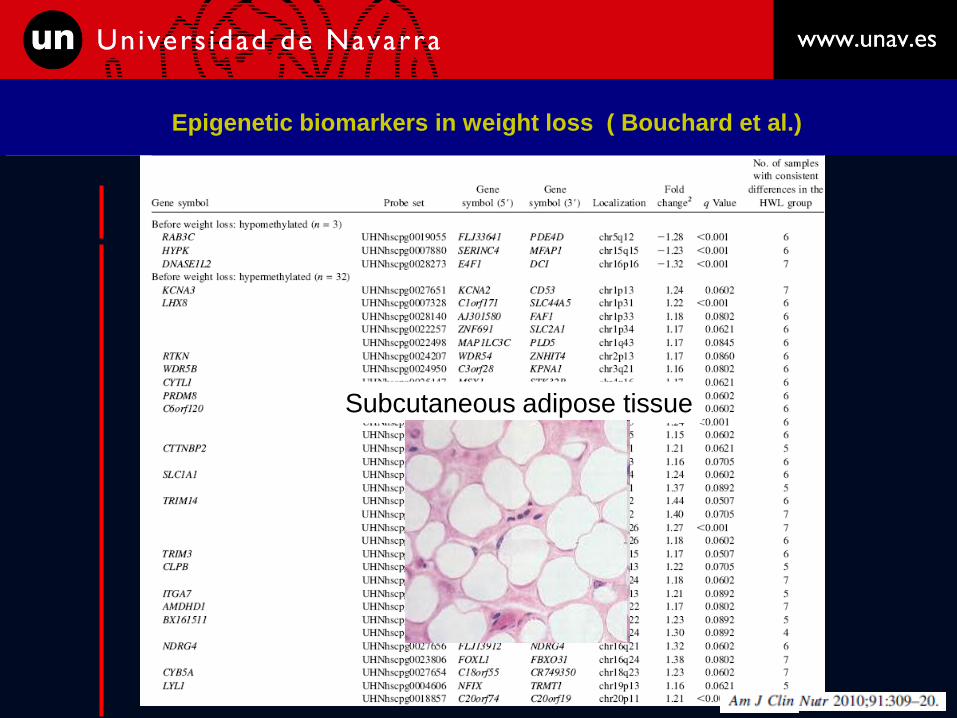
Bouchard L et al. Am J Clin Nutr. 2010; 91: 309-20
Epigenetic biomarkers and weight loss
Subcutaneous adipose tissue
Epigenetic biomarkers in weight loss ( Bouchard et al.)
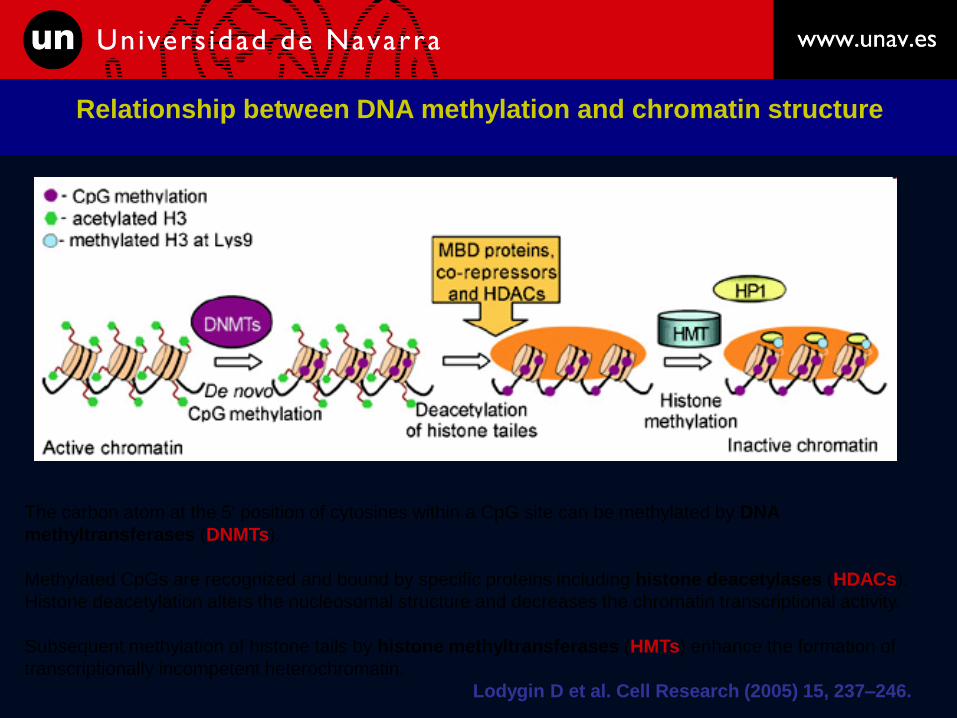
The carbon atom at the 5' position of cytosines within a CpG site can be methylated by DNA
methyltransferases (DNMTs).
Methylated CpGs are recognized and bound by specific proteins including histone deacetylases (HDACs).
Histone deacetylation alters the nucleosomal structure and decreases the chromatin transcriptional activity.
Subsequent methylation of histone tails by histone methyltransferases (HMTs) enhance the formation of
transcriptionally incompetent heterochromatin.
Lodygin D et al. Cell Research (2005) 15, 237–246.
Relationship between DNA methylation and chromatin structure

May high energy or high-fat diets affect gene promoter methylation,
affecting thus obese “phenotype”?
The methylation pattern of leptin promoter is modified by high fat diet-
induced obesity in rats. Milagro FI, Campión J, García-Díaz DF, Goyenechea E, Paternain L, Martínez JA.
J Physiol Biochem 2009; 65: 1-8.
HYPOTHESIS


Journal of
Physioligy and Biochemistry
8 weeks of Low Calorie Diet
(n=6)
(n=21)
(n=27)
Subcutaneous Adipose Tissue
(SAT)
SAT
Blood
Blood
Low vs. High responders before diet
Epigenetic Biomarkers In Weight Loss
Cordero P et al. J Physiol Biochem (2011) 67:463-70

LEPTIN
TNFa
0
10
20
30
40
50
60
70
Leptina TNF-alfa
Respuesta
No respuesta
*
TBASELINE methylation %
LEPTIN TNFa
Responders
No Responders
Ladder
sample 1 sample 2
met
unmet unmet
met
MSP
Epigenetic Biomarkers In Weight Loss
Cordero P et al. J Physiol Biochem (2011) 67:463-70


24 obese subjects (BMI: 30.5 ± 1.5 kg/m2)
12 men 12 female
Serum: TNF-a Blood, PBMC: DNA
8-week hypocaloric diet
Weigh loss ≥ 5% of initial body
Responders Non-responders
Serum: TNF-a
Experimental Design

8 weeks of hypocaloric diet
Before
After
Illumina Microarray
Milagro FI et al. FASEB J (2011)
Epigenetic Biomarkers In Weight Loss

Microarray Changes by the diet
70 CpG hypermrth
100 CpG hypometh
Before vs. After diet
(20 % variation p < 0.05)
0
0,1
0,2
0,3
0,4
0,5
0,6
0,7
0,8
0,9
APOA5 PTEN GNAS H19 IL26
Inicial
Final
***
***
***
***
***
(% methylation)
APOA5 PTEN GNAS H19 IL26
Methylation changes induced by an energy restricted diet
Milagro FI et al. FASEB J (2011).
602 CpG hypermethylation
432 CpG hypomethylation
Low vs. High responders before diet
(>20 % variation, p < 0.05)
0
0,1
0,2
0,3
0,4
0,5
0,6
0,7
0,8
0,9
1
IL10 AR GNAS SIRT1 CASP8
Respuesta
No respuesta
***
***
***
***
***
(% methylation)
IL10 AR GNAS SIRT1 CASP8
Epigenetic Biomarkers In Weight Loss
Milagro FI et al. FASEB J (2011).


Differential DNA methylation patterns between high and low responders to a weight loss intervention in overweight or obese adolescents: the EVASYON study
Martí et al FASEB J. 2013


TNF-alpha promoter methylation in peripheral white blood cells: Relationship with circulating TNFa, truncal fat and
n-6 PUFA intake in young women.

Rather than there being an ‘optimal’ human diet, there are a range of adequate diets
which depend upon individual biological and cultural variation.
EPIGENETIC MARKS GENETIC BACKGROUND
PHYSICAL ACTIVITY
LIKES AND DISLIKES ALLERGIES AND INTOLERANCES
FAMILY HISTORY
PREVIOUS DISEASES CULTURE
Personalized diet
Personalized Nutrition

Conflict of interest regarding this presentation:
I have no conflict of interest to report in relation to this presentation.
Nutriepigenetics
Epigenetic processes modulate gene activity and expression
without changes in the DNA nucleotide sequence

TRATAMIENTO DE LA OBESIDAD
Tratamiento nutricional Modificación de la
conducta alimentaria
Estrategias de aumento
de la actividad física
Tratamiento farmacológico
Tratamiento quirúrgico
1º
2º
3º
Introducción

DIETAS
Pobres en hidratos de
carbono y/o ricas en
grasas/proteínas
Ricas en hidratos de
carbono/ Bajas en grasa
IG
Muy bajo
contenido calórico
400-1000 kcal
Productos milagro
Pastillas, infusiones,
cremas, preparados…
Toma de un
alimento
Espagueti, piña, manzana,
helado, zanahoria…
Introducción

LOW CALORIE DIETS
Fat losses
lean tissue maintenance
Macronutrient distribution
Food Composition
Proteins, 3 fatty acids,
glycemic index, fiber,
amino acids…
Risk factors
0%
10%
20%
30%
40%
50%
60%
70%
80%
90%
100%
1 2
Carbohydrates
Lípids
Proteíns

Body weight composition
DEXA, Bio-impedance
Energy expenditure
Indirect Calorimetry
Mitochondrial Oxidation
Breath tests for stable isotopes
Blood Sampling
Lipids, carbohydrates, leptin,…
Personalized Nutrition
Energy - 30%
Macronutrients
Genotype/phenotype
DIET
Anthropometrics
Weight, stature, circumferences,……..
Material y Métodos: Personalización

GENÉTICA Y EPIGENÉTICA DE LA OBESIDAD
J Alfredo Martinez