


Idiomas
Páginas
Jurídico


Stefan Oschmann, CEO Marcus Kuhnert, CFO May 19, 2016
Merck Q1 2016 results
- Presentation for the media -
GOOD START INTO THE YEAR
2
Disclaimer
Cautionary Note Regarding Forward-Looking Statements and financial indicators This communication may include “forward-looking statements.” Statements that include words such as “anticipate,” “expect,” “should,” “would,” “intend,” “plan,” “project,” “seek,” “believe,” “will,” and other words of similar meaning in connection with future events or future operating or financial performance are often used to identify forward-looking statements. All statements in this communication, other than those relating to historical information or current conditions, are forward-looking statements. We intend these forward-looking statements to be covered by the safe harbor provisions for forward-looking statements in the Private Securities Litigation Reform Act of 1995. These forward-looking statements are subject to a number of risks and uncertainties, many of which are beyond control of Merck KGaA, Darmstadt, Germany, which could cause actual results to differ materially from such statements. Risks and uncertainties include, but are not limited to: the risks of more restrictive regulatory requirements regarding drug pricing, reimbursement and approval; the risk of stricter regulations for the manufacture, testing and marketing of products; the risk of destabilization of political systems and the establishment of trade barriers; the risk of a changing marketing environment for multiple sclerosis products in the European Union; the risk of greater competitive pressure due to biosimilars; the risks of research and development; the risks of discontinuing development projects and regulatory approval of developed medicines; the risk of a temporary ban on products/production facilities or of non-registration of products due to non-compliance with quality standards; the risk of an import ban on products to the United States due to an FDA warning letter; the risks of dependency on suppliers; risks due to product-related crime and espionage; risks in relation to the use of financial instruments; liquidity risks; counterparty risks; market risks; risks of impairment on balance sheet items; risks from pension obligations; risks from product-related and patent law disputes; risks from antitrust law proceedings; risks from drug pricing by the divested Generics Group; risks in human resources; risks from e-crime and cyber attacks; risks due to failure of business-critical information technology applications or to failure of data center capacity; environmental and safety risks; unanticipated contract or regulatory issues; a potential downgrade in the rating of the indebtedness of Merck KGaA, Darmstadt, Germany; downward pressure on the common stock price of Merck KGaA, Darmstadt, Germany and its impact on goodwill impairment evaluations; the impact of future regulatory or legislative actions; and the risks and uncertainties detailed by Sigma-Aldrich Corporation (“Sigma-Aldrich”) with respect to its business as described in its reports and documents filed with the U.S. Securities and Exchange Commission (the “SEC”). The foregoing review of important factors should not be construed as exhaustive and should be read in conjunction with the other cautionary statements that are included elsewhere, including the Report on Risks and Opportunities Section of the most recent annual report and quarterly report of Merck KGaA, Darmstadt, Germany, and the Risk Factors section of Sigma-Aldrich’s most recent reports on Form 10-K and Form 10-Q. Any forward-looking statements made in this communication are qualified in their entirety by these cautionary statements, and there can be no assurance that the actual results or developments anticipated by us will be realized or, even if substantially realized, that they will have the expected consequences to, or effects on, us or our business or operations. Except to the extent required by applicable law, we undertake no obligation to update publicly or revise any forward-looking statement, whether as a result of new information, future developments or otherwise. This quarterly presentation contains certain financial indicators such as EBITDA pre exceptionals, net financial debt and earnings per share pre exceptionals, which are not defined by International Financial Reporting Standards (IFRS). These financial indicators should not be taken into account in order to assess the performance of Merck in isolation or used as an alternative to the financial indicators presented in the consolidated financial statements and determined in accordance with IFRS. The figures presented in this quarterly statement have been rounded. This may lead to individual values not adding up to the totals presented.

3
Agenda
Executive summary
Financial overview
Guidance

EXECUTIVE SUMMARY
5
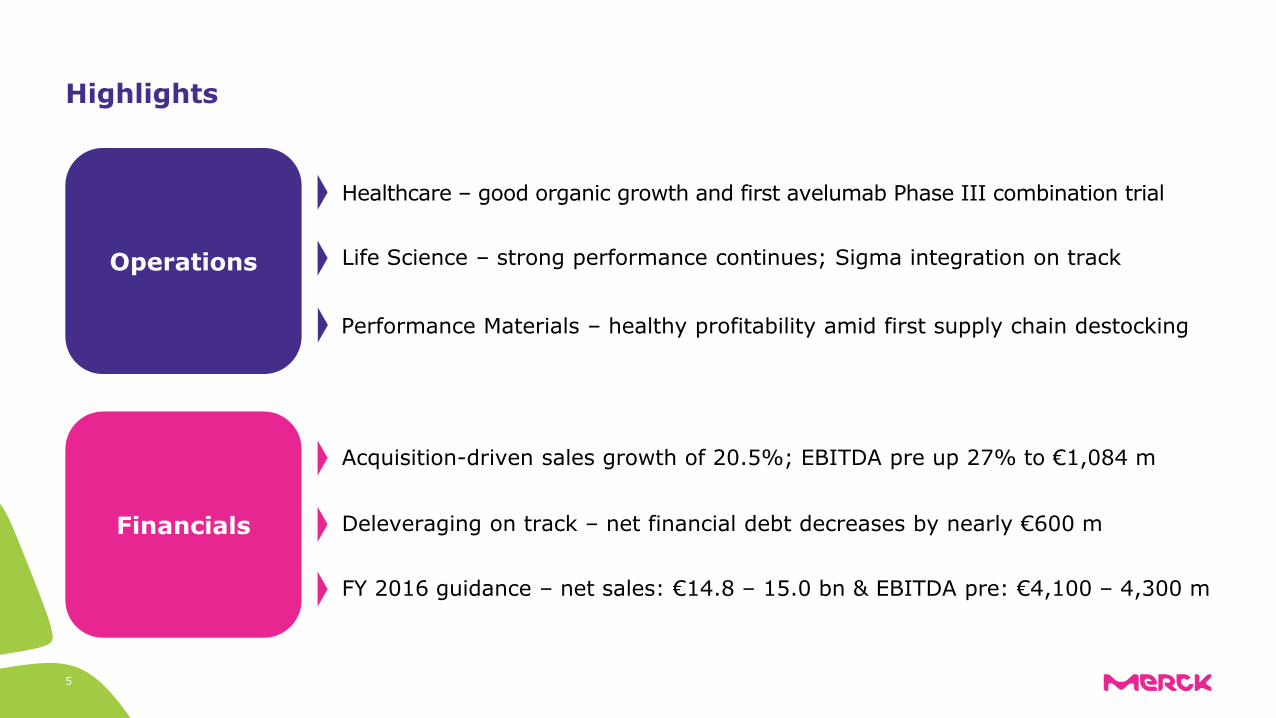
Highlights
Operations
Healthcare – good organic growth and first avelumab Phase III combination trial
Performance Materials – healthy profitability amid first supply chain destocking
Life Science – strong performance continues; Sigma integration on track
Financials
FY 2016 guidance – net sales: €14.8 – 15.0 bn & EBITDA pre: €4,100 – 4,300 m
Deleveraging on track – net financial debt decreases by nearly €600 m
Acquisition-driven sales growth of 20.5%; EBITDA pre up 27% to €1,084 m

*General Medicine and CardioMetabolic Care Totals may not add up due to rounding 6
Life Science and Healthcare drive increase in EBITDA pre
•Healthcare growth reflects strong Fertility, GM* and CH as well as Xalkori commissions
•Strong organic growth in Life Science driven by Process Solutions
•Slight organic decline in Performance Materials confirms expected destocking in display supply chain
•Portfolio reflects Sigma and Kuvan
Healthcare 5.4%
Organic Currency
-6.8%
Life Science
Performance Materials
Merck Group
Portfolio Total
-1.0% -2.4%
8.9% -1.3% 81.6% 89.3%
-2.4% 0.5% 2.7% 0.9%
4.7% -4.0% 19.8% 20.5%
Q1 2016 YoY net sales
Q1 YoY EBITDA pre contributors [€ m]
Q1 2015 Healthcare Life Science Performance Materials
Corporate & Other
Q1 2016
853 +47 +209 -3 -22 1,084
•HC benefits from solid organic growth, Rebif commission savings and R&D phasing
•Life Science driven by Sigma, strong organic growth and positive product mix
•Performance Materials slightly lower due to product mix
•Corporate EBITDA pre contains hedging and investments in corporate initiatives
7
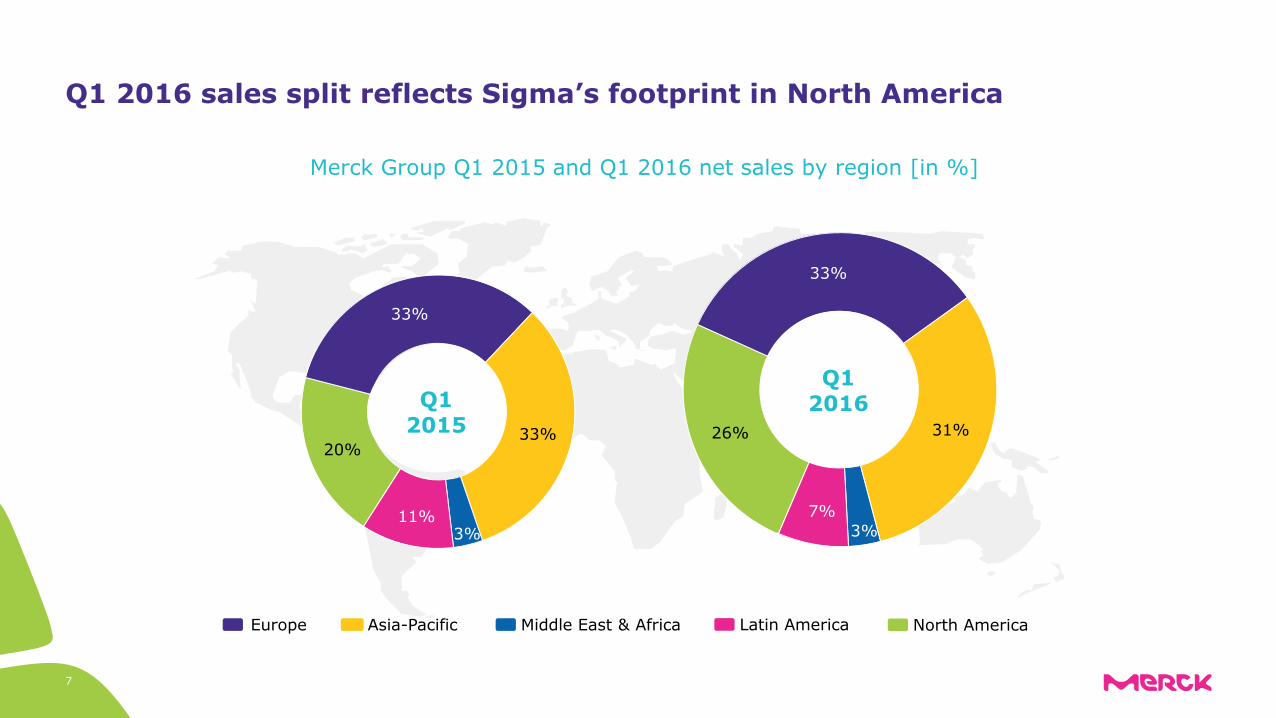
Q1 2016 sales split reflects Sigma’s footprint in North America
Merck Group Q1 2015 and Q1 2016 net sales by region [in %]
20%
33%
33%
3% 11%
Q1 2015 26%
33%
31%
3% 7%
Q1 2016
Middle East & Africa Asia-Pacific Europe Latin America North America
Totals may not add up due to rounding 8
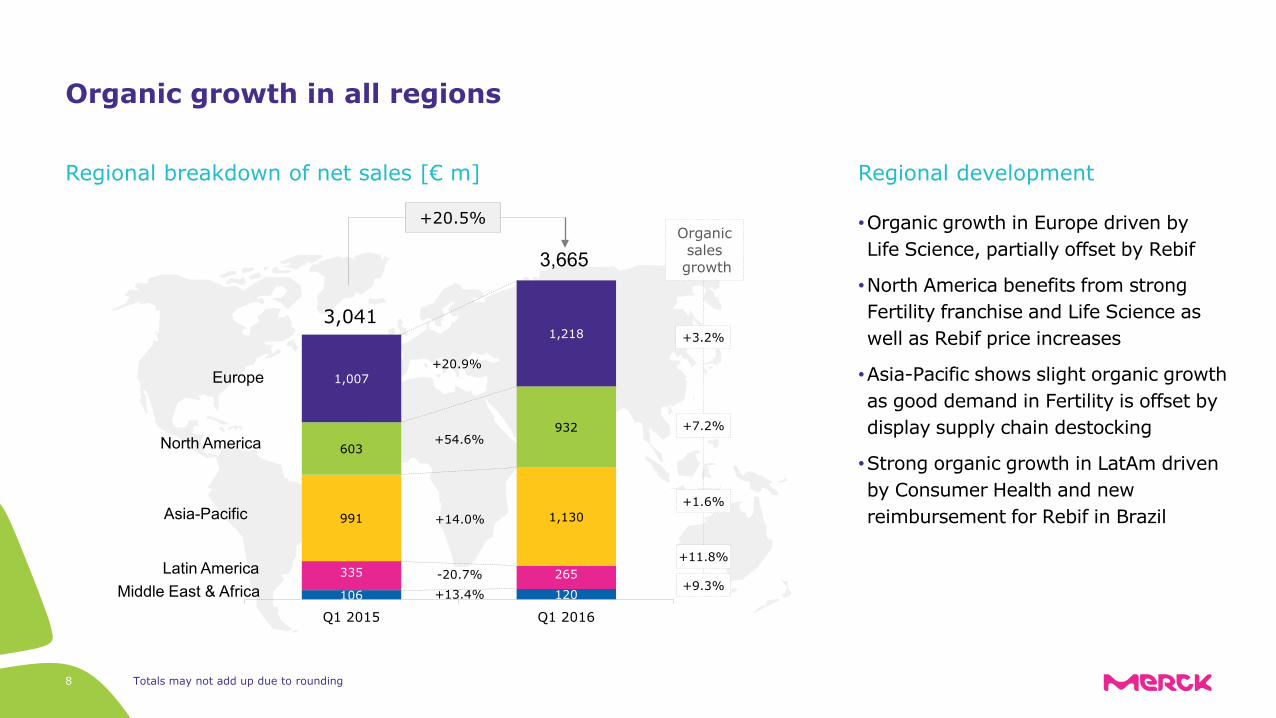
Organic growth in all regions
3,041
3,665
Organic sales
growth
+3.2%
+9.3%
+1.6%
+7.2%
Europe
+20.5%
+20.9%
+54.6%
+14.0%
-20.7%
North America
Asia-Pacific
Latin America
Middle East & Africa
+11.8%
+13.4%
Regional breakdown of net sales [€ m]
•Organic growth in Europe driven by Life Science, partially offset by Rebif
•North America benefits from strong Fertility franchise and Life Science as well as Rebif price increases
•Asia-Pacific shows slight organic growth as good demand in Fertility is offset by display supply chain destocking
•Strong organic growth in LatAm driven by Consumer Health and new reimbursement for Rebif in Brazil
Regional development
106 120
335 265
991 1,130
603
932
1,007
1,218
Q1 2015 Q1 2016

FINANCIAL OVERVIEW
10
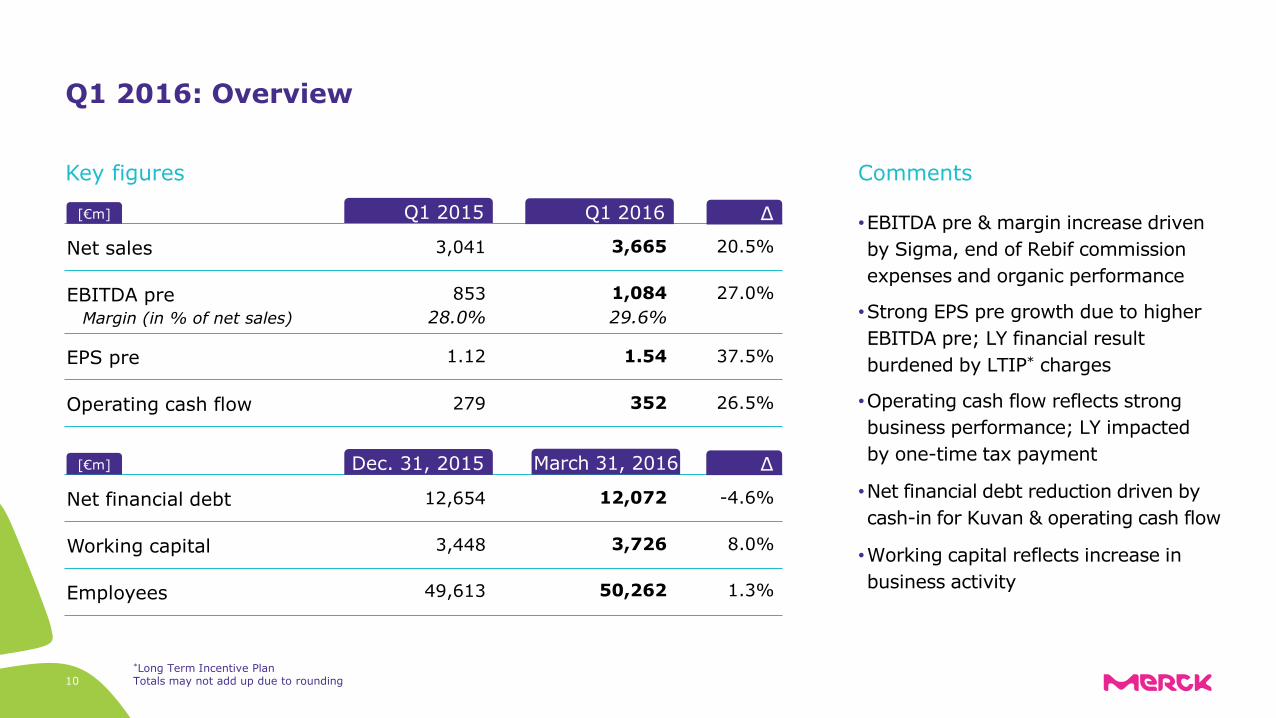
Q1 2016: Overview
Net sales
Q1 2015
3,041
EBITDA pre
EPS pre
Operating cash flow
Q1 2016 Δ
3,665 20.5%
853 1,084 27.0%
1.12 1.54 37.5%
279 352 26.5%
•EBITDA pre & margin increase driven by Sigma, end of Rebif commission expenses and organic performance
•Strong EPS pre growth due to higher EBITDA pre; LY financial result burdened by LTIP* charges
•Operating cash flow reflects strong business performance; LY impacted by one-time tax payment
•Net financial debt reduction driven by cash-in for Kuvan & operating cash flow
•Working capital reflects increase in business activity
Comments
[€m]
Margin (in % of net sales) 28.0% 29.6%
Net financial debt 12,654
Working capital
Employees
Δ
12,072 -4.6%
3,448 3,726 8.0%
49,613 50,262 1.3%
Dec. 31, 2015
Key figures
[€m] March 31, 2016
*Long Term Incentive Plan Totals may not add up due to rounding
11
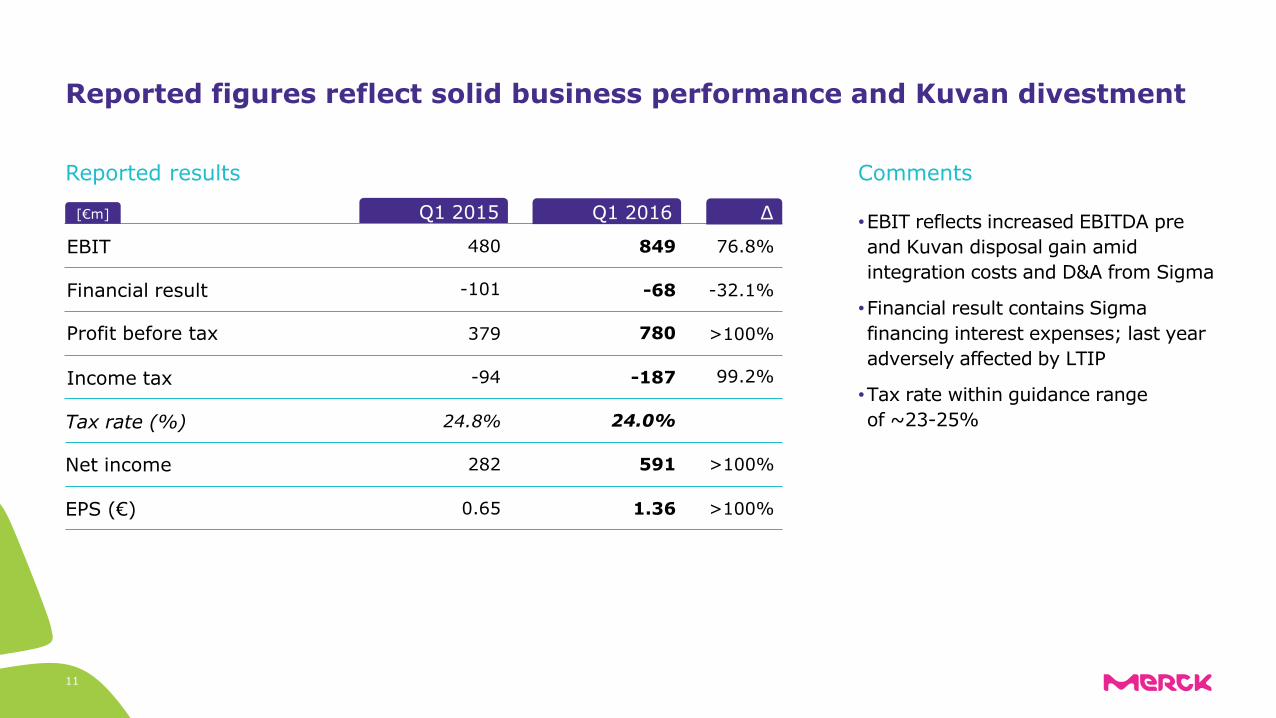
Reported figures reflect solid business performance and Kuvan divestment
EBIT
Q1 2015
480
Q1 2016 Δ
849 76.8% •EBIT reflects increased EBITDA pre and Kuvan disposal gain amid integration costs and D&A from Sigma
•Financial result contains Sigma financing interest expenses; last year adversely affected by LTIP
•Tax rate within guidance range of ~23-25%
Comments
[€m]
Financial result
Profit before tax
Income tax
Tax rate (%)
Net income
EPS (€)
24.8% 24.0%
282 591 >100%
0.65 1.36 >100%
-101 -68 -32.1%
379 780 >100%
-94 -187 99.2%
Reported results
12
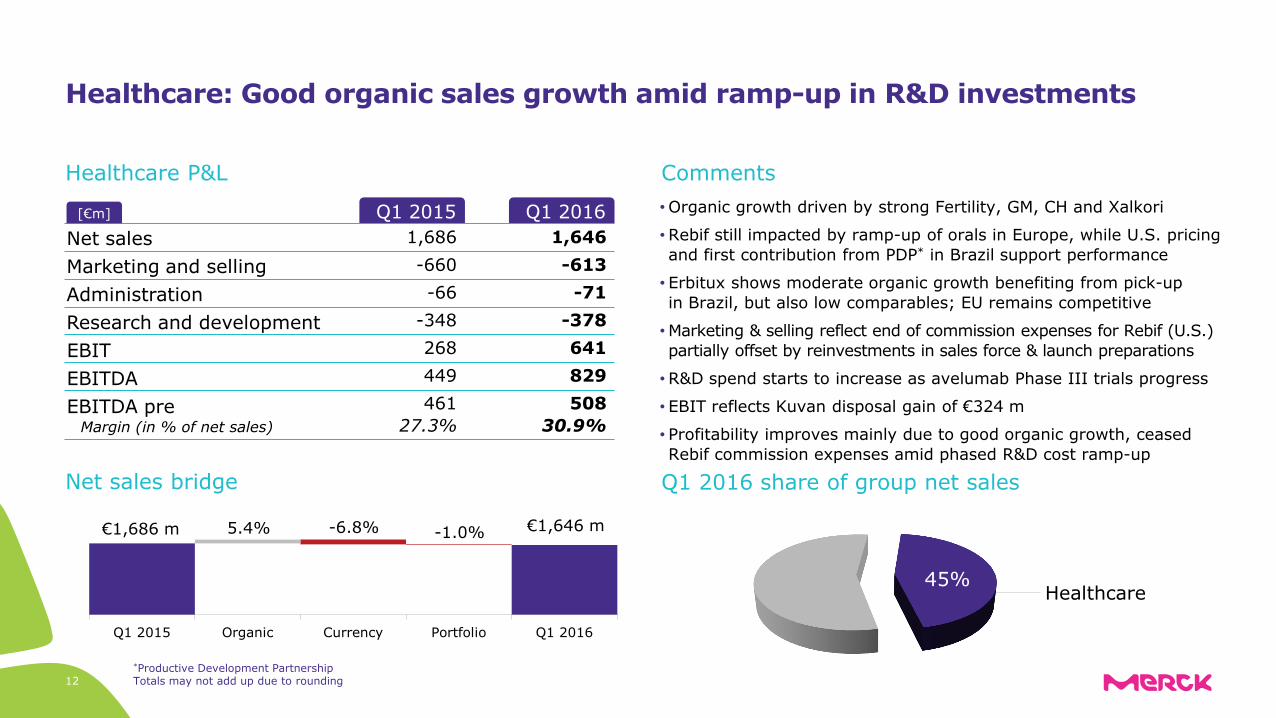
Healthcare: Good organic sales growth amid ramp-up in R&D investments
•Organic growth driven by strong Fertility, GM, CH and Xalkori
•Rebif still impacted by ramp-up of orals in Europe, while U.S. pricing and first contribution from PDP* in Brazil support performance
• Erbitux shows moderate organic growth benefiting from pick-up in Brazil, but also low comparables; EU remains competitive
•Marketing & selling reflect end of commission expenses for Rebif (U.S.) partially offset by reinvestments in sales force & launch preparations
•R&D spend starts to increase as avelumab Phase III trials progress
• EBIT reflects Kuvan disposal gain of €324 m
• Profitability improves mainly due to good organic growth, ceased Rebif commission expenses amid phased R&D cost ramp-up
Net sales Q1 2015 Q1 2016
1,646
Marketing and selling Administration Research and development
-71
641
508
Healthcare P&L
Net sales bridge
EBIT EBITDA EBITDA pre
-613
-378
829
1,686
-66
268
461
-660
-348
449
Margin (in % of net sales)
Q1 2015 Organic Currency Portfolio Q1 2016
5.4% -6.8% -1.0% €1,686 m €1,646 m
Comments
Q1 2016 share of group net sales
30.9% 27.3%
[€m]
45% Healthcare
*Productive Development Partnership Totals may not add up due to rounding

13
Life Science: A strong start to 2016
•Very strong growth of Process Solutions driven by increasing production of large molecules across global and regional accounts
•Applied Solutions shows moderate organic growth, driven by bio-monitoring products for pharma & demand for analytical testing
•Research Solutions benefits from increased research on biologics as well as solid demand for high-value chemicals
•Absolute costs higher due to Sigma, but improve in relation to sales
• Profitability reflects Sigma, favorable product mix and synergies
Net sales 1,397
Marketing and selling Administration Research and development
-63
105
393
Life Science P&L
Net sales bridge
EBIT EBITDA EBITDA pre
-421
-62
284
738
-31
83
184
-233
-45
164
Margin (in % of net sales)
Comments
Q1 2016 share of group net sales
28.1% 25.0%
Q1 2015 Organic Currency Portfolio Q1 2016
8.9% -1.3%
81.6%
€738 m
€1,397 m
Life Science 38%
Q1 2015 Q1 2016 [€m]
Totals may not add up due to rounding

14
Performance Materials: Healthy profitability amid destocking of display industry inventories
•Organic growth of OLED, ICM, and Pigments mitigates LC softness
• Liquid Crystals impacted by indicated inventory correction in supply chain
•OLED continues to grow on industry capacity expansion & investments
• Integrated Circuit Materials (ICM) show solid growth mainly driven by dielectric materials for chip production
• Pigments & Functionals post moderate growth esp. due to cosmetic API*
•Marketing & selling reflect contribution from Sigma’s SAFC Hitech and sales force IT initiative
•Healthy profitability reflects leading market position with highly differentiated products, despite destocking and negative mix effects
Net sales 622
Marketing and selling Administration Research and development
-16
207
273
Performance Materials P&L
Net sales bridge
EBIT EBITDA EBITDA pre
-58
-48
267
617
-18
214
277
-46
-47
273
Margin (in % of net sales)
Comments
Q1 2016 share of group net sales
43.9% 44.8%
Q1 2015 Organic Currency Portfolio Q1 2016
-2.4% 0.5% 2.7% €617 m €622 m
Performance Materials
17%
Q1 2015 Q1 2016 [€m]
*Active pharmaceutical ingredient Totals may not add up due to rounding

7.7 7.5
1.8 2.3 1.9 1.8
13.7 13.1
12.9 12.6
Dec. 31, 2015 March 31, 2016
Totals may not add up due to rounding 15
Balance sheet – deleveraging initiated after Sigma acquisition
• Total assets decline by 2.2%, equity ratio remains at 33.8%
• Reduction of intangible assets reflects D&A (€0.3 bn) and FX (€0.6 bn)
• FX development accounts for ~€0.6 bn total equity decrease
•Net financial debt reduced by €0.6 bn
•Decline of interest rates increases pension provisions
2.2 2.3
4.0 3.9
25.3 24.4
2.6 2.6
2.7 2.9
1.1 [VALUE].0
Dec. 31, 2015 March 31, 2016
Intangible assets
Inventories
Other assets
Property, plant & equipment
Receivables
Cash & marketable securities
Net equity
38.0 38.0
Assets [€ bn] Liabilities [€ bn]
Financial debt
Provisions for pensions
Other liabilities
Payables
37.2 37.2

Totals may not add up due to rounding 16
Healthy operating cash flow enables first deleveraging measures
Profit after tax
Q1 2015 285
Q1 2016 Δ 593 308
•Profit after tax includes gain from Kuvan divestment, which is neutralized in other operating activities •D&A increases due to Sigma •Tax payment (Pfizer upfront) burdened changes in other assets/liabilities LY •Changes in working capital reflect lower payables (Pfizer-Rebif) and higher R&D receivables from Pfizer (avelumab) • Investing cash flow contains increased Capex and Kuvan divestment; LY with sale of financial assets •Financing cash flow reflects first re-payments of Sigma-related bank loans; LY contains USD bond issuance
Cash flow drivers
D&A
Changes in provisions
Changes in other assets/liabilities
Other operating activities
Changes in working capital
Operating cash flow
-20 -394
-172 -266 -94
279 352 73
325 433 108
90 21 -69
-231 -34 197
Investing cash flow
thereof Capex on PPE
Financing cash flow
392
-75
2,288
284
-160 -85
-572 -2,860
[€m]
Q1 2016 – cash flow statement
-374
-108

GUIDANCE
18
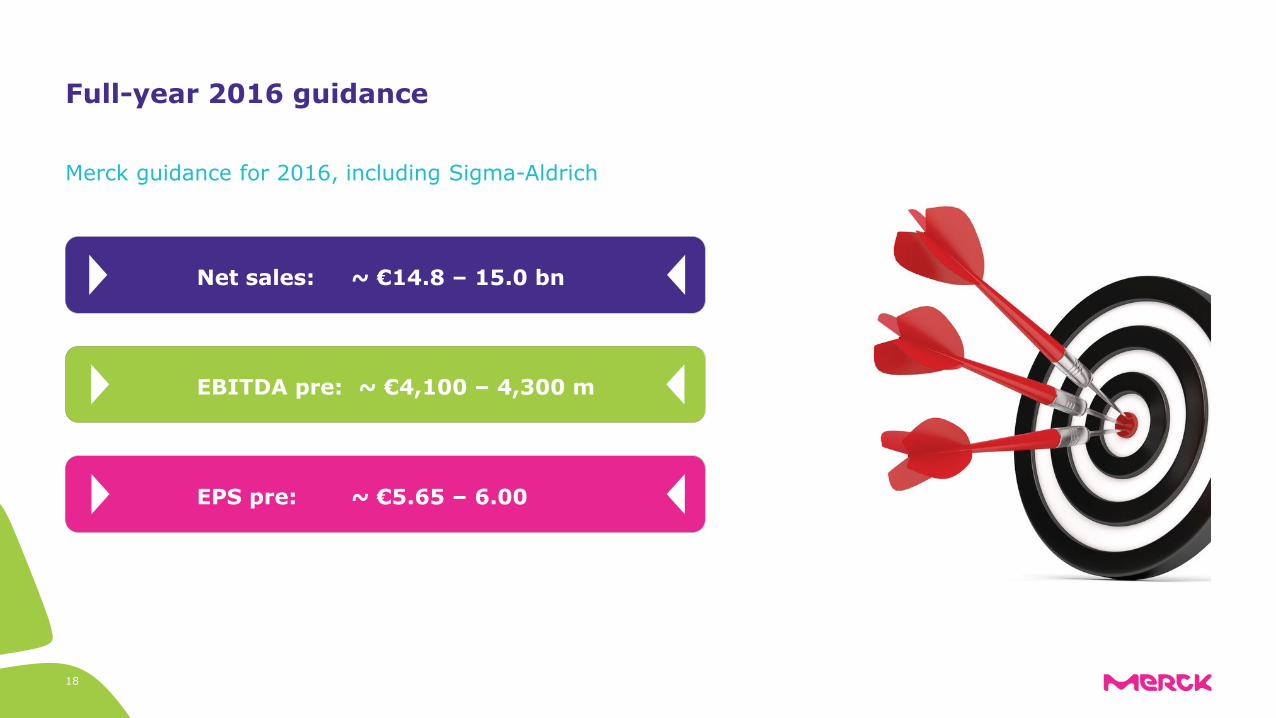
Full-year 2016 guidance
Net sales: ~ €14.8 – 15.0 bn
EBITDA pre: ~ €4,100 – 4,300 m
EPS pre: ~ €5.65 – 6.00
Merck guidance for 2016, including Sigma-Aldrich
19
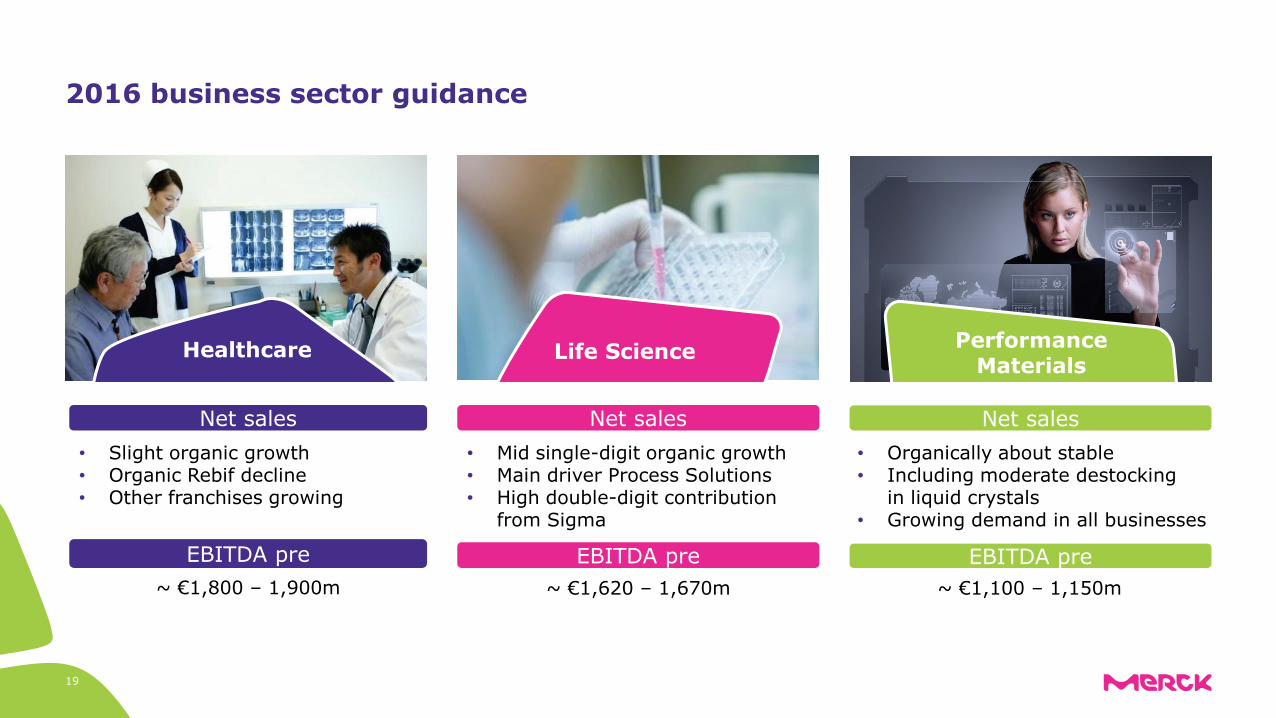
2016 business sector guidance
EBITDA pre
Life Science Performance Materials
Healthcare
Net sales
EBITDA pre
Net sales
EBITDA pre
Net sales • Mid single-digit organic growth • Main driver Process Solutions • High double-digit contribution
from Sigma
• Organically about stable • Including moderate destocking
in liquid crystals • Growing demand in all businesses
• Slight organic growth • Organic Rebif decline • Other franchises growing
~ €1,800 – 1,900m ~ €1,100 – 1,150m ~ €1,620 – 1,670m


APPENDIX
22
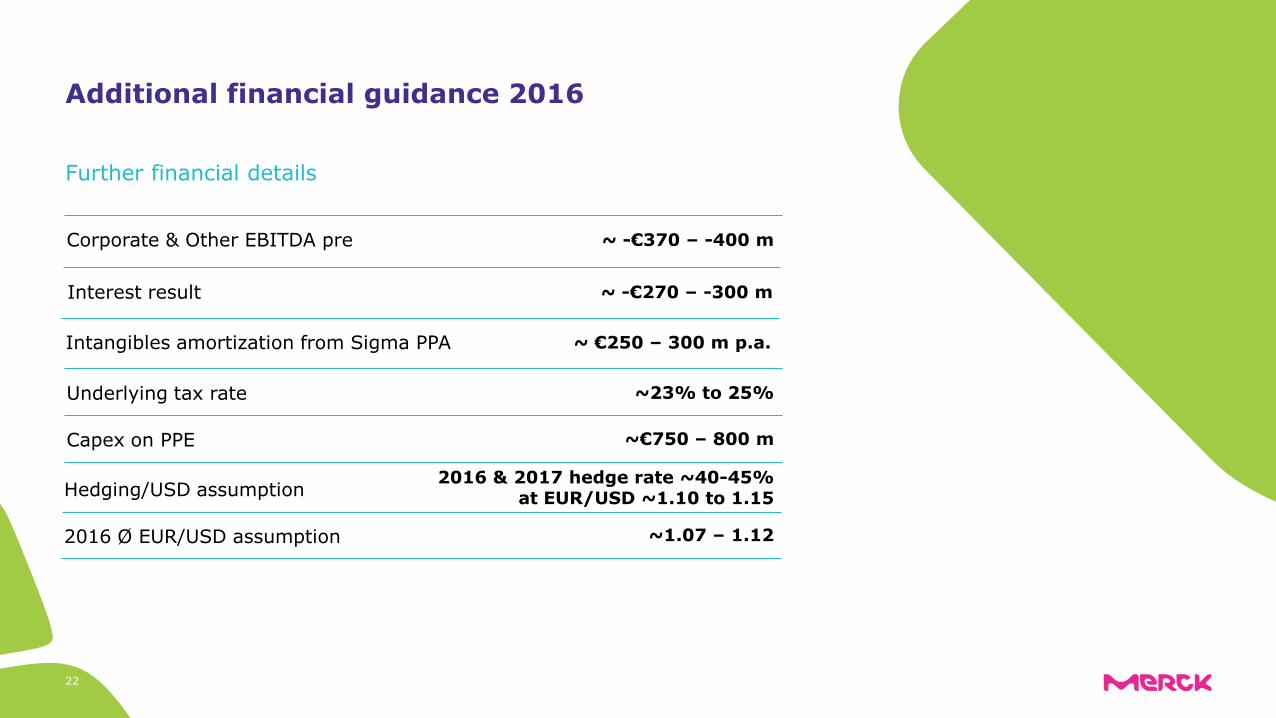
Additional financial guidance 2016
Further financial details
Corporate & Other EBITDA pre
Underlying tax rate
Capex on PPE
Hedging/USD assumption
2016 Ø EUR/USD assumption
2016 & 2017 hedge rate ~40-45% at EUR/USD ~1.10 to 1.15
~1.07 – 1.12
~ -€370 – -400 m
~23% to 25%
~€750 – 800 m
Interest result ~ -€270 – -300 m
Intangibles amortization from Sigma PPA ~ €250 – 300 m p.a.
23
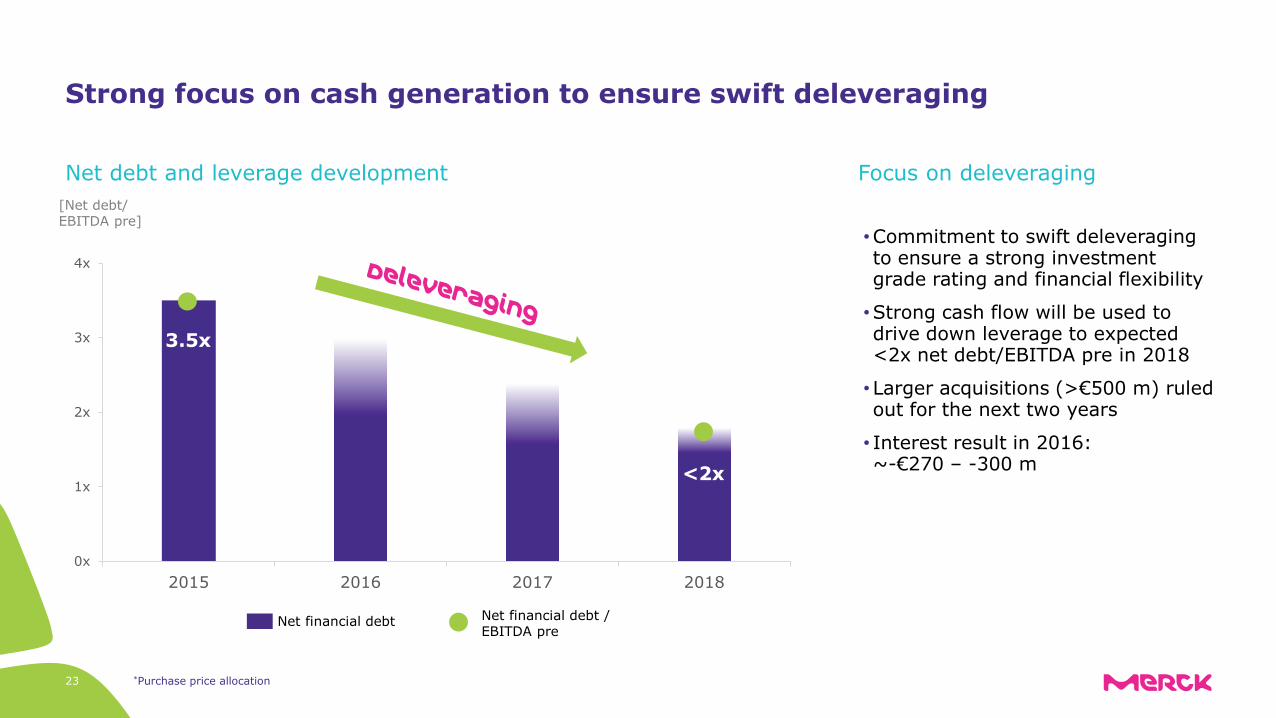
Strong focus on cash generation to ensure swift deleveraging
0x
1x
2x
3x
4x
2015 2016 2017 2018
[Net debt/ EBITDA pre]
•Commitment to swift deleveraging to ensure a strong investment grade rating and financial flexibility
•Strong cash flow will be used to drive down leverage to expected <2x net debt/EBITDA pre in 2018
•Larger acquisitions (>€500 m) ruled out for the next two years
• Interest result in 2016: ~-€270 – -300 m
Focus on deleveraging Net debt and leverage development
3.5x
<2x
Net financial debt Net financial debt / EBITDA pre
*Purchase price allocation
24
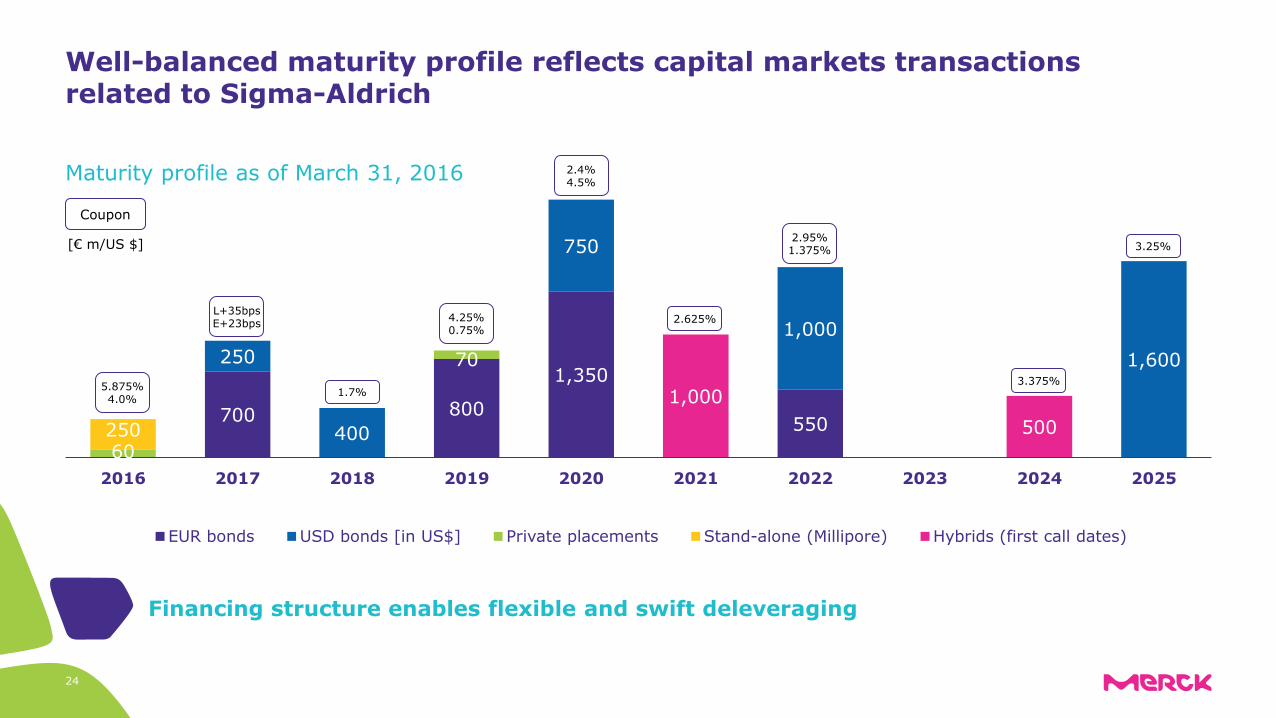
Well-balanced maturity profile reflects capital markets transactions related to Sigma-Aldrich
Financing structure enables flexible and swift deleveraging
700 800
1,350
550
250
400
750
1,000 1,600
60
70
250
1,000 500
2016 2017 2018 2019 2020 2021 2022 2023 2024 2025
EUR bonds USD bonds [in US$] Private placements Stand-alone (Millipore) Hybrids (first call dates)
5.875% 4.0%
L+35bps E+23bps
1.7%
2.4% 4.5%
2.625%
3.375%
4.25% 0.75%
2.95% 1.375% 3.25%
Coupon
Maturity profile as of March 31, 2016
[€ m/US $]
25
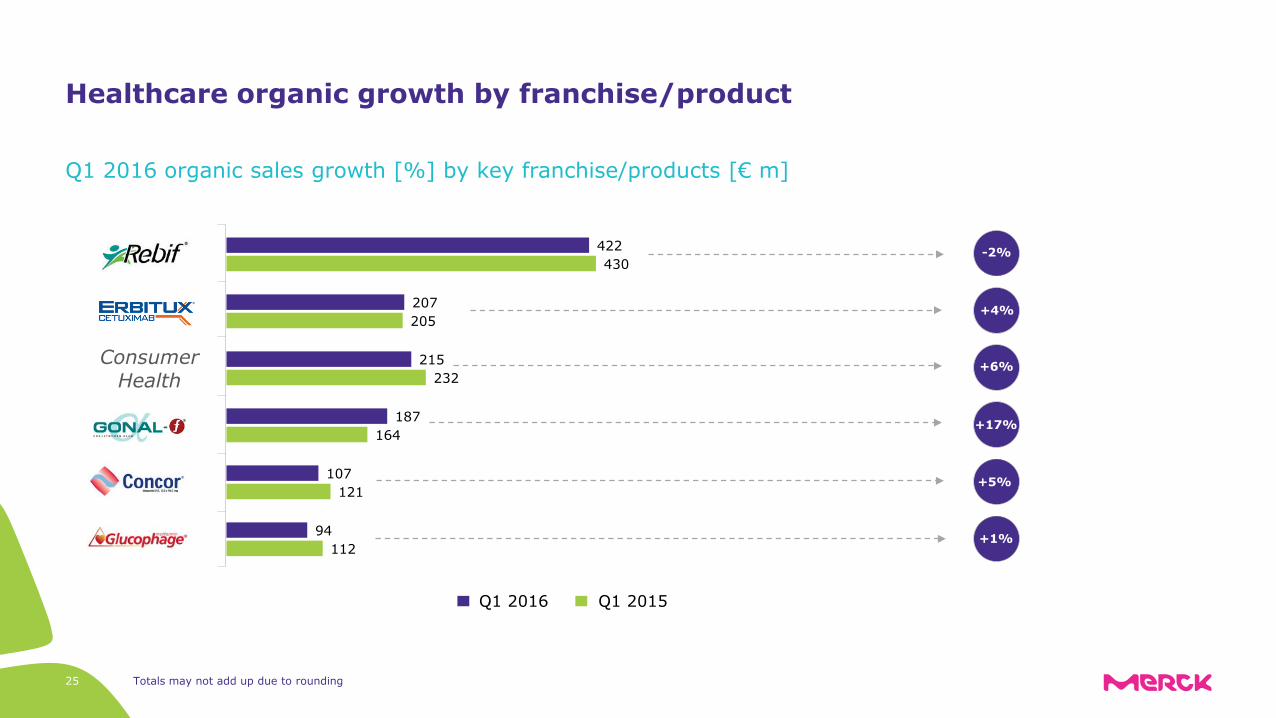
Healthcare organic growth by franchise/product
Q1 2016 organic sales growth [%] by key franchise/products [€ m]
Q1 2016 Q1 2015
112
121
164
232
205
430
94
107
187
215
207
422 -2%
+4%
+6%
+5%
+1%
Consumer Health
Totals may not add up due to rounding
+17%

100
150
200
Q1 2015 Q2 2015 Q3 2015 Q4 2015 Q1 2016
26
Rebif: Relief in the U.S. – competitive ramp-up in Europe ongoing
Europe
Price
Volume
FX
Price
Volume
1.6% org.
-13.1% org.
150
225
300
Q1 2015 Q2 2015 Q3 2015 Q4 2015 Q1 2016
Price increase
North America
Price increase
Price increase
•Rebif sales of €422 m in Q1 2016 reflect organic decline of -1.5% and negative FX effects from LatAm
•Market shares within interferons stable due to high retention rates and known long-term track record
•U.S. price increases and market share stabilization outweigh decline of interferon class
•Phased market entry of orals in Europe causes ongoing volume decline
•Initiation of Productive Development Partnership (PDP) in Brazil supports Rebif growth
Rebif performance Rebif sales evolution
Q1 drivers
Q1 drivers [€ m]
[€ m]
Phas
e I
Reg
istr
atio
nal
Ongoing trials Planned trials in 2016
Solid tumors
Dose escalation
and expansion
phase
Completed efficacy N=150 / cohort NSCLC 1L Gastric mBreast NSCLC 2L
Signal detection N=50 / cohort CRC CRPC Ovarian Melanoma Urothelial/
Bladder Meso-
thelioma ACC
Ovarian SCCHN Expanded efficacy
N=100-150 / cohort
RCC
Bladder Gastric 3L
avelumab+Inlyta RCC 1L1
Hodgkins Lymphoma1
avelumab MCC 2L2
avelumab NSCLC 2L
avelumab MCC 1L
avelumab NSCLC 1L (PDL1+)
avelumab+Chemo Bladder 1L MN
avelumab+Chemo Gastric 1L MN
avelumab+Chemo Gastric 3L
avelumab+Chemo Ovarian 2L Plat Res/Ref
Additional studies in planning
Additional studies in planning
avelumab+4-1BB NSCLC, SCCHN, Melanoma1
Combination trials
RCC 1L/2L
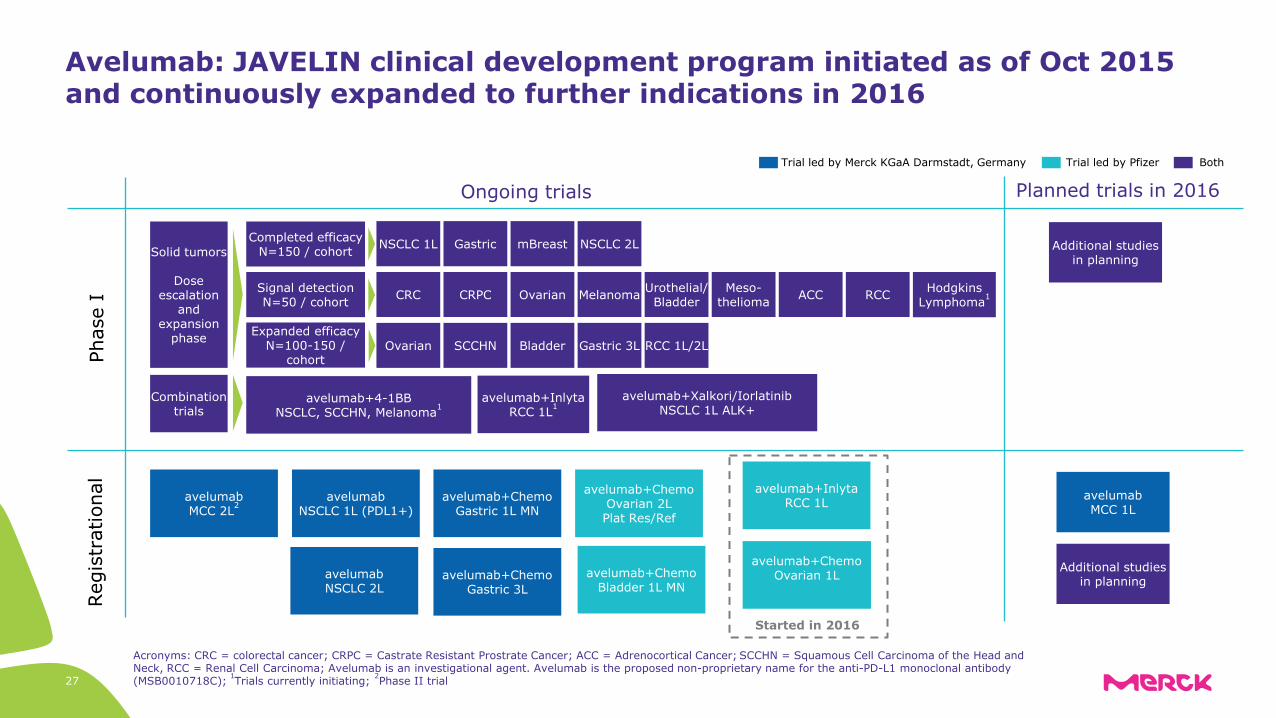
Acronyms: CRC = colorectal cancer; CRPC = Castrate Resistant Prostrate Cancer; ACC = Adrenocortical Cancer; SCCHN = Squamous Cell Carcinoma of the Head and Neck, RCC = Renal Cell Carcinoma; Avelumab is an investigational agent. Avelumab is the proposed non-proprietary name for the anti-PD-L1 monoclonal antibody (MSB0010718C); 1Trials currently initiating; 2Phase II trial 27
Trial led by Pfizer Both Trial led by Merck KGaA Darmstadt, Germany
Avelumab: JAVELIN clinical development program initiated as of Oct 2015 and continuously expanded to further indications in 2016
avelumab+Inlyta RCC 1L
avelumab+Chemo Ovarian 1L
Started in 2016
avelumab+Xalkori/Iorlatinib NSCLC 1L ALK+

All cohorts are part of the Phase I trial solid tumors: JAVELIN Solid Tumor NCT01772004 *To date; source: ASCO abstracts
28
ASCO: We look forward to presenting the results from our avelumab trials at the upcoming scientific meeting in further detail*
• Single-agent avelumab showed clinical activity • Higher trend in PD-L1+ patients suggested • Phase 3 trial is underway (JAVELIN LUNG 100)
• Single-agent avelumab showed clinical activity in heavily pre-treated patients • Largest reported dataset of patients with advanced ovarian cancer treated with anti-PD-L1 as of today
• Phase 3 trials are underway (JAVELIN OVARIAN 100 and 200)
• Treatment with avelumab as a 1st line maintenance and 2nd line treatment showed clinical activity • Largest reported dataset of patients with advanced gastric cancer treated with anti-PD-L1 as of today
• Disease control rate was also observed in a SwM (switch-maintenance therapy) group
• Treatment with avelumab showed clinical activity • Phase 3 trial is underway (JAVELIN BLADDER 100)
• Largest reported dataset of patients with advanced unresectable tumors treated with anti-PD-(L)1 as of today • Treatment with avelumab showed clinical activity in pre-treated patients
5 Urothelial / Bladder
6 Mesothelioma
4 Gastric (1L MN & 2L)
3 Ovarian
2 NSCLC (1L)
• First study to date of an anti-PD-(L)1 agent in this rare tumor type (advanced adrenocortical carcinoma) • Treatment with avelumab showed clinical activity in pre-treated patients
7 mACC
1 MCC (2L+)
• Largest trial of a PD(L)1 agent in Merkel cell carcinoma as of today • Clinical activity with durable responses in high unmet-need patient population
(previously treated with chemotherapy)
29
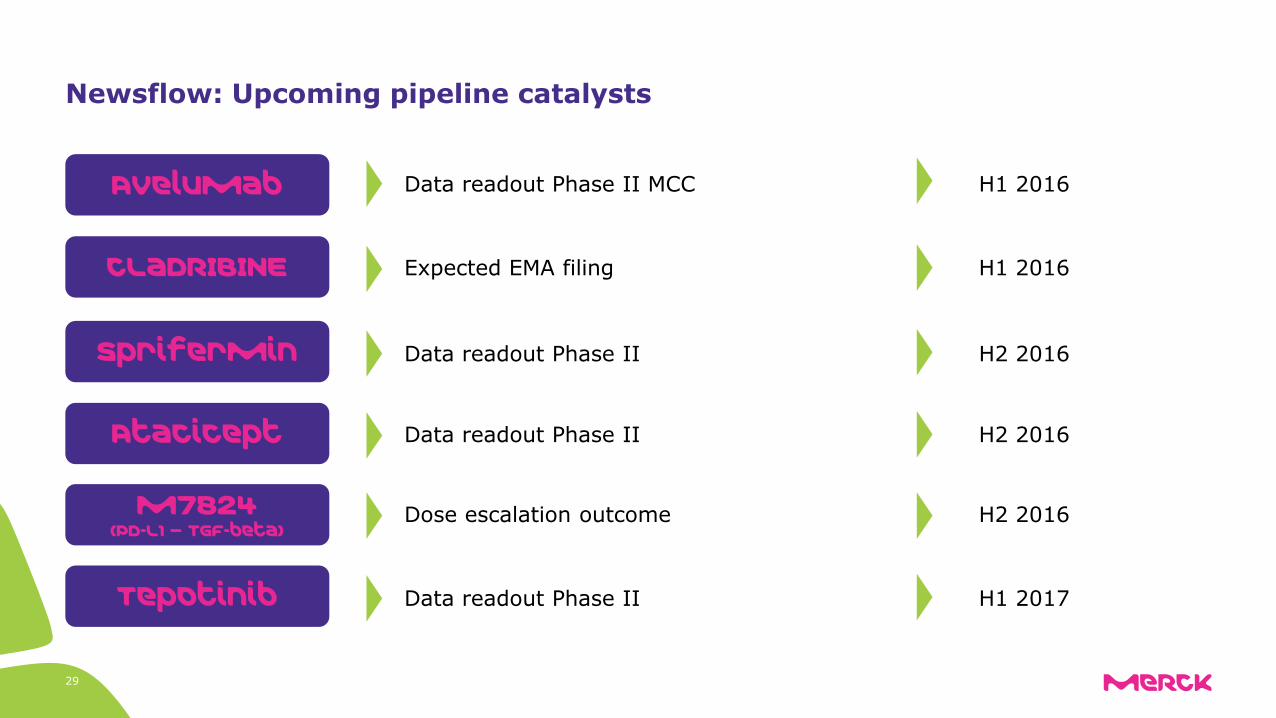
Newsflow: Upcoming pipeline catalysts
Data readout Phase II MCC H1 2016 Avelumab
Data readout Phase II H2 2016 Atacicept
Expected EMA filing H1 2016 CLaDRIBINE
Dose escalation outcome H2 2016 M7824 (PD-L1 – TGF-beta)
Tepotinib Data readout Phase II H1 2017
Data readout Phase II H2 2016 sprifermin
0
50
100
150
200
250
Q1 2015 Q2 2015 Q3 2015 Q4 2015 Q1 2016
Europe Middle East & Africa Asia-Pacific Latin America
30
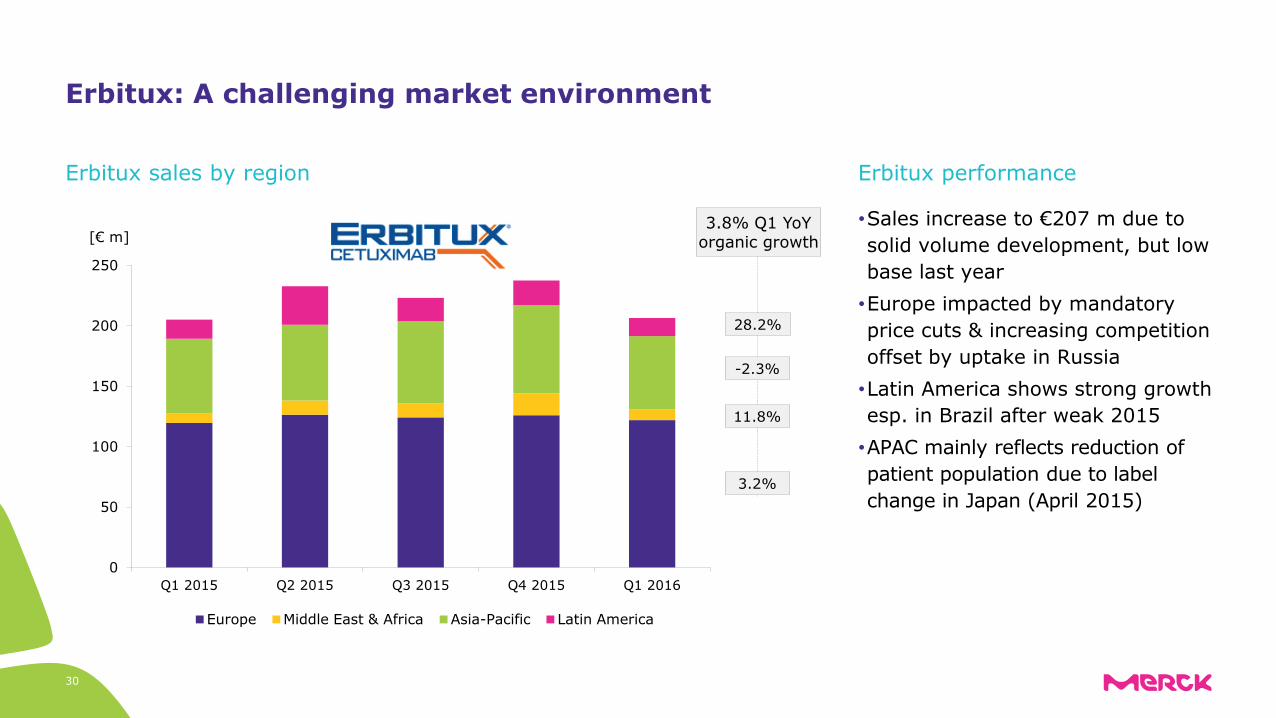
Erbitux: A challenging market environment
•Sales increase to €207 m due to solid volume development, but low base last year •Europe impacted by mandatory price cuts & increasing competition offset by uptake in Russia •Latin America shows strong growth esp. in Brazil after weak 2015 •APAC mainly reflects reduction of patient population due to label change in Japan (April 2015)
Erbitux performance Erbitux sales by region
[€ m] 3.8% Q1 YoY
organic growth
3.2%
11.8%
-2.3%
28.2%

31
Strong organic growth in Fertility, General Medicine and Endocrinology
Endocrinology
Organic
Fertility • Record quarter for Fertility (17% org.) driven by favorable competitive situation in U.S. and strong China
• Sales drop in Endocrinology reflects Kuvan divestment; remaining portfolio (Saizen, Serostim) growing organically
• General Medicine sales burdened by FX headwinds from LatAM, organic performance sustainably healthy
• Euthyrox posts strong growth driven by ongoing demand from China
• Glucophage benefits from successful repatriation in Russia; very strong comparables last year
Q1 drivers Sales evolution
180
220
260
Q1 2015 Q2 2015 Q3 2015 Q4 2015 Q1 2016
[€ m]
80
100
120
Q1 2015 Q2 2015 Q3 2015 Q4 2015 Q1 2016
[€ m]
Organic
General Medicine*
350 400 450 500
Q1 2015 Q2 2015 Q3 2015 Q4 2015 Q1 2016
[€ m]
Organic
*includes “CardioMetabolic Care & General Medicine and Others
32
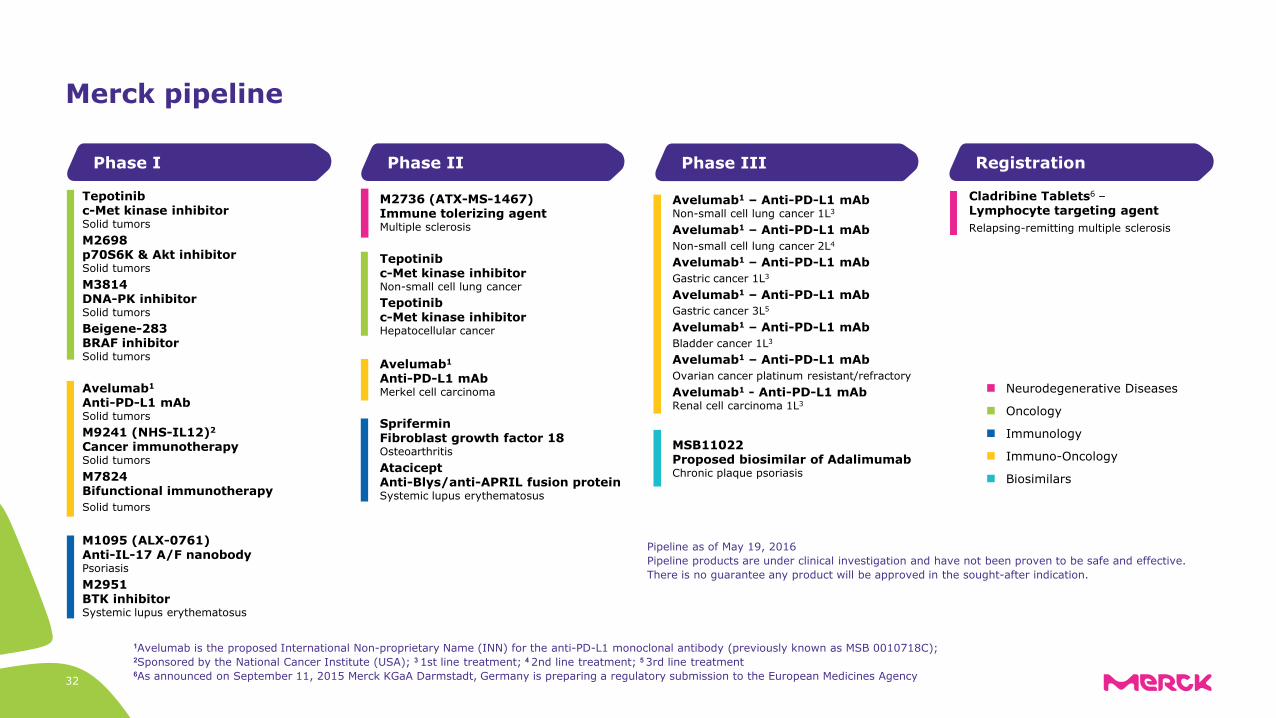
M2736 (ATX-MS-1467) Immune tolerizing agent Multiple sclerosis Tepotinib c-Met kinase inhibitor Non-small cell lung cancer Tepotinib c-Met kinase inhibitor Hepatocellular cancer Avelumab1
Anti-PD-L1 mAb Merkel cell carcinoma Sprifermin Fibroblast growth factor 18 Osteoarthritis Atacicept Anti-Blys/anti-APRIL fusion protein Systemic lupus erythematosus
Tepotinib c-Met kinase inhibitor Solid tumors M2698 p70S6K & Akt inhibitor Solid tumors M3814 DNA-PK inhibitor Solid tumors Beigene-283 BRAF inhibitor Solid tumors Avelumab1
Anti-PD-L1 mAb Solid tumors M9241 (NHS-IL12)2
Cancer immunotherapy Solid tumors M7824 Bifunctional immunotherapy Solid tumors M1095 (ALX-0761) Anti-IL-17 A/F nanobody Psoriasis M2951 BTK inhibitor Systemic lupus erythematosus
Registration Phase III Phase II Phase I
Cladribine Tablets6 – Lymphocyte targeting agent Relapsing-remitting multiple sclerosis
Pipeline as of May 19, 2016 Pipeline products are under clinical investigation and have not been proven to be safe and effective. There is no guarantee any product will be approved in the sought-after indication.
Neurodegenerative Diseases
Oncology
Immunology
Immuno-Oncology
Avelumab1 – Anti-PD-L1 mAb Non-small cell lung cancer 1L3
Avelumab1 – Anti-PD-L1 mAb Non-small cell lung cancer 2L4
Avelumab1 – Anti-PD-L1 mAb Gastric cancer 1L3
Avelumab1 – Anti-PD-L1 mAb Gastric cancer 3L5
Avelumab1 – Anti-PD-L1 mAb Bladder cancer 1L3
Avelumab1 – Anti-PD-L1 mAb Ovarian cancer platinum resistant/refractory
Avelumab1 - Anti-PD-L1 mAb Renal cell carcinoma 1L3
1Avelumab is the proposed International Non-proprietary Name (INN) for the anti-PD-L1 monoclonal antibody (previously known as MSB 0010718C); 2Sponsored by the National Cancer Institute (USA); 3 1st line treatment; 4 2nd line treatment; 5 3rd line treatment 6As announced on September 11, 2015 Merck KGaA Darmstadt, Germany is preparing a regulatory submission to the European Medicines Agency
Merck pipeline
32
MSB11022 Proposed biosimilar of Adalimumab Chronic plaque psoriasis
Biosimilars
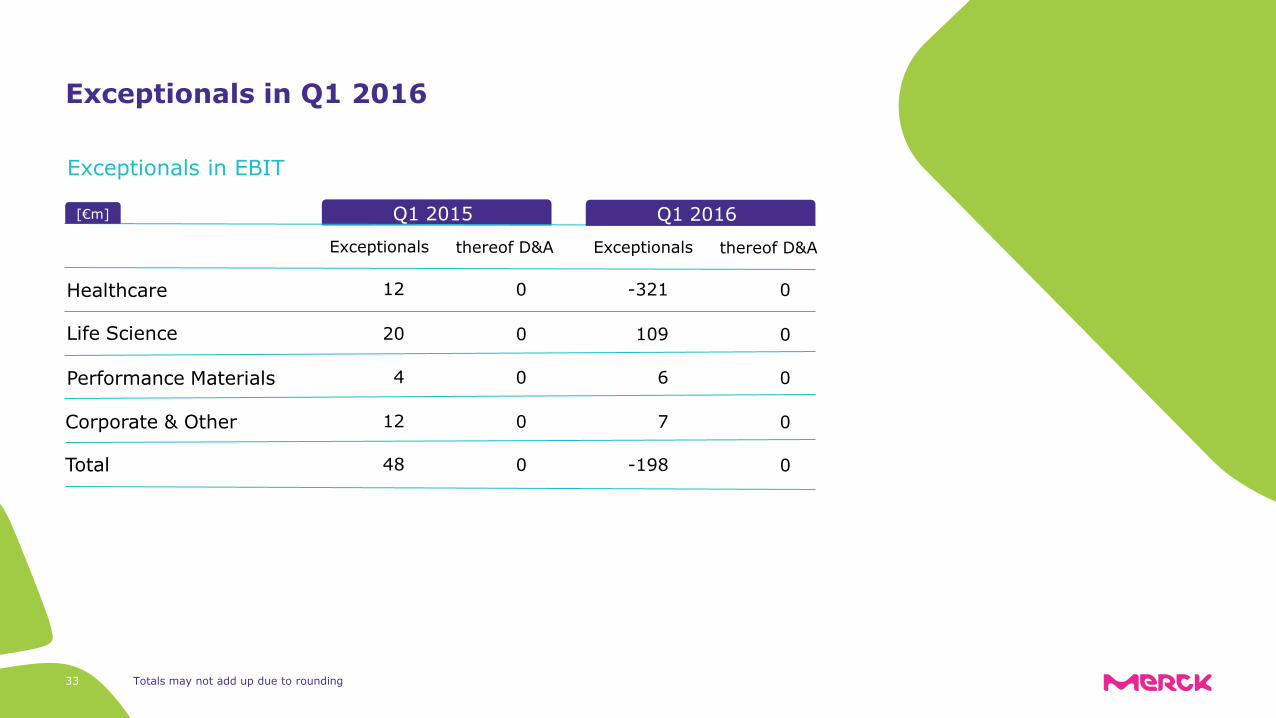
Totals may not add up due to rounding
Q1 2015
Exceptionals
[€m]
Healthcare
Life Science
Performance Materials
Corporate & Other
Total
12
48
12
20
4
Exceptionals in EBIT
thereof D&A
0
0
0
0
0
Q1 2016
Exceptionals
7
-198
-321
109
6
thereof D&A
0
0
0
0
0
33
Exceptionals in Q1 2016

34
Life Science: New reporting structure reflects customer-centric approach
New 2016 customer-centric structure 2015 product-centric structure
Lab Solutions
Process Solutions
Bioscience Research Solutions
Process Solutions
Applied Solutions
25%
38%
37%
New sales breakdown as of Q1 2016
Customer-centric business approach:
• Enhanced emphasis on customers’ unique needs
• Customized solutions for the specific needs of each segment from the start of product development to its completion

35
Financial calendar
Event Date
August 4, 2016 Q2 2016 Earnings release
November 15, 2016 Q3 2016 Earnings release
June 20, 2016 R&D Update Call
NEETHA MAHADEVAN
Life Science +49 6151 72-6328 [email protected]
MARKUS TALANOW
Financial Communications/ Performance Materials +49 6151 72-7144 [email protected]
Healthcare +49 6151 72-9591 [email protected]
Head of Group Communications (as of March 9) +49 6151 72-6698 [email protected]
GANGOLF SCHRIMPF
ISABEL DE PAOLI
SILKE KLOTZ
Assistant Media Relations +49 6151 72-4342 [email protected]
EMAIL: [email protected]
WEB: www.media.merck.de FAX: +49 6151 72-5000
Head of Media Relations +49 6151 72-62445 [email protected]
NICOLE MOMMSEN