


Idiomas
Páginas
Jurídico

Products and processes with microalgae
F. Gabriel Acién Fernández ([email protected])Dpt. Chemical Engineering, University of Almería, Spain
Malaga, September 26th, 2014
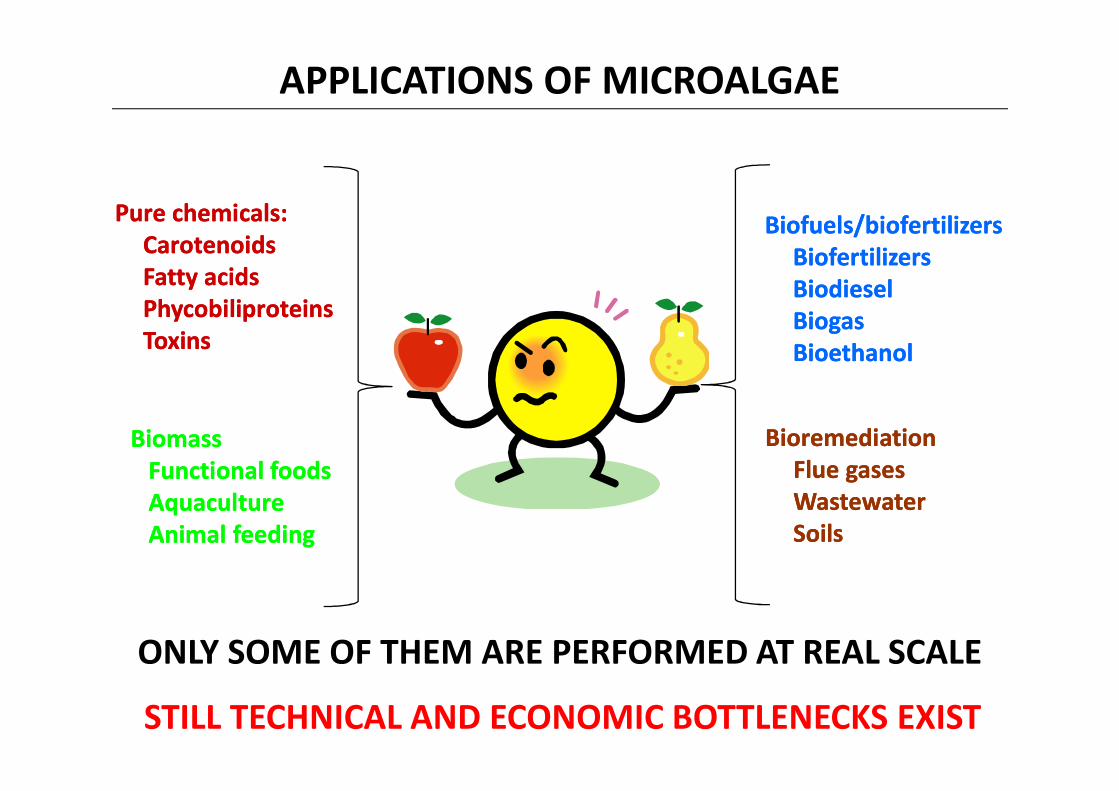
Pure chemicals:CarotenoidsFatty acidsPhycobiliproteinsToxins
Pure chemicals:CarotenoidsFatty acidsPhycobiliproteinsToxins
Biofuels/biofertilizersBiofertilizersBiodieselBiogasBioethanol
Biofuels/biofertilizersBiofertilizersBiodieselBiogasBioethanol
BiomassFunctional foodsAquacultureAnimal feeding
BiomassFunctional foodsAquacultureAnimal feeding
BioremediationFlue gasesWastewaterSoils
BioremediationFlue gasesWastewaterSoils
APPLICATIONS OF MICROALGAE
ONLY SOME OF THEM ARE PERFORMED AT REAL SCALE
STILL TECHNICAL AND ECONOMIC BOTTLENECKS EXIST

MARKETS
Biofuels, biofertilizers, wastewater treatment, etc… (Market size?)
High value products
Low value products
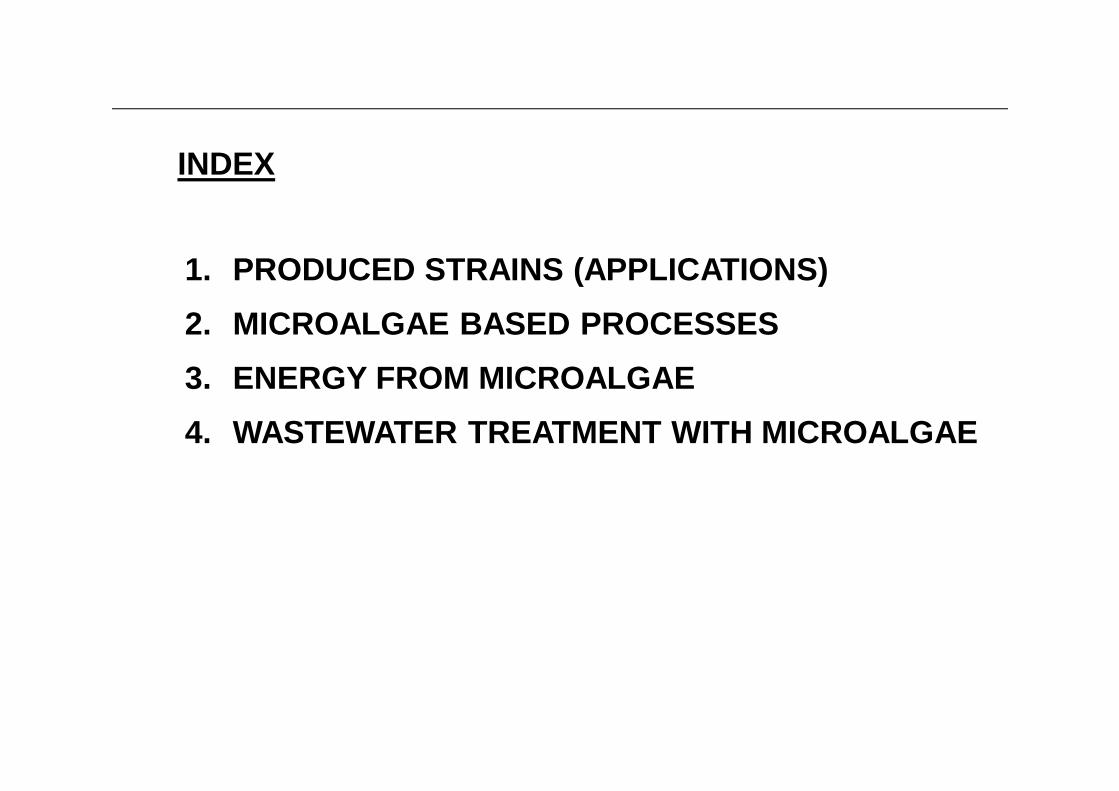
1. PRODUCED STRAINS (APPLICATIONS)2. MICROALGAE BASED PROCESSES3. ENERGY FROM MICROALGAE4. WASTEWATER TREATMENT WITH MICROALGAE
INDEX

1. PRODUCED STRAINS
Although thousands species are know, only a few are used commercially
Nannochloropsis Isochrysis
Utilization of consortiums is usually disregarded
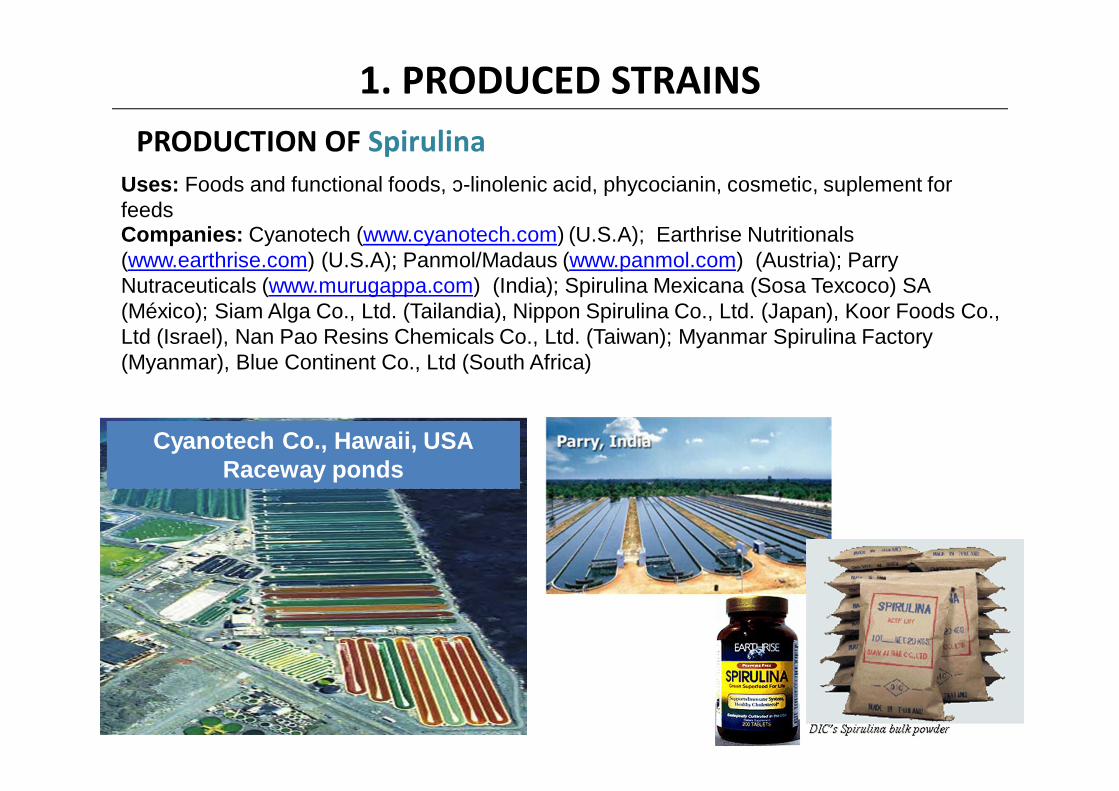
PRODUCTION OF SpirulinaUses: Foods and functional foods, γ-linolenic acid, phycocianin, cosmetic, suplement forfeedsCompanies: Cyanotech (www.cyanotech.com) (U.S.A); Earthrise Nutritionals(www.earthrise.com) (U.S.A); Panmol/Madaus (www.panmol.com) (Austria); ParryNutraceuticals (www.murugappa.com) (India); Spirulina Mexicana (Sosa Texcoco) SA (México); Siam Alga Co., Ltd. (Tailandia), Nippon Spirulina Co., Ltd. (Japan), Koor Foods Co., Ltd (Israel), Nan Pao Resins Chemicals Co., Ltd. (Taiwan); Myanmar Spirulina Factory(Myanmar), Blue Continent Co., Ltd (South Africa)
Cyanotech Co., Hawaii, USARaceway ponds
1. PRODUCED STRAINS
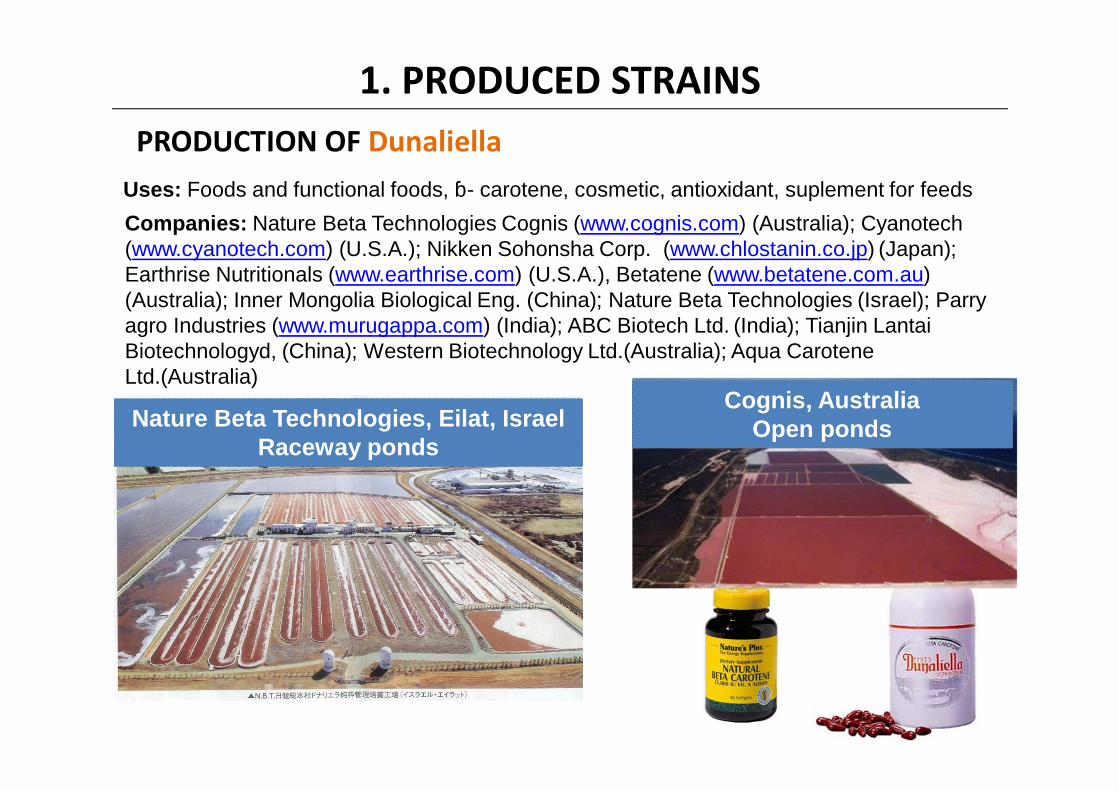
Uses: Foods and functional foods, β- carotene, cosmetic, antioxidant, suplement for feedsCompanies: Nature Beta Technologies Cognis (www.cognis.com) (Australia); Cyanotech(www.cyanotech.com) (U.S.A.); Nikken Sohonsha Corp. (www.chlostanin.co.jp) (Japan); Earthrise Nutritionals (www.earthrise.com) (U.S.A.), Betatene (www.betatene.com.au) (Australia); Inner Mongolia Biological Eng. (China); Nature Beta Technologies (Israel); Parry agro Industries (www.murugappa.com) (India); ABC Biotech Ltd. (India); Tianjin LantaiBiotechnologyd, (China); Western Biotechnology Ltd.(Australia); Aqua CaroteneLtd.(Australia)
Nature Beta Technologies, Eilat, IsraelRaceway ponds
Cognis, AustraliaOpen ponds
PRODUCTION OF Dunaliella
1. PRODUCED STRAINS
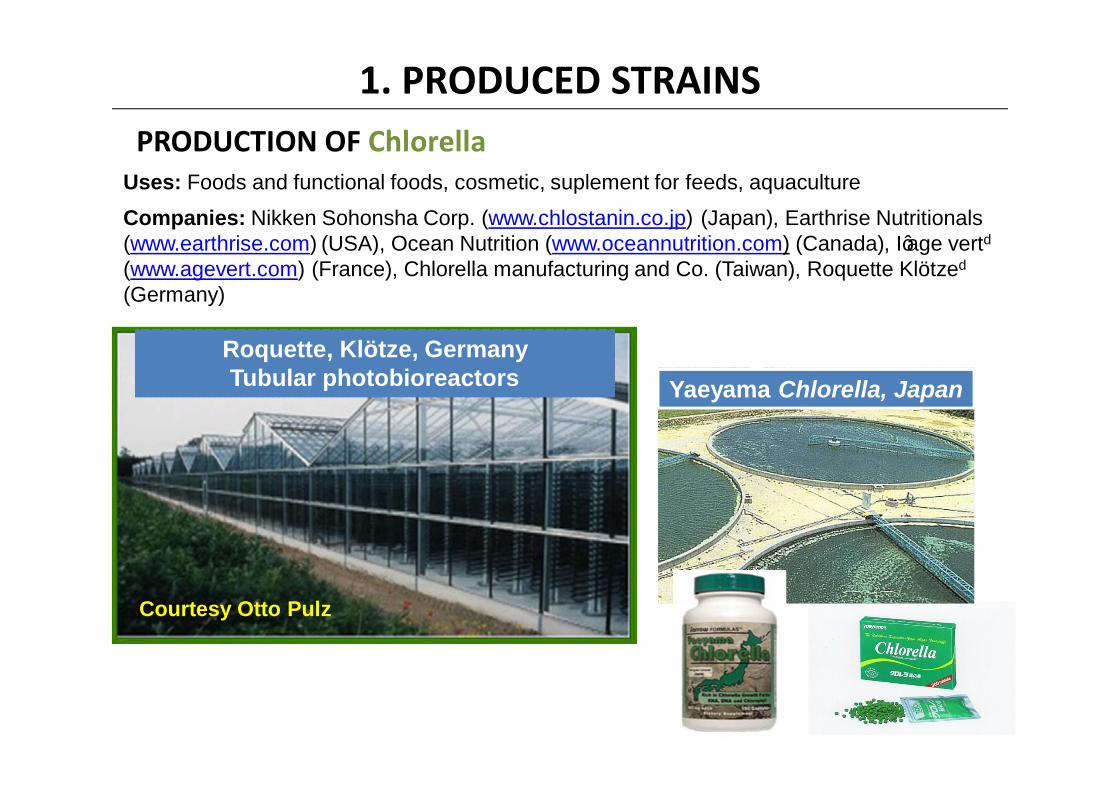
Uses: Foods and functional foods, cosmetic, suplement for feeds, aquaculture
Companies: Nikken Sohonsha Corp. (www.chlostanin.co.jp) (Japan), Earthrise Nutritionals (www.earthrise.com) (USA), Ocean Nutrition (www.oceannutrition.com) (Canada), I’age vertd(www.agevert.com) (France), Chlorella manufacturing and Co. (Taiwan), Roquette Klötzed
(Germany)
Roquette, Klötze, GermanyTubular photobioreactors Yaeyama Chlorella, Japan
Courtesy Otto Pulz
PRODUCTION OF Chlorella
1. PRODUCED STRAINS
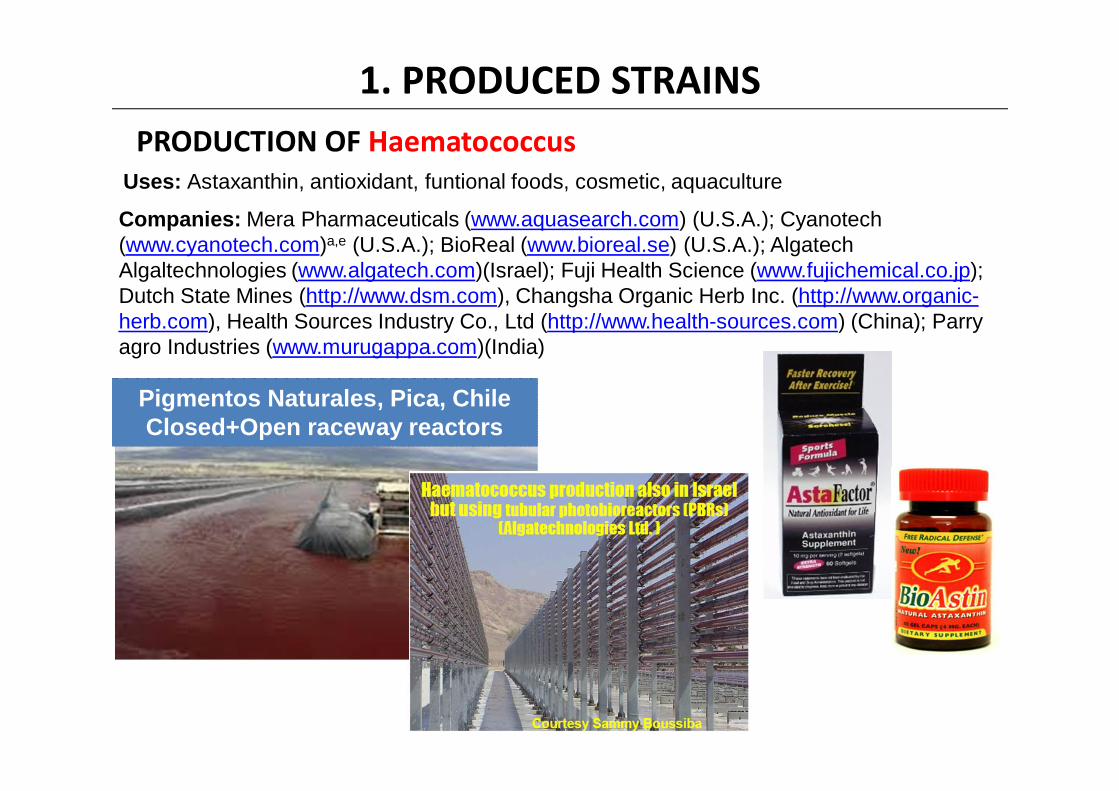
Uses: Astaxanthin, antioxidant, funtional foods, cosmetic, aquaculture
Companies: Mera Pharmaceuticals (www.aquasearch.com) (U.S.A.); Cyanotech(www.cyanotech.com)a,e (U.S.A.); BioReal (www.bioreal.se) (U.S.A.); AlgatechAlgaltechnologies (www.algatech.com)(Israel); Fuji Health Science (www.fujichemical.co.jp); Dutch State Mines (http://www.dsm.com), Changsha Organic Herb Inc. (http://www.organic-herb.com), Health Sources Industry Co., Ltd (http://www.health-sources.com) (China); Parryagro Industries (www.murugappa.com)(India)
Pigmentos Naturales, Pica, ChileClosed+Open raceway reactors
PRODUCTION OF Haematococcus
1. PRODUCED STRAINS
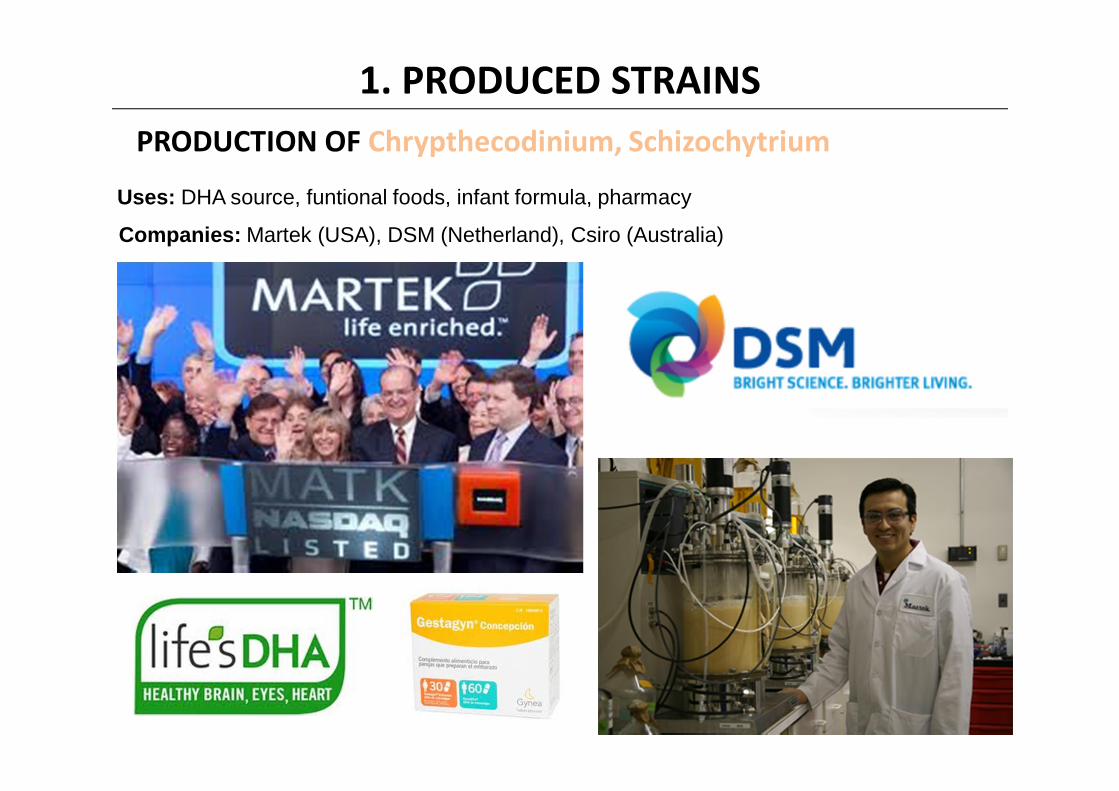
Uses: DHA source, funtional foods, infant formula, pharmacy
Companies: Martek (USA), DSM (Netherland), Csiro (Australia)
PRODUCTION OF Chrypthecodinium, Schizochytrium
1. PRODUCED STRAINS
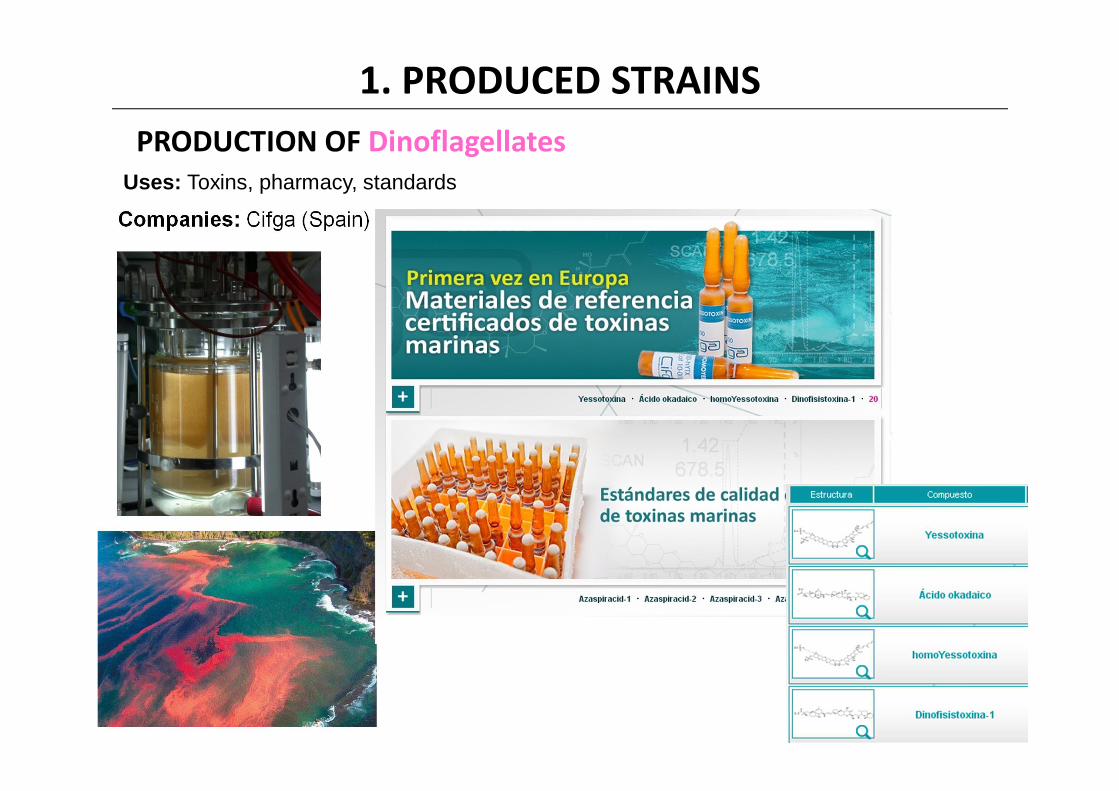
Uses: Toxins, pharmacy, standards
Companies: Cifga (Spain)
PRODUCTION OF Dinoflagellates
1. PRODUCED STRAINS

2. MICROALGAE BASED PROCESSES
Specific processes according to the final product

2. MICROALGAE BASED PROCESSES Closed photobioreactors: Bubble columns
2. MICROALGAE BASED PROCESSES
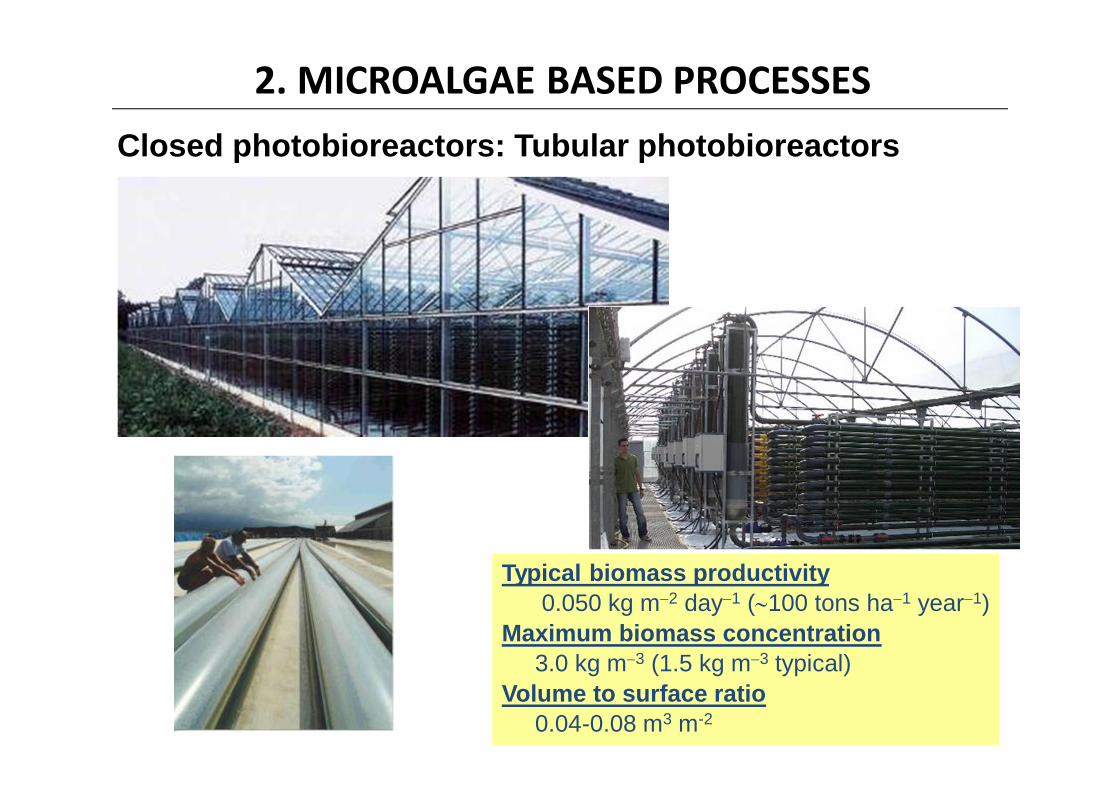
Typical biomass productivity0.050 kg m−2 day−1 (∼100 tons ha−1 year−1)
Maximum biomass concentration3.0 kg m−3 (1.5 kg m−3 typical)
Volume to surface ratio0.04-0.08 m3 m-2
Closed photobioreactors: Tubular photobioreactors
2. MICROALGAE BASED PROCESSES
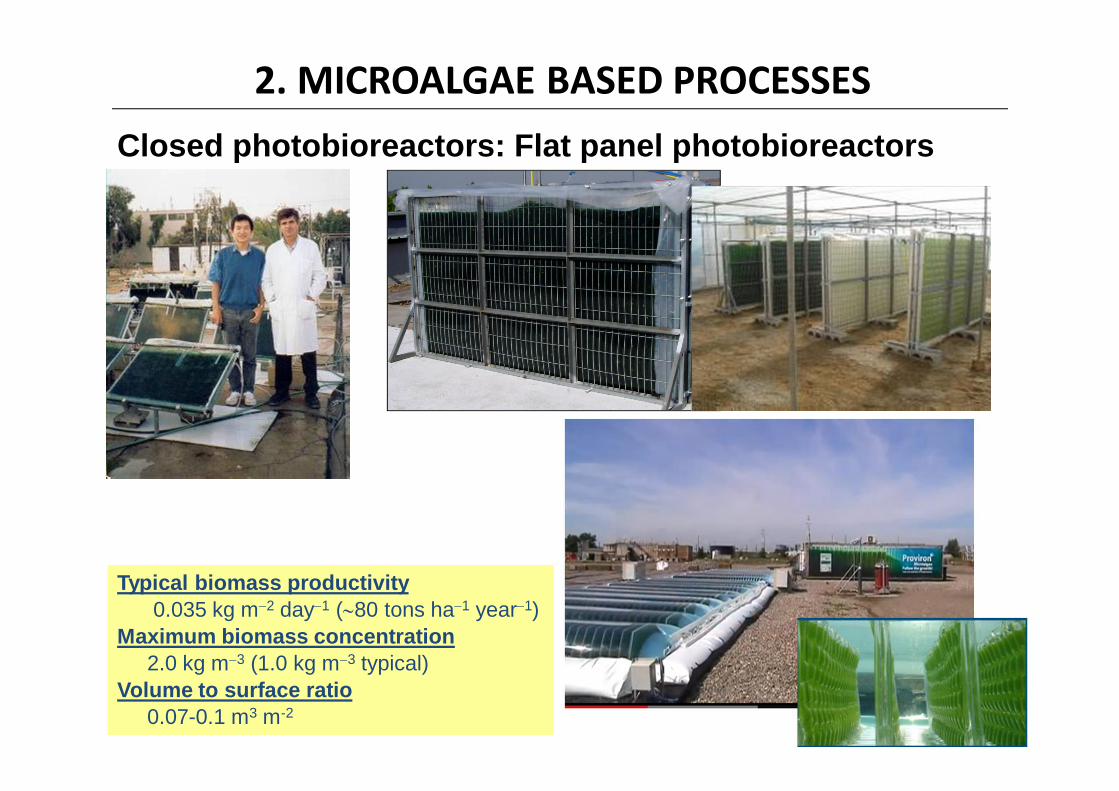
Typical biomass productivity0.035 kg m−2 day−1 (∼80 tons ha−1 year−1)
Maximum biomass concentration2.0 kg m−3 (1.0 kg m−3 typical)
Volume to surface ratio0.07-0.1 m3 m-2
Closed photobioreactors: Flat panel photobioreactors

2. MICROALGAE BASED PROCESSES
Typical biomass productivity0.015 kg m−2 day−1 (∼45 tons ha−1 year−1)Maximum biomass concentration0.5 kg m−3 (0.25 kg m−3 typical)Volume to surface ratio0.2-0.4 m3 m-2
Open photobioreactors: Raceways
2. MICROALGAE BASED PROCESSES
DIAGRAMA GENERAL
Preparaciónmedio
Drenaje
Inóc
ulos
Separaciónbiomasa
Conservaciónbiomasa
CO2
Aire
AguaElectricidad
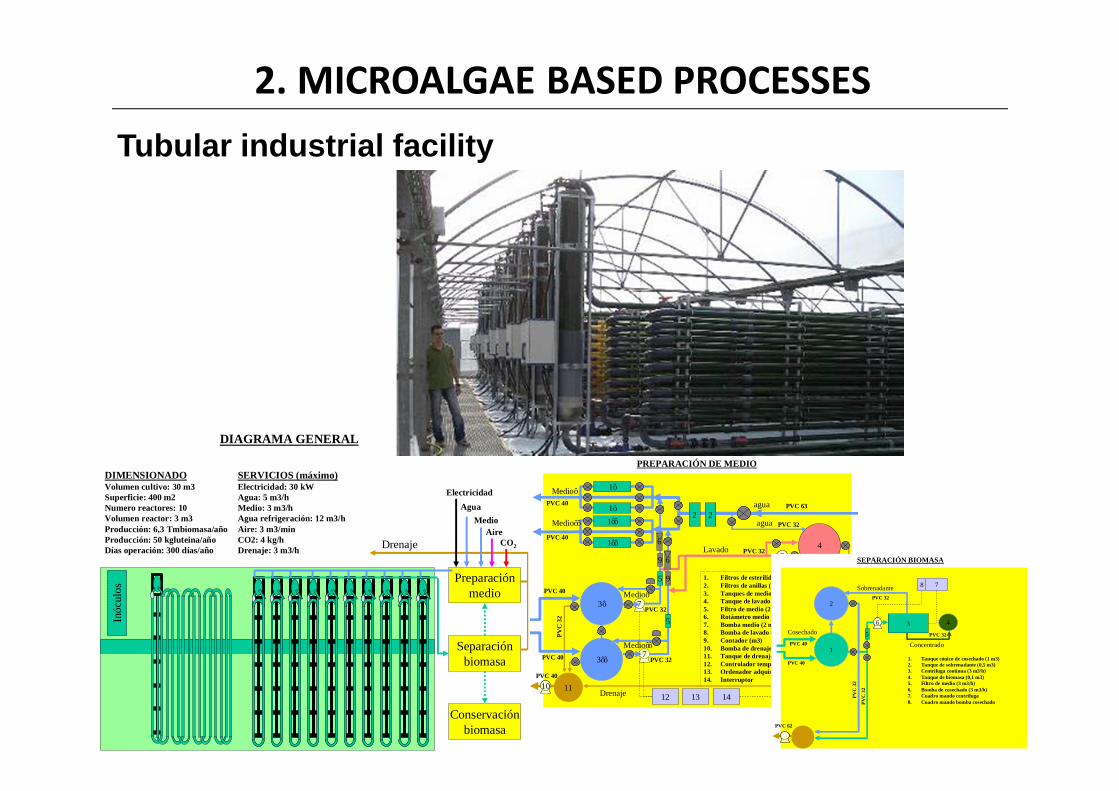
DIMENSIONADOVolumen cultivo: 30 m3Superficie: 400 m2Numero reactores: 10Volumen reactor: 3 m3Producción: 6,3 Tmbiomasa/añoProducción: 50 kgluteina/añoDías operación: 300 días/año
Medio
SERVICIOS (máximo)Electricidad: 30 kWAgua: 5 m3/hMedio: 3 m3/hAgua refrigeración: 12 m3/hAire: 3 m3/minCO2: 4 kg/h Drenaje: 3 m3/h
PREPARACIÓN DE MEDIO
3’
3’’
7
7
1’
1’
6
22
1’’
1’’
488
agua
agua
Medio’
Medio’’
Medio’
Medio’’
Drenaje
5
5
69
9
111010
Lavado
12 13 14
1. Filtros de esterilidad (2 m3/h)2. Filtros de anillas (5 m3/h)3. Tanques de medio (1,5 m3)4. Tanque de lavado (1,5 m3)5. Filtro de medio (2 m3/h)6. Rotámetro medio (2 m3/h)7. Bomba medio (2 m3/h, 20 m)8. Bomba de lavado (2 m3/h, 20m)9. Contador (m3)10. Bomba de drenaje (3 m3/h)11. Tanque de drenaje (1 m3)12. Controlador temporal-Cuadro señales13. Ordenador adquisición datos14. Interruptor
PVC 40
PVC 63
PVC 32
PVC 40
PVC 32
PVC 40
PVC 40 PVC 32
PVC 32
PVC 32
PVC
32
PVC 40
SEPARACIÓN BIOMASA
2
11. Tanque cónico de cosechado (1 m3)2. Tanque de sobrenadante (0,5 m3)3. Centrífuga continua (3 m3/h)4. Tanque de biomasa (0,1 m3)5. Filtro de medio (3 m3/h)6. Bomba de cosechado (3 m3/h)7. Cuadro mando centrifuga8. Cuadro mando bomba cosechado
366
5Cosechado
Sobrenadante
4
Concentrado
78
PVC 40
PVC 40
PVC 32
PVC
32
PVC
32
PVC 32
PVC 62
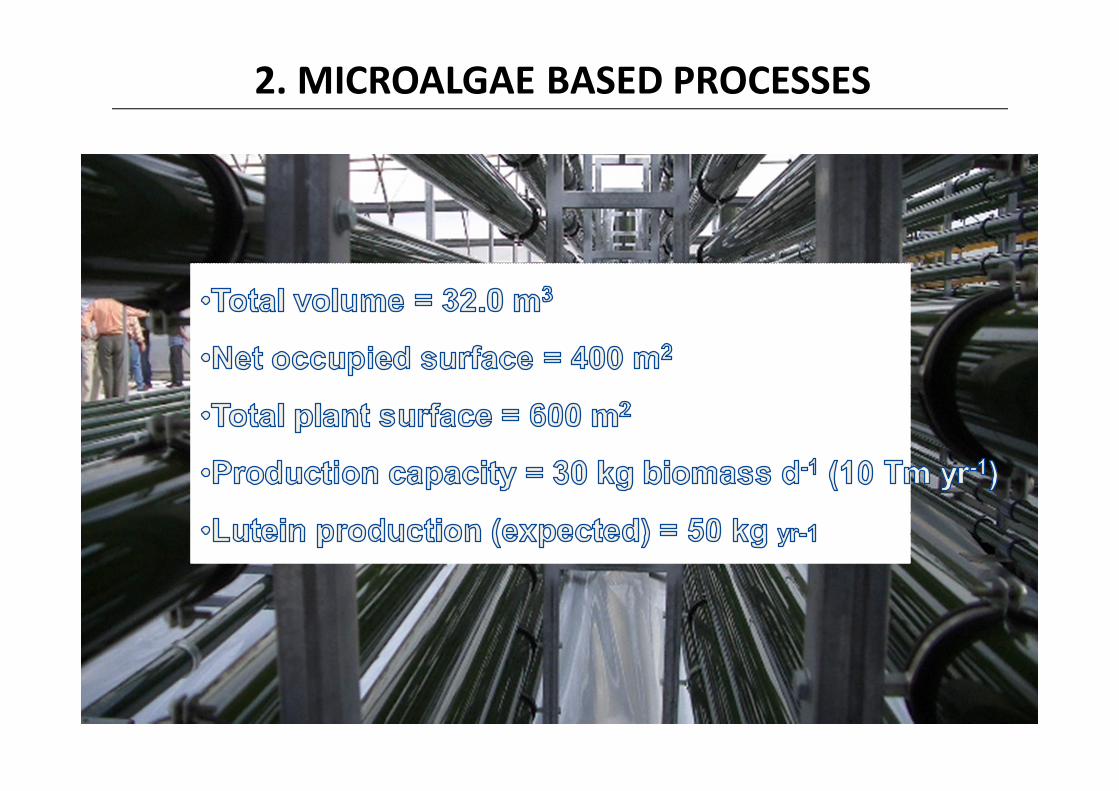
Tubular industrial facility
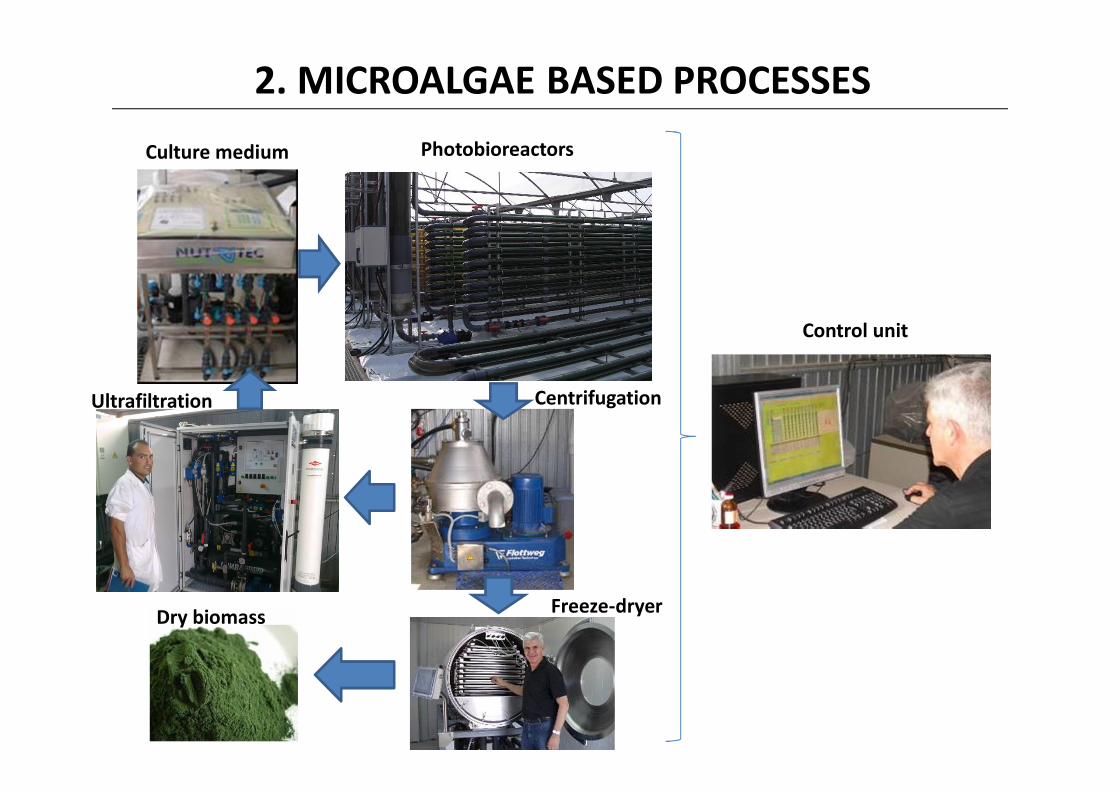
2. MICROALGAE BASED PROCESSES Culture medium Photobioreactors
Centrifugation
Freeze-dryer
Control unit
Dry biomass
Ultrafiltration
2. MICROALGAE BASED PROCESSES

2. MICROALGAE BASED PROCESSES Characteristics of raw material§ Complex biomass§ Many different compounds in small quantities§ Homogeneous: no mechanical separation§ High water content§ Protein rich§ Variable lipid content§ Variable carbohydrate content§ Some high value products§ Minerals, nucleotides, etc...
Basic component classes:o Proteinso Carbohydrateso Lipidso Ashes
2. MICROALGAE BASED PROCESSES
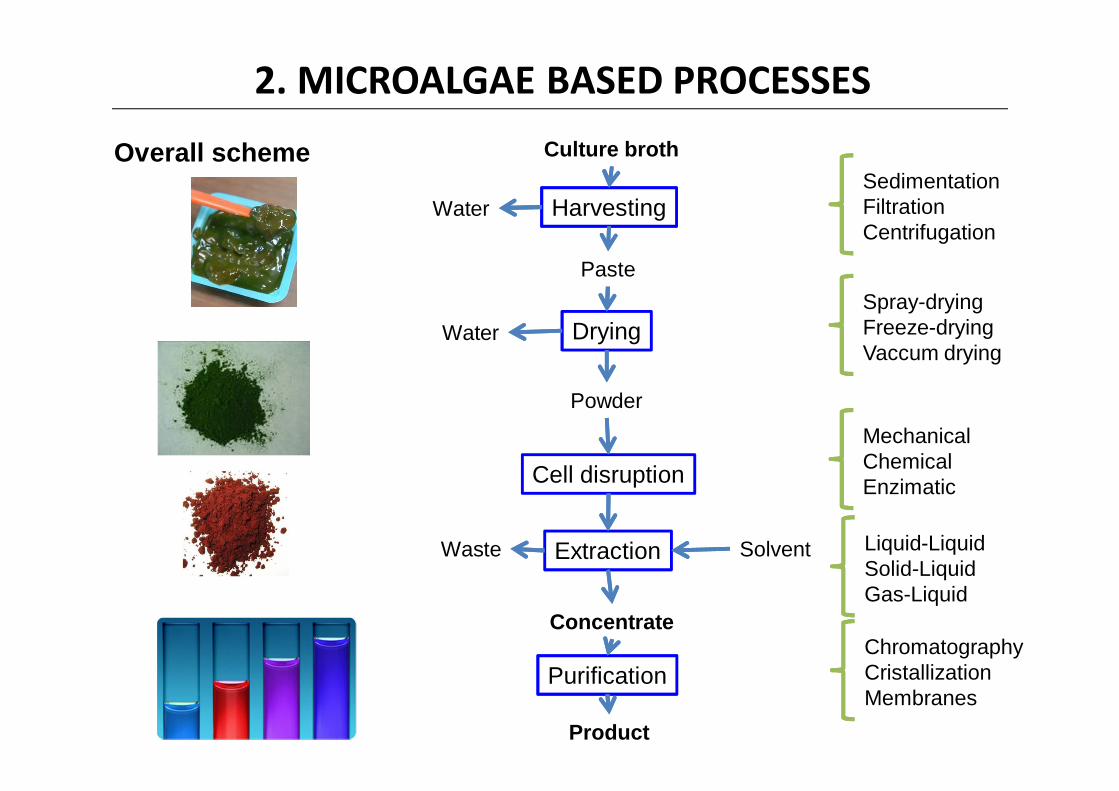
Overall scheme
Harvesting
Drying
Cell disruption
Extraction
Culture broth
Powder
SolventWaste
Concentrate
Paste
Water
WaterSedimentationFiltrationCentrifugation
Spray-dryingFreeze-dryingVaccum drying
MechanicalChemicalEnzimatic
Liquid-LiquidSolid-LiquidGas-Liquid
ChromatographyCristallizationMembranes
Purification
Product
2. MICROALGAE BASED PROCESSES
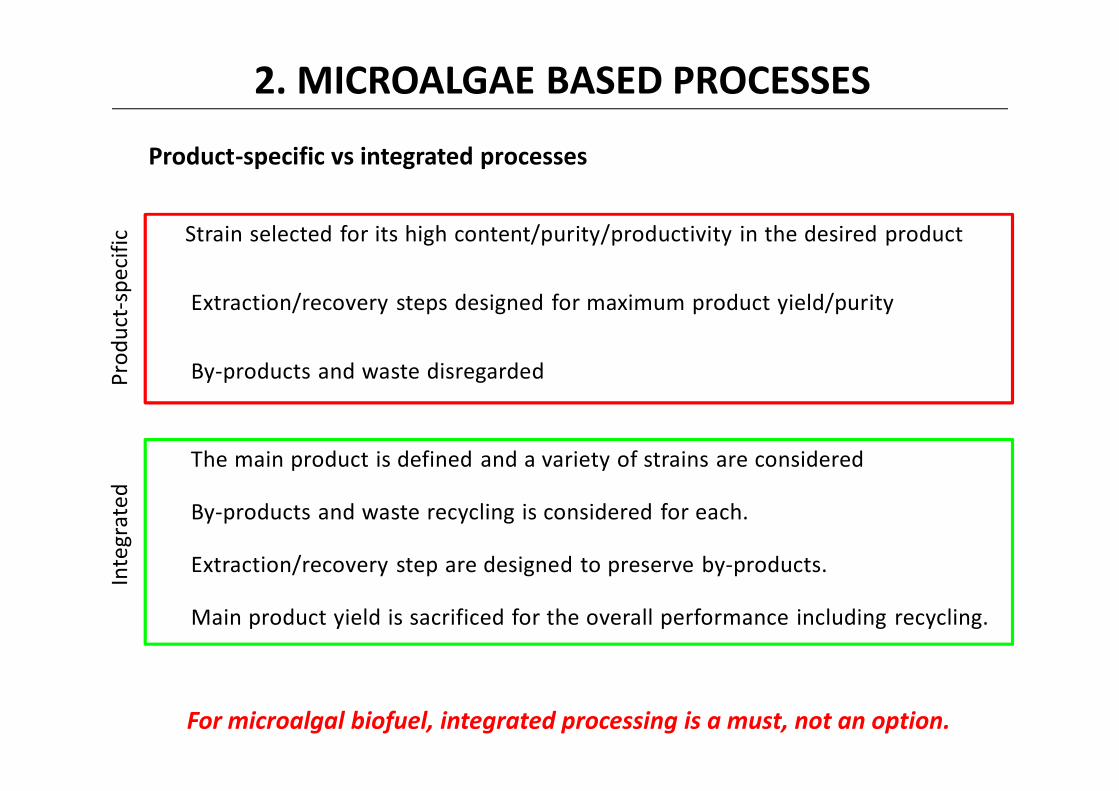
o Strain selected for its high content/purity/productivity in the desired product
o Extraction/recovery steps designed for maximum product yield/purity
o By-products and waste disregardedProd
uct-s
peci
ficIn
tegr
ated
o The main product is defined and a variety of strains are considered
o By-products and waste recycling is considered for each.
o Extraction/recovery step are designed to preserve by-products.
o Main product yield is sacrificed for the overall performance including recycling.
For microalgal biofuel, integrated processing is a must, not an option.
Product-specific vs integrated processes
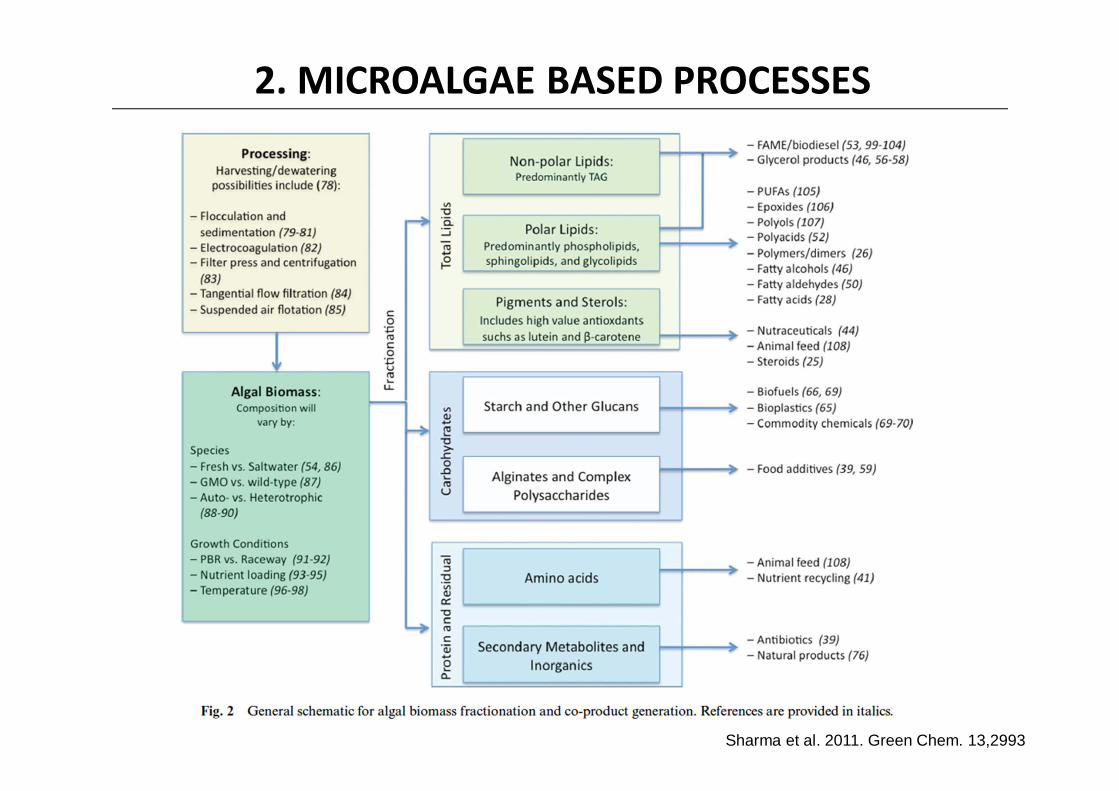
2. MICROALGAE BASED PROCESSES
Sharma et al. 2011. Green Chem. 13,2993

Example: Yesotoxins from Dinoflagellates
Highlights:
• Sensible microorganisms• Low shear stress conditions • Simple cell disruption • Complex product recovery• Chromatography necessary
2. MICROALGAE BASED PROCESSES Comercial
Biomass
Solid 1Supernatant(crude extract)
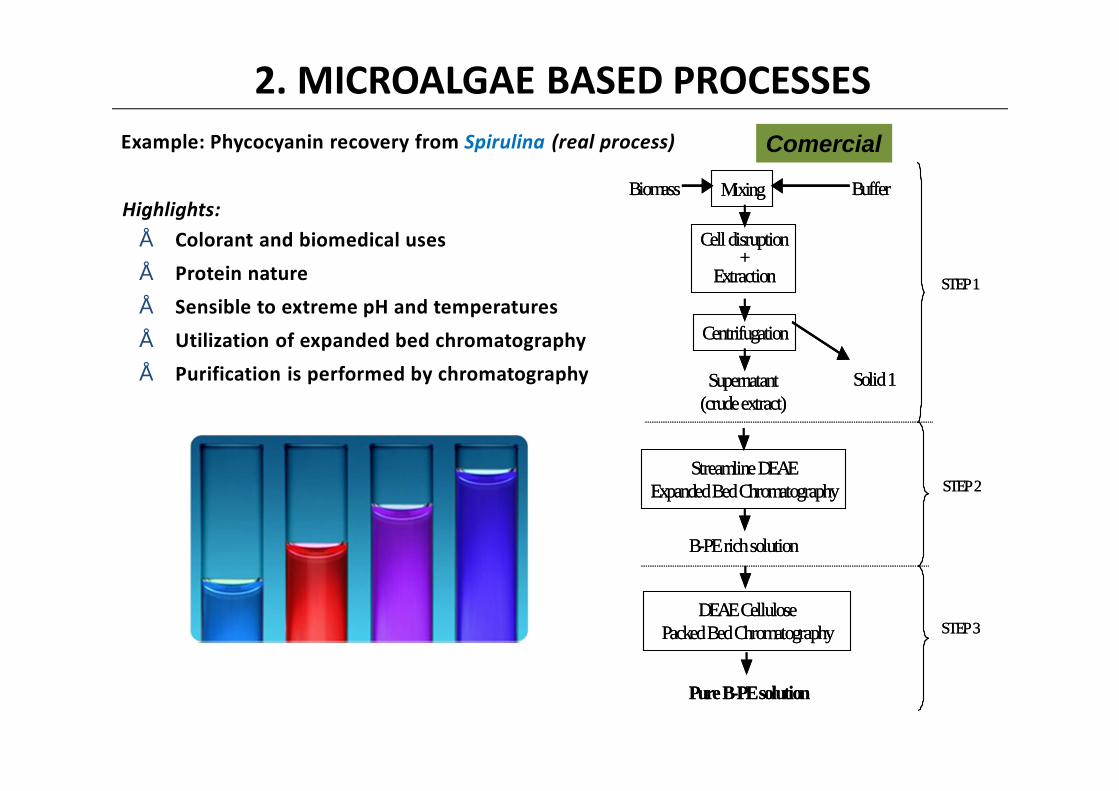
Mixing
Cell disruption+
Extraction
Centrifugation
Streamline DEAEExpanded Bed Chromatography
Buffer
STEP 1
DEAE CellulosePacked Bed Chromatography
Pure B-PE solution
STEP 2
B-PE rich solution
STEP 3
Biomass
Solid 1Supernatant(crude extract)
Mixing
Cell disruption+
Extraction
Centrifugation
Streamline DEAEExpanded Bed Chromatography
Buffer
STEP 1
DEAE CellulosePacked Bed Chromatography
Pure B-PE solution
STEP 2
B-PE rich solution
STEP 3
Example: Phycocyanin recovery from Spirulina (real process)
Highlights:• Colorant and biomedical uses• Protein nature• Sensible to extreme pH and temperatures• Utilization of expanded bed chromatography• Purification is performed by chromatography
2. MICROALGAE BASED PROCESSES Comercial

Example: Astaxanthin recovery from H. pluvialis (real process)
Highlights:
• Hot drying: temperature sensitive?• Cell-breakage step: strong cell wall?• Separation: SCF CO2 extraction.• Over 95% d.wt. waste.• Absence of other carotenoids allows
obtaining pure astaxanthin
2. MICROALGAE BASED PROCESSES Comercial
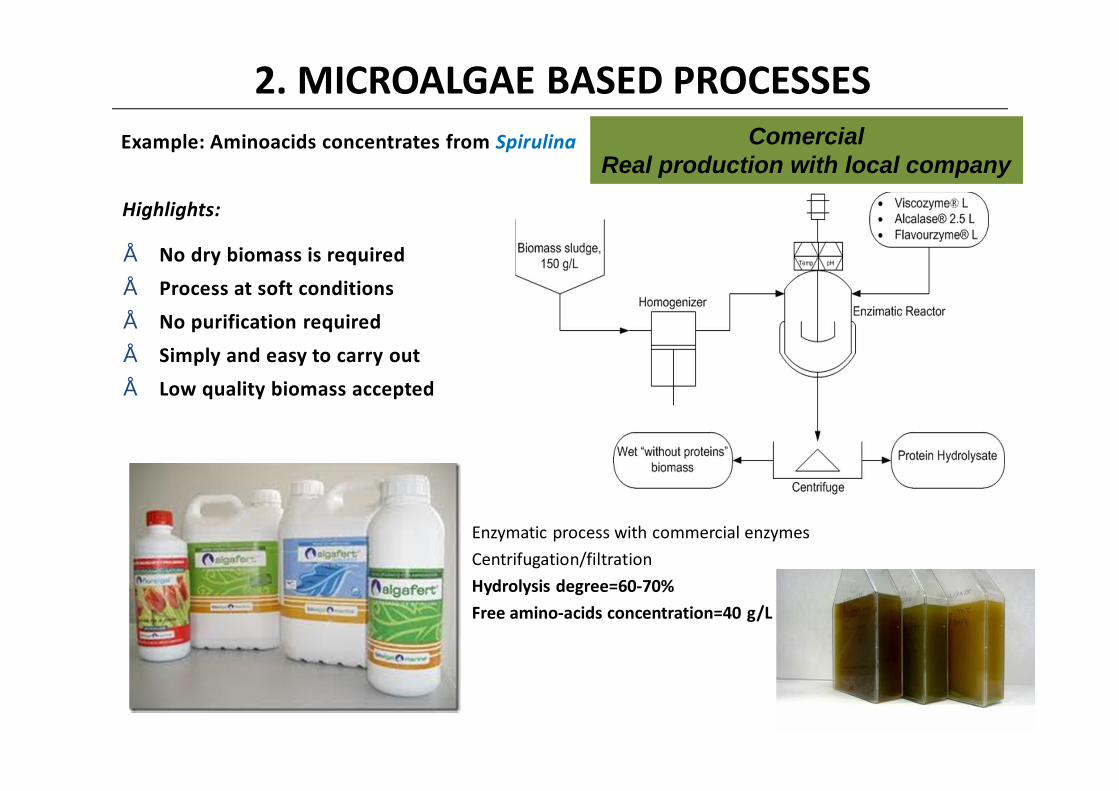
Example: Aminoacids concentrates from Spirulina
Highlights:
• No dry biomass is required• Process at soft conditions• No purification required• Simply and easy to carry out• Low quality biomass accepted
Enzymatic process with commercial enzymes Centrifugation/filtrationHydrolysis degree=60-70%Free amino-acids concentration=40 g/L
2. MICROALGAE BASED PROCESSES Comercial
Real production with local company
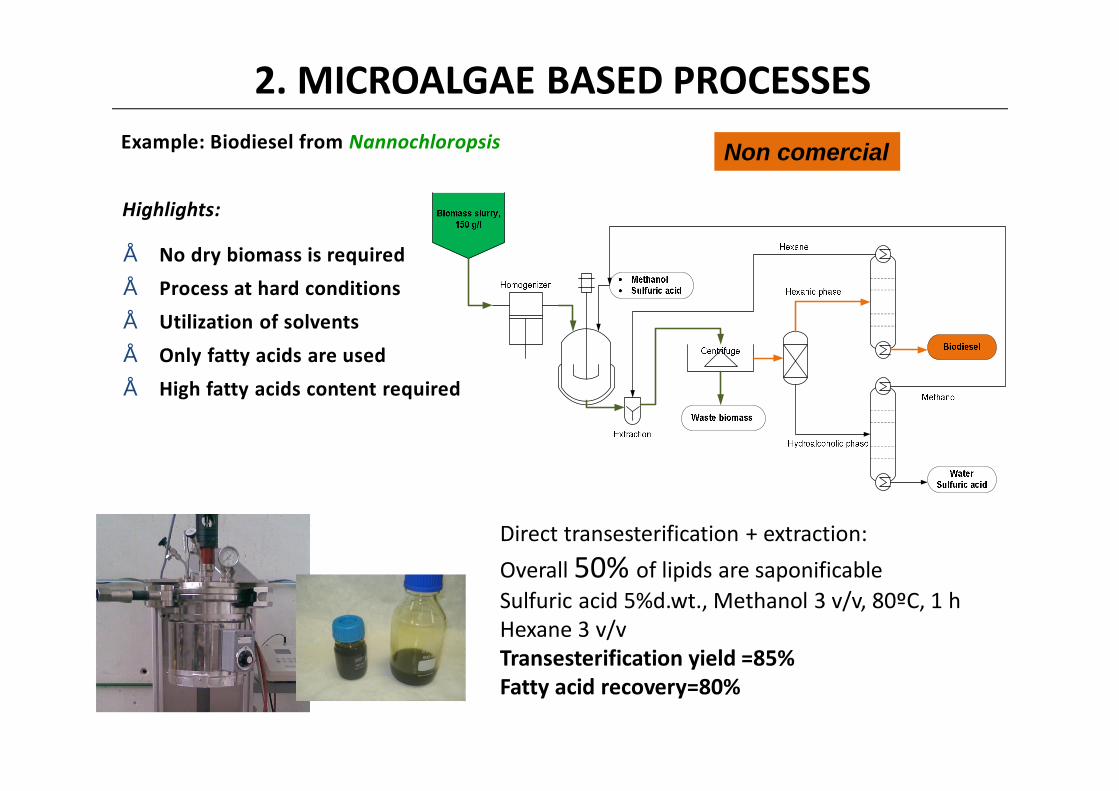
Example: Biodiesel from Nannochloropsis
Highlights:
• No dry biomass is required• Process at hard conditions• Utilization of solvents • Only fatty acids are used• High fatty acids content required
Direct transesterification + extraction:Overall 50% of lipids are saponificableSulfuric acid 5%d.wt., Methanol 3 v/v, 80ºC, 1 h Hexane 3 v/vTransesterification yield =85%Fatty acid recovery=80%
2. MICROALGAE BASED PROCESSES Non comercial
3. ENERGY FROM MICROALGAE
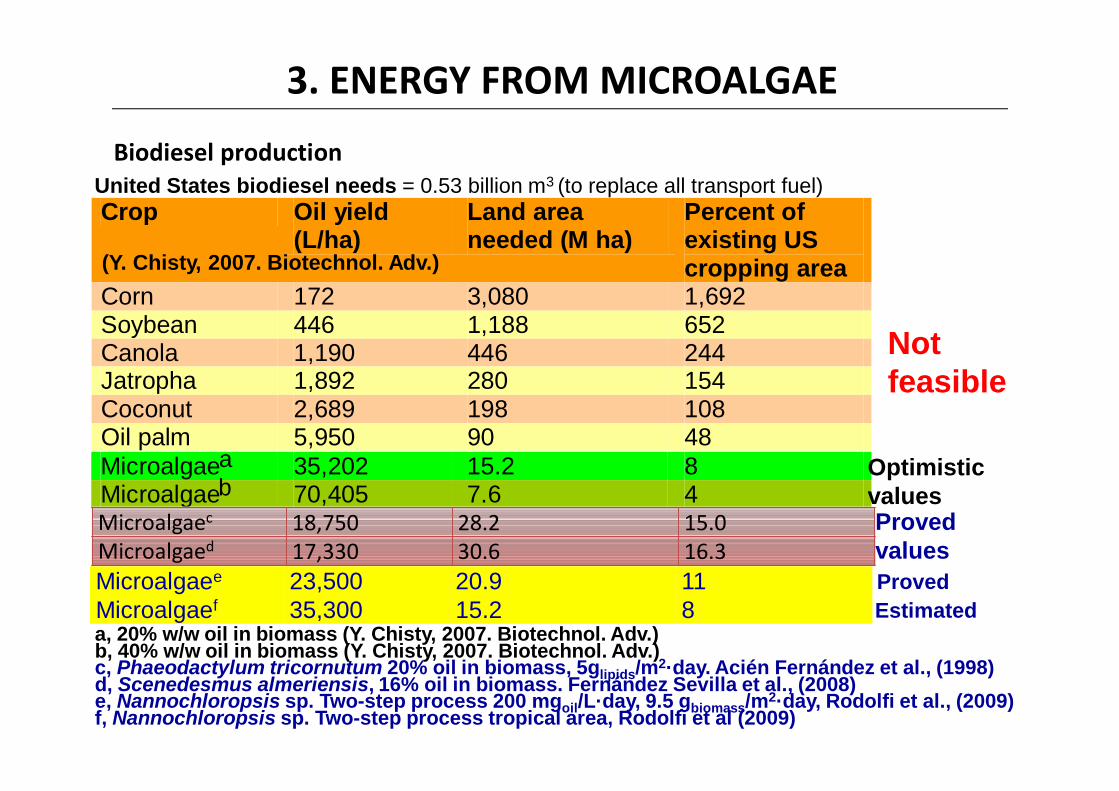
United States biodiesel needs = 0.53 billion m3 (to replace all transport fuel)Crop Oil yield
(L/ha) Land area needed (M ha)
Percent of existing US cropping area
Corn 172 3,080 1,692 Soybean 446 1,188 652 Canola 1,190 446 244 Jatropha 1,892 280 154 Coconut 2,689 198 108 Oil palm 5,950 90 48 Microalgae 35,202 15.2 8 Microalgae 35,202 15.2 8 Microalgae 70,405 7.6 4
Not feasible
(Y. Chisty, 2007. Biotechnol. Adv.)
Microalgaec 18,750 28.2 15.0Microalgaed 17,330 30.6 16.3
ab
a, 20% w/w oil in biomass (Y. Chisty, 2007. Biotechnol. Adv.)b, 40% w/w oil in biomass (Y. Chisty, 2007. Biotechnol. Adv.)c, Phaeodactylum tricornutum 20% oil in biomass, 5glipids/m2·day. Acién Fernández et al., (1998)d, Scenedesmus almeriensis, 16% oil in biomass. Fernández Sevilla et al., (2008)e, Nannochloropsis sp. Two-step process 200 mgoil/L·day, 9.5 gbiomass/m2·day, Rodolfi et al., (2009)f, Nannochloropsis sp. Two-step process tropical area, Rodolfi et al (2009)
Optimistic valuesProved values
Microalgaee 23,500 20.9 11Microalgaef 35,300 15.2 8
ProvedEstimated
Biodiesel production

3. ENERGY FROM MICROALGAE
ENERGY COST
Maximum energy conversion achievable
Direct PAR30,511 GJ ha-1
Biomass180-200 Tn ha-1
Oil30 tn ha-1
CHALLENGE
3. ENERGY FROM MICROALGAE
5
66,25025000
400
1
10
100
1,000
10,000
100,000
1,000,000
Actual market Required to biofuel market
Production capacity, kt/year
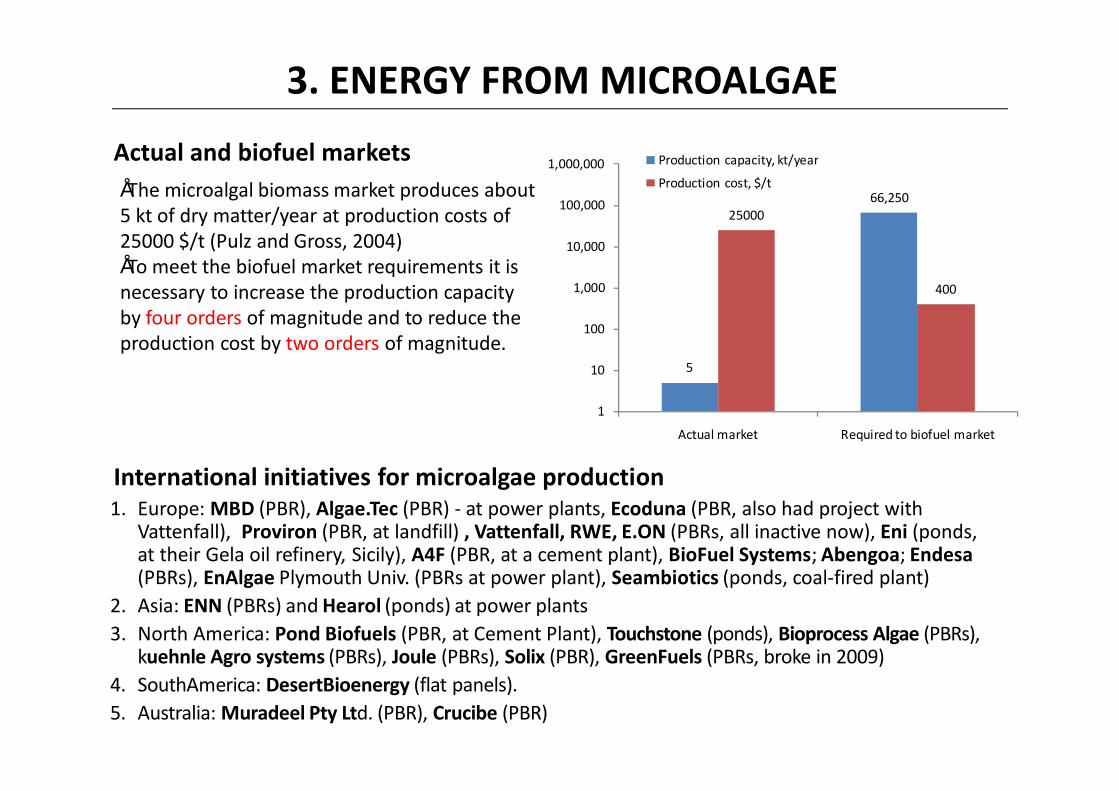
Production cost, $/t•The microalgal biomass market produces about 5 kt of dry matter/year at production costs of 25000 $/t (Pulz and Gross, 2004)•To meet the biofuel market requirements it is necessary to increase the production capacity by four orders of magnitude and to reduce the production cost by two orders of magnitude.
Actual and biofuel markets
1. Europe: MBD (PBR), Algae.Tec (PBR) - at power plants, Ecoduna (PBR, also had project with Vattenfall), Proviron (PBR, at landfill) , Vattenfall, RWE, E.ON (PBRs, all inactive now), Eni (ponds, at their Gela oil refinery, Sicily), A4F (PBR, at a cement plant), BioFuel Systems; Abengoa; Endesa(PBRs), EnAlgae Plymouth Univ. (PBRs at power plant), Seambiotics (ponds, coal-fired plant)
2. Asia: ENN (PBRs) and Hearol (ponds) at power plants 3. North America: Pond Biofuels (PBR, at Cement Plant), Touchstone (ponds), Bioprocess Algae (PBRs),
kuehnle Agro systems (PBRs), Joule (PBRs), Solix (PBR), GreenFuels (PBRs, broke in 2009)4. SouthAmerica: DesertBioenergy (flat panels).5. Australia: Muradeel Pty Ltd. (PBR), Crucibe (PBR)
International initiatives for microalgae production
3. ENERGY FROM MICROALGAE
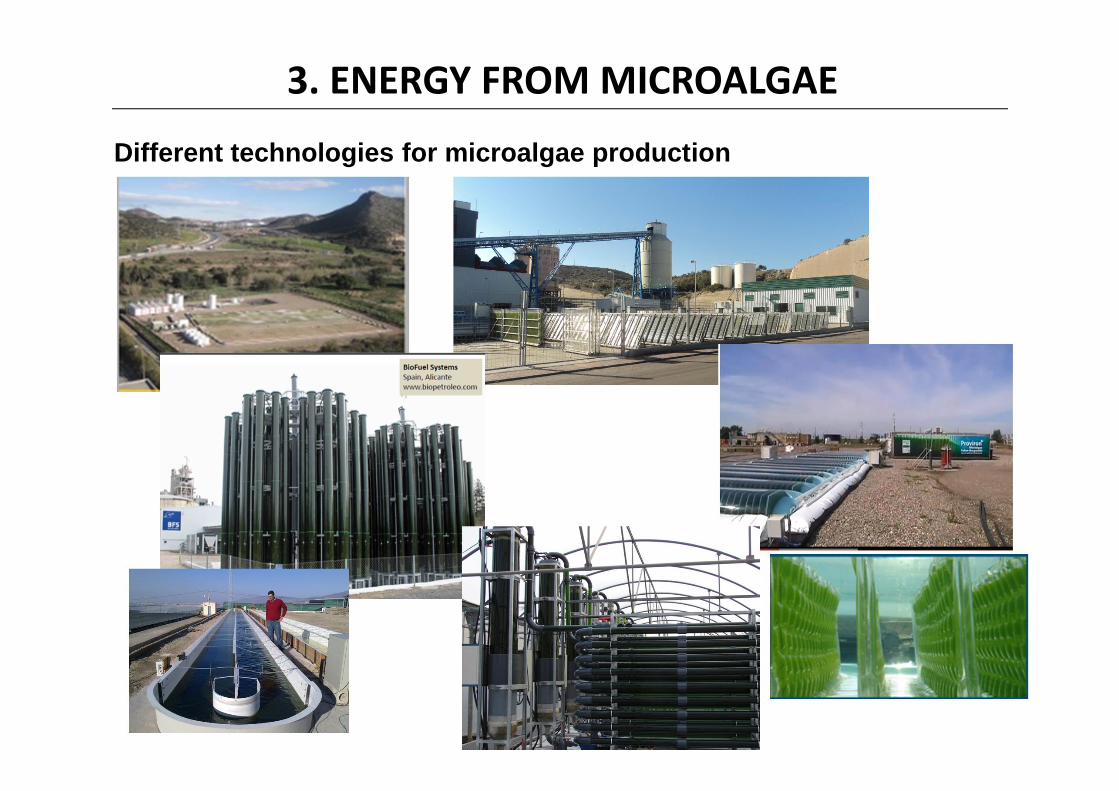
Different technologies for microalgae production

3. ENERGY FROM MICROALGAE
COMBUSTION DRY CHEMICAL CONVERSION WET PROCESSES
Electricity Heat
Pirolysis
Gasification
Hydrogasification
OilsGasCarbon
Poor-mediumgas
MethaneEthaneCarbon
Chemical reduction
Alcoholic fermentation
Oils Ethanol Methane
Methanol Methane Ammonia Electricity
Production of biofuels from microalgae
Anaerobic digestion
On this way only the CARBON fraction is used, nitrogen fraction is disregarded
MICROALGAE BIOMASS

3. ENERGY FROM MICROALGAE
Microalgae biomass
Proteins LipidsCarbohydrates
Hydrolysis TransesterificationHydrolysis-Fermentation
Amino-acids and peptids FAME´sEthanol
BiofertilizersHealth and feed products BiodieselBioethanol
Whole biomass
Anaerobic digestion
CH4, H2, CO2
Biogas
Valorization routes for microalgae WET biomass
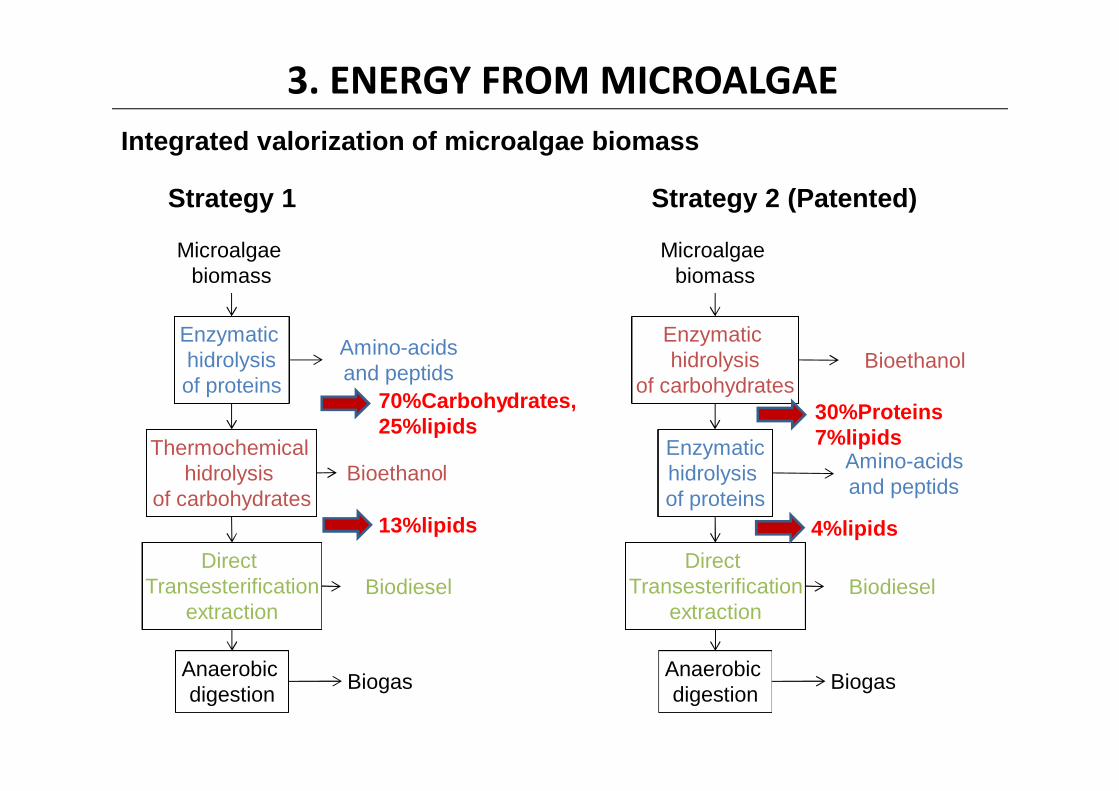
Strategy 1
Microalgae biomass
Enzymatic hidrolysisof proteins
Amino-acids and peptids
Biogas
Thermochemical hidrolysis
of carbohydratesBioethanol
Direct Transesterification
extractionBiodiesel
Anaerobic digestion
Strategy 2 (Patented)
Microalgae biomass
Enzymatic hidrolysis
of carbohydratesBioethanol
Biogas
Enzymatichidrolysis of proteins
Amino-acids and peptids
Direct Transesterification
extractionBiodiesel
Anaerobic digestion
70%Carbohydrates, 25%lipids
13%lipids
30%Proteins7%lipids
4%lipids
3. ENERGY FROM MICROALGAEIntegrated valorization of microalgae biomass
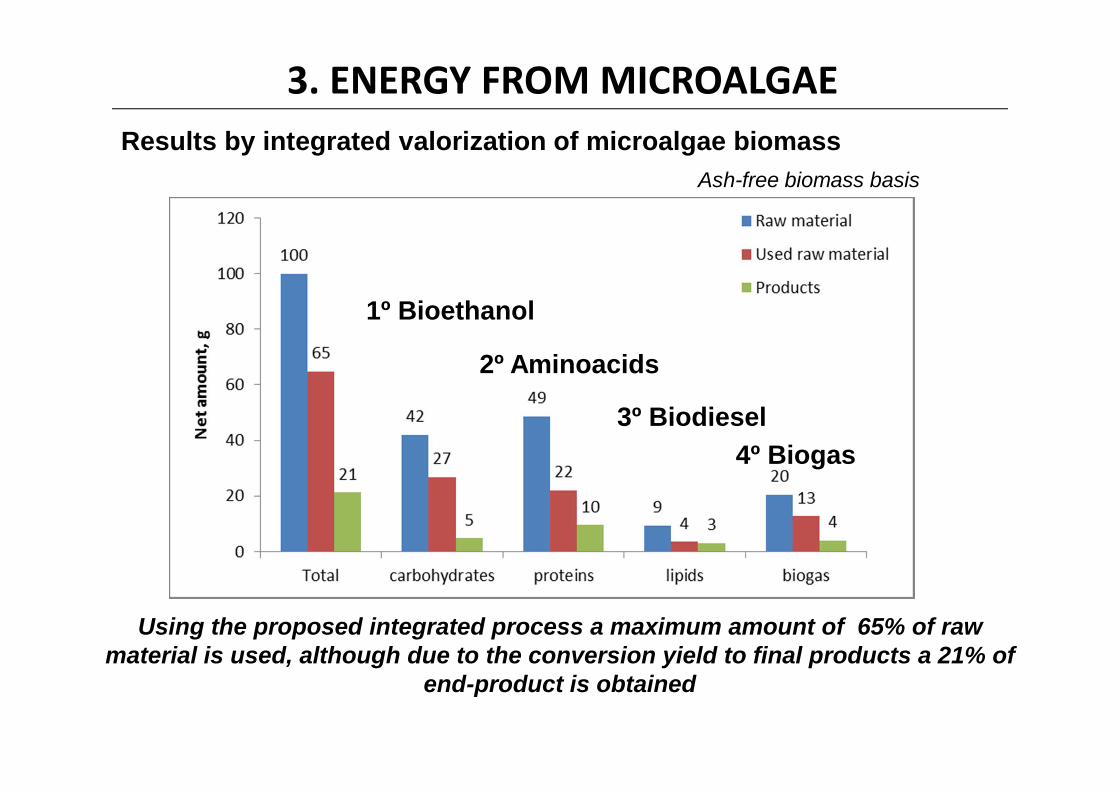
2º Aminoacids
1º Bioethanol
3º Biodiesel
Using the proposed integrated process a maximum amount of 65% of raw material is used, although due to the conversion yield to final products a 21% of
end-product is obtained
4º Biogas
Ash-free biomass basis
3. ENERGY FROM MICROALGAEResults by integrated valorization of microalgae biomass

3. ENERGY FROM MICROALGAE
Biomass productivity g/m2/day 20CO2 usage kg/kgbiomass 4Water evaporation L/m2/day 10Mixing power consumption W/m3 2Labour people/ha 0.1Production days Days 365Land area ha 100Ratio V/S m3/m2 0.15CO2 fixation efficiency 0.45Dilution rate 1/day 0.2Total culture volume m3 150000
Scenario Inputs Reactor Productivity Harvesting1Water, CO2 and fertilizers Raceway Real Centrifugation2Water, CO2 and fertilizers Raceway Real Flocculation-Sedimentation+Centrifugation3Free flue gases and wastewater Raceway Real Flocculation-Sedimentation+Centrifugation4Free flue gases and wastewater Raceway Real Flocculation-LamellarSedimentation+Centrifugation5Free flue gases and wastewater Raceway Real Flocculation-LamellarSedimentation+Filtration6Free flue gases and wastewater Raceway Theoretical Flocculation-LamellarSedimentation+Filtration
Utilization of wastewater is the best option to reduce the microalgaeproduction cost
Technological alternatives to produce biomass
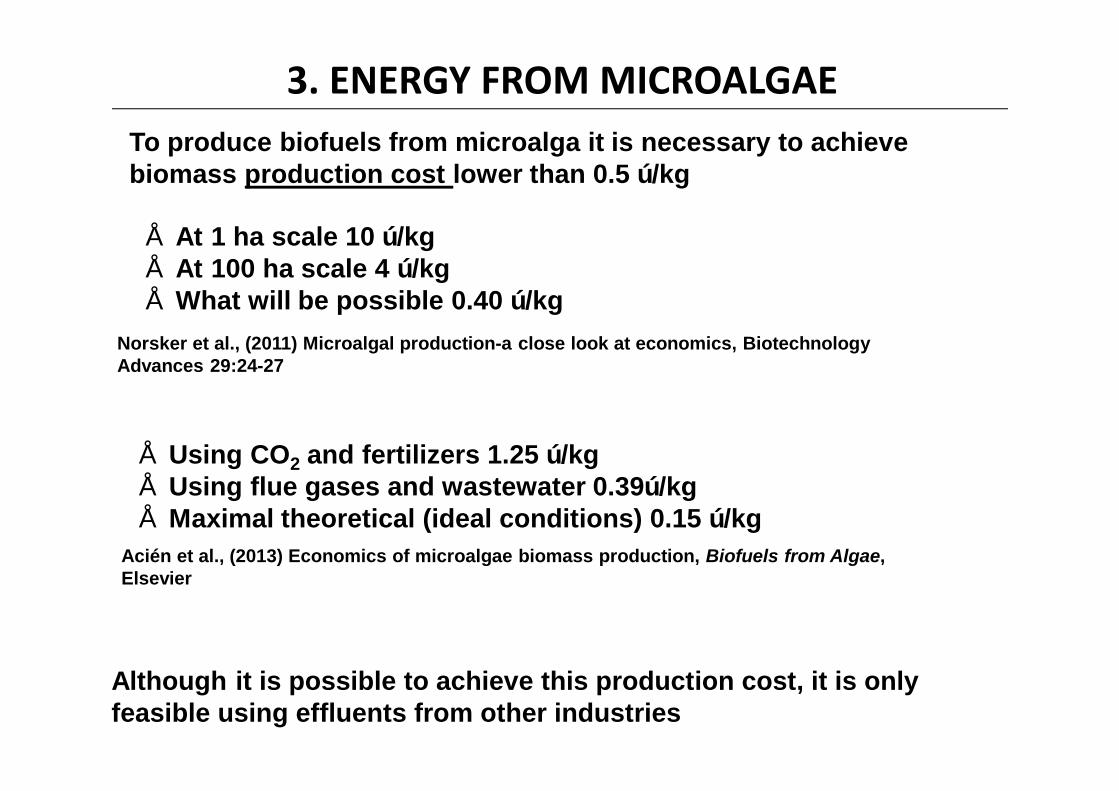
• At 1 ha scale 10 €/kg• At 100 ha scale 4 €/kg• What will be possible 0.40 €/kg
Norsker et al., (2011) Microalgal production-a close look at economics, Biotechnology Advances 29:24-27
• Using CO2 and fertilizers 1.25 €/kg• Using flue gases and wastewater 0.39€/kg• Maximal theoretical (ideal conditions) 0.15 €/kg
Acién et al., (2013) Economics of microalgae biomass production, Biofuels from Algae, Elsevier
To produce biofuels from microalga it is necessary to achieve biomass production cost lower than 0.5 €/kg
Although it is possible to achieve this production cost, it is only feasible using effluents from other industries
3. ENERGY FROM MICROALGAE
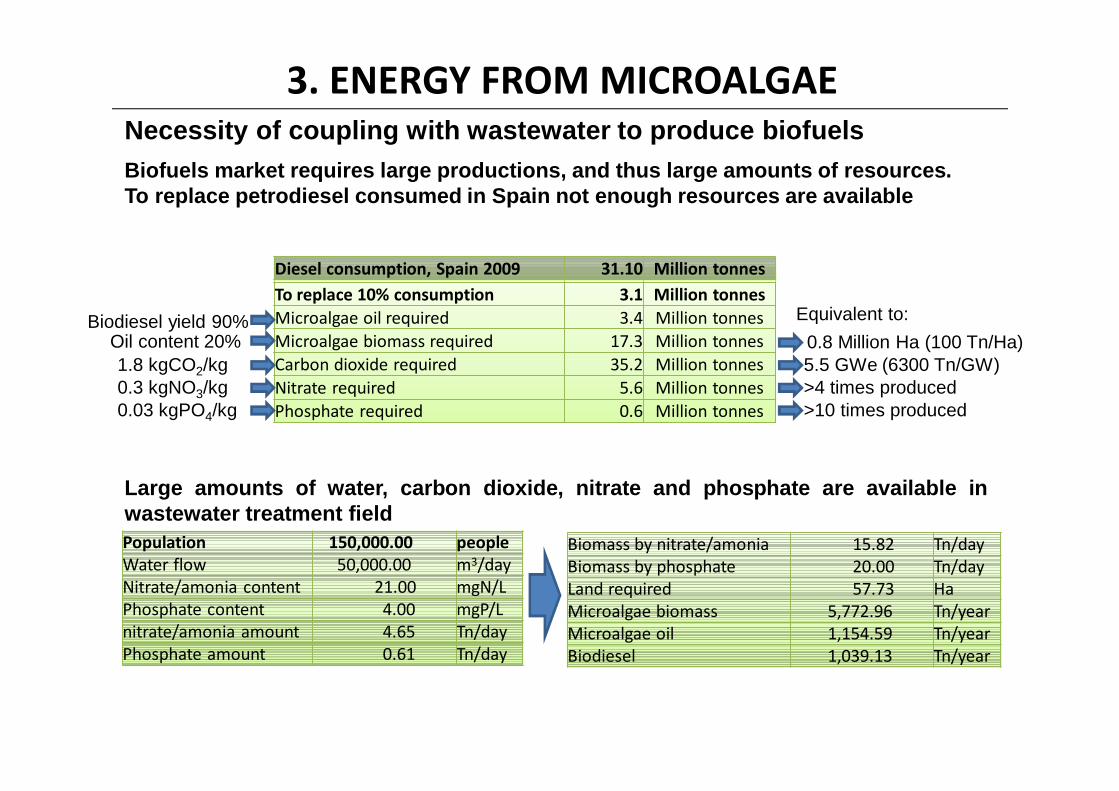
Biofuels market requires large productions, and thus large amounts of resources.To replace petrodiesel consumed in Spain not enough resources are available
To replace 10% consumption 3.1 Million tonnesMicroalgae oil required 3.4 Million tonnesMicroalgae biomass required 17.3 Million tonnesCarbon dioxide required 35.2 Million tonnesNitrate required 5.6 Million tonnesPhosphate required 0.6 Million tonnes
Biodiesel yield 90%Oil content 20%1.8 kgCO2/kg0.3 kgNO3/kg0.03 kgPO4/kg
5.5 GWe (6300 Tn/GW)>4 times produced>10 times produced
Equivalent to:
Large amounts of water, carbon dioxide, nitrate and phosphate are available inwastewater treatment fieldPopulation 150,000.00 peopleWater flow 50,000.00 m3/dayNitrate/amonia content 21.00 mgN/LPhosphate content 4.00 mgP/Lnitrate/amonia amount 4.65 Tn/dayPhosphate amount 0.61 Tn/day
Biomass by nitrate/amonia 15.82 Tn/dayBiomass by phosphate 20.00 Tn/dayLand required 57.73 HaMicroalgae biomass 5,772.96 Tn/yearMicroalgae oil 1,154.59 Tn/yearBiodiesel 1,039.13 Tn/year
Diesel consumption, Spain 2009 31.10 Million tonnes
Necessity of coupling with wastewater to produce biofuels
0.8 Million Ha (100 Tn/Ha)
3. ENERGY FROM MICROALGAE
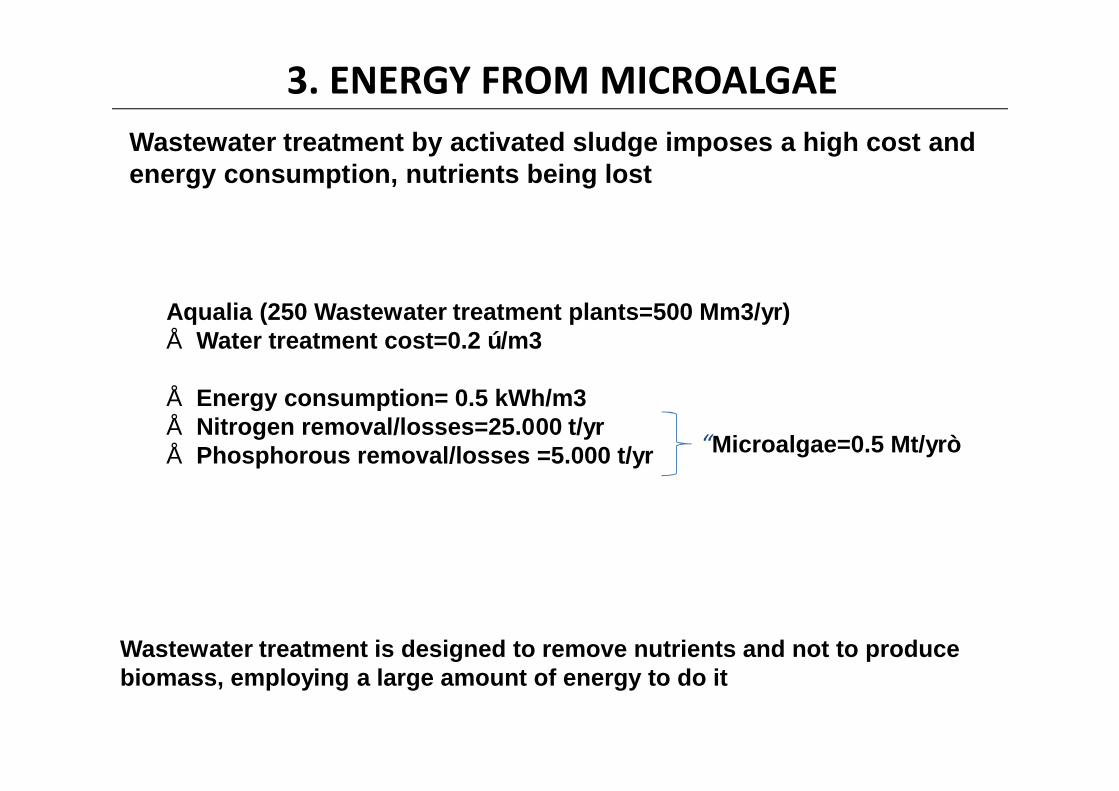
Wastewater treatment by activated sludge imposes a high cost and energy consumption, nutrients being lost
Aqualia (250 Wastewater treatment plants=500 Mm3/yr)• Water treatment cost=0.2 €/m3
• Energy consumption= 0.5 kWh/m3• Nitrogen removal/losses=25.000 t/yr• Phosphorous removal/losses =5.000 t/yr
Wastewater treatment is designed to remove nutrients and not to produce biomass, employing a large amount of energy to do it
“Microalgae=0.5 Mt/yr”
3. ENERGY FROM MICROALGAE
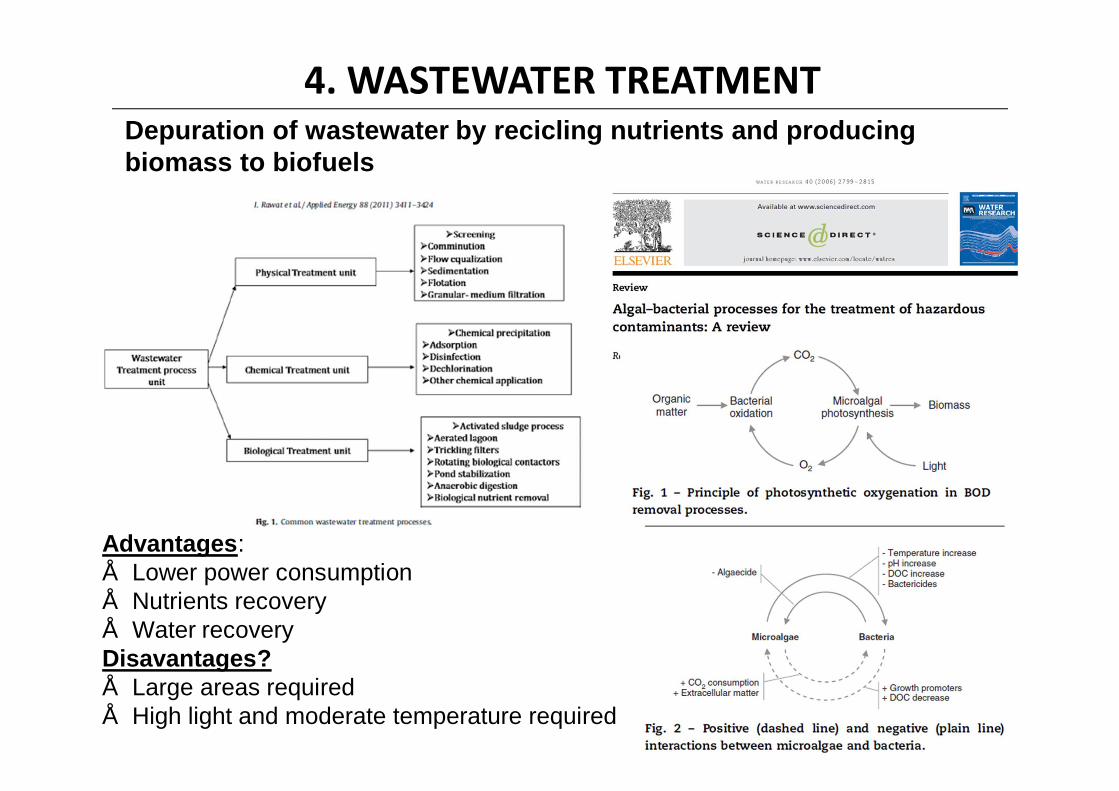
4. WASTEWATER TREATMENTDepuration of wastewater by recicling nutrients and producingbiomass to biofuels
Advantages:• Lower power consumption• Nutrients recovery• Water recoveryDisavantages?• Large areas required• High light and moderate temperature required

Nutrients: recovery of nutrients from efluents
Fotobiorreator
TratamentoPreliminar
(algas)
Separação
Produção de BiodieselIncineração
GaseificaçãoProdução de Biodiesel
- Co-digestãoLodo de algasLodo
Anaeróbio
Biogás
- Combustão
CO2
UASB
O&GResíduos
ReusoEsgoto
New Wastewater Treatment Flowsheet ?Value Creation instead of Waste Production …
EU FP 7 Project All-GasBiofuel from urban wastewater
Demonstration on a 10 ha scaleFrank Rogalla, aqualia, Spain
4. WASTEWATER TREATMENT
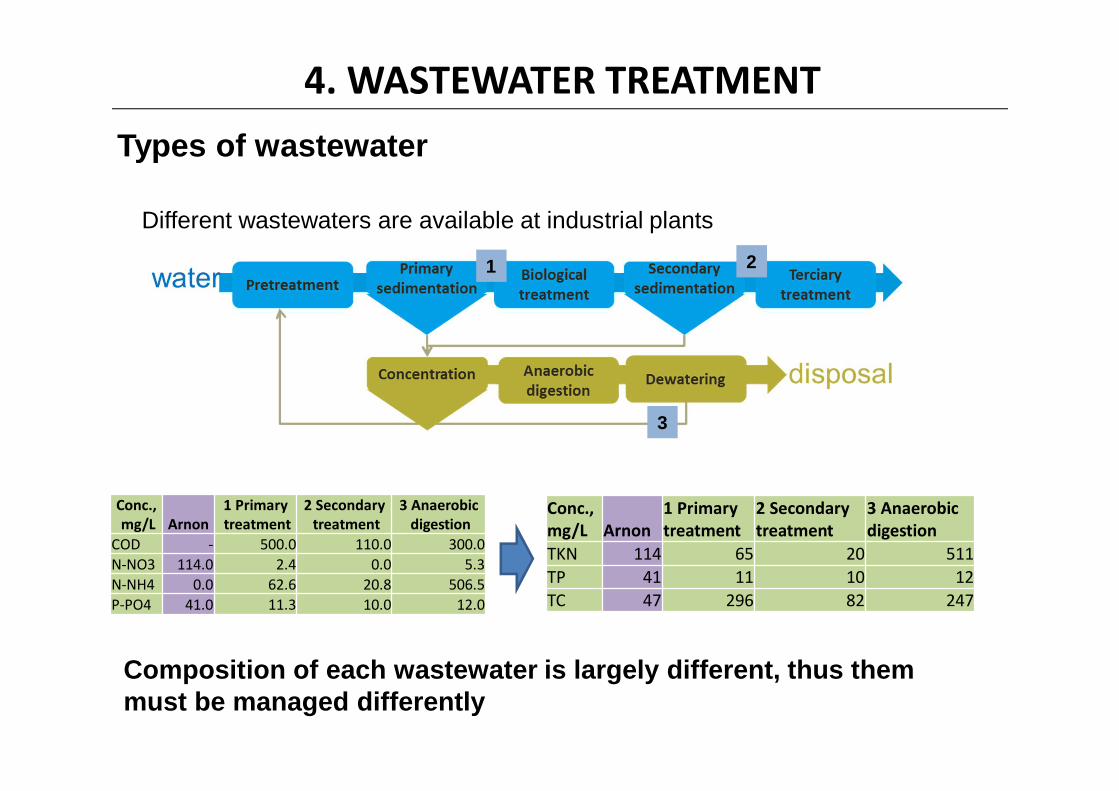
Types of wastewater
4. WASTEWATER TREATMENT
Different wastewaters are available at industrial plants
Conc.,mg/L Arnon
1 Primarytreatment
2 Secondarytreatment
3 Anaerobicdigestion
COD - 500.0 110.0 300.0N-NO3 114.0 2.4 0.0 5.3N-NH4 0.0 62.6 20.8 506.5P-PO4 41.0 11.3 10.0 12.0
Conc.,mg/L Arnon
1 Primarytreatment
2 Secondarytreatment
3 Anaerobicdigestion
TKN 114 65 20 511TP 41 11 10 12TC 47 296 82 247
1 2
3
Composition of each wastewater is largely different, thus them must be managed differently
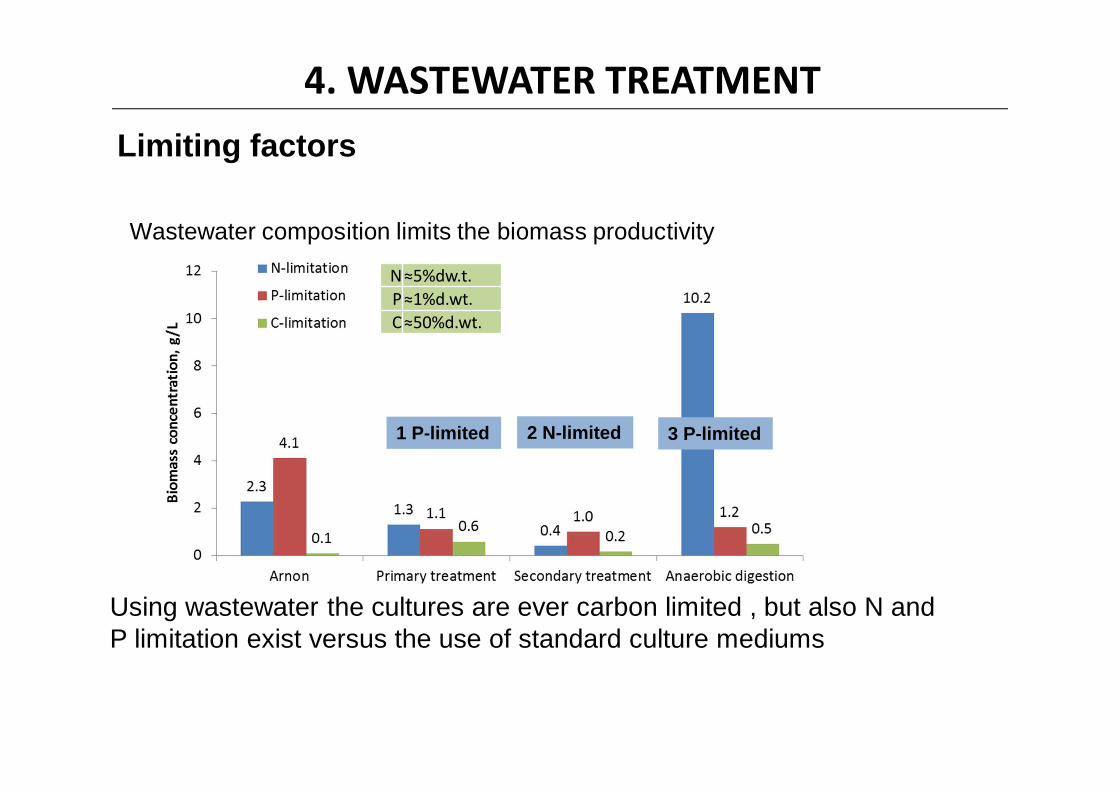
Limiting factors
4. WASTEWATER TREATMENT
Wastewater composition limits the biomass productivity
1 P-limited 2 N-limited 3 P-limited
N≈5%dw.t.P≈1%d.wt.C≈50%d.wt.
Using wastewater the cultures are ever carbon limited , but also N and P limitation exist versus the use of standard culture mediums

Wastewater from primary treatment
4. WASTEWATER TREATMENT
Characteristic: Dirty water, with high COD, N and P content
Using wastewater as culture medium the cultures performed as light-limited cultures, no other limitation being observed indoor
Data from laboratory under optimal culture conditions
Biomass productivity Growth rate
PWW TWW
PWW=Primary WWTWW=Treated WW
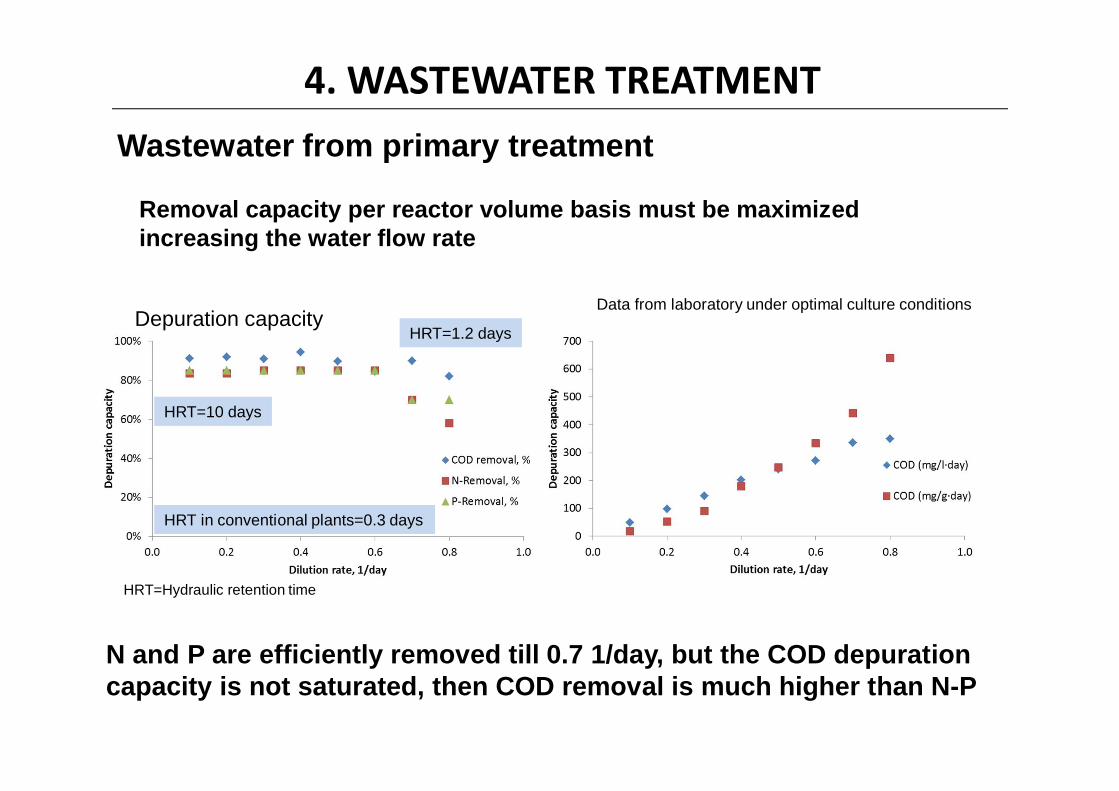
Wastewater from primary treatment
4. WASTEWATER TREATMENT
Removal capacity per reactor volume basis must be maximized increasing the water flow rate
N and P are efficiently removed till 0.7 1/day, but the COD depuration capacity is not saturated, then COD removal is much higher than N-P
Data from laboratory under optimal culture conditionsDepuration capacity
HRT=1.2 days
HRT=10 days
HRT in conventional plants=0.3 days
HRT=Hydraulic retention time

Nutrients: recovery of nutrients from efluents
4. WASTEWATER TREATMENT
Outdoor the performance of the system has been verified in continuous mode
Biomass productivity is much higher in the thin layer reactor than in raceway reactor although the depuration capacity is high in both systems
Data from outdoor photobioreactors under real conditions
Biomass productivity Depuration capacity
HRT=3 days
HRT=5 days HRT=3 days HRT=5 days

ACKNOWLEDGEMENTS
Dpt. Chemical EngineeringUniversity of Almería, SPAIN
THANKS
QUESTIONS?
Products and processes with microalgae
F. Gabriel Acién Fernández ([email protected])Dpt. Chemical Engineering, University of Almería, Spain
Madrid, May 6th, 2014
Top Related