


Idiomas
Páginas
Jurídico

PARENTAL DECISIONS IN A CHOICE BASED SCHOOL SYSTEM: ANALYZING THE TRANSITION BETWEEN PRIMARY AND SECONDARY SCHOOL
ALEJANDRA MIZALA - PILAR ROMAGUERA - SEBASTIÁN GALLEGOS
DOCUMENTOS DE TRABAJO Serie Economía
Nº 268
Public-Private Wage Gap
In Latin America (1992-2007): A Matching Approach
Alejandra Mizala° Pilar Romaguera
Sebastián Gallegos
Center for Applied Economics Department of Industrial Engineering
Universidad de Chile
Abstract
Using matching methods, we estimate the public-private wage gap for urban workers in eleven Latin American countries for the 1992- 2007 period. These methods do not require any estimation of earnings equations and hence no validity-out-of-the-support assumptions; furthermore, this approach allows us to estimate not only the average wage gap but also its distribution. Our main findings indicate that the average public sector worker earns more than his/her private counterpart, and that this differential increased over the 1992-2007 period. Our results also show important differences along the wage distribution; in fact, public servants in the highest percentiles of the wage distribution generally earn less than their private sector equivalents. Nonetheless, the percentile at which a positive wage gap becomes a wage penalty shifted over the period as the average wage gap experienced by most countries widened. Still, the most qualified public sector workers do face a wage penalty. Furthermore, the data shows no relationship between our country ranking according to the public-private wage gap, and indicators of government effectiveness. Key words: Public-private wage gap, Matching, Public sector, Latin America, Government effectiveness. JEL Classification: J31, D31.
° Corresponding author e-mail: [email protected]. We are grateful to the Economic Commission for Latin America and the Caribbean (ECLAC), especially to Juan Carlos Feres, for providing access to the household surveys, and to Cristobal Castro for excellent research assistance. We thank our editor Marcus Frölich, two anonymous referees, Bernardo Lara, Claudia Sanhueza, and participants at the Latin America and the Caribbean Economic Association Meetings, the Chilean Economic Society Meetings and the Chilean Public Policy Society Meetings for comments and suggestions. Nonetheless, the contents of the present study are the sole responsibility of the authors. Funding from Fondecyt (Project Nº1040958) is gratefully acknowledged.
1
Public-Private Wage Gap in Latin America (1992-2007): A
Matching Approach
I. Introduction
The public sector is the biggest spender and employer in almost every developing country;
at the same time, government effectiveness, particularly the quality of public services and
the civil service, is still a concern, based on the recognition that good governance is a key
ingredient for development. These two facts seem to lie behind the continuing research on
how to measure the quality of the public service and the growing support for public sector
reforms, with civil sector enhancement as a major component.1
One of the requirements to increase the ability of government s to produce and implement
good policies is related to the ir capacity to attract and retain highly–skilled personnel,
which in turn relates to their wage policies.2 In this sense, the wage gap between public and
private sector workers is a relevant research topic.
The general perception is that civil servants are overpaid. The traditional empirical
evidence has endorsed this view, concluding that there is a substantial public sector
1 International lending organizations, such as the World Bank and the Inter-American Development Bank, have shown a renewed interest in civil service reforms. For example, Lora (2007) states that, after 20 years of reforms of a state apparatus, the region still has a long way to go in terms of modernizing civil service administration. The World Bank (2008) highlighted new civil service rules, including merit-based recruitments and promotion, to enhance public sector efficiency. Also, OECD (2008, 2009) argued that public servants’ management is still a highly sensitive issue in most OECD member countries. 2 As described by Van Dooren et al. (2008), one of the drivers of efficiency in the public sector is the human resources management practice, and wages are important for attracting and retaining qualified staff, especially in cases of skill shortages.
2
premium, as shown by the seminal work of Gregory and Borland (1999), followed by a
number of country-specific studies for both developed and developing economies. High
public sector wages are seen as a source of inefficiency in public service provision and as a
rent for public sector workers.
More recent research—mainly for developed countries—emphasizes that the wage
premium is not homogeneous across the wage distribution (Melly, 2005; Lucifora and
Meurs, 2006; Glinskaya and Lokshin, 2007); actually, these studies show that the wage
premium is highest at the lower end of the wage distribution and decreases as it moves up.
There are a number of studies for developing countries but, apart from Panizza (2001) and
Panizza and Qiang (2005), there is limited research for Latin America, a region that has
implemented major public sector reforms in recent decades (Lora, 2007; Chaudhry et al.,
1994; World Bank, 2008). In particular, few studies have explored the existence of a
negative high-skill wage premium in Latin America that may render it difficult for the civil
service to attract qualified workers.
This research attempts to fill this gap using a methodology tha t allows us to bring new light
onto a long-standing issue. Following Ñopo (2008) and Frölich (2007), we apply matching
methods to estimate the public-private wage gap for urban workers in eleven Latin
American countries (Argentina, Bolivia, Brazil, Chile, Colombia, Costa Rica, El Salvador,
Honduras, Panama, Paraguay, and Uruguay) for the years circa 1992, 1996, 1999, 2003 and
2007. We opt for this method because it does not require any estimation of earnings

3
equations and hence no validity-out-of-the-support assumptions are needed. Furthermore,
this approach allows us to estimate not only the average wage gap but also its distribution.
The objective of the paper is to compare public-private wage gap across different Latin
American countries and time periods and to relate them to the countries’ governance
indicators, labor market characteristics and macro variables. Therefore, we consider a group
of countries of different sizes, economic environments and institutional regulations.
This analysis is particula rly relevant since during the last two decades most Latin American
countries have made an effort to attract and retain highly-skilled personnel to the public
sector. Some of them implemented public sector reforms during the early and mid-1990s.
In our country sample, Brazil, Chile and Uruguay engaged in civil service reforms in the
1990s, while in Costa Rica competitive appointment processes based on meritocracy were
installed much earlier (in 1953) than in the rest of the region. Brazil’s public sector reform
was introduced in 1995 and included new forms of public sector organization, the adoption
of different employment regimes and a new human resources policy (Barzelay et al.,
2001).3 Uruguay launched a civil reform in 1997, with voluntary retirement for public
sector workers, a substantial reallocation of funds in order to improve internal management
and working conditions, and a redesign of payment systems (Lora, 2007). Since 1990,
Chile has implemented reforms in public administration that have gained scope over time,
deepening the strategy of management by results, but particularly since 2003 with the
3 In Brazil, only 30 percent of federal officials had a university degree in 1995, a figure that had risen to 63 percent by 2001 (Echabarría and Cortázar, 2007).

4
establishment of the Public Senior Management System with a merit-based selection of
civil servants, and a new professional career path (Echabarría and Cortázar, 2007).
We find that average public sector workers earn more than their private counterparts in all
the Latin American countries of our sample, and that this differential increased over the
1992-2007 period. Our results also reveal important differences along the wage
distribution: in fact, public servants in the highest percentiles of the wage distribution
generally earn less than the ir private sector equivalents. Nonetheless, the percentile at
which a positive wage gap becomes a wage penalty shifted over the period as the average
wage gap experienced by most countries widened. Still, the most qualified public sector
workers do face a wage penalty.
Moreover, it is interesting to notice that the data shows no relationship between our country
ranking according to the public-private wage gap, and an indicator of government
effectiveness, which captures perceptions on the quality of public service provision,
competence of public servants, and the quality of public policy formulation and
implementation (Kaufmann et al., 2009).
Besides this introduction, the paper is structured as follows. Section II provides a brief
overview of the literature on the public-private wage gap. In Section III the methodological
approach and the data are described. Section IV presents our results; first, we examine the
public-private wage gap for the most recent year, 2007, analyzing the gains obtained from
the methodological approach implemented, and the within-countries heterogeneities;

5
second, we analyze the evolution of the public-private wage gap through the 1992-2007
period, and we relate it to countries’ institutions and macro variables. Section V concludes.
II. Previous Literature on the Public-Private Wage Gap
The empirical evidence has devoted considerable attention to public-private wage
differentials. There are excellent surveys about this issue for developed countries; for
instance, Ehrenberg and Schwartz (1986) present evidence of a public sector wage
premium in their analysis of 23 studies. Gregory and Borland (1999) review 34 studies, and
find that the public sector wage premium is high and statistically significant for women but
not always statistically significant for men. 4
More recently, a large number of studies for developing countries have been published.
Among others, Adamchik and Bedi (2000) for Poland, Skyt-Nielsen and Rosholm (2001)
for Zambia, Christofides and Pashardes (2002) for Cyprus, Aslam and Kingdon (2009) and
Hyder and Reilly (2005) for Pakistan, Gorodnichenko and Sabirianova (2007) for Ukraine,
and Glinskaya and Lokshin (2007) for India. Also, there are studies that include more than
one country, such as Panizza (2001) and Panizza and Qiang (2005) for various Latin
American economies, and Lucifora and Meurs (2006) for France, the U.K. and Italy.
Most articles have found a public sector wage premium, which could be explained by
incentives to overpay public sector workers in order to buy their cooperation and political
4 Table S1 in the Supplementary Appendix summarizes some of the research on the public-private wage gap, adding up to the reviews by Gregory and Borland (1999) and Ehrenberg and Schwartz (1986).
6
support. First, because it is difficult for the society to punish governments politically for
paying higher wages to public servants; in addition, this greater wage costs can be passed
on to taxpayers (Borjas, 2000; Mueller 1998). Second, because public sector workers are
generally organized and constitute an important interest group that can exercise pressure on
the administration, and since most public services have no substitutes, governments have
low capacity to resist union pressure or strikes.
The methods applied have evolved over time; the earlier papers used to estimate mainly
earnings equations by OLS (Smith, 1976; Lindauer and Sabot, 1983). Later, new methods
intending to correct for selection bias due to the non-random allocation of workers between
sectors were implemented, e.g., Terrel (1993) for Haiti, Hou (1993) for Taiwan, and
Lassibille (1996) for Spain.
There are at least two issues highlighted by researchers when estimating wage gaps. First, it
has been argued that estimating only the average wage gap is a drawback, given wage
differentials’ heterogeneous behavior (e.g., Bales and Rama, 2002; Panizza, 2001; and Katz
and Krueger, 1991). In fact, some research has found that the public sector has a more
compressed wage structure than the private sector. The observed pattern is that workers in
the lower part of the conditional wage distribution have a positive differential with respect
to the private sector, while workers in the higher part of the wage distribution face a
negative differential (Gregory and Borland, 1999). Moreover, this literature can be divided
into: (i) those studies that analyze the heterogeneity of the wage premia for workers with
low/high skills (e.g., Panizza, 2001; Katz and Krueger, 1991); and (ii) those that examine
the wage gap at different points of the conditional wage distribution using quantile
7
regressions.5 In the case of developing countries, the evidence is limited. Skyt-Nielsen and
Rosholm (2001) for Zambia, and Hyder and Reilly (2005) for Pakistan find a positive
average public pay premium; this premium is found to decline monotonically as it moves
towards the higher part of the conditional wage distribution; interestingly, in Zambia the
pay gap became negative for highly educated public sector workers.
Second, on the methodological side, earnings equations and the Blinder-Oaxaca
decomposition have been criticized due to misspecification attributable to differences in the
supports of the empirical distributions of individual characteristics for the two groups of
workers being analyzed (Bellante and Ramoni, 2007; Ñopo, 2008). The problem is that
these methods do not restrict the comparison to those individuals with comparable
characteristics in both groups. To overcome this drawback, recent studies have applied
matching methods to estimate the public-private wage gap: Glinskaya and Lokshin (2007)
for India, and Bellante and Ramoni (2007) for the U.S. are good examples.
The existing literature on the public-private wage gap for Latin America does not address
these issues in depth. We attempt to fill this gap, applying matching methods, which allow
us to compare similarly-skilled public and private workers, considering differences in the
distribution of their observed characteristics. Moreover, this approach lets us analyze
whether the wage gap displays heterogeneous behavior throughout the conditional wage
distribution.
5 See Melly (2005) on Germany, Poterba and Rueben (1994) on the U.S., Mueller (1998) on Canada, Blackaby et al.(1999) on the U.K., and Lucifora and Meurs (2006) on Italy, France and the U.K.

8
III. Methodology and Data
Methodology
We use propensity score matching (PSM) to estimate the public-private sector wage gap for
a group of eleven Latin American countries for the years circa 1992 through 2007. PSM is
a technique frequently used to identify a control group that exhibits the same distribution of
covariates as a treatment group, in non-experimental data.6 As stated by Frölich (2007) and
Ñopo (2008), PSM can also be used outside the context of treatment evaluation; for
example, to disentangle the effects from observable and unobservable variables, as a
nonparametric alternative to the Blinder-Oaxaca wage differentials decomposition. 7
In this paper, we use the PSM method to identify workers in the public sector that display
the same observable characteristics as private sector workers, and compare their wages.
This approach does not require estimating earnings equations for public and private sector
workers, and thus it is not necessary to assume that the linear estimators of the earnings
equations are valid out of the supports of individual characteristics for which they were
estimated (Ñopo, 2008).
Individuals working in the public sector would be the treated group, while private sector
workers are our comparison group. As Frölich (2007) demonstrates, the consistency of
PSM follows from a purely mechanical property of conditional densities. Therefore, the
justification of PSM is not based on any properties of potential outcomes, at least when one
6 See, for example, Heckman et al. (1997), Dehejia and Wahba (2002), Lechner (2002), and Smith and Todd (2005). 7 See Blinder (1973) and Oaxaca (1973).
9
is interested in disentangling the effects from observables and unobservables, as is our case.
The PSM estimator is simply the mean difference in outcomes over the common support,
appropriately weighted by the propensity score distribution of participants.
In addition, PSM allows us to estimate not only the average wage gap between public and
private workers, but also its distribution. PSM can be used to estimate adjusted density and
distribution functions. Actually, we can estimate how much public sector workers would
earn if they had the same distribution of human capital characteristics as private sector
workers. The adjusted quantiles can be obtained indirectly by inverting the adjusted
distribution function obtained from PSM. This analysis provides insights into the
distribution of the unexplained wage differences between public and private workers.
Our implementation of the methodology follows carefully the steps suggested by Caliendo
and Kopeinig (2008). First, we estimate a probit regression for the treatment enrollment
probability8 on years of schooling, an interaction of schooling with post-secondary studies,
potential experience, potential experience squared, dummy variables for marital status and
part time workers, a set of dummies for occupations (professionals, technicians, blue-
collars, etc.) and regional dummies (country-specific);9 this specification is the same across
all the countries and years (1992 through 2007).10 Second, the treated units are matched.
Since gender differences will most likely play a relevant role in the public-private wage
gap, instead of including a gender dummy in the PSM estimation we condition on exact
matches with respect to gender. Moreover, we implement a range of algorithms in order to
8 The propensity score is computed using the respective sample weights for each country. 9 For each country, the metropolitan region is used as reference. 10 The only exception is Brazil, which does not have data on marital status.

10
gauge the effect of using a particular matching estimator on the outcome; nonetheless, as
the results are robust we report only kernel matching. 11 Third, we use two methods to
accurately determine the region of common support: (i) all observations with a propensity
score smaller than the minimum and larger than the maximum in the opposite group
(minima and maxima criterion) were deleted, (ii) the trimming approach of Heckman et al.
(1997) was used;12 in particular, five percent of the observations with low density values
were trimmed. As a robustness check we also trimmed 10 percent of the observations with
low density values, and following Black and Smith (2004) we defined a thick support
region defined by . Fourth, the matching quality is assessed through the
standardized mean bias (SMB) suggested by Rosenbaum and Rubin (1985), and the
pseudo-R2 suggested by Sianesi (2004); the reduction in the standardized difference for
some of the variables considered is also calculated. Fifth, the average public-private wage
gap for common support population and the adjusted density are estimated using log-
wages. Taking advantage of the matching approach we obtain the cumulative empirical
distribution function of hourly wages for the matched samples of public and private sector
workers. At any percentile the horizontal distance between the two distribution functions
after matching is a measure of the unexplained public-private wage gap at the respective
percentile (Ñopo, 2008).
11We implement one-to-one matching with replacement, five-nearest neighbor matching, radius matching and kernel matching. For the one-to-one matching with replacement, the five-nearest neighbor matching, and the radius matching, we define a caliper (or value for maximum distance of controls) of 0.01. 12 See also Heckman et al. (1998) and Smith and Todd (2005).
11
The data
The information sources are official household surveys for eleven Latin American countries
(Argentina, Bolivia, Brazil, Chile, Colombia, Costa Rica, El Salvador, Honduras, Panama,
Paraguay and Uruguay), provided by the Economic Commission for Latin America and the
Caribbean (ECLAC). The countries have been selected in part based on data availability;
nonetheless, they represent Latin American economies of different sizes and degrees of
development, with different labor market characteristics and governance indicators. To
examine the evolution of the wage gap, we consider cross section data for five years,
household survey circa 1992, 1996, 1999, 2003, and the most recent household survey
(circa 2007).13
All urban workers of working age that declare having positive labor income from work are
included in the study; the analysis is focused on hourly labor earnings from the main job,
measured as declared monthly earnings divided by declared monthly hours. We work with
the broadest definition of public sector, which includes all individuals that declare to work
in the public sector. In this sense, our characterization is similar to the one used by Panizza
in his previous studies.14
13 The year of the household surveys differs for Argentina (2006 instead of 2007; also the year 1992 was not included because we could not differentiate between public and private sector workers), Bolivia (1997 instead of 1996), Chile (2000 and 2006 instead of 1999 and 2007, also year 1992 was not included because we could not differentiate between public and private sector workers), Colombia (1993, 2000 and 2005 instead of 1992, 1999 and 2007), Honduras (2001 and 2006 instead of 1999 and 2007), Panama (1991, 1997, 2001 and 2006 instead of 1992, 1996, 1999, and 2007), Paraguay (1990 and 1995 instead of 1992 and 1996), and El Salvador (1991 and 2000 instead of 1992 and 1999). 14 In order to check the robustness of our results, we also use a narrower definition, considering only civil servants (excluding workers in social service sectors, such as education and health-care, and excluding also workers in state-owned companies). The results are similar to those presented in the next section, and are available from the authors upon request.
12
The comparisons between public and private employment include self-employed workers,
following research that argues that self-employment is an important activity for those
workers that have been released from the public sector (Alderman et al., 1996; Rama and
MacIsaac, 1999; Bales and Rama, 2002). For the year 2007 we divide workers in the
private sector into two comparison groups for public workers: (i) private employees and (ii)
self-employed individuals; this allows us to investigate whether there are systematic
differences in the wage gap between public workers and these two groups of private
workers.
Table 1 presents descriptive statistics of workers’ log-hourly wage and years of schooling,
the magnitude of public sector employment according to the broadest definition, and the
number of public and private sector workers (sample size and population).15 On average,
public sector workers have higher labor earnings than private workers, in all countries and
for all years analyzed. These higher public sector wages can be explained because public
workers have more years of schooling than private workers.
Table 1 also shows that, on average, public sector employment accounted for around 16.8
percent of total urban employment in 1992, decreasing to around 12.9 percent in 1996 and
with no significant changes during the rest of the period.16 However, there are some
15 Table S2 in the Supplementary Appendix presents descriptive statistics of observable workers’ characteristics, including gender, marital status, potential experience a n d occupation. The percentage of women working in the public sector tends to be higher than those working in the private sector for the whole period. Also, there are more married workers in the public sector than in the private sector, but there are not systematic differences between public and private workers in terms of potential experience (age). 16 In our sample, the percentage of public sector workers is similar to the International Labor Office (ILO) statistics. Both show a stabilization of public employment figures during the period, after the reductions that took place in the early 1990s. According to ILO, public employment in Latin America represented, on
13
differences across countries; Costa Rica and Panama stand out as the countries with the
largest shares of public sector employment (21.4 and 27.1 percent in 1992, and 15.9 and
17.8 percent in 2007, respectively), while Chile and Colombia have the lowest (10.1 and
9.9 percent in 1996, and 9.8 and 7.7 percent in 2007, respectively).
IV. Results
We first present, for the most recent year (circa 2007), the average estimated public-private
wage gap, the cumulative empirical distribution function of hourly wages of public and
private workers, before and after matching; and the unexplained public-private wage gap
for different percentiles of the hourly wage distribution.
Next, since we have data for several time periods, we analyze the evolution of the public-
private wage gap throughout the 1992-2007 period. This is interesting because Latin
American countries have made efforts to increase the professionalization of their public
servants. In fact, public sector reforms have occurred in the early and mid-nineties in some
of the countries in the sample, and in some countries labor market conditions and
institutional regulations have changed during the period.17
Finally, we examine the relationship between the wage gap and countries’ governance
indicators, as well as with labor market and macroeconomic characteristics.
average, 15.5 percent of urban employment in 1990, dropping to 13.5 percent in 1995, 12.8 percent in 2000, and 12.8 percent in 2007 (ILO, Panorama Laboral, several issues). 17 See Echavarría and Cortázar (2007).
14
a) 2007 results
Table 2 shows the public-private wage gaps by country for the year 2007. The raw wage
gap simply reflects the difference in mean wages between both sectors. The unexplained
wage gaps are estimated using Kernel-Epanechnikov algorithm conditioning on exact
matches with respect to gender.18,19
The raw public-private wage gap shows that, for every country analyzed, public sector
workers earn more than private sector workers. After performing matching comparisons,
the unexplained wage gap decreases, but continues to favor public sector workers in all
countries studied and all of them (except for Paraguay) are statistically different from zero
at the 5-percent level. The ranking of countries according to the ir public-private wage gaps
starts with Uruguay, followed by Bolivia, Honduras and Colombia, then by Panama, El
Salvador, Argentina, and Brazil, and at the end Costa Rica, Chile and Paraguay. Our results
on the public-private wage gap confirm the common view that public sector workers earn
more than their private counterparts.
To empirically analyze the benefits of this method, we compare the results obtained, vis-à-
vis a traditional Blinder-Oaxaca (B-O) approach. First, we estimate the public-private wage
gap using the B-O decomposition—in terms of differences in workers’ average
characteristics and differences in the average returns to these characteristics—, and we
compare the unexplained public-private wage gap estimated using B-O with the 18 In order to check the robustness of our results, the one-to-one matching with replacement, five-nearest neighbor matching, radius matching were also estimated; all matching algorithms show similar results. These outcomes can be obtained from the authors upon request. We use existing software routines (psmatch2) to run the estimation. The raw gap and the unexplained wage gaps are calculated using log-wages. 19 The quality of the matching is satisfactory for all countries, an assessment of it is presented in Table S3 of the Supplementary Appendix.
15
unexplained gap estimated identifying differences in supports. Second, following Ñopo
(2008), we obtain the unmatched public sector workers and examine the differences in
covariates on this uncommon part of the support.
Table 2 shows that the unexplained differences estimated using Blinder-Oaxaca (column 2)
overestimate the public-private wage gap (column 3). Differences in the support account
for an important share of the gap; in effect, in most countries unmatched public sector
workers are highly educated workers, mainly women, with more potential experience
(except in Paraguay), and a high percentage of them are married (see Table A1 in the
Appendix). These highly educated women with more years of potential experience have
lower gender wage penalty and higher return to experience in the public sector than in the
private sector. Since they are included in the Blinder-Oaxaca decomposition and are not
included in the matching approach, the former tends to overestimate the component of the
wage gap attributable to differences in the returns.20
Nevertheless, the average unexplained wage gap (column 3) does not describe the full
picture if public-private wage differentials are heterogeneous throughout the conditional
hourly wage distribution. Thus, taking advantage of the matching approach, we obtain the
unexplained wage gap for different percentiles of the wage distribution (columns 6-12
Table 2). In all countries the public sector premium, which is economically relevant at the
lower percentiles, decreases along the wage distribution, and in most countries, except
20Lucifora and Meurs (2006), using quantile regression methods, find that women are better off in the public sector with respect to men, mainly at higher quantiles of the wage distribution. For Latin America, Panizza and Qiang (2005) find that the premium associated with working in the public sector is often higher for women than for men.
16
Brazil, turns into a wage penalty for public sector workers. Previous studies have shown
similar results for developed countries.21
It is interesting to determine at what percentile of the wage distribution the public sector
premium turns into a penalty. To examine this fact in more detail, we follow Ñopo (2008)
and Frölich (2007) and calculate the horizontal distance between the private and public
hourly wage cumulative distribution functions at any percentile, i.e., the absolute wage gap
between both sectors. The absolute wage gap at, e.g., the 20th percentile, is the difference
between the wage at the 20th percentile in the public workers’ hourly wage distribution and
the wage at the 20th percentile in the private workers’ distribution. Figure 1 presents the
absolute public-private wage gap by percentiles before and after matching for each country
in 2007. They show, as mentioned before, that the unexplained wage gap decreases as it
moves towards the upper percentiles of the log hourly wage distribution. The public sector
wage premium became a penalty around the 95th percentile for Argentina and at the 80th
percentile for Chile and El Salvador. In Paraguay, the public sector wage premium became
a wage penalty around the 60th percentile.22
In sum, we find that, on average, public sector workers are overpaid, but this is not the case
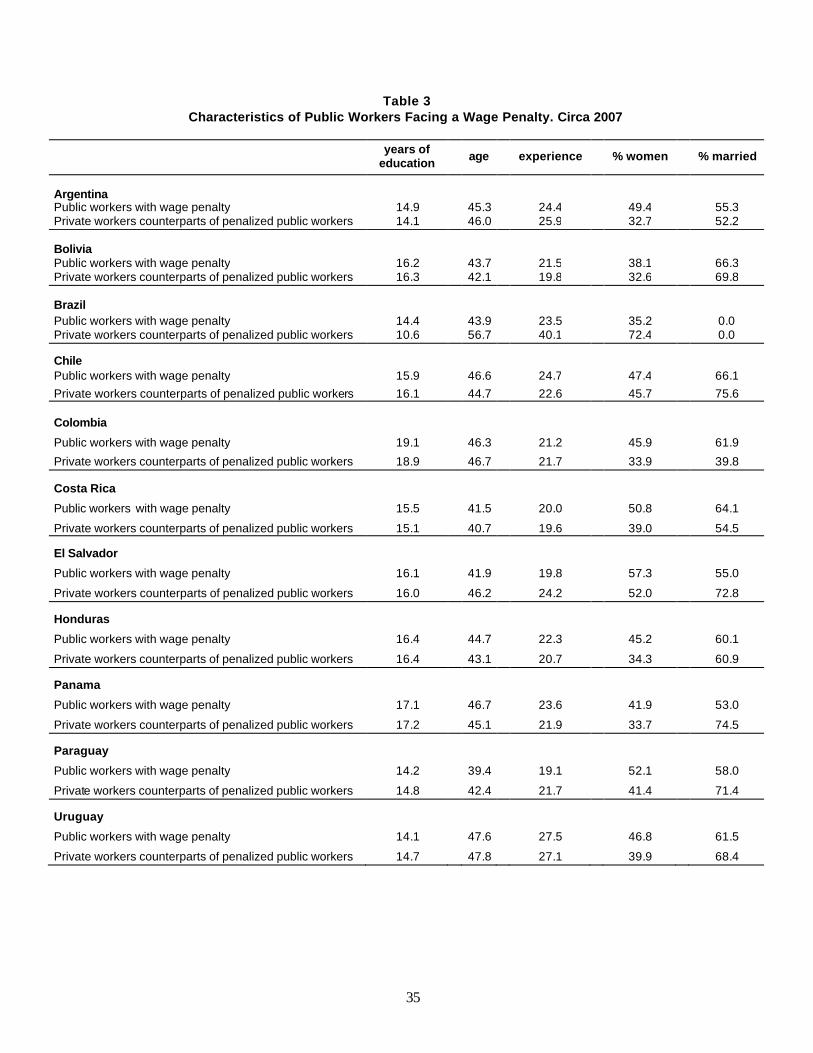
for higher wages individuals. In Table 3, we present the characteristics of these higher
wages public sector workers and their peers at the private sector in terms of education, age,
experience, gender and marital status. Individuals in the highest percentiles of the wage 21 See section on previous literature. 22 In order to be sure that there is enough common support to make explicit statements over the entire distribution, we perform trimming at 5 and 10 percent and we distinguish regions of thick support following Black and Smith (2004). In the Supplementary Appendix, Table S4, we present the results obtained using different trimming and the Black and Smith criterion; the results are robust to these different methods.

17
distribution, that receive a wage penalty in the public sector, show high levels of human
capital, they have 14 and more years of education (16-17 years of schooling in many
countries), and more than 20 years of experience. In demographic terms, they are 40-48
years old, and are married more often than not. Also, between 42-52 percent are women,
except in Brazil and Bolivia where females account for a smaller percentage. Their peers in
the private sector have similar years of education, age and experience, with less
participation of women (apart from Brazil). The wage penalty could be explained by the
smaller return to post-secondary education, and therefore, the smaller return to being a
professional in the public vis à vis the private sector. The question is why highly educated
people choose to work in the public sector even though they face a wage penalty; one
possible answer is that they obtain non-monetary returns as political power and the capacity
to implement their ideas and produce changes in their countries. Ano ther possible
explanation is that there are risk-averse individuals that put a high value on job stability,
which may be stronger in the public sector.
In addition, given that self-employment could be considered a niche of dismissed public
servants, we separate workers in the private sector into two comparison groups for public
sector workers: private employees and self-employed individuals. Table A2 presents these
results for 2007; for every country (except Brazil), the unexplained public-private wage gap
is larger when self-employed individuals are considered in the comparison group than when
the comparison group includes only private employees. Again, this average unexplained
wage gap does not reflect the fact that there are important differences along the wage
distribution; the wage gap between public sector and self-employed workers is very high at
lower percentiles and decreases considerably when we move to higher percentiles, turning
18
into a wage penalty for higher wages individuals in most countries (all except Argentina,
Bolivia, and Costa Rica). This behavior could be explained by the fact that individuals at
the lower end of the wage distribution probably are low-skilled informal workers, while
individuals at the upper part of the wage distribution are self-employed professionals (i.e.,
consultants). In every country the wage gap between public sector workers and private
employees is positive but smaller than the gap with self-employed workers, and turns into a
wage penalty at the upper end of the distribution for every country except Brazil. In
general, the comparison with private employees leads to a higher penalty for public sector
workers than the comparison with self-employed individuals; the exceptions are Honduras
and Panama where the wage pena lty is much heavier when the comparison is with self-
employed individuals, and Brazil where public sector workers enjoy a wage premium
compared with private employees.
b) Evolution of the wage gap
Through the period 1992-2007, the unexplained public-private wage gap continued to favor
public sector workers in 42 out of 53 cases.23 Moreover, the public-private wage gap
increased in all the countries except Costa Rica and Paraguay, which experienced an
increase and then a decline over the period. Colombia, El Salvador and Panama showed
systematically the greatest wage differential in favor of public sector workers in all years,
while Chile and Paraguay showed the smallest (see Table 4).
23 The exceptions are some countries where the wage gap is statistically not different from zero (Argentina, Brazil, Chile, and Uruguay in 1996, Bolivia in 1992, and Paraguay 1992, 1996, 1999 and 2007), and countries that have a slightly negative wage gap (Chile in 1999 and Uruguay in 1992).
19
Table 4 also presents the unexplained wage gap for different percentiles of the wage
distribution for the whole period. In all the countries except El Salvador the wage premium
in favor of public sector workers located at the bottom percentiles of the wage distribution
increased through the period. Also, wages have improved for public sector workers located
at the higher end of the conditional hourly wage distribution, although, as already
mentioned, for the highest percentiles—90th and, in some cases, 75th and up—there is still a
wage penalty in nearly every country. The exceptions are Costa Rica and Paraguay, where
the wage penalty experienced by public sector workers increased in the later years of the
period, and El Salvador, where the wage penalty decreased and vanished in 2003, appearing
again in 2007.
The unexplained wage gap is systematically bigger for the bottom percentiles in El
Salvador, Panama, and Colombia, while Brazil, Chile and Costa Rica have the smallest
public sector wage premium throughout the conditional hourly wage distribution.
Nonetheless, after 1996, Chile experienced a significant decline in the wage penalty faced
by public servants in the highest percentiles of the wage distribution. This could be
explained by the reform on human resources management implemented in this country,
aiming to attract and retain highly-skilled workers in the public sector. This is also the case
for Uruguay that engaged in a civil service reform in 1997; in 1996 the wage penalty was
-0.37 and -0.49 at the 90th and 95th percentiles, respectively, and by 2007 it decreased to
-0.02 and -0.12 at the 90th and 95th percentile, respectively.
The unexplained wage gap is systematically wider and negative for the top percentiles in
the case of Paraguay and, in the first years of the period, for Bolivia, Chile and Uruguay.
20
This is consistent with our findings for the average unexplained wage gap. Figure 2 shows
the absolute public-private wage gap by percentiles after matching for every country and
for each one of the years considered in the study; it allows us to visualize the above
mentioned behavior of the unexplained wage gap.
c) Is there a relationship between the public-private wage gap and countries’
characteristics?
In this section we intend to correlate the estimated public-private wage gap with various
macro and governance indicators. We are interested in how indicators that measure
different dimensions of governance relate to the average unexplained wage gap and to the
unexplained wage gap at different percentiles of the wage distribution, controlling for some
macroeconomic variables and labor market characteristics.
We work with the Worldwide Governance Indicators (WGI) of the World Bank (Kaufmann
et al., 2009); in particular with those that cover three dimensions of governance, namely:
voice and accountability, government effectiveness, and rule of law. 24 These indicators are
based on several hundred individual variables measuring perceptions of governance. Voice
and accountability captures perceptions about the extent to which a country’s citizens are
able to participate in choosing their government, as well as freedom of expression and
association. Government effectiveness captures perceptions on the quality of public
services, the quality of civil service and the degree of its independence from political
24The number of observations in the regressions is determined by the availability of these indicators, Kaufmann et al, (2009) provide data from 1996 to 2008. We also considered three other indicators: political stability, regulatory quality and control of corruption, but we did not include them here because for the group of countries being analyzed they are highly correlated with the indicators included, and have no relationship with the wage gap.
21
pressures, as well as the quality of policy formulation and implementation and the
credibility of the government’s commitment to such policies. Rule of law captures the
perceptions about the extent to which agents have confidence in the rules of society, in
particular the quality of contract enforcement, property rights, the police and the courts, as
well as the likelihood of crime and violence.
The labor market characteristics and macroeconomic variables included are: an index of
unionization in the private sector, public sector employment participation, female labor
force participation, GDP per capita, and inflation rate. 25
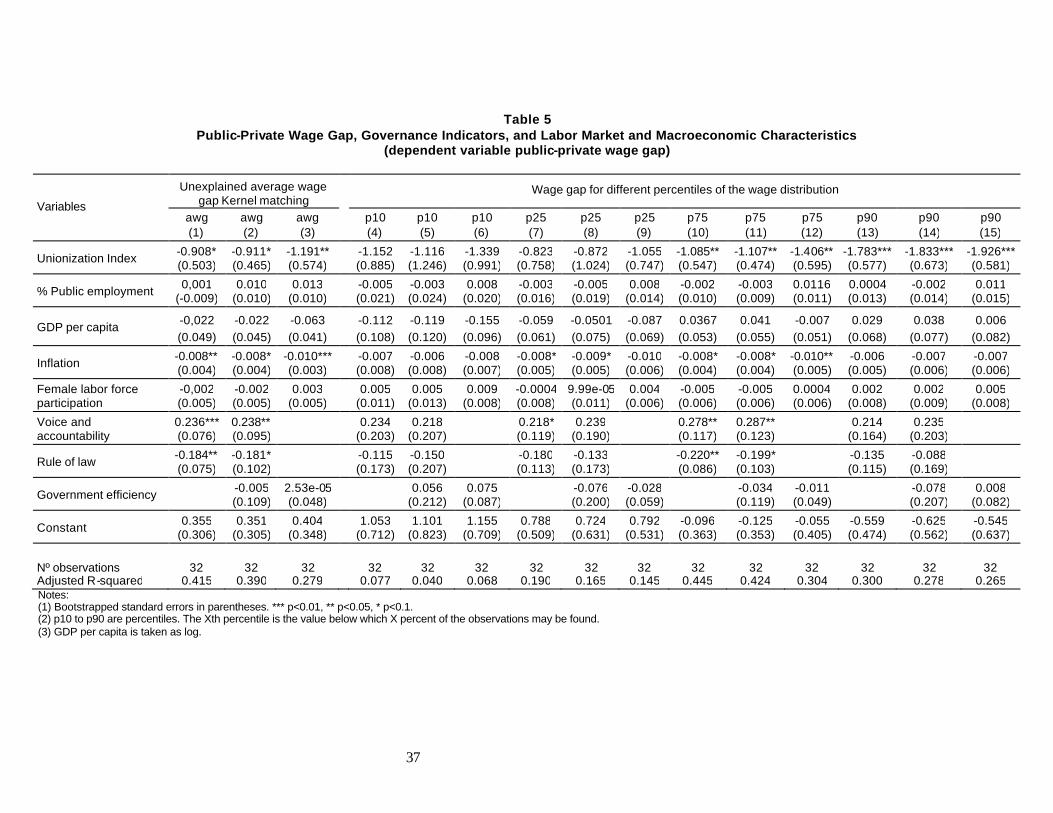
Table 5 present s different specifications for the relationship between the average
unexplained public-private wage gap and these variables. It is interesting to notice that in
all of them the relationship between the degree of private sector unionization and the wage
gap is negative and statistically significant; thus, the higher the unionization of the private
sector, the lower the wage gap. Also, the inflation rate shows a negative and statistically
significant relationship with the public-private wage gap. This could be explained by the
fact that private wages adjust more rapidly to inflation than public wages. The rest of the
macroeconomic variables are not statistically significant in any of the specifications
considered.
25 The data was obtained from the World Bank and the International Labor Office. We also estimated alternative specifications considering other macroeconomic variables and countries’ characteristics, such as trade openness, the Gini coefficient, size of the informal sector, percentage of population with 12 or more years of education, but most of these variables show no relationship with the wage gap. Unfortunately, there is no information available on the degree of unionization in the Latin American public sector. The problem is that in many countries, for example Chile, associations of public sector workers exist and, even though they are involved in wage bargaining with the government, are not formally considered a union.

22
The governance indicators show some relationship with the average public-private wage
gap, in particular, the degree to which citizens are able to participate in government
elections. Freedom of expression and association is positively related and statistically
significant with the wage gap. In contrast, rule of law is negatively and significantly related
with the wage gap. Furthermore, government efficiency shows no relationship with the
wage gap. Thus, there is no evidence that the quality of the service provided by the public
sector is related with the wage gap in favor of its workers. These results can be explained
by the fact that Latin American countries with high quality of public administration
according to the WGI, including Brazil, Chile and Uruguay, are the ones with smaller
unexplained public-private wage gap, and countries like El Salvador and Honduras with a
relatively high unexplained public-private wage gap have lower indicators of public sector
efficiency. 26
We also estimate similar regressions for the unexplained wage gap at different percentiles
of the wage distribution (Table 5). It is interesting to no tice that for lower percentiles (P10)
neither the index of unionization nor the inflation rates present a statistically significant
relationship with the wage gap, at percentile 25th only the inflation rate statistically
significant at 10 percent; only at a higher percentiles (P75th and P90th) the coefficients for
the unionization index increase and became statistically significant at 5 or 1 percent.
Therefore, the estimation results for the average wage gap are mainly explained by the
relationship between both variables at higher percentiles of the wage distribution. One
possible explanation is that low-income private sector individuals work in sectors with
26 See Kaufmann et al. (2009) and www.govindicators.org for more details. Similar information gives an IADB study which ranked the quality of public administration in Latin America, with Brazil and Chile at the top of the list (Lora, 2007).
23
lower unionization rates, for instance, the service sector; therefore, they are less effective in
terms of wage bargaining than higher income private employees working in sectors like
mining or manufacturing. Hence, the degree of unionization of the private sector tends to
reduce the wage gap at higher percentiles of the wage distribution. The more effective use
of their bargaining power by private workers at the higher end of the wage distribution can
also explain their ability to have their salaries adjusted with respect to inflation.
In terms of the governance indicators, at the 75th percentile voice and accountability is
significant and positively related with the wage gap, and rule of law is negatively related
and statistically significant, both with coefficients slightly larger than those obtained for the
average wage gap. Government effectiveness, as measured by the WGI, is not related with
the wage gap at any percentile of the wage distribution.
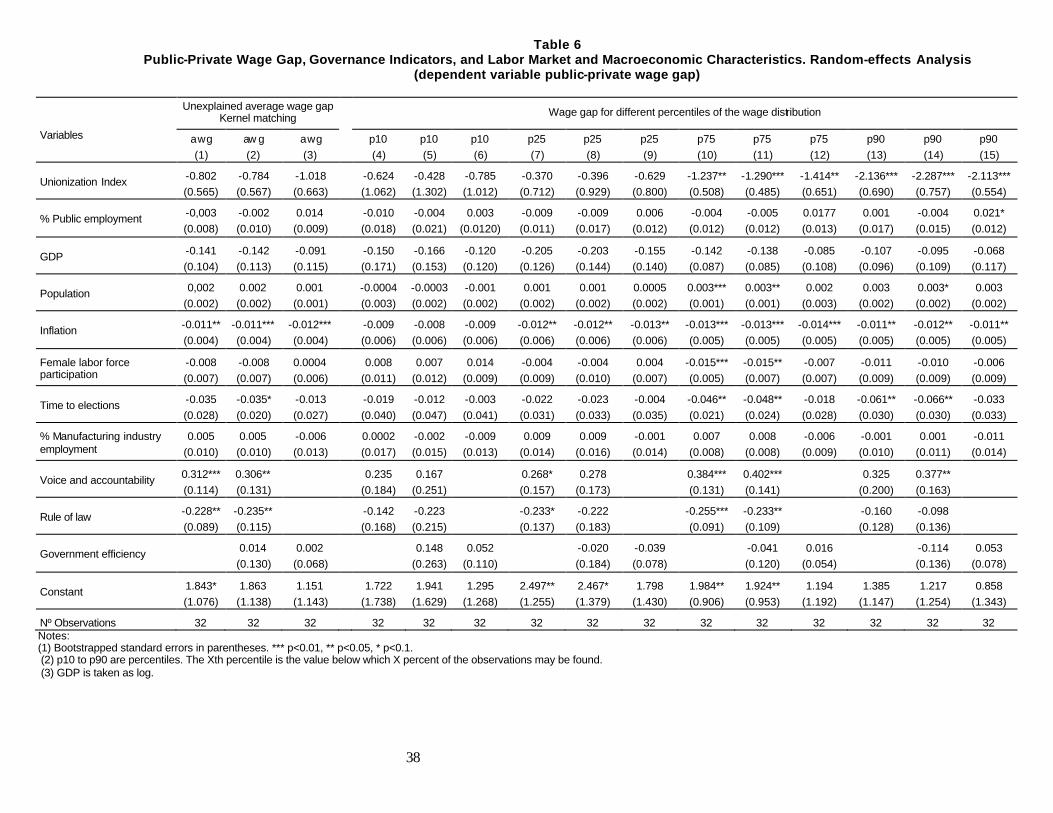
In order to evaluate the robustness of the results obtained we perform a random-effects
analysis in order to gain more precision, also including other variables which could
potentially affect the wage gap, such us: country size measured by the GDP, population,
manufacturing industry employment participation, and time to elections.27
Table 6 presents the results. It is interesting to notice that when including the employment
participation of the manufacturing industry in the regression, the relationship between
private sector unionization and the average unexplained wage gap, although negative, is not
statistically significant, maybe because the manufacturing industry tends to have high
27 Time to elections is measured as the number of years between the time of the household survey and the next presidential election.
24
unionization rates. The inflation rate still shows a negative and statistically significant
relationship with the wage gap; if private wages adjust more rapidly to inflation than public
wages, the inflation rate will reduce the public-private wage gap. The only other macro-
variable that shows a statistically significant (at 10 percent) relationship with the wage gap
is time to elections, although this occurs in only one of the specifications.
In terms of governance indicators, the results are similar to those previously obtained; voice
and accountability presents a positive and statistically significant relationship with the wage
gap, and rule of law is negatively and significantly related with the wage gap, both
variables with regression coefficients slightly larger than those previously obtained. Again,
government efficiency shows no relationship with the wage gap.
We also estimate these regressions for the wage gap at different percentiles of the wage
distribution. For lower percentiles (P10) none of the variables have a statistically significant
relationship with the wage gap. At percentile 25th only the inflation rate is negatively
related to the wage gap and for one of the specifications voice and accountability is
positively related and statistically significant at 10 percent. At percentile 75th and 90th the
regression coefficients of the private sector unionization index and the inflation rate
increase and became statistically significant, endorsing the results obtained before. At these
percentiles (at least for two specifications) the variable time to elections presents a negative
and statistically significant relationship with the wage gap; a possible explanation for this
25
result would be that when elections are close the government tends to increase salaries to
obtain the support of public servants, widening the public-private wage gap.28
In terms of governance indicators voice and accountability is positively and significantly
related to the wage gap at the 75th percentile, and in one of the specifications at the 25th and
90th percentiles. Rule of law is significant and negatively related with the wage gap at the
75th percentile and in one of the specifications at the 25th percentile. Government
effectiveness is not correlated with the wage gap at any percentile of the wage distribution
for the Latin American countries included in the study.
V. Conclusions
This paper uses a propensity score matching approach that follows Frölich (2007) and
Ñopo (2008) to analyze whether there is a wage gap in favor of public sector workers in
Latin America, and, if so, how this gap has evolved during the 1992-2007 period. The
methodology emphasizes the no need for out-of-support assumptions, deals partially with
selection bias problems, and provides information about the distribution of the unexplained
pay differences. In general, we find that public sector workers earn more than their private
counterparts and this differential increased over the 1992-2007 period.
We also intend to correlate the estimated public-private wage gap with governance
indicators, controlling for countries’ labor market and macroeconomic characteristics. It is
28 Data for Chile shows a negative correlation between the difference between public-private wage increases and time to elections.

26
interesting to notice that, in spite of the important public sector reforms that have taken
place in Latin America since the 1990s, we find no relationship between our countries’
public-private wage gap ranking and government effectiveness, which captures perceptions
on the quality of public services provision, the civil service and the capacity to produce and
implement good policies. This finding is in line with the WGI results that ranked Latin
American countries according to governance effectiveness, placing Chile as number one,
followed by Uruguay, Costa Rica and Brazil, then, Argentina, Paraguay and Bolivia,
followed by El Salvador and Honduras; this ranking does not match our public-private
wage gap in these countries. Similarly, an Inter-American Development Bank’s study
ranked the quality of public administration in Latin America, with Brazil and Chile at the
top of the list, followed by Costa Rica, Uruguay, and Argentina, and with Bolivia and
Paraguay at the bottom (Lora, 2007).
In this sense, our results appear more consistent with traditional explanations provided by
previous studies; i.e., the public sector wage premium reflects incentives to overpay public
sector workers and buy their cooperation and political support. We also find that the public
sector wage premium seems higher in countries where the bargaining power of the private
sector, measured by private unionization rates, is weak; this relationship is stronger for
workers in the highest percentiles of the wage distribution.
Our results also show that there are important differences along the wage distribution; in
general, public sector workers in the highest percentiles of the wage distribution earn less
that their private counterparts. This confirms the evidence provided by other authors for
developed countries.
27
One reason why less skilled workers are better paid in the public sector could be the State’s
intention to be seen as a “good employer” of the least skilled workers; thus, fair rates of pay
are offered to them (Bender and Elliott, 1999; Lucifora and Meurs, 2006). Since Latin
American economies are characterized by a highly unequal wage distribution, any small
State’s effort to be a “fair employer”, paying more to the least skilled workers, will tend to
produce a compressed wage structure, that is, a positive wage gap for the lowest percentiles
and a wage penalty for the highest percentiles of the wage distribution.
We also find that the percentile at which a positive wage gap is transformed into a negative
wage gap has shifted over time, due to the increase in the public-private wage gap
experienced by most countries between 1992 and 2007. One of the greatest changes in
relative wages happened in Chile and Uruguay; both countries had a substantial increase in
the wage premium for the highest deciles. While there is no in-depth evidence of the effect
of reforms on public wages, as already mentioned Uruguay and Chile have engaged in civil
service reforms during the last several years, implementing a more competitive selection
and promotion for senior staff members, with increases in wages, and also greater
transparency on public wage policies. In this sense, anecdotic evidence provides some
support to the hypothesis that the time tendency in relative wages could be partially
influenced by public civil service reforms.
Despite the changes in the wage gap at higher percentiles of the wage distribution, still the
most qualified public sector workers face a negative wage gap. However, it must be
acknowledged that the data does not consider other benefits that senior officials could be

28
enjoying; in this sense, the relative penalty for higher skilled workers could reflect non
compensating factors, such as political power or other benefits difficult to measure with
available data.
29
References
Adamchik A, Bedi S. Wage differentials between the public and the private sectors;
evidence from economy in transition. Labour Economics 2000; 7(2); 203–224.
Alderman H, Behrman J, Ross D, Sabot R. Decomposing the gender gap in cognitive skills
in a poor rural economy. Journal of Human Resources 1996; 32(1); 229-254.
Aslam M, Kingdon G. Public–private sector segmentation in the Pakistani labour market.
Journal of Asian Economics 2009; 20; 34–49.
Bales S, Rama M. Are public sector workers underpaid? Appropriate comparators in a
developing country. 2002; Mimeo, World Bank.
Barzelay M, Gaetani F, Cortázar JC, Cejudo G. Research on public management policy in
the Latin American region. 2001; IADB.
Bellante D, Ramoni J. Do truly comparable public and private sector workers show any
compensation differential? Journal of Labor Research 2007; 28(1); 117-133.
Bender KA, Elliott RF. Relative earnings in the UK public sector; the impact of pay reform
on pay structure. In: Elliott B, Lucifora C, Meurs D (Eds), Public sector pay
determination in the European Union, Macmillan; 1999. P. 285–328.
Black D, Smith J. How robust is the evidence on the effects of college quality? Evidence
from matching. Journal of Econometrics 121; 99-124.
Blackaby D, Murphy P, O’Leary N. The payment of public sector workers in the UK;
reconciliation with North-American findings. Economics Letters 1999; 65; 239-243.
Blinder A. Wage discrimination, reduced form and structural estimates. Journal of Human
Resources 1973; 8(4); 436-455.
Borjas G. Labor economics. McGraw-Hill; 2000.
Caliendo M, Kopeinig S. Some practical guidance for the implementation of propensity
score matching. Journal of Economic Surveys 2008. 22(1); 31–72.
Chaudhry SA, Reid GJ, Malik WH 1994 (Eds). Civil service reform in Latin America and
the Caribbean; proceedings of a conference. World Bank, Washington, D.C.
(Technical Paper Nº 259).
Christofides L, Pashardes P. Self-paid employment, public private sector selection and
wage differentials. Labour Economics 2002;.9; 737–762.
Dehejia R, Wahba S. Propensity score-matching methods for non-experimental causal
30
studies. Review of Economics and Statistics 2002;.84(1); 151-161.
Echabarría K, Cortázar JC 2007. Public administration and public employment reform in
Latin America. In Lora E (ed), The state of the state reform in Latin America. Inter-
American Development Bank and Stanford University Press.
Ehrenberg R, Schwartz J 1986. Public sector labor markets. In O. Ashenfelter and R.
Layard (Eds), Handbook of Labor Economics, North Holland, 1986.
Frölich M. Propensity score matching without conditional independence assumption with
an application to the gender wage gap in the United Kingdom. Econometrics Journal
2007; 10; 359–407.
Glinskaya E, Lokshin M. Wage differentials between the public and private sectors in
India. Journal of International Development 2007; 19(3); 333 - 355.
Gorodnichenko Y, Sabirianova K Public sector pay and corruption; measuring bribery
from micro data. Journal of Public Economics 2007; 91; 963–991.
Gregory R, Borland J 1999. Recent development in public sector labor markets. In O.
Ashenfelter and R. Layard (Eds), Handbook of Labor Economics, North Holland:
Amsterdam; 1999.
Heckman J, Ichimura H, Todd P Matching as an econometric evaluation estimator. Review
of Economic Studies 1997; 65(2); 261-294.
Hou J. Public-private Wage Comparison; A case study of Taiwan. Journal of Asian
Economics 1993; 4(2); 347-362.
Hyder A, Reilly B. 2005. The public sector pay gap in Pakistan; a quantile regression
analysis. PRUS Working Paper N° 33.
ILO, Panorama Laboral; América Latina y el Caribe. International Labor Office, (various
years).
Katz L, Krueger A. 1991. Changes in the structure of wages in the public and private
sector. In R. Ehrenberg (ed.. Research in labor economics, JAI Press.
Kaufmann D, Kraay A, Mastruzzi M Governance matters VIII. Agregate and individual
governance indicators 1996-2008. Policy Research Working Paper 2009; Nº 4978,
World Bank.
Lassibille G. Wage gaps between the public and private sectors in Spain. Economics of
Education Review 1996; 17(1); 83-92.

31
Lechner M. Some practical issues in the evaluation of heterogeneous labour market
programmes by matching methods. Journal of the Royal Statistical Society2002;
165; 59– 82.
Lora E. 2007. State reform in Latin America; a silent revolution. In E. Lora (ed) The state
of the state reform in Latin America. Inter-American Development Bank and
Stanford University Press.
Lucifora C, Meurs D. The public sector pay gap in France, Great Britain and Italy. Review
of Income and Wealth 2006; 52(1); 43-59.
Melly B. Public-private sector wage differentials in Germany, Evidence from quantile
regression. Empirical Economics 2005; 30; 505–520.
Mueller R. Public-private wage differentials in Canada; Evidence from quantile
regressions. Economics Letters 1998; 60(2); 229-235.
Ñopo H. Matching as a tool to decompose wage gaps. Review of Economics and Statistics
2008; 90(2); 290–299.
Oaxaca R. Male-female wage differentials in urban labor markets. International Economic
Review 1973; 14(3); 693-709.
OECD 2008. The state of the public service. Paris.
OECD 2009. Governance at a glance. Paris.
Panizza U. Public sector wages and bureaucratic quality; Evidence from Latin America.
Economía 2001; 2(1); 97-151.
Panizza U, Qiang C. Public–private wage differential and gender gap in Latin America;
Spoiled bureaucrats and exploited women? Journal of Socio-Economics 2005; 34;
810–833.
Poterba J, Rueben K. 1994. The distribution of public sector wage premia; new evidence
using quantile regression methods. NBER Working Paper Nº 4734.
Rama M, Macisaac D. Earnings and welfare after downsizing; Central Bank employees in
Ecuador. World Bank Economic Review 1999; 13(1); 89-116.
Rosenbaum P, Rubin D. Constructing a control group using multivariate matched sampling
methods that incorporate the propensity score. The American Statistician 1985;
39(1); 33–38.
Sianesi B. An evaluation of the Swedish system of active labour market programmes in the

32
1990s. Review of Economics and Statistics 2004; 86(1); 133–155.
Skyt-Nielsen H, Rosholm M. The Public-private sector wage gap in Zambia in the 1990s; a
quantile regression approach. Empirical Economics 2001; 26; 169-182.
Smith J, Todd P. Does matching overcome La Londe’s critique of non experimental
estimators? Journal of Econometrics 2005; 125; 305–353.
Smith S. 1976. Equal pay in the public sector; fact or fantasy? Princeton, N.J., Princeton
University Press.
Terrel K. Public-private wage differentials in Haiti; do public servants earn a rent? Journal
of Development Economics 1993; 42(2); 293-314.
Van Dooren W, Lonti Z, Sterck M, Bouckaert G. 2008. Institutional drivers of efficiency
in the public sector. Public governance committee (Background paper for OECD
government at a glance, 2009. Paris; OECD.
World Bank 2008. Public sector reform; what works and why? An IEG evaluation of
World Bank support. World Bank, Washington, D.C.

33
Table 1 Descriptive Statistics
Log hourly income from main job in each country's 2007
currency
Years of education % Public Sector Nº observations N° expanded
observations
Country Year Public Private Public Private Public Private Public Private
Argentina
1996 2.175 1.794 9.1 6.2 11.5 428 3,227 440,890 3,280,100 1999 1.443 0.966 12.5 10.0 15.7 6,522 21,318 1,241,153 6,359,114 2003 1.615 1.352 12.1 10.8 20.0 7,954 22,605 1,667,746 6,180,708 2006 1.960 1.495 13.1 10.6 16.3 10,785 35,444 1,519,549 7,402,055
Bolivia
1992 1.914 1.370 12.5 8.4 15.6 1,453 5,067 130,041 556,378 1997 2.209 1.606 13.0 7.9 11.9 998 5,589 196,814 1,268,434 1999 2.026 1.288 13.6 9.0 11.2 342 2,032 206,798 1,446,678 2003 2.343 1.454 13.1 8.4 10.6 1,422 7,936 195,484 1,618,676 2007 5.405 4.471 14.6 9.5 13.4 634 3,077 321,418 1,751,564
Brazil
1992 9.013 8.523 9.6 6.4 16.1 15,893 64,512 6,820,015 28,863,993 1996 1.693 1.273 10.0 6.9 15.3 16,328 70,167 7,036,763 31,971,958 1999 1.165 0.652 10.3 7.4 14.6 16,257 74,271 6,950,814 33,047,821 2003 1.701 1.214 10.9 8.2 13.9 19 84,837 8,154,547 39,126,709 2007 4.782 4.177 11.6 8.5 13.8 20,829 103,586 9,424,902 49,789,252
Chile
1996 7.534 7.137 13.3 10.6 10.1 3,315 26,047 405,695 3,409,805 2000 10.095 9.806 13.4 11.0 8.2 6,008 36,970 535,785 3,364,749 2003 7.439 6.946 13.7 11.1 10.6 6,053 40,481 483,859 3,602,010 2006 10.180 9.784 13.5 11.2 9.8 6,689 48,344 525,696 4,373,523
Colombia
1993 8.410 7.636 11.7 8.3 8.8 2,847 25,219 686,268 6,257,823 1996 8.497 7.762 12.0 7.9 9.9 3,995 32,594 1,098,757 8,225,670 2000 8.269 7.492 12.7 8.5 11.2 3,755 27,307 1,100,726 7,465,632 2003 8.557 7.399 14.9 8.5 7.9 10,859 124,804 845,211 7,897,149 2005 8.585 7.477 15.3 9.0 7.7 13,380 153,740 933,502 9,410,261
Costa Rica
1992 7.228 6.723 11.7 8.4 21.4 1,195 3,052 111,777 300,984 1996 7.382 6.827 12.2 8.6 18.7 1,041 3,109 105,959 342,348 1999 9.492 8.945 12.6 8.8 16.2 1,108 4,057 108,786 424,487 2003 7.456 6.904 12.8 9.1 16.3 1,337 4,914 171,981 678,577 2007 10.384 9.792 13.2 9.3 15.9 1,382 5,670 196,144 833,333
El Salvador
1991 4.900 4.204 11.0 6.4 14.6 1,036 6,080 109,333 625,270 1996 5.761 4.927 12.4 7.3 11.5 997 5,837 143,357 848,657 2000 6.033 5.117 12.7 7.7 11.9 1,951 11,411 178,665 1,041,513 2003 6.021 5.165 13.3 8.1 10.0 1,593 10,102 173,586 1,159,695 2006 2.031 1.157 13.7 8.4 9.6 1,409 9,483 173,234 1,228,102
Honduras
1992 2.536 1.885 11.0 6.6 16.5 737 3,659 106,085 500,796 1996 3.304 2.619 11.2 6.7 11.4 785 4,455 99,625 614,359 2001 3.671 2.872 11.6 6.9 10.1 1,516 9,749 112,858 726,222 2003 3.715 2.777 11.5 6.8 9.0 696 5,092 107,047 806,578 2006 3.737 2.762 12.1 7.1 9.8 2,029 15,250 132,728 994,555
Panamá
1991 1.075 0.512 12.5 10.4 27.1 1,527 2,859 105,746 211,581 1997 1.089 0.564 13.1 10.8 21.5 1,706 4,613 126,925 358,008 2001 1.127 0.554 13.2 10.5 21.5 2,448 6,840 145,793 444,047 2003 1.265 0.545 13.5 10.8 20.2 2,374 5,228 152,465 385,035 2006 1.116 0.526 13.8 10.8 17.8 2,012 7,174 149,661 571,693
Paraguay
1990 9.104 8.589 12.6 8.9 12.1 223 1,187 54,579 287,007 1995 9.436 8.820 12.0 7.9 9.6 503 2,840 109,832 649,232 1999 8.726 8.074 12.2 8.4 11.5 541 3,022 132,339 807,839 2003 9.235 8.281 13.2 8.7 12.2 1,093 5,563 153,967 846,893 2007 12.013 11.270 13.0 8.9 12.0 592 3,320 174,573 1,040,413
Uruguay
1992 4.166 3.871 10.0 8.2 19.5 2,145 8,737 201,063 814,173 1996 4.219 3.803 10.3 8.7 19.3 4,191 17,579 195,730 817,937 1999 3.609 3.150 9.6 8.4 16.8 2,712 15,542 120,611 712,182 2003 4.133 3.507 11.8 9.4 18.7 3,666 16,407 170,459 781,906 2007 7.268 6.500 11.7 9.1 16.6 8,677 45,333 201,214 1,069,202

34
Table 2 Public-Private Wage Gap. Circa 2007
Country Year Raw wage gap
Unexplained wage gap Blinder-
Oaxaca
Unexplained wage gap Kernel
matching
Standard Error t statistics
Wage gap for different percentiles of the wage distribution
p5 p10 p25 p50 p75 p90 p95 (1) (2) (3) (4) (5) (6) (7) (8) (9) (10) (11) (12)
Argentina 2006 0.47 0.26 0.23 0.02 14.53 0.41 0.38 0.33 0.23 0.10 0.02 -0.01
Bolivia 2007 0.93 0.50 0.36 0.08 4.72 0.87 0.67 0.56 0.41 0.14 -0.11 -0.25
Brazil 2007 0.61 0.24 0.18 0.02 11.88 0.53 0.22 0.21 0.19 0.11 0.06 0.05
Chile 2006 0.40 0.19 0.13 0.02 7.29 0.55 0.37 0.17 0.13 0.04 -0.06 -0.27
Colombia 2005 1.11 0.44 0.34 0.02 19.51 0.70 0.59 0.51 0.43 0.21 0.01 -0.07
Costa Rica 2007 0.59 0.25 0.13 0.04 2.86 0.52 0.37 0.21 0.12 -0.01 -0.10 -0.12
El Salvador 2006 0.87 0.45 0.26 0.04 6.74 0.52 0.50 0.48 0.31 0.18 -0.06 -0.32
Honduras 2006 0.98 0.47 0.34 0.04 9.08 0.80 0.64 0.49 0.38 0.19 0.01 -0.09
Panama 2006 0.59 0.35 0.29 0.04 7.84 0.62 0.51 0.37 0.24 0.09 0.01 -0.04
Paraguay 2007 0.74 0.34 0.07 0.06 1.03 0.78 0.60 0.30 0.11 -0.18 -0.61 -0.72
Uruguay 2007 0.77 0.44 0.42 0.02 26.98 0.97 0.84 0.66 0.43 0.19 -0.02 -0.12 Notes: (1) See number of observations in Table 1. (2) The set of control variables includes: years of schooling, interaction schooling with post-secondary education, experience, experience squared, dummy indicators for part-time workers, marital status, a set of dummies for occupations (professionals, technicians, blue-collars, etc.), and regions of the country where the workers live. (3) p5 to p95 are percentiles. The Xth percentile is the value below which X percent of the observations may be found. (4) The raw wage gap and the unexplained wage gaps are calculated using log-wages.
35
Table 3 Characteristics of Public Workers Facing a Wage Penalty. Circa 2007
years of
education age experience % women % married
Argentina Public workers with wage penalty 14.9
45.3
24.4
49.4
55.3
Private workers counterparts of penalized public workers 14.1
46.0
25.9
32.7
52.2
Bolivia Public workers with wage penalty 16.2
43.7
21.5
38.1
66.3
Private workers counterparts of penalized public workers 16.3
42.1
19.8
32.6
69.8
Brazil
Public workers with wage penalty 14.4
43.9
23.5
35.2
0.0 Private workers counterparts of penalized public workers 10.6
56.7
40.1
72.4
0.0
Chile
Public workers with wage penalty 15.9
46.6
24.7
47.4
66.1 Private workers counterparts of penalized public workers 16.1
44.7
22.6
45.7
75.6
Colombia
Public workers with wage penalty 19.1
46.3
21.2
45.9
61.9
Private workers counterparts of penalized public workers 18.9
46.7
21.7
33.9
39.8
Costa Rica
Public workers with wage penalty 15.5
41.5
20.0
50.8
64.1
Private workers counterparts of penalized public workers 15.1
40.7
19.6
39.0
54.5
El Salvador
Public workers with wage penalty 16.1
41.9
19.8
57.3
55.0
Private workers counterparts of penalized public workers 16.0
46.2
24.2
52.0
72.8
Honduras
Public workers with wage penalty 16.4
44.7
22.3
45.2
60.1
Private workers counterparts of penalized public workers 16.4
43.1
20.7
34.3
60.9
Panama
Public workers with wage penalty 17.1
46.7
23.6
41.9
53.0
Private workers counterparts of penalized public workers 17.2
45.1
21.9
33.7
74.5
Paraguay
Public workers with wage penalty 14.2
39.4
19.1
52.1
58.0
Private workers counterparts of penalized public workers 14.8
42.4
21.7
41.4
71.4
Uruguay
Public workers with wage penalty 14.1
47.6
27.5
46.8
61.5
Private workers counterparts of penalized public workers 14.7 47.8 27.1 39.9 68.4

36
Table 4 Public-Private Wage Gap by Country and Year
Country Year Raw wage gap
Unexplained wage gap
Kernel matching
Wage gap for different percentiles of the wage distribution
p5 p10 p25 p50 p75 p90 p95
Argentina
1996 0.38 0.01 0.30 0.21 0.15 0.02 -0.07 -0.28 -0.30 1999 0.48 0.17 0.55 0.42 0.28 0.16 -0.02 -0.13 -0.16 2003 0.26 0.12 0.87 0.17 0.11 0.06 -0.03 -0.18 -0.25 2006 0.47 0.23 0.41 0.38 0.33 0.23 0.10 0.02 -0.01
Bolivia
1992 0.54 -0.04 0.24 0.19 0.12 -0.03 -0.15 -0.31 -0.43 1997 0.60 0.16 0.43 0.42 0.31 0.22 0.03 -0.15 -0.42 1999 0.74 0.25 0.89 0.76 0.52 0.32 -0.07 -0.38 -0.41 2003 0.89 0.19 0.45 0.40 0.34 0.23 0.03 -0.09 -0.22 2007 0.93 0.36 0.87 0.67 0.56 0.41 0.14 -0.11 -0.25
Brazil
1992 0.49 0.06 0.16 0.15 0.13 0.09 0.01 -0.07 -0.10 1996 0.42 0.02 0.11 0.11 0.09 0.04 -0.03 -0.09 -0.16 1999 0.51 0.14 0.26 0.22 0.20 0.16 0.08 -0.03 -0.05 2003 0.49 0.13 0.22 0.21 0.20 0.17 0.04 -0.01 -0.03 2007 0.61 0.18 0.53 0.22 0.21 0.19 0.11 0.06 0.05
Chile
1996 0.40 0.03 0.34 0.27 0.23 0.04 -0.12 -0.40 -0.61 2000 0.29 -0.03 0.19 0.10 0.04 -0.04 -0.11 -0.22 -0.37 2003 0.49 0.15 0.57 0.39 0.23 0.19 0.02 -0.20 -0.31 2006 0.40 0.13 0.55 0.37 0.17 0.13 0.04 -0.06 -0.27
Colombia
1993 0.77 0.27 0.54 0.47 0.37 0.31 0.15 0.05 -0.06 1996 0.73 0.23 0.44 0.39 0.34 0.25 0.09 -0.03 -0.10 2000 0.78 0.32 0.44 0.43 0.39 0.30 0.25 0.19 0.08 2003 1.16 0.38 0.71 0.60 0.55 0.49 0.27 -0.01 -0.19 2005 1.11 0.34 0.70 0.59 0.51 0.43 0.21 0.01 -0.07
Costa Rica
1992 0.55 0.19 0.31 0.28 0.24 0.21 0.14 0.07 0.00 1996 0.56 0.29 0.40 0.38 0.34 0.31 0.27 0.13 0.11 1999 0.55 0.24 0.38 0.34 0.28 0.24 0.19 0.15 0.09 2003 0.55 0.20 0.39 0.35 0.33 0.27 0.11 -0.06 -0.12 2007 0.59 0.13 0.52 0.37 0.21 0.12 -0.01 -0.10 -0.12
El Salvador
1991 0.70 0.25 0.69 0.63 0.44 0.28 -0.03 -0.15 -0.37 1996 0.83 0.29 0.93 0.65 0.50 0.39 0.02 -0.27 -0.38 2000 0.92 0.35 0.62 0.59 0.56 0.43 0.18 -0.06 -0.17 2003 0.86 0.38 0.65 0.63 0.61 0.38 0.23 0.06 0.01 2006 0.87 0.26 0.52 0.50 0.48 0.31 0.18 -0.06 -0.32
Honduras
1992 0.65 0.10 0.21 0.20 0.18 0.13 0.01 -0.08 -0.26 1996 0.68 0.20 0.56 0.47 0.34 0.21 0.04 -0.05 -0.08 2001 0.80 0.12 0.53 0.36 0.29 0.15 -0.05 -0.09 -0.10 2003 0.94 0.21 0.79 0.56 0.34 0.16 0.07 -0.05 -0.14 2006 0.98 0.34 0.80 0.64 0.49 0.38 0.19 0.01 -0.09
Panama
1991 0.56 0.18 0.55 0.48 0.35 0.13 -0.02 -0.13 -0.18 1997 0.52 0.18 0.64 0.43 0.40 0.12 -0.04 -0.21 -0.32 2001 0.57 0.26 0.73 0.44 0.34 0.20 0.12 0.00 -0.04 2003 0.72 0.24 0.87 0.60 0.38 0.17 0.02 -0.09 -0.17 2006 0.59 0.29 0.62 0.51 0.37 0.24 0.09 0.01 -0.04
Paraguay
1990 0.51 -0.03 0.17 0.14 0.11 0.06 -0.22 -0.38 -0.44 1995 0.62 0.01 0.49 0.28 0.22 0.14 -0.29 -0.40 -0.43 1999 0.65 0.05 0.41 0.32 0.26 0.18 -0.14 -0.33 -0.35 2003 0.95 0.14 0.96 0.76 0.41 0.05 -0.19 -0.29 -0.41 2007 0.74 0.07 0.78 0.60 0.30 0.11 -0.18 -0.61 -0.72
Uruguay
1992 0.29 -0.09 0.32 0.24 0.05 -0.12 -0.26 -0.37 -0.49 1996 0.42 0.01 0.49 0.29 0.13 -0.01 -0.17 -0.29 -0.35 1999 0.46 0.18 0.50 0.42 0.26 0.18 0.05 -0.04 -0.10 2003 0.63 0.29 0.92 0.70 0.49 0.30 0.01 -0.11 -0.25 2007 0.77 0.42 0.97 0.84 0.66 0.43 0.19 -0.02 -0.12
Notes: (1) See number of observations in Table 1. (2) The set of control variables includes: years of schooling, interaction schooling with post-secondary education, experience, experience squared,
dummy indicators for part-time workers, marital status, a set of dummies for occupations (professionals, technicians, blue-collars, etc.), and regions of the country where the workers live.
(3) p5 to p95 are percentiles. The Xth percentile is the value below which X percent of the observations may be found. (4) The raw wage gap and the unexplained wage gaps are calculated using log-wages.
37
Table 5 Public-Private Wage Gap, Governance Indicators, and Labor Market and Macroeconomic Characteristics
(dependent variable public-private wage gap)
Variables
Unexplained average wage gap Kernel matching
Wage gap for different percentiles of the wage distribution
awg awg awg
p10 p10 p10 p25 p25 p25 p75 p75 p75 p90 p90 p90 (1) (2) (3) (4) (5) (6) (7) (8) (9) (10) (11) (12) (13) (14) (15)
Unionization Index -0.908* -0.911* -1.191**
-1.152 -1.116 -1.339 -0.823 -0.872 -1.055 -1.085** -1.107** -1.406** -1.783*** -1.833*** -1.926*** (0.503) (0.465) (0.574)
(0.885) (1.246) (0.991) (0.758) (1.024) (0.747) (0.547) (0.474) (0.595) (0.577) (0.673) (0.581)
% Public employment 0,001 0.010 0.013
-0.005 -0.003 0.008 -0.003 -0.005 0.008 -0.002 -0.003 0.0116 0.0004 -0.002 0.011 (-0.009) (0.010) (0.010)
(0.021) (0.024) (0.020) (0.016) (0.019) (0.014) (0.010) (0.009) (0.011) (0.013) (0.014) (0.015)
GDP per capita -0,022 -0.022 -0.063
-0.112 -0.119 -0.155 -0.059 -0.0501 -0.087 0.0367 0.041 -0.007 0.029 0.038 0.006 (0.049) (0.045) (0.041)
(0.108) (0.120) (0.096) (0.061) (0.075) (0.069) (0.053) (0.055) (0.051) (0.068) (0.077) (0.082)
Inflation -0.008** -0.008* -0.010***
-0.007 -0.006 -0.008 -0.008* -0.009* -0.010 -0.008* -0.008* -0.010** -0.006 -0.007 -0.007 (0.004) (0.004) (0.003)
(0.008) (0.008) (0.007) (0.005) (0.005) (0.006) (0.004) (0.004) (0.005) (0.005) (0.006) (0.006) Female labor force participation
-0,002 -0.002 0.003
0.005 0.005 0.009 -0.0004 9.99e-05 0.004 -0.005 -0.005 0.0004 0.002 0.002 0.005 (0.005) (0.005) (0.005)
(0.011) (0.013) (0.008) (0.008) (0.011) (0.006) (0.006) (0.006) (0.006) (0.008) (0.009) (0.008)
Voice and accountability
0.236*** 0.238**
0.234 0.218
0.218* 0.239
0.278** 0.287**
0.214 0.235 (0.076) (0.095)
(0.203) (0.207)
(0.119) (0.190)
(0.117) (0.123)
(0.164) (0.203)
Rule of law -0.184** -0.181*
-0.115 -0.150
-0.180 -0.133
-0.220** -0.199*
-0.135 -0.088 (0.075) (0.102)
(0.173) (0.207)
(0.113) (0.173)
(0.086) (0.103)
(0.115) (0.169)
Government efficiency -0.005 2.53e-05
0.056 0.075
-0.076 -0.028
-0.034 -0.011
-0.078 0.008
(0.109) (0.048)
(0.212) (0.087)
(0.200) (0.059)
(0.119) (0.049)
(0.207) (0.082)
Constant 0.355 0.351 0.404
1.053 1.101 1.155 0.788 0.724 0.792 -0.096 -0.125 -0.055 -0.559 -0.625 -0.545 (0.306) (0.305) (0.348)
(0.712) (0.823) (0.709) (0.509) (0.631) (0.531) (0.363) (0.353) (0.405) (0.474) (0.562) (0.637)
Nº observations 32 32 32
32 32 32 32 32 32 32 32 32 32 32 32
Adjusted R-squared 0.415 0.390 0.279
0.077 0.040 0.068 0.190 0.165 0.145 0.445 0.424 0.304 0.300 0.278 0.265 Notes: (1) Bootstrapped standard errors in parentheses. *** p<0.01, ** p<0.05, * p<0.1. (2) p10 to p90 are percentiles. The Xth percentile is the value below which X percent of the observations may be found. (3) GDP per capita is taken as log.
38
Table 6 Public-Private Wage Gap, Governance Indicators, and Labor Market and Macroeconomic Characteristics. Random-effects Analysis
(dependent variable public-private wage gap)
Variables
Unexplained average wage gap Kernel matching
Wage gap for different percentiles of the wage distribution
awg aw g awg
p10 p10 p10 p25 p25 p25 p75 p75 p75 p90 p90 p90 (1) (2) (3)
(4) (5) (6) (7) (8) (9) (10) (11) (12) (13) (14) (15)
Unionization Index -0.802 -0.784 -1.018
-0.624 -0.428 -0.785 -0.370 -0.396 -0.629 -1.237** -1.290*** -1.414** -2.136*** -2.287*** -2.113*** (0.565) (0.567) (0.663)
(1.062) (1.302) (1.012) (0.712) (0.929) (0.800) (0.508) (0.485) (0.651) (0.690) (0.757) (0.554)
% Public employment -0,003 -0.002 0.014
-0.010 -0.004 0.003 -0.009 -0.009 0.006 -0.004 -0.005 0.0177 0.001 -0.004 0.021* (0.008) (0.010) (0.009)
(0.018) (0.021) (0.0120) (0.011) (0.017) (0.012) (0.012) (0.012) (0.013) (0.017) (0.015) (0.012)
GDP -0.141 -0.142 -0.091
-0.150 -0.166 -0.120 -0.205 -0.203 -0.155 -0.142 -0.138 -0.085 -0.107 -0.095 -0.068 (0.104) (0.113) (0.115)
(0.171) (0.153) (0.120) (0.126) (0.144) (0.140) (0.087) (0.085) (0.108) (0.096) (0.109) (0.117)
Population 0,002 0.002 0.001
-0.0004 -0.0003 -0.001 0.001 0.001 0.0005 0.003*** 0.003** 0.002 0.003 0.003* 0.003 (0.002) (0.002) (0.001)
(0.003) (0.002) (0.002) (0.002) (0.002) (0.002) (0.001) (0.001) (0.003) (0.002) (0.002) (0.002)
Inflation -0.011** -0.011*** -0.012***
-0.009 -0.008 -0.009 -0.012** -0.012** -0.013** -0.013*** -0.013*** -0.014*** -0.011** -0.012** -0.011** (0.004) (0.004) (0.004)
(0.006) (0.006) (0.006) (0.006) (0.006) (0.006) (0.005) (0.005) (0.005) (0.005) (0.005) (0.005)
Female labor force participation
-0.008 -0.008 0.0004
0.008 0.007 0.014 -0.004 -0.004 0.004 -0.015*** -0.015** -0.007 -0.011 -0.010 -0.006 (0.007) (0.007) (0.006)
(0.011) (0.012) (0.009) (0.009) (0.010) (0.007) (0.005) (0.007) (0.007) (0.009) (0.009) (0.009)
Time to elections -0.035 -0.035* -0.013
-0.019 -0.012 -0.003 -0.022 -0.023 -0.004 -0.046** -0.048** -0.018 -0.061** -0.066** -0.033 (0.028) (0.020) (0.027)
(0.040) (0.047) (0.041) (0.031) (0.033) (0.035) (0.021) (0.024) (0.028) (0.030) (0.030) (0.033)
% Manufacturing industry employment
0.005 0.005 -0.006
0.0002 -0.002 -0.009 0.009 0.009 -0.001 0.007 0.008 -0.006 -0.001 0.001 -0.011 (0.010) (0.010) (0.013)
(0.017) (0.015) (0.013) (0.014) (0.016) (0.014) (0.008) (0.008) (0.009) (0.010) (0.011) (0.014)
Voice and accountability 0.312*** 0.306**
0.235 0.167
0.268* 0.278
0.384*** 0.402***
0.325 0.377** (0.114) (0.131)
(0.184) (0.251)
(0.157) (0.173)
(0.131) (0.141)
(0.200) (0.163)
Rule of law -0.228** -0.235**
-0.142 -0.223
-0.233* -0.222
-0.255*** -0.233**
-0.160 -0.098 (0.089) (0.115)
(0.168) (0.215)
(0.137) (0.183)
(0.091) (0.109)
(0.128) (0.136)
Government efficiency
0.014 0.002
0.148 0.052
-0.020 -0.039
-0.041 0.016
-0.114 0.053
(0.130) (0.068)
(0.263) (0.110)
(0.184) (0.078)
(0.120) (0.054)
(0.136) (0.078)
Constant 1.843* 1.863 1.151
1.722 1.941 1.295 2.497** 2.467* 1.798 1.984** 1.924** 1.194 1.385 1.217 0.858 (1.076) (1.138) (1.143)
(1.738) (1.629) (1.268) (1.255) (1.379) (1.430) (0.906) (0.953) (1.192) (1.147) (1.254) (1.343)
Nº Observations 32 32 32 32 32 32 32 32 32 32 32 32 32 32 32 Notes: (1) Bootstrapped standard errors in parentheses. *** p<0.01, ** p<0.05, * p<0.1. (2) p10 to p90 are percentiles. The Xth percentile is the value below which X percent of the observations may be found. (3) GDP is taken as log.
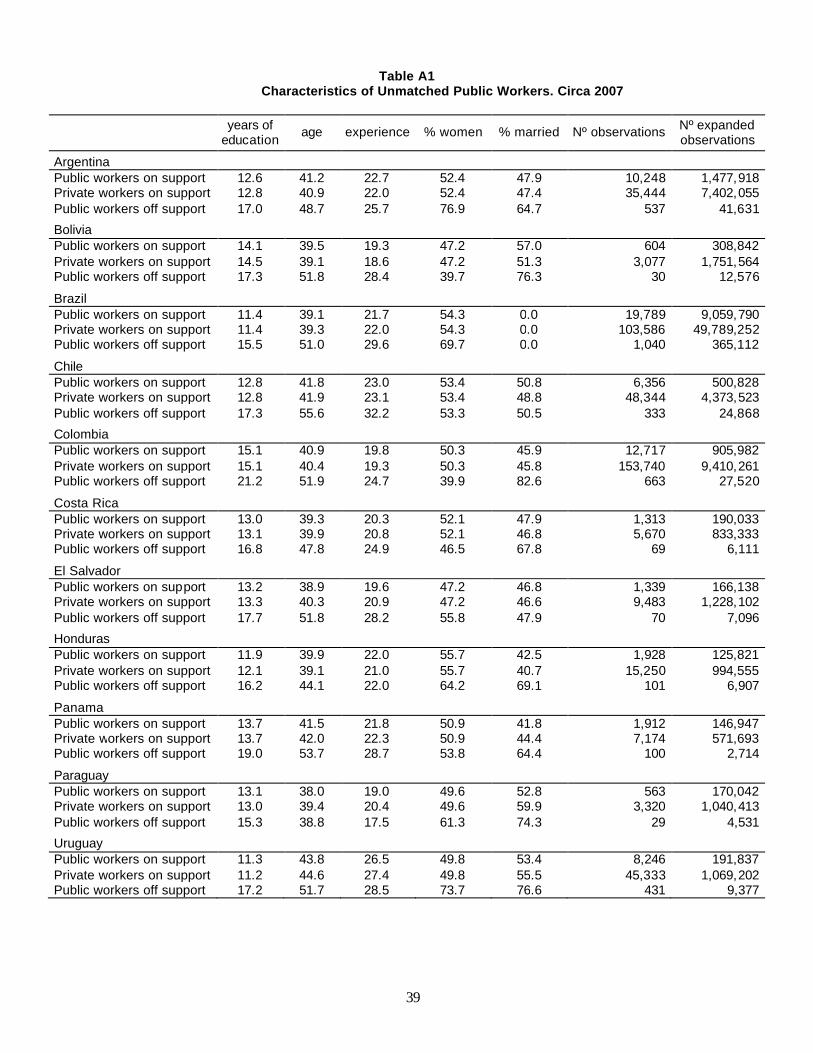
39
Table A1
Characteristics of Unmatched Public Workers. Circa 2007
years of
education age experience % women % married Nº observations Nº expanded
observations
Argentina Public workers on support 12.6 41.2 22.7 52.4 47.9 10,248 1,477,918 Private workers on support 12.8 40.9 22.0 52.4 47.4 35,444 7,402,055 Public workers off support 17.0 48.7 25.7 76.9 64.7 537 41,631
Bolivia Public workers on support 14.1 39.5 19.3 47.2 57.0 604 308,842 Private workers on support 14.5 39.1 18.6 47.2 51.3 3,077 1,751,564 Public workers off support 17.3 51.8 28.4 39.7 76.3 30 12,576
Brazil Public workers on support 11.4 39.1 21.7 54.3 0.0 19,789 9,059,790 Private workers on support 11.4 39.3 22.0 54.3 0.0 103,586 49,789,252 Public workers off support 15.5 51.0 29.6 69.7 0.0 1,040 365,112
Chile Public workers on support 12.8 41.8 23.0 53.4 50.8 6,356 500,828 Private workers on support 12.8 41.9 23.1 53.4 48.8 48,344 4,373,523 Public workers off support 17.3 55.6 32.2 53.3 50.5 333 24,868
Colombia Public workers on support 15.1 40.9 19.8 50.3 45.9 12,717 905,982 Private workers on support 15.1 40.4 19.3 50.3 45.8 153,740 9,410,261 Public workers off support 21.2 51.9 24.7 39.9 82.6 663 27,520
Costa Rica Public workers on support 13.0 39.3 20.3 52.1 47.9 1,313 190,033 Private workers on support 13.1 39.9 20.8 52.1 46.8 5,670 833,333 Public workers off support 16.8 47.8 24.9 46.5 67.8 69 6,111
El Salvador Public workers on support 13.2 38.9 19.6 47.2 46.8 1,339 166,138 Private workers on support 13.3 40.3 20.9 47.2 46.6 9,483 1,228,102 Public workers off support 17.7 51.8 28.2 55.8 47.9 70 7,096
Honduras Public workers on support 11.9 39.9 22.0 55.7 42.5 1,928 125,821 Private workers on support 12.1 39.1 21.0 55.7 40.7 15,250 994,555 Public workers off support 16.2 44.1 22.0 64.2 69.1 101 6,907
Panama Public workers on support 13.7 41.5 21.8 50.9 41.8 1,912 146,947 Private workers on support 13.7 42.0 22.3 50.9 44.4 7,174 571,693 Public workers off support 19.0 53.7 28.7 53.8 64.4 100 2,714
Paraguay Public workers on support 13.1 38.0 19.0 49.6 52.8 563 170,042 Private workers on support 13.0 39.4 20.4 49.6 59.9 3,320 1,040,413 Public workers off support 15.3 38.8 17.5 61.3 74.3 29 4,531
Uruguay Public workers on support 11.3 43.8 26.5 49.8 53.4 8,246 191,837 Private workers on support 11.2 44.6 27.4 49.8 55.5 45,333 1,069,202 Public workers off support 17.2 51.7 28.5 73.7 76.6 431 9,377
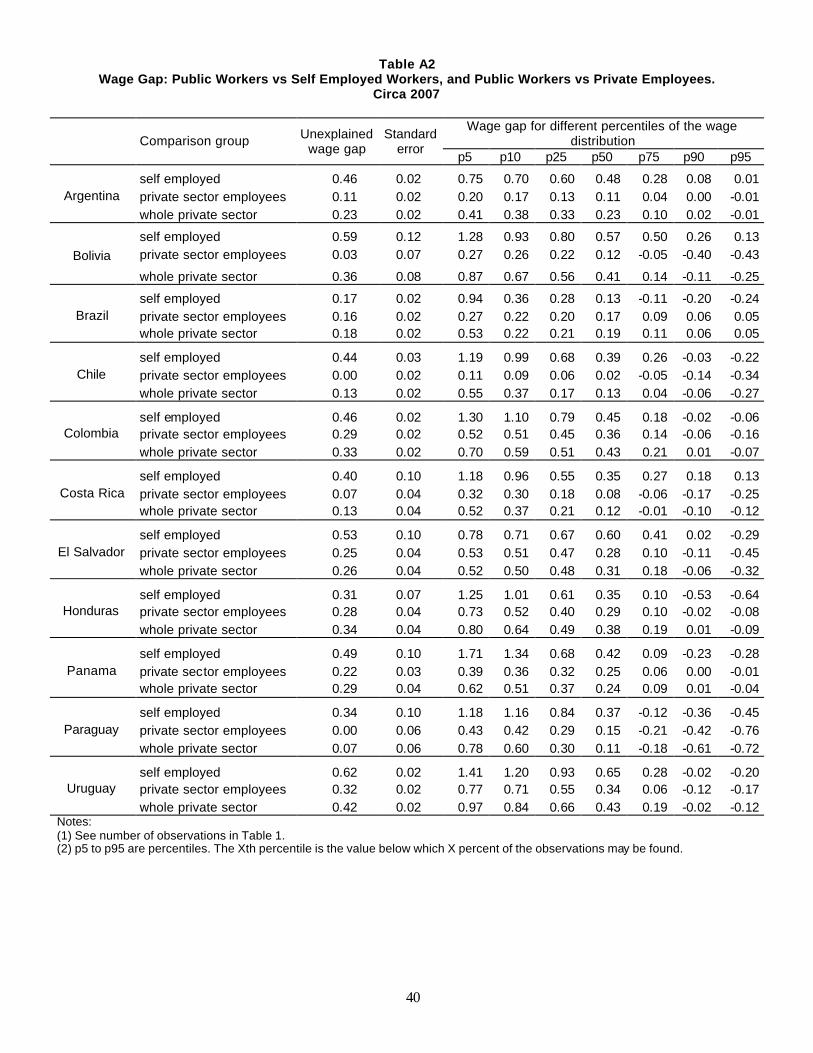
40
Table A2 Wage Gap: Public Workers vs Self Employed Workers, and Public Workers vs Private Employees.
Circa 2007
Comparison group Unexplained wage gap
Standard error
Wage gap for different percentiles of the wage distribution
p5 p10 p25 p50 p75 p90 p95
Argentina self employed 0.46 0.02 0.75 0.70 0.60 0.48 0.28 0.08 0.01 private sector employees 0.11 0.02 0.20 0.17 0.13 0.11 0.04 0.00 -0.01 whole private sector 0.23 0.02 0.41 0.38 0.33 0.23 0.10 0.02 -0.01
Bolivia self employed 0.59 0.12 1.28 0.93 0.80 0.57 0.50 0.26 0.13 private sector employees 0.03 0.07 0.27 0.26 0.22 0.12 -0.05 -0.40 -0.43
whole private sector 0.36 0.08 0.87 0.67 0.56 0.41 0.14 -0.11 -0.25
Brazil self employed 0.17 0.02 0.94 0.36 0.28 0.13 -0.11 -0.20 -0.24 private sector employees 0.16 0.02 0.27 0.22 0.20 0.17 0.09 0.06 0.05 whole private sector 0.18 0.02 0.53 0.22 0.21 0.19 0.11 0.06 0.05
Chile self employed 0.44 0.03 1.19 0.99 0.68 0.39 0.26 -0.03 -0.22 private sector employees 0.00 0.02 0.11 0.09 0.06 0.02 -0.05 -0.14 -0.34 whole private sector 0.13 0.02 0.55 0.37 0.17 0.13 0.04 -0.06 -0.27
Colombia self employed 0.46 0.02 1.30 1.10 0.79 0.45 0.18 -0.02 -0.06 private sector employees 0.29 0.02 0.52 0.51 0.45 0.36 0.14 -0.06 -0.16 whole private sector 0.33 0.02 0.70 0.59 0.51 0.43 0.21 0.01 -0.07
Costa Rica self employed 0.40 0.10 1.18 0.96 0.55 0.35 0.27 0.18 0.13 private sector employees 0.07 0.04 0.32 0.30 0.18 0.08 -0.06 -0.17 -0.25 whole private sector 0.13 0.04 0.52 0.37 0.21 0.12 -0.01 -0.10 -0.12
El Salvador self employed 0.53 0.10 0.78 0.71 0.67 0.60 0.41 0.02 -0.29 private sector employees 0.25 0.04 0.53 0.51 0.47 0.28 0.10 -0.11 -0.45 whole private sector 0.26 0.04 0.52 0.50 0.48 0.31 0.18 -0.06 -0.32
Honduras self employed 0.31 0.07 1.25 1.01 0.61 0.35 0.10 -0.53 -0.64 private sector employees 0.28 0.04 0.73 0.52 0.40 0.29 0.10 -0.02 -0.08 whole private sector 0.34 0.04 0.80 0.64 0.49 0.38 0.19 0.01 -0.09
Panama self employed 0.49 0.10 1.71 1.34 0.68 0.42 0.09 -0.23 -0.28 private sector employees 0.22 0.03 0.39 0.36 0.32 0.25 0.06 0.00 -0.01 whole private sector 0.29 0.04 0.62 0.51 0.37 0.24 0.09 0.01 -0.04
Paraguay self employed 0.34 0.10 1.18 1.16 0.84 0.37 -0.12 -0.36 -0.45 private sector employees 0.00 0.06 0.43 0.42 0.29 0.15 -0.21 -0.42 -0.76 whole private sector 0.07 0.06 0.78 0.60 0.30 0.11 -0.18 -0.61 -0.72
Uruguay self employed 0.62 0.02 1.41 1.20 0.93 0.65 0.28 -0.02 -0.20 private sector employees 0.32 0.02 0.77 0.71 0.55 0.34 0.06 -0.12 -0.17 whole private sector 0.42 0.02 0.97 0.84 0.66 0.43 0.19 -0.02 -0.12
Notes: (1) See number of observations in Table 1. (2) p5 to p95 are percentiles. The Xth percentile is the value below which X percent of the observations may be found.
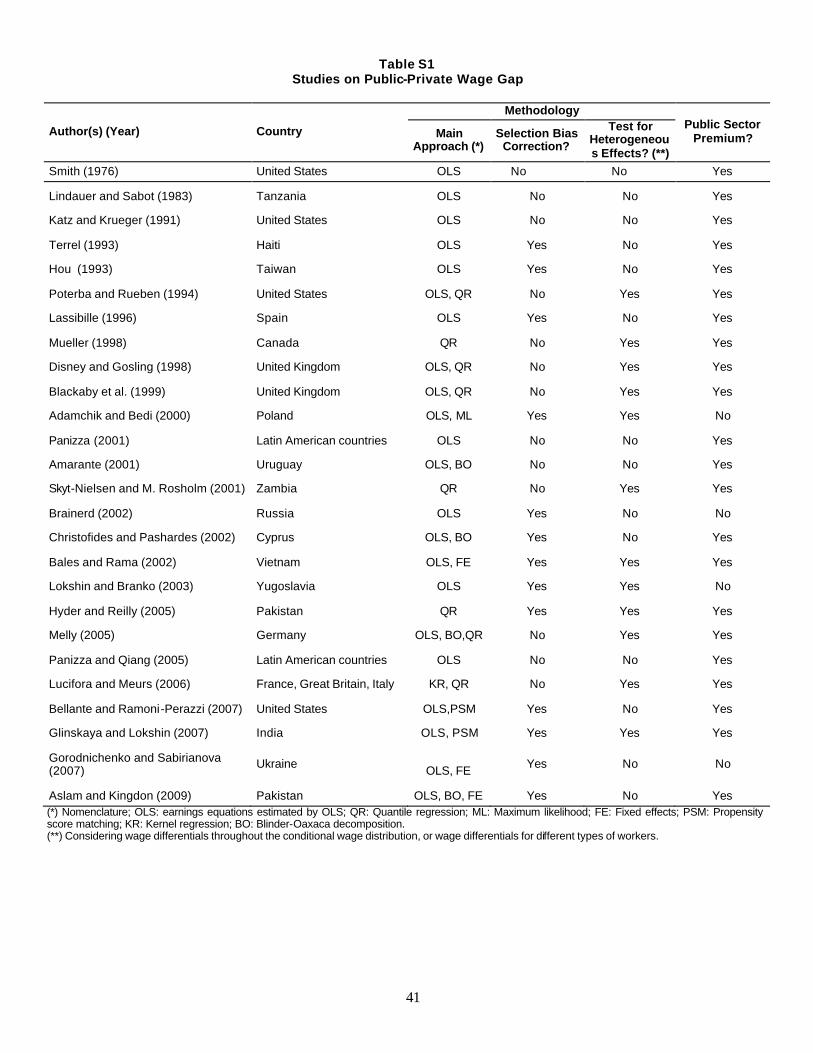
41
Table S1 Studies on Public-Private Wage Gap
Author(s) (Year) Country
Methodology Public Sector
Premium? Main Approach (*)
Selection Bias Correction?
Test for Heterogeneous Effects? (**)
Smith (1976) United States OLS No No Yes
Lindauer and Sabot (1983) Tanzania OLS No No Yes
Katz and Krueger (1991) United States OLS No No Yes
Terrel (1993) Haiti OLS Yes No Yes
Hou (1993) Taiwan OLS Yes No Yes
Poterba and Rueben (1994) United States OLS, QR No Yes Yes
Lassibille (1996) Spain OLS Yes No Yes
Mueller (1998) Canada QR No Yes Yes
Disney and Gosling (1998) United Kingdom OLS, QR No Yes Yes
Blackaby et al. (1999) United Kingdom OLS, QR No Yes Yes
Adamchik and Bedi (2000) Poland OLS, ML Yes Yes No
Panizza (2001) Latin American countries OLS No No Yes
Amarante (2001) Uruguay OLS, BO No No Yes
Skyt-Nielsen and M. Rosholm (2001) Zambia QR No Yes Yes
Brainerd (2002) Russia OLS Yes No No
Christofides and Pashardes (2002) Cyprus OLS, BO Yes No Yes
Bales and Rama (2002) Vietnam OLS, FE Yes Yes Yes
Lokshin and Branko (2003) Yugoslavia OLS Yes Yes No
Hyder and Reilly (2005) Pakistan QR Yes Yes Yes
Melly (2005) Germany OLS, BO,QR No Yes Yes
Panizza and Qiang (2005) Latin American countries OLS No No Yes
Lucifora and Meurs (2006) France, Great Britain, Italy KR, QR No Yes Yes
Bellante and Ramoni-Perazzi (2007) United States OLS,PSM Yes No Yes
Glinskaya and Lokshin (2007) India OLS, PSM Yes Yes Yes
Gorodnichenko and Sabirianova (2007) Ukraine OLS, FE Yes No No
Aslam and Kingdon (2009) Pakistan OLS, BO, FE Yes No Yes (*) Nomenclature; OLS: earnings equations estimated by OLS; QR: Quantile regression; ML: Maximum likelihood; FE: Fixed effects; PSM: Propensity score matching; KR: Kernel regression; BO: Blinder-Oaxaca decomposition. (**) Considering wage differentials throughout the conditional wage distribution, or wage differentials for different types of workers.

42
Table S2 Descriptive Statistics
Sector % Women % Married Potential
experience Professional Technician Blue collar Other
(2) (3) (4) (5) (6) (7) (8)
Argentina
1996 Public 54.0
51.6
23.9
22.0
35.0
33.3
9.7 Private 36.1
49.5
25.5
6.6
11.4
49.9
32.2
1999 Public 51.7
57.3
22.1
17.3
35.2
36.4
11.1
Private 38.2
45.9
21.7
6.3
12.8
47.3
33.7
2003 Public 55.5
48.1
22.5
13.1
26.1
39.7
21.1
Private 38.7
43.4
22.3
6.5
12.3
51.8
29.4
2006 Public 55.2
48.0
22.8
15.2
30.4
41.2
13.1
Private 39.5
38.1
22.2
5.8
10.8
56.1
27.4
Bolivia
1992 Public 62.7
72.9
18.9
17.0
37.8
38.8
6.3
Private 60.8
67.1
20.5
2.7
6.9
76.4
14.0
1997 Public 46.2
73.3
20.0
6.5
10.2
78.0
5.3
Private 39.8
66.7
23.2
2.3
1.7
85.4
10.6
1999 Public 43.6
66.9
19.5
7.5
33.2
55.0
4.3
Private 41.1
54.0
21.8
2.7
5.3
81.0
11.0
2003 Public 48.6
59.3
19.2
38.9
21.3
30.3
9.5
Private 41.1
44.6
21.9
4.3
5.9
74.4
15.4
2007 Public 47.6
57.8
19.9
50.4
17.6
25.4
6.6
Private 38.4
44.6
22.0
7.5
8.2
72.0
12.3
technician clerical other
Brazil
1992 Public 49.9
na
21.2
31.0
23.8
45.2
Private 31.2
na
20.9
7.0
13.2
79.8
1996 Public 52.4
na
21.3
33.8
22.8
43.5
Private 32.3
na
21.1
7.5
12.5
80.1
1999 Public 53.6
0.0
21.7
36.1
22.2
41.7
Private 33.3
0.0
21.5
8.3
12.3
79.4
2003 Public 55.0
na
22.1
27.3
21.3
51.3
0.2
Private 34.0
na
21.1
9.8
8.6
81.5
0.0
2007 Public 56.2
0.0
22.3
30.7
21.3
48.0
0.1
Private 35.9
0.0
21.2
9.7
8.6
81.7
0.1
Chile
1996 Public 49.5
66.5
21.4
37.2
16.4
38.9
7.5
Private 30.5
55.4
20.4
11.4
8.1
63.2
17.2
2000 Public 48.8
59.3
21.7
52.3
14.8
10.1
22.8
Private 32.8
54.2
21.3
22.1
10.8
31.2
36.0
2003 Public 54.1
56.1
22.6
37.7
16.9
35.9
9.5
Private 32.5
49.8
21.3
13.1
9.0
62.8
15.1
2006 Public 51.6
50.1
23.1
32.2
15.8
39.8
12.2
Private 34.5
45.5
22.2
11.1
8.4
62.5
18.0
professional and
technician clerical other
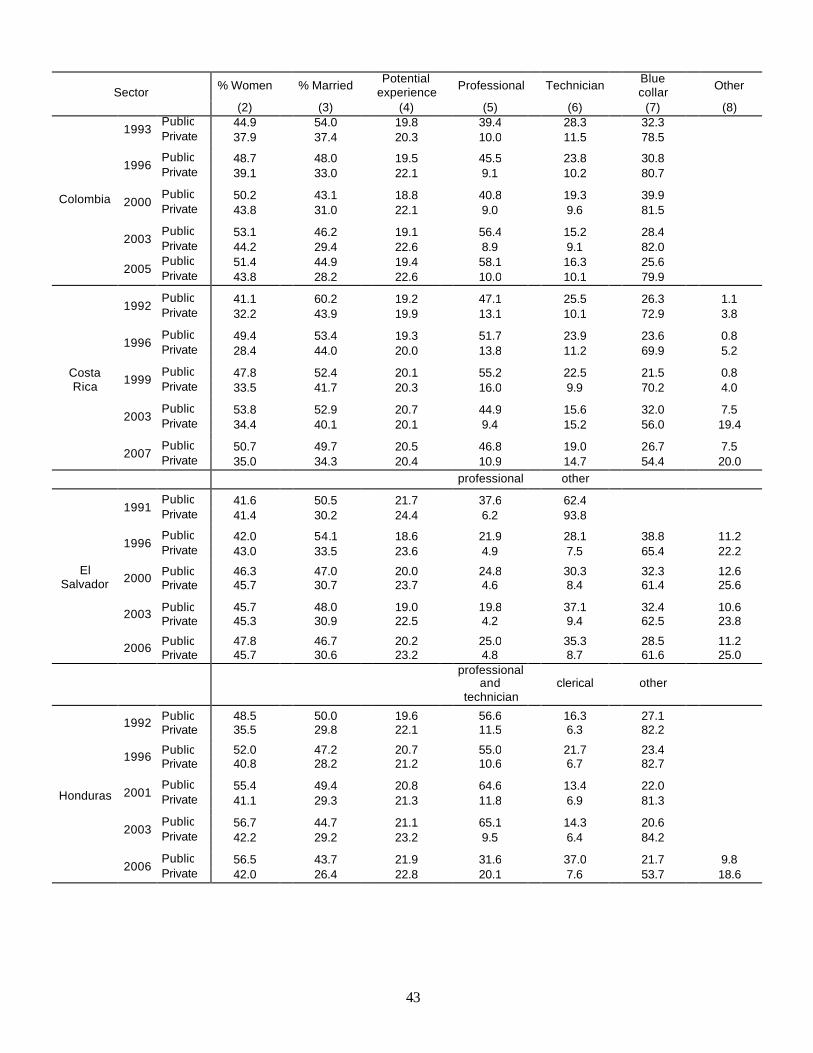
43
Sector % Women % Married Potential experience Professional Technician Blue
collar Other
(2) (3) (4) (5) (6) (7) (8)
Colombia
1993 Public 44.9
54.0
19.8
39.4
28.3
32.3
Private 37.9
37.4
20.3
10.0
11.5
78.5
1996 Public 48.7
48.0
19.5
45.5
23.8
30.8
Private 39.1
33.0
22.1
9.1
10.2
80.7
2000 Public 50.2
43.1
18.8
40.8
19.3
39.9
Private 43.8
31.0
22.1
9.0
9.6
81.5
2003 Public 53.1
46.2
19.1
56.4
15.2
28.4
Private 44.2
29.4
22.6
8.9
9.1
82.0
2005 Public 51.4
44.9
19.4
58.1
16.3
25.6
Private 43.8
28.2
22.6
10.0
10.1
79.9
Costa Rica
1992 Public 41.1
60.2
19.2
47.1
25.5
26.3
1.1
Private 32.2
43.9
19.9
13.1
10.1
72.9
3.8
1996 Public 49.4
53.4
19.3
51.7
23.9
23.6
0.8
Private 28.4
44.0
20.0
13.8
11.2
69.9
5.2
1999 Public 47.8
52.4
20.1
55.2
22.5
21.5
0.8
Private 33.5
41.7
20.3
16.0
9.9
70.2
4.0
2003 Public 53.8
52.9
20.7
44.9
15.6
32.0
7.5
Private 34.4
40.1
20.1
9.4
15.2
56.0
19.4
2007 Public 50.7
49.7
20.5
46.8
19.0
26.7
7.5
Private 35.0
34.3
20.4
10.9
14.7
54.4
20.0
professional other
El Salvador
1991 Public 41.6
50.5
21.7
37.6
62.4
Private 41.4
30.2
24.4
6.2
93.8
1996 Public 42.0
54.1
18.6
21.9
28.1
38.8
11.2
Private 43.0
33.5
23.6
4.9
7.5
65.4
22.2
2000 Public 46.3
47.0
20.0
24.8
30.3
32.3
12.6 Private 45.7
30.7
23.7
4.6
8.4
61.4
25.6
2003 Public 45.7
48.0
19.0
19.8
37.1
32.4
10.6 Private 45.3
30.9
22.5
4.2
9.4
62.5
23.8
2006 Public 47.8
46.7
20.2
25.0
35.3
28.5
11.2 Private 45.7
30.6
23.2
4.8
8.7
61.6
25.0
professional and
technician
clerical other
Honduras
1992 Public 48.5
50.0
19.6
56.6
16.3
27.1 Private 35.5
29.8
22.1
11.5
6.3
82.2
1996 Public 52.0
47.2
20.7
55.0
21.7
23.4 Private 40.8
28.2
21.2
10.6
6.7
82.7
2001 Public 55.4
49.4
20.8
64.6
13.4
22.0
Private 41.1
29.3
21.3
11.8
6.9
81.3
2003 Public 56.7
44.7
21.1
65.1
14.3
20.6
Private 42.2
29.2
23.2
9.5
6.4
84.2
2006 Public 56.5
43.7
21.9
31.6
37.0
21.7
9.8
Private 42.0
26.4
22.8
20.1
7.6
53.7
18.6
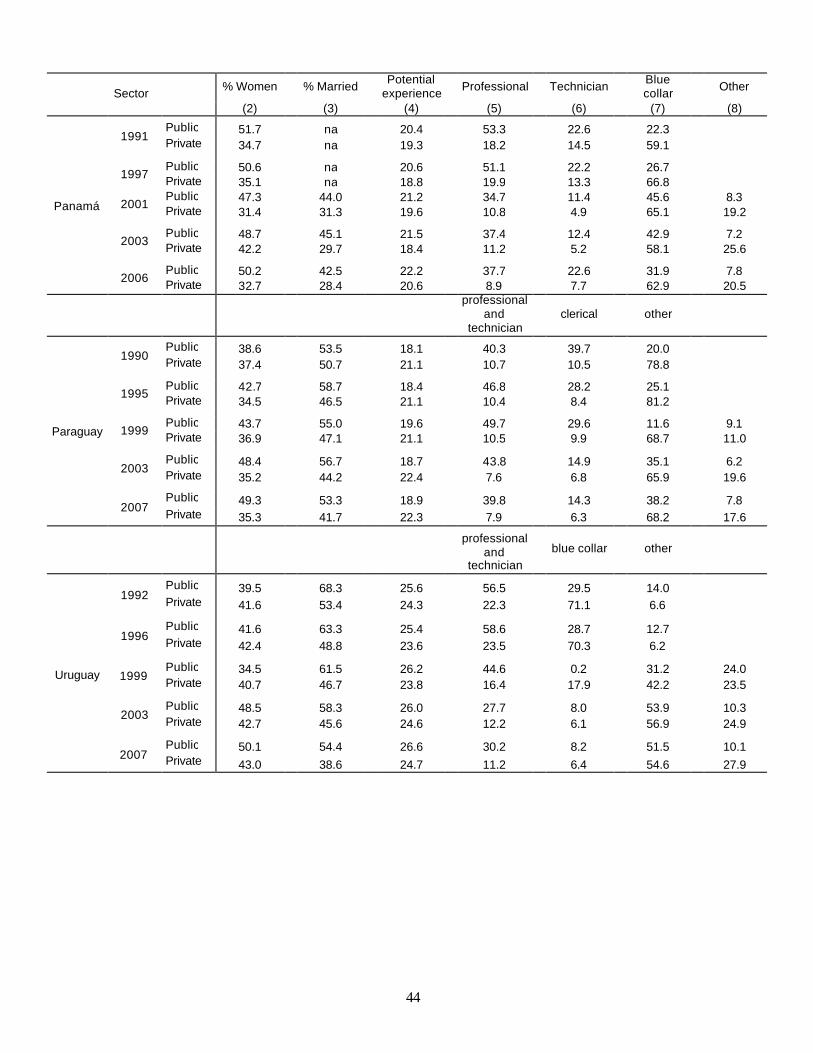
44
Sector % Women % Married Potential experience Professional Technician Blue
collar Other
(2) (3) (4) (5) (6) (7) (8)
Panamá
1991 Public 51.7
na
20.4
53.3
22.6
22.3
Private 34.7
na
19.3
18.2
14.5
59.1
1997 Public 50.6
na
20.6
51.1
22.2
26.7
Private 35.1
na
18.8
19.9
13.3
66.8
2001 Public 47.3
44.0
21.2
34.7
11.4
45.6
8.3
Private 31.4
31.3
19.6
10.8
4.9
65.1
19.2
2003 Public 48.7
45.1
21.5
37.4
12.4
42.9
7.2
Private 42.2
29.7
18.4
11.2
5.2
58.1
25.6
2006 Public 50.2
42.5
22.2
37.7
22.6
31.9
7.8
Private 32.7
28.4
20.6
8.9
7.7
62.9
20.5
professional and
technician
clerical other
Paraguay
1990 Public 38.6
53.5
18.1
40.3
39.7
20.0
Private 37.4
50.7
21.1
10.7
10.5
78.8
1995 Public 42.7
58.7
18.4
46.8
28.2
25.1
Private 34.5
46.5
21.1
10.4
8.4
81.2
1999 Public 43.7
55.0
19.6
49.7
29.6
11.6
9.1
Private 36.9
47.1
21.1
10.5
9.9
68.7
11.0
2003 Public 48.4
56.7
18.7
43.8
14.9
35.1
6.2
Private 35.2
44.2
22.4
7.6
6.8
65.9
19.6
2007 Public 49.3
53.3
18.9
39.8
14.3
38.2
7.8
Private 35.3
41.7
22.3
7.9
6.3
68.2
17.6
professional and
technician
blue collar
other
Uruguay
1992 Public 39.5
68.3
25.6
56.5
29.5
14.0
Private 41.6
53.4
24.3
22.3
71.1
6.6
1996 Public 41.6
63.3
25.4
58.6
28.7
12.7
Private 42.4
48.8
23.6
23.5
70.3
6.2
1999 Public 34.5
61.5
26.2
44.6
0.2
31.2
24.0
Private 40.7
46.7
23.8
16.4
17.9
42.2
23.5
2003 Public 48.5
58.3
26.0
27.7
8.0
53.9
10.3
Private 42.7
45.6
24.6
12.2
6.1
56.9
24.9
2007 Public 50.1
54.4
26.6
30.2
8.2
51.5
10.1
Private 43.0
38.6
24.7
11.2
6.4
54.6
27.9

45
Table S3 Reduction in the Standardized Difference for Schooling and Experience; Mean Standardized Bias and Pseudo R2
Before and After Matching by Country and Year
Reduction in standardized difference Mean bias
before
Mean bias after
Pseudo R2 before
Pseudo R2 after Country Year
Experience Schooling before after before after
Argentina
1996 1999 2003 2006
-11.0 3.1 4.2 6.7
2.8 1.1 6.3 4.7
60.3 64.6 39.1 60.1
-5.1 -5.2 -0.4 -6.3
32.9 33.2 22.6 26.4
3.6 1.4 2.9 2.6
0.14 0.18 0.13 0.16
0.00 0.00 0.00 0.00
Bolivia
1992 1997 1999 2003 2007
-12.8 -26.3 -23.4 -19.3 -18.0
10.9 -3.1 -2.3 7.0 4.9
96.4 117.0 118.3 109.6 116.5
-14.6 -3.2 -3.8 -7.1 -8.0
28.3 32.9 36.5 36.7 43.6
5.9 6.1 7.7 6.0 6.4
0.26 0.25 0.24 0.27 0.30
0.01 0.02 0.02 0.01 0.02
Brazil
1992 1996 1999 2003 2007
0.5 0.4 0.3 6.8 6.4
0.3 -0.6 1.7
-1.3 -1.9
77.3 76.4 72.5 70.8 79.8
-1.5 -2.2 -1.5 0.5 1.4
31.8 29.5 29.6 25.2 26.0
2.3 2.5 2.3 1.6 1.4
0.30 0.30 0.30 0.16 0.18
0.00 0.00 0.00 0.00 0.00
Chile
1996 2000 2003 2006
5.7 0.5 2.8 0.5
2.8 6.6 2.0
-0.6
73.5 61.9 72.1 70.5
-6.0 -5.0 -5.0 -1.9
20.4 16.4 19.2 19.0
3.6 3.0 3.3 3.3
0.17 0.18 0.17 0.16
0.01 0.01 0.01 0.01
Colombia
1993 1996 2000 2003 2005
-4.4 -16.2 -26.3 -17.3 -19.3
2.5 6.8 7.9 3.6 3.7
87.0 106.0
88.7 133.8 135.8
-2.1 -1.4 1.8 1.3 0.7
31.6 32.7 32.8 30.3 32.9
4.2 5.6 4.3 3.6 4.1
0.26 0.27 0.28 0.26 0.27
0.01 0.01 0.01 0.01 0.01
Costa Rica
1992 1996 1999 2003 2007
-8.8 -6.8 -3.1 3.0
-1.4
-4.0 -20.7 -6.1 -0.2 -3.6
85.4 92.6
102.0 102.9 113.9
7.0 5.6 7.2 1.6
-2.3
30.1 33.8 32.0 36.4 37.1
1.3 3.0 3.7 1.8 1.7
0.26 0.29 0.23 0.35 0.35
0.00 0.01 0.01 0.00 0.00
El Salvador
1991 1996 2000 2003 2006
-21.6 -39.7 -31.7 -33.8 -27.4
-6.7 -0.8 1.1
-6.5 -9.3
103.1 113.3 115.5 131.1 127.8
-0.1 -7.5 -6.3 0.0
-2.0
19.7 34.1 34.6 35.5 36.4
6.1 7.9 7.6 4.6 7.0
0.23 0.23 0.26 0.29 0.29
0.03 0.02 0.01 0.01 0.01
Honduras
1992 1996 2001 2003 2006
-13.6 -3.0 -4.5 -0.3 -2.3
6.4 3.3 1.0
-2.4 3.8
90.4 97.1
108.4 100.5 117.5
-2.1 -2.4
-10.6 0.7
-3.5
23.6 23.8 24.7 24.0 22.0
4.2 3.3 3.9 4.3 2.8
0.29 0.39 0.39 0.36 0.27
0.02 0.01 0.01 0.02 0.01
Panama
1991 1997 2001 2003 2006
7.5 12.8 5.0
23.2 5.9
-8.7 -6.1 0.0
-2.5 -3.4
55.8 62.3 69.9 71.4 83.3
-2.3 9.2
-3.8 3.6
-2.1
23.2 23.0 24.4 25.4 29.8
5.5 6.0 4.3 4.2 4.7
0.30 0.27 0.20 0.21 0.27
0.02 0.02 0.01 0.01 0.01
Paraguay
1990 1995 1999 2003 2007
-15.8 -20.0 -14.1 -33.3 -24.2
7.0 -5.9
-17.1 -1.2 -9.6
89.5 95.4 99.9
129.4 116.3
-2.8 2.2 0.6
-5.3 0.9
23.9 23.6 25.9 27.2 24.9
4.3 3.5 5.2 5.7 5.4
0.32 0.34 0.32 0.30 0.25
0.01 0.01 0.03 0.02 0.02
Uruguay
1992 1996 1999 2003 2007
9.4 12.6 16.4 10.7 13.4
-5.5 -1.4 3.7
-5.6 -6.4
46.7 41.9 36.0 60.8 64.6
-1.7 -4.4 -4.1 2.4 2.6
14.1 12.5 11.7 10.8 10.7
3.3 2.5 3.5 2.8 2.8
0.18 0.17 0.17 0.11 0.13
0.01 0.00 0.01 0.01 0.01
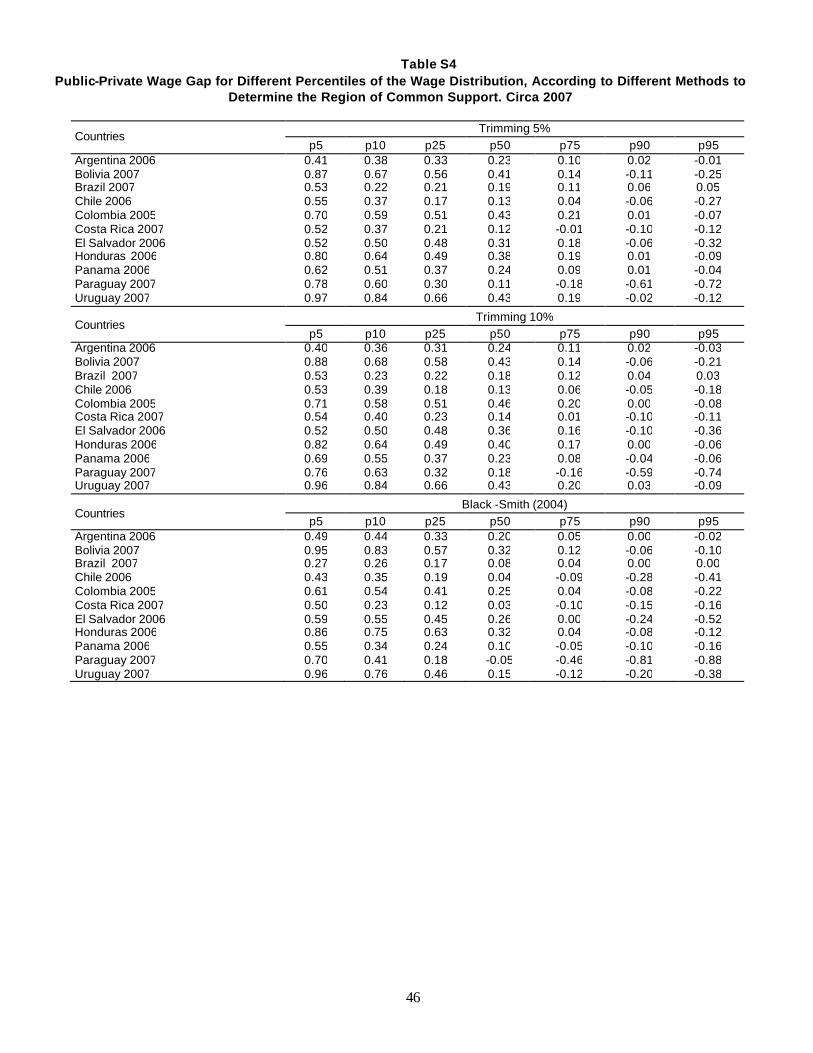
46
Table S4 Public-Private Wage Gap for Different Percentiles of the Wage Distribution, According to Different Methods to
Determine the Region of Common Support. Circa 2007
Countries Trimming 5%
p5 p10 p25 p50 p75 p90 p95 Argentina 2006 0.41 0.38 0.33 0.23 0.10 0.02 -0.01 Bolivia 2007 0.87 0.67 0.56 0.41 0.14 -0.11 -0.25 Brazil 2007 0.53 0.22 0.21 0.19 0.11 0.06 0.05 Chile 2006 0.55 0.37 0.17 0.13 0.04 -0.06 -0.27 Colombia 2005 0.70 0.59 0.51 0.43 0.21 0.01 -0.07 Costa Rica 2007 0.52 0.37 0.21 0.12 -0.01 -0.10 -0.12 El Salvador 2006 0.52 0.50 0.48 0.31 0.18 -0.06 -0.32 Honduras 2006 0.80 0.64 0.49 0.38 0.19 0.01 -0.09 Panama 2006 0.62 0.51 0.37 0.24 0.09 0.01 -0.04 Paraguay 2007 0.78 0.60 0.30 0.11 -0.18 -0.61 -0.72 Uruguay 2007 0.97 0.84 0.66 0.43 0.19 -0.02 -0.12
Countries Trimming 10%
p5 p10 p25 p50 p75 p90 p95 Argentina 2006 0.40 0.36 0.31 0.24 0.11 0.02 -0.03 Bolivia 2007 0.88 0.68 0.58 0.43 0.14 -0.06 -0.21 Brazil 2007 0.53 0.23 0.22 0.18 0.12 0.04 0.03 Chile 2006 0.53 0.39 0.18 0.13 0.06 -0.05 -0.18 Colombia 2005 0.71 0.58 0.51 0.46 0.20 0.00 -0.08 Costa Rica 2007 0.54 0.40 0.23 0.14 0.01 -0.10 -0.11 El Salvador 2006 0.52 0.50 0.48 0.36 0.16 -0.10 -0.36 Honduras 2006 0.82 0.64 0.49 0.40 0.17 0.00 -0.06 Panama 2006 0.69 0.55 0.37 0.23 0.08 -0.04 -0.06 Paraguay 2007 0.76 0.63 0.32 0.18 -0.16 -0.59 -0.74 Uruguay 2007 0.96 0.84 0.66 0.43 0.20 0.03 -0.09
Countries Black -Smith (2004)
p5 p10 p25 p50 p75 p90 p95 Argentina 2006 0.49 0.44 0.33 0.20 0.05 0.00 -0.02 Bolivia 2007 0.95 0.83 0.57 0.32 0.12 -0.06 -0.10 Brazil 2007 0.27 0.26 0.17 0.08 0.04 0.00 0.00 Chile 2006 0.43 0.35 0.19 0.04 -0.09 -0.28 -0.41 Colombia 2005 0.61 0.54 0.41 0.25 0.04 -0.08 -0.22 Costa Rica 2007 0.50 0.23 0.12 0.03 -0.10 -0.15 -0.16 El Salvador 2006 0.59 0.55 0.45 0.26 0.00 -0.24 -0.52 Honduras 2006 0.86 0.75 0.63 0.32 0.04 -0.08 -0.12 Panama 2006 0.55 0.34 0.24 0.10 -0.05 -0.10 -0.16 Paraguay 2007 0.70 0.41 0.18 -0.05 -0.46 -0.81 -0.88 Uruguay 2007 0.96 0.76 0.46 0.15 -0.12 -0.20 -0.38
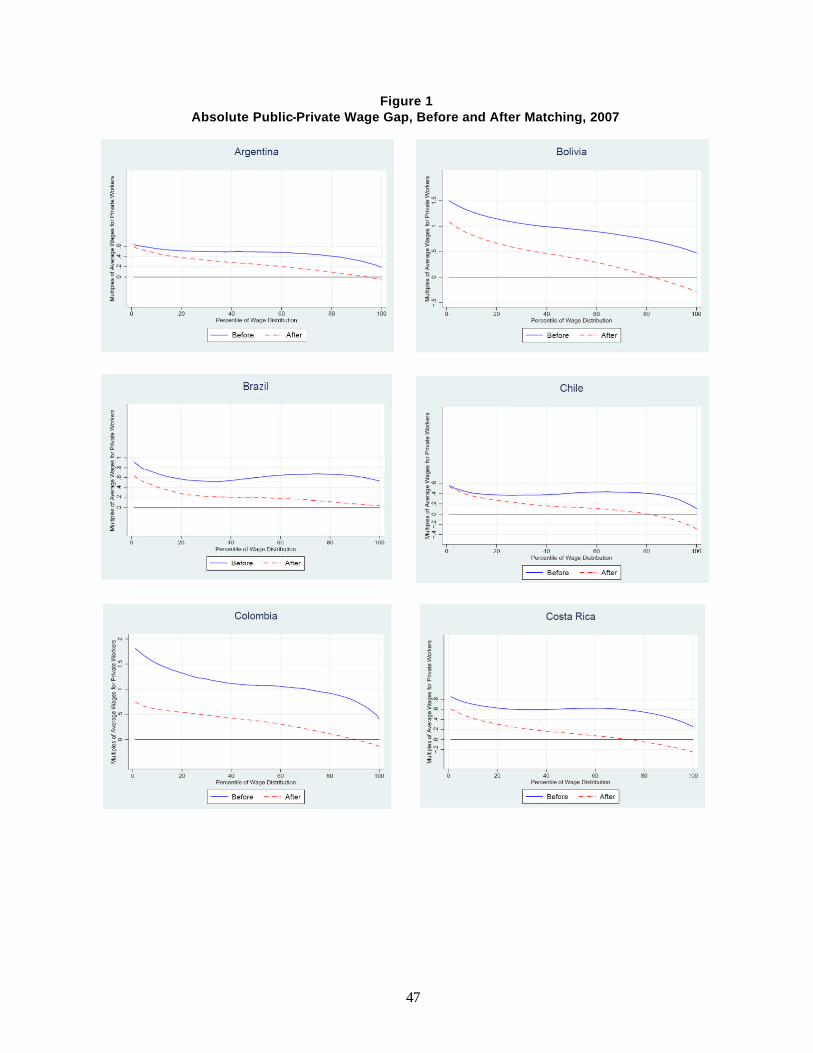
47
Figure 1 Absolute Public-Private Wage Gap, Before and After Matching, 2007

48
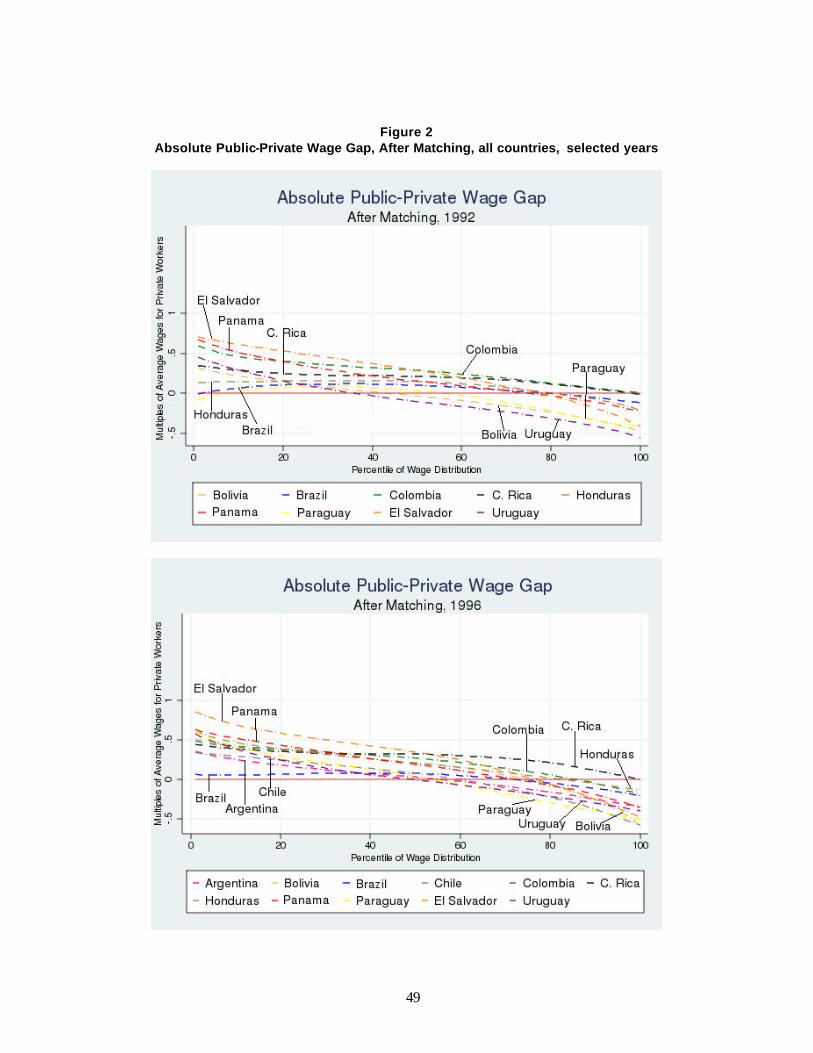
49
Figure 2 Absolute Public-Private Wage Gap, After Matching, all countries, selected years
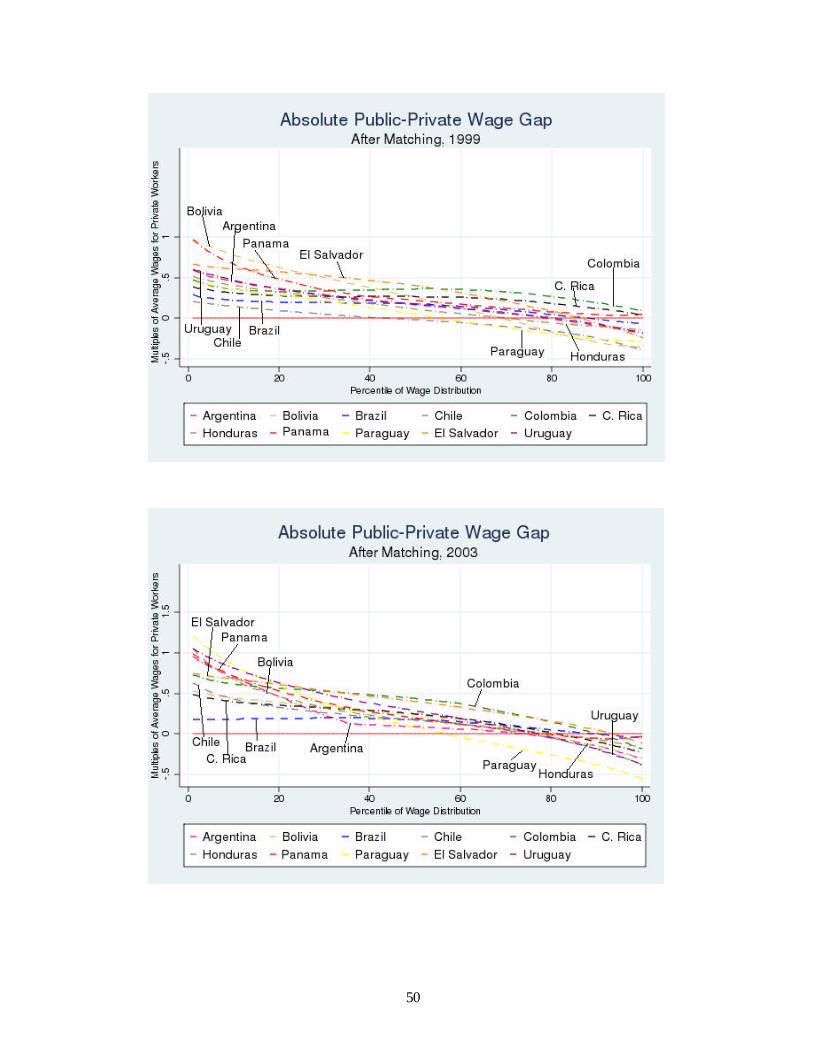
50

51
Centro de Economía Aplicada Departamento de Ingeniería Industrial
Universidad de Chile
2010
268. Public-Private Wage Gap In Latin America (1999-2007): A Matching Approach Alejandra Mizala, Pilar Romaguera y Sebastián Gallegos
267. Costly information acquisition. Better to toss a coin?
Matteo Triossi 266. Firm-Provided Training and Labor Market Institutions
Felipe Balmaceda
2009
265. Soft budgets and Renegotiations in Public-Private Partnerships Eduardo Engel, Ronald Fischer y Alexander Galetovic
264. Information Asymmetries and an Endogenous Productivity Reversion Mechanism
Nicolás Figueroa y Oksana Leukhina 263. The Effectiveness of Private Voucher Education: Evidence from Structural School Switches Bernardo Lara, Alejandra Mizala y Andrea Repetto 262. Renegociación de concesiones en Chile Eduardo Engel, Ronald Fischer, Alexander Galetovic y Manuel Hermosilla 261. Inflation and welfare in long-run equilibrium with firm dynamics Alexandre Janiak y Paulo Santos Monteiro 260. Conflict Resolution in the Electricity Sector - The Experts Panel of Chile R. Fischer, R. Palma-Behnke y J. Guevara-Cedeño 259. Economic Performance, creditor protection and labor inflexibility
Felipe Balmaceda y Ronald Fischer 258. Effective Schools for Low Income Children: a Study of Chile’s Sociedad de Instrucción
Primaria Francisco Henríquez, Alejandra Mizala y Andrea Repetto

257. Public-Private Partnerships: when and how Eduardo Engel, Ronald Fischer y Alexander Galetovic
2008
256. Pricing with markups in industries with increasing marginal costs José R. Correa, Nicolás Figueroa y Nicolás E. Stier-Moses 255. Implementation with renegotiation when preferences and feasible sets are state dependent
Luis Corchón y Matteo Triossi 254. Evaluación de estrategias de desarrollo para alcanzar los objetivos del Milenio en América
Latina. El caso de Chile Raúl O’Ryan, Carlos J. de Miguel y Camilo Lagos 253. Welfare in models of trade with heterogeneous firms Alexandre Janiak 252. Firm-Provided Training and Labor Market Policies Felipe Balmaceda 251. Emerging Markets Variance Shocks: Local or International in Origin? Viviana Fernández y Brian M. Lucey 250. Economic performance, creditor protection and labor inflexibility Ronald Fischer 249. Loyalty inducing programs and competition with homogeneous goods N. Figueroa, R. Fischer y S. Infante 248. Local social capital and geographical mobility. A theory Quentin David, Alexandre Janiak y Etienne Wasmer 247. On the planner’s loss due to lack of information in bayesian mechanism design
José R. Correa y Nicolás Figueroa 246. Política comercial estratégica en el mercado aéreo chileno
Ronald Fischer 245. A large firm model of the labor market with entry, exit and search frictions
Alexandre Janiak 244. Optimal resource extraction contracts under threat of expropriation
Eduardo Engel y Ronald Fischer

2007
243. The behavior of stock returns in the Asia-Pacific mining industry following the Iraq war Viviana Fernandez 242. Multi-period hedge ratios for a multi-asset portfolio when accounting for returns
comovement Viviana Fernández
241. Competition with asymmetric switching costs S. Infante, N. Figueroa y R. Fischer 240. A Note on the Comparative Statics of Optimal Procurement Auctions Gonzalo Cisternas y Nicolás Figueroa 239. Parental choice and school markets: The impact of information approximating school
effectiveness Alejandra Mizala y Miguel Urquiola 238. Marginal Cost Pricing in Hydro-Thermal Power Industries: Is a Capacity Charge Always
Needed? M. Soledad Arellano and Pablo Serra 237. What to put on the table Nicolas Figueroa y Vasiliki Skreta 236. Estimating Discount Functions with Consumption Choices over the Lifecycle
David Laibson, Andrea Repetto y Jeremy Tobacman 235. La economía política de la reforma educacional en Chile
Alejandra Mizala 234. The Basic Public Finance of Public-Private Partnerships Eduardo Engel, Ronald Fischer y Alexander Galetovic 233. Sustitución entre Telefonía Fija y Móvil en Chile M. Soledad Arellano y José Miguel Benavente 232. Note on Optimal Auctions Nicolás Figueroa y Vasiliki Skreta 231. The Role of Outside Options in Auction Design Nicolás Figueroa y Vasiliki Skreta
230. Sequential Procurement Auctions and Their Effect on Investment Decisions Gonzalo Cisternas y Nicolás Figueroa
2006
229. Forecasting crude oil and natural gas spot prices by classification methods Viviana Fernández 228. Copula-based measures of dependence structure in assets returns Viviana Fernández 227. Un Análisis Econométrico del Consumo Mundial de Celulosa
José Ignacio Sémbler, Patricio Meller y Joaquín Vial 226. The Old and the New Reform of Chile’s Power Industry. (Por aparecer en el International
Journal of Global Energy Issues (forthcoming 2007)) M. Soledad Arellano 225. Socioeconomic status or noise? Tradeoffs in the generation of school quality information.
(Por aparecer en el Journal of Development Economics) Alejandra Mizala, Pilar Romaguera y Miguel Urquiola
224. Mergers and CEO power Felipe Balmaceda 123. Task-Specific Training and Job Design Felipe Balmaceda 122. Performance of an economy with credit constraints, bankruptcy and labor inflexibility
Felipe Balmaceda y Ronald Fischer 121. Renegotiation without Holdup: Anticipating spending and infrastructure concessions
Eduardo Engel, Ronald Fischer y Alexander Galetovic 220. Using School Scholarships to Estimate the Effect of Government Subsidized Private
Education on Academic Achievement in Chile Priyanka Anand, Alejandra Mizala y Andrea Repetto
219. Portfolio management implications of volatility shifts: Evidence from simulated data Viviana Fernandez y Brian M Lucey * Para ver listado de números anteriores ir a http://www.cea-uchile.cl/.
Top Related