COLOMBIA - itu.int · COMISION DE REGULACION DE TELECOMUNICACIONES - REPUBLICA DE COLOMBIA ITU...
27
COMISION DE REGULACION DE TELECOMUNICACIONES - REPUBLICA DE COLOMBIA ITU WOKSHOP ON “THE FUTURE OF VOICE” Information about the Telecom Sector in Colombia CCN-Mercadeo OG Fecha actualización: 26/06/06 Página 1 de 27 Revisado por: JPH/CXB Fecha revisión: 26/06/06 Revisión No. 1 Aprobado por: Director Ejecutivo Fecha de vigencia: 01/02/05 COLOMBIA COMISIÓN DE REGULACIÓN DE TELECOMUNICACIONES 1 (CRT) DEVELOPMENTS IN THE TELECOMMUNICATION SECTOR 1. CURRENT SITUATION Consolidation in telecommunications sector companies in Colombia, was common in 2005; throughout the year, operators showed a growing need for modification of their existing business schemes. For the first time, there was discussion about integration between large local fixed telephony companies, their joining forces in the long distance and Internet businesses, as had already taken place with PCS in mobile telephony. Company moves can be explained by increased competition and the need for ways to promote economies of scale and efficiency in network operations. As business groups consolidate, management processes can be optimized and a series of efficiencies are generated. These can lead to an increased service offering as long as competitive conditions persist among service providers. 1.1 Investment in Telecommunications After the energy sector (51%), the telecommunications sector is the second largest investor in infrastructure in Colombia (22% of total investment). This sector has presented this privileged position only since 1997, which can be explained by the growth of fixed telephony during those years and the introduction of mobile telephony in the country. Graph 1. Infrastructure Investment 1 For all of your questions regarding the information contained in this document, you can contact Mr. Orlando Garcés in the Comisión de Regulación de Telecomunicaciones ([email protected] ) 0% 20% 40% 60% 80% 100% 120% 1,993 1,998 2,003 Telecomm Transport Energy Water Infrastructure investment share 0% 20% 40% 60% 80% 100% 120% 1,993 1,998 2,003 Telecomm Transport Energy Water Infrastructure investment share 15% 30% 22% 0% 20% 40% 60% 80% 100% 120% 1,993 1,998 2,003 Telecomm Transport Energy Water Telecomm Telecomm Transport Transport Energy Energy Water Water Infrastructure investment share
-
Upload
vuongkhuong -
Category
Documents
-
view
215 -
download
1
Transcript of COLOMBIA - itu.int · COMISION DE REGULACION DE TELECOMUNICACIONES - REPUBLICA DE COLOMBIA ITU...

C O M I S I O N D E R E G U L A C I O N D E T E L E C O M U N I C A C I O N E S - R E P U B L I C A D E C O L O M B I A
ITU WOKSHOP ON “THE FUTURE OF VOICE” Information about the Telecom Sector in Colombia CCN-Mercadeo OG
Fecha actualización: 26/06/06 Página 1 de 27
Revisado por:JPH/CXB
Fecha revisión: 26/06/06
Revisión No. 1 Aprobado por: Director Ejecutivo Fecha de vigencia: 01/02/05
COLOMBIA
COMISIÓN DE REGULACIÓN DE TELECOMUNICACIONES1 (CRT)
DEVELOPMENTS IN THE TELECOMMUNICATION SECTOR 1. CURRENT SITUATION Consolidation in telecommunications sector companies in Colombia, was common in 2005; throughout the year, operators showed a growing need for modification of their existing business schemes. For the first time, there was discussion about integration between large local fixed telephony companies, their joining forces in the long distance and Internet businesses, as had already taken place with PCS in mobile telephony. Company moves can be explained by increased competition and the need for ways to promote economies of scale and efficiency in network operations. As business groups consolidate, management processes can be optimized and a series of efficiencies are generated. These can lead to an increased service offering as long as competitive conditions persist among service providers. 1.1 Investment in Telecommunications After the energy sector (51%), the telecommunications sector is the second largest investor in infrastructure in Colombia (22% of total investment). This sector has presented this privileged position only since 1997, which can be explained by the growth of fixed telephony during those years and the introduction of mobile telephony in the country.
Graph 1. Infrastructure Investment
1 For all of your questions regarding the information contained in this document, you can contact Mr. Orlando Garcés in the Comisión de Regulación de Telecomunicaciones ([email protected])
15%30% 22%
0%
20%
40%
60%
80%
100%
120%
1,993 1,998 2,003
Telecomm Transport Energy Water
Infr
astr
uctu
rein
vest
men
tsha
re
15%30% 22%
0%
20%
40%
60%
80%
100%
120%
1,993 1,998 2,003
Telecomm Transport Energy Water
Infr
astr
uctu
rein
vest
men
tsha
re
15%30% 22%
0%
20%
40%
60%
80%
100%
120%
1,993 1,998 2,003
Telecomm Transport Energy WaterTelecommTelecomm TransportTransport EnergyEnergy WaterWater
Infr
astr
uctu
rein
vest
men
tsha
re
C O M I S I O N D E R E G U L A C I O N D E T E L E C O M U N I C A C I O N E S - R E P U B L I C A D E C O L O M B I A
ITU WOKSHOP ON “THE FUTURE OF VOICE” Information about the Telecom Sector in Colombia CCN-Mercadeo OG
Fecha actualización: 26/06/06 Página 2 de 27
Revisado por:JPH/CXB
Fecha revisión: 26/06/06
Revisión No. 1 Aprobado por: Director Ejecutivo Fecha de vigencia: 01/02/05
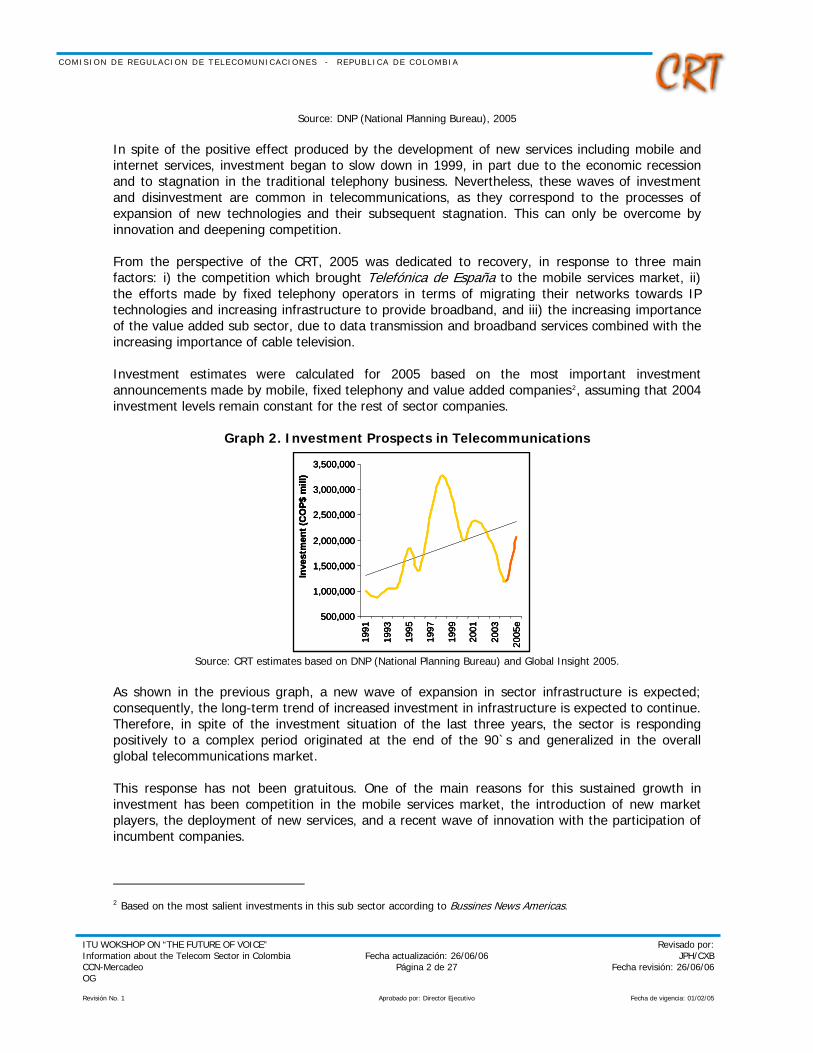
Source: DNP (National Planning Bureau), 2005
In spite of the positive effect produced by the development of new services including mobile and internet services, investment began to slow down in 1999, in part due to the economic recession and to stagnation in the traditional telephony business. Nevertheless, these waves of investment and disinvestment are common in telecommunications, as they correspond to the processes of expansion of new technologies and their subsequent stagnation. This can only be overcome by innovation and deepening competition. From the perspective of the CRT, 2005 was dedicated to recovery, in response to three main factors: i) the competition which brought Telefónica de España to the mobile services market, ii) the efforts made by fixed telephony operators in terms of migrating their networks towards IP technologies and increasing infrastructure to provide broadband, and iii) the increasing importance of the value added sub sector, due to data transmission and broadband services combined with the increasing importance of cable television. Investment estimates were calculated for 2005 based on the most important investment announcements made by mobile, fixed telephony and value added companies2, assuming that 2004 investment levels remain constant for the rest of sector companies.
Graph 2. Investment Prospects in Telecommunications
Source: CRT estimates based on DNP (National Planning Bureau) and Global Insight 2005. As shown in the previous graph, a new wave of expansion in sector infrastructure is expected; consequently, the long-term trend of increased investment in infrastructure is expected to continue. Therefore, in spite of the investment situation of the last three years, the sector is responding positively to a complex period originated at the end of the 90`s and generalized in the overall global telecommunications market. This response has not been gratuitous. One of the main reasons for this sustained growth in investment has been competition in the mobile services market, the introduction of new market players, the deployment of new services, and a recent wave of innovation with the participation of incumbent companies.
2 Based on the most salient investments in this sub sector according to Bussines News Americas.
500,000
1,000,000
1,500,000
2,000,000
2,500,000
3,000,000
3,500,000
1991
1993
1995
1997
1999
2001
2003
2005
e
Inve
stm
ent(
CO
P$m
ill)
500,000
1,000,000
1,500,000
2,000,000
2,500,000
3,000,000
3,500,000
1991
1993
1995
1997
1999
2001
2003
2005
e
Inve
stm
ent(
CO
P$m
ill)
500,000
1,000,000
1,500,000
2,000,000
2,500,000
3,000,000
3,500,000
1991
1993
1995
1997
1999
2001
2003
2005
e
Inve
stm
ent(
CO
P$m
ill)
C O M I S I O N D E R E G U L A C I O N D E T E L E C O M U N I C A C I O N E S - R E P U B L I C A D E C O L O M B I A
ITU WOKSHOP ON “THE FUTURE OF VOICE” Information about the Telecom Sector in Colombia CCN-Mercadeo OG
Fecha actualización: 26/06/06 Página 3 de 27
Revisado por:JPH/CXB
Fecha revisión: 26/06/06
Revisión No. 1 Aprobado por: Director Ejecutivo Fecha de vigencia: 01/02/05
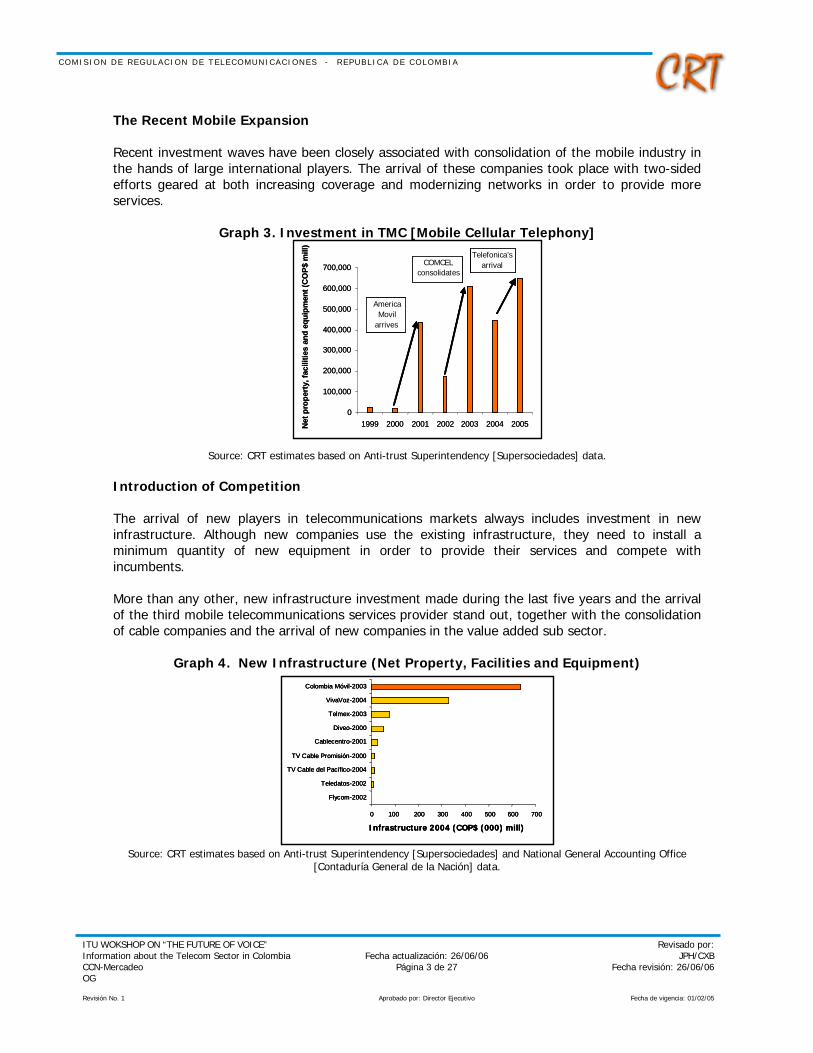
The Recent Mobile Expansion Recent investment waves have been closely associated with consolidation of the mobile industry in the hands of large international players. The arrival of these companies took place with two-sided efforts geared at both increasing coverage and modernizing networks in order to provide more services.
Graph 3. Investment in TMC [Mobile Cellular Telephony]
Source: CRT estimates based on Anti-trust Superintendency [Supersociedades] data. Introduction of Competition The arrival of new players in telecommunications markets always includes investment in new infrastructure. Although new companies use the existing infrastructure, they need to install a minimum quantity of new equipment in order to provide their services and compete with incumbents. More than any other, new infrastructure investment made during the last five years and the arrival of the third mobile telecommunications services provider stand out, together with the consolidation of cable companies and the arrival of new companies in the value added sub sector.
Graph 4. New Infrastructure (Net Property, Facilities and Equipment)
Source: CRT estimates based on Anti-trust Superintendency [Supersociedades] and National General Accounting Office [Contaduría General de la Nación] data.
0
100,000
200,000
300,000
400,000
500,000
600,000
700,000
1999 2000 2001 2002 2003 2004 2005Net
pro
pert
y, fa
cilit
ies
and
equi
pmen
t(C
OP$
mill
)AmericaMovil
arrives
Telefonica’sarrivalCOMCEL
consolidates
0
100,000
200,000
300,000
400,000
500,000
600,000
700,000
1999 2000 2001 2002 2003 2004 2005Net
pro
pert
y, fa
cilit
ies
and
equi
pmen
t(C
OP$
mill
)AmericaMovil
arrives
Telefonica’sarrivalCOMCEL
consolidates
0 100 200 300 400 500 600 700
Flycom-2002
Teledatos-2002
TV Cable del Pacífico-2004
TV Cable Promisión-2000
Cablecentro-2001
Diveo-2000
Telmex-2003
VivaVoz-2004
Colombia Móvil-2003
Infrastructure 2004 (COP$ (000) mill)
0 100 200 300 400 500 600 700
Flycom-2002
Teledatos-2002
TV Cable del Pacífico-2004
TV Cable Promisión-2000
Cablecentro-2001
Diveo-2000
Telmex-2003
VivaVoz-2004
Colombia Móvil-2003
Infrastructure 2004 (COP$ (000) mill)
0 100 200 300 400 500 600 700
Flycom-2002
Teledatos-2002
TV Cable del Pacífico-2004
TV Cable Promisión-2000
Cablecentro-2001
Diveo-2000
Telmex-2003
VivaVoz-2004
Colombia Móvil-2003
Infrastructure 2004 (COP$ (000) mill)
C O M I S I O N D E R E G U L A C I O N D E T E L E C O M U N I C A C I O N E S - R E P U B L I C A D E C O L O M B I A
ITU WOKSHOP ON “THE FUTURE OF VOICE” Information about the Telecom Sector in Colombia CCN-Mercadeo OG
Fecha actualización: 26/06/06 Página 4 de 27
Revisado por:JPH/CXB
Fecha revisión: 26/06/06
Revisión No. 1 Aprobado por: Director Ejecutivo Fecha de vigencia: 01/02/05
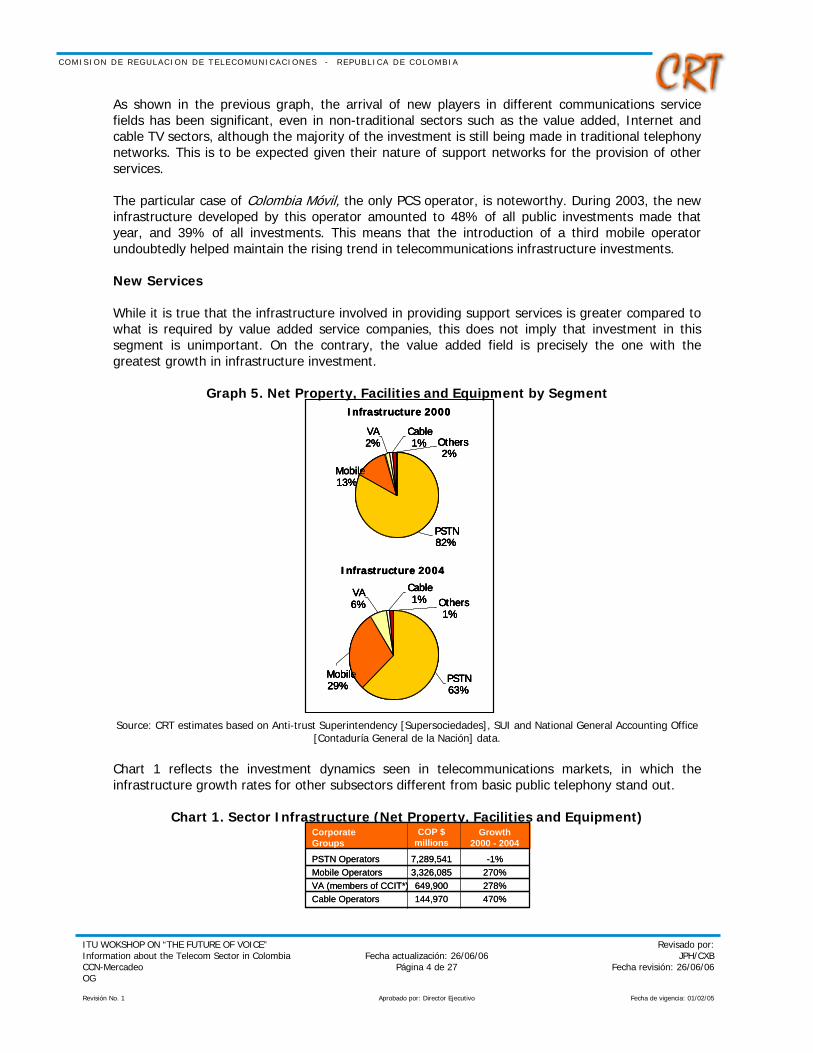
As shown in the previous graph, the arrival of new players in different communications service fields has been significant, even in non-traditional sectors such as the value added, Internet and cable TV sectors, although the majority of the investment is still being made in traditional telephony networks. This is to be expected given their nature of support networks for the provision of other services. The particular case of Colombia Móvil, the only PCS operator, is noteworthy. During 2003, the new infrastructure developed by this operator amounted to 48% of all public investments made that year, and 39% of all investments. This means that the introduction of a third mobile operator undoubtedly helped maintain the rising trend in telecommunications infrastructure investments. New Services While it is true that the infrastructure involved in providing support services is greater compared to what is required by value added service companies, this does not imply that investment in this segment is unimportant. On the contrary, the value added field is precisely the one with the greatest growth in infrastructure investment.
Graph 5. Net Property, Facilities and Equipment by Segment
Source: CRT estimates based on Anti-trust Superintendency [Supersociedades], SUI and National General Accounting Office
[Contaduría General de la Nación] data. Chart 1 reflects the investment dynamics seen in telecommunications markets, in which the infrastructure growth rates for other subsectors different from basic public telephony stand out.
Chart 1. Sector Infrastructure (Net Property, Facilities and Equipment)
Infrastructure 2000
PSTN82%
Others2%
Mobile13%
Cable1%
VA2%
Infrastructure 2004
VA6%
Cable1%
Mobile29%
Others1%
PSTN63%
Infrastructure 2000
PSTN82%
Others2%
Mobile13%
Cable1%
VA2%
Infrastructure 2000
PSTN82%
Others2%
Mobile13%
Cable1%
VA2%
PSTN82%
Others2%
Mobile13%
Cable1%
VA2%
Infrastructure 2004
VA6%
Cable1%
Mobile29%
Others1%
PSTN63%
Infrastructure 2004
VA6%
Cable1%
Mobile29%
Others1%
PSTN63%
VA6%
Cable1%
Mobile29%
Others1%
PSTN63%
PSTN OperatorsMobile OperatorsVA (members of CCIT*)Cable Operators
CorporateGroups
7,289,5413,326,085649,900144,970
COP $ millions
Growth2000 - 2004
-1%270%278%470%
PSTN OperatorsMobile OperatorsVA (members of CCIT*)Cable Operators
CorporateGroups
7,289,5413,326,085649,900144,970
COP $ millions
Growth2000 - 2004
-1%270%278%470%
C O M I S I O N D E R E G U L A C I O N D E T E L E C O M U N I C A C I O N E S - R E P U B L I C A D E C O L O M B I A
ITU WOKSHOP ON “THE FUTURE OF VOICE” Information about the Telecom Sector in Colombia CCN-Mercadeo OG
Fecha actualización: 26/06/06 Página 5 de 27
Revisado por:JPH/CXB
Fecha revisión: 26/06/06
Revisión No. 1 Aprobado por: Director Ejecutivo Fecha de vigencia: 01/02/05
* CCIT: Colombian Chamber of Informatics and Telecommunications
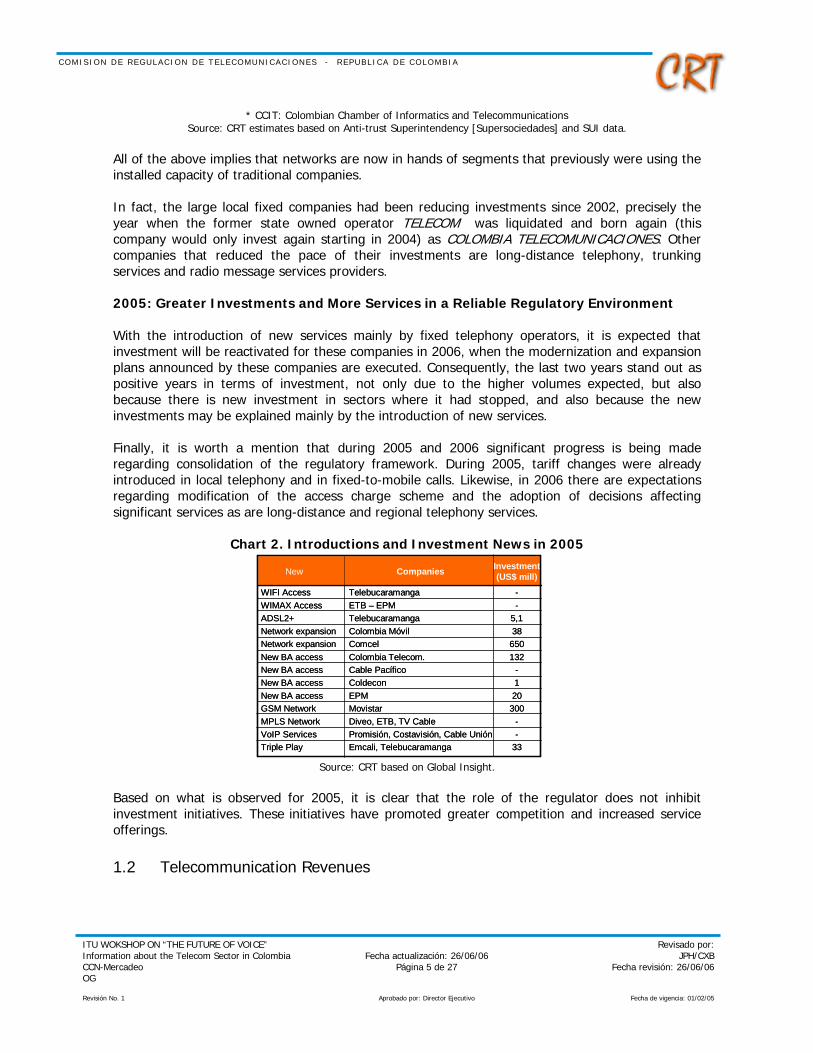
Source: CRT estimates based on Anti-trust Superintendency [Supersociedades] and SUI data. All of the above implies that networks are now in hands of segments that previously were using the installed capacity of traditional companies. In fact, the large local fixed companies had been reducing investments since 2002, precisely the year when the former state owned operator TELECOM was liquidated and born again (this company would only invest again starting in 2004) as COLOMBIA TELECOMUNICACIONES. Other companies that reduced the pace of their investments are long-distance telephony, trunking services and radio message services providers. 2005: Greater Investments and More Services in a Reliable Regulatory Environment With the introduction of new services mainly by fixed telephony operators, it is expected that investment will be reactivated for these companies in 2006, when the modernization and expansion plans announced by these companies are executed. Consequently, the last two years stand out as positive years in terms of investment, not only due to the higher volumes expected, but also because there is new investment in sectors where it had stopped, and also because the new investments may be explained mainly by the introduction of new services. Finally, it is worth a mention that during 2005 and 2006 significant progress is being made regarding consolidation of the regulatory framework. During 2005, tariff changes were already introduced in local telephony and in fixed-to-mobile calls. Likewise, in 2006 there are expectations regarding modification of the access charge scheme and the adoption of decisions affecting significant services as are long-distance and regional telephony services.
Chart 2. Introductions and Investment News in 2005
Source: CRT based on Global Insight. Based on what is observed for 2005, it is clear that the role of the regulator does not inhibit investment initiatives. These initiatives have promoted greater competition and increased service offerings. 1.2 Telecommunication Revenues
WIFI AccessWIMAX AccessADSL2+Network expansionNetwork expansionNew BA accessNew BA accessNew BA accessNew BA accessGSM NetworkMPLS NetworkVoIP ServicesTriple Play
New Companies
TelebucaramangaETB – EPMTelebucaramangaColombia MóvilComcelColombia Telecom.Cable PacíficoColdeconEPMMovistarDiveo, ETB, TV CablePromisión, Costavisión, Cable UniónEmcali, Telebucaramanga
Investment(US$ mill)
--
5,138
650132
-120
300--
33

C O M I S I O N D E R E G U L A C I O N D E T E L E C O M U N I C A C I O N E S - R E P U B L I C A D E C O L O M B I A
ITU WOKSHOP ON “THE FUTURE OF VOICE” Information about the Telecom Sector in Colombia CCN-Mercadeo OG
Fecha actualización: 26/06/06 Página 6 de 27
Revisado por:JPH/CXB
Fecha revisión: 26/06/06
Revisión No. 1 Aprobado por: Director Ejecutivo Fecha de vigencia: 01/02/05
In Colombia, the telecommunication sector remains dynamic, driven by telecommunications services sales. Mobile telephony has undoubtedly positioned itself, while fixed telephony presents moderate growth, both of them stimulated by the substitution of fixed lines by other technological options.
Chart 3. Telecommunications Revenues in Colombia 2000-2005 (Millions of U.S. Dollars)
SUBSECTOR 2000 2001 2002 2003 2004 2005 Local Telephony $ 644 $ 664 $ 569 $ 645 $ 849 $ 899Local Extended Telephony $ 203 $ 225 $ 193 $ 202 $ 310 $ 310Mobile Rural Telephony $ 5 $ 7 $ 6 $ 7 $ 9 $ 8Interconnection* $ 256 $ 503 $ 429 $ 322 $ 288 $ 299Other PSTN Services $ 161 $ 152 $ 130 $ 188 $ 242 $ 299Value Added Services $ 127 $ 162 $ 145 $ 241 $ 348 $ 383Carrier $ 45 $ 36 $ 32 $ 49 $ 51 $ 61National Long Distance $ 406 $ 435 $ 395 $ 400 $ 373 $ 288International Long Distance $ 226 $ 257 $ 135 $ 140 $ 171 $ 174Mobile Telephony $ 371 $ 468 $ 553 $ 835 $ 1,542 $ 2,432Trunking $ 47 $ 55 $ 48 $ 51 $ 64 $ 66Radio and Television $ 207 $ 385 $ 335 $ 386 $ 450 $ 589Others** $ 336 $ 360 $ 314 $ 362 $ 414 $ 582TOTAL (millions of dollars) $ 3,035 $ 3,708 $ 3,284 $ 3,829 $ 5,111 $ 6,389Exchange Rate in December 31th (1$US = $ 2,229 $ 2,291 $ 2,864 $ 2,778 $ 2,389 $ 2,284
* Represents payments between sector operators. ** Others includes equipment, suppliers and postal service sales estimates Source: CRT based on data consulted at the Ministry of Communications, CRT, SSPD, Anti-trust Superintendency [Supersociedades], Securities Exchange Superintendency [Supervalores], and CCIT.
According to CRT calculations, telecommunications sector total revenue was US$6,39 billion during the year 2005. This represents 11,5% actual growth in real terms compared with the same value of 2004 (in terms of current Colombian pesos $).
Graph 6. Income Distribution based on Telecommunications Services Revenues
42% 42% 40% 36% 33% 28%
14%10%
7%
17% 22% 30% 38%
4% 4% 4% 6% 7% 6%
21% 23% 22% 22% 21% 20%
16%19%21%
12% 13%
0%
20%
40%
60%
80%
100%
2000 2001 2002 2003 2004 2005
Local Telephony Long Distance TelephonyMobile Telephony Value Added ServicesOthers
* Local telephony includes Local, Regional, Rural, Interconnection and other PSTN services. ** Others includes Carrier, Trunking, Radio and Television and Others
C O M I S I O N D E R E G U L A C I O N D E T E L E C O M U N I C A C I O N E S - R E P U B L I C A D E C O L O M B I A
ITU WOKSHOP ON “THE FUTURE OF VOICE” Information about the Telecom Sector in Colombia CCN-Mercadeo OG
Fecha actualización: 26/06/06 Página 7 de 27
Revisado por:JPH/CXB
Fecha revisión: 26/06/06
Revisión No. 1 Aprobado por: Director Ejecutivo Fecha de vigencia: 01/02/05
Source: CRT based on data consulted at the Ministry of Communications, CRT, SSPD, Anti-trust Superintendency [Supersociedades], Securities Exchange Superintendency [Supervalores], CCIT.
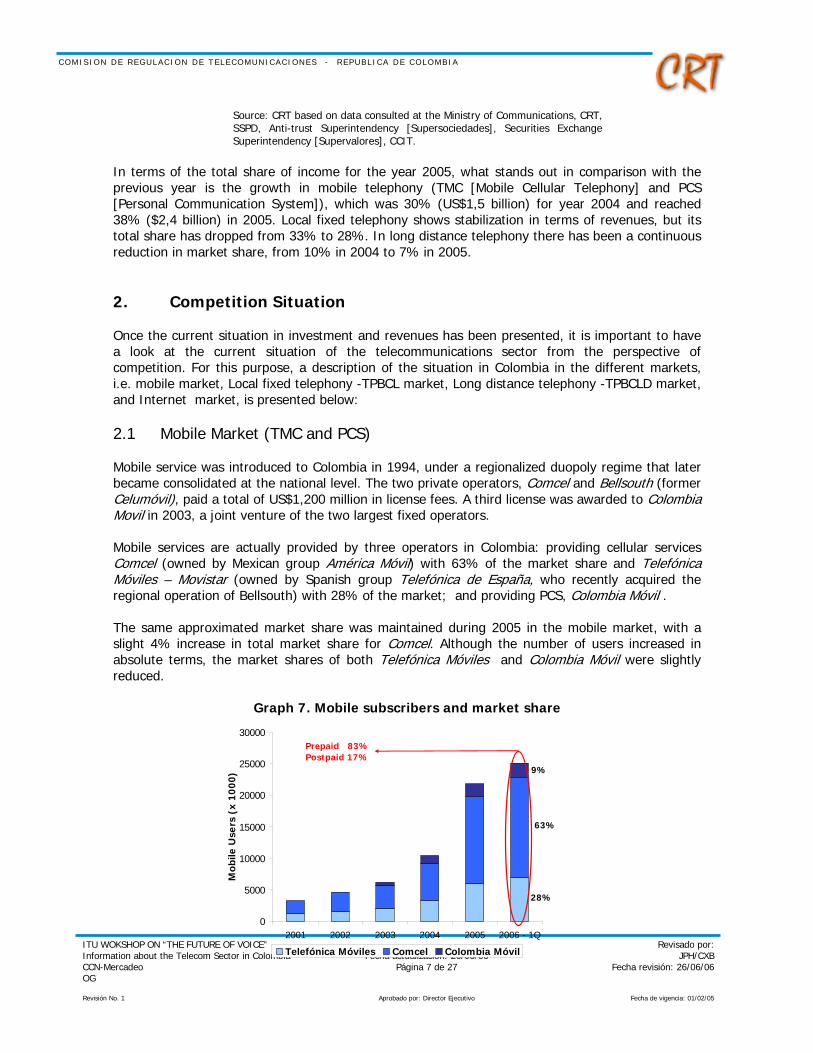
In terms of the total share of income for the year 2005, what stands out in comparison with the previous year is the growth in mobile telephony (TMC [Mobile Cellular Telephony] and PCS [Personal Communication System]), which was 30% (US$1,5 billion) for year 2004 and reached 38% ($2,4 billion) in 2005. Local fixed telephony shows stabilization in terms of revenues, but its total share has dropped from 33% to 28%. In long distance telephony there has been a continuous reduction in market share, from 10% in 2004 to 7% in 2005. 2. Competition Situation Once the current situation in investment and revenues has been presented, it is important to have a look at the current situation of the telecommunications sector from the perspective of competition. For this purpose, a description of the situation in Colombia in the different markets, i.e. mobile market, Local fixed telephony -TPBCL market, Long distance telephony -TPBCLD market, and Internet market, is presented below: 2.1 Mobile Market (TMC and PCS) Mobile service was introduced to Colombia in 1994, under a regionalized duopoly regime that later became consolidated at the national level. The two private operators, Comcel and Bellsouth (former Celumóvil), paid a total of US$1,200 million in license fees. A third license was awarded to Colombia Movil in 2003, a joint venture of the two largest fixed operators. Mobile services are actually provided by three operators in Colombia: providing cellular services Comcel (owned by Mexican group América Móvil) with 63% of the market share and Telefónica Móviles – Movistar (owned by Spanish group Telefónica de España, who recently acquired the regional operation of Bellsouth) with 28% of the market; and providing PCS, Colombia Móvil . The same approximated market share was maintained during 2005 in the mobile market, with a slight 4% increase in total market share for Comcel. Although the number of users increased in absolute terms, the market shares of both Telefónica Móviles and Colombia Móvil were slightly reduced.
Graph 7. Mobile subscribers and market share
02001 2002 2003 2004 2005 2006 - 1Q
5000
10000
15000
20000
25000
30000
Mob
ile U
sers
(x
1000
)
Telefónica Móviles Comcel Colombia Móvil
63%
28%
9%
Prepaid 83%Postpaid 17%

C O M I S I O N D E R E G U L A C I O N D E T E L E C O M U N I C A C I O N E S - R E P U B L I C A D E C O L O M B I A
ITU WOKSHOP ON “THE FUTURE OF VOICE” Information about the Telecom Sector in Colombia CCN-Mercadeo OG
Fecha actualización: 26/06/06 Página 8 de 27
Revisado por:JPH/CXB
Fecha revisión: 26/06/06
Revisión No. 1 Aprobado por: Director Ejecutivo Fecha de vigencia: 01/02/05
Source: Quarterly Report on Mobile Telephony – Ministry of Communications Colombia’s mobile market presents an important rate of growth due to the introduction of competition in 2003, when the third mobile operator entered to provide services. From 10 million in 2004 to 25 million users in 2006, 83% of whom were prepaid costumers. New mobile services have been introduced to the market over the last years. The number of mobile users increased approximately 100% in 2005 being the country with the highest growth rate in the region. At the end of 2005, mobile market penetration in Colombia reached nearly 50%.
Graph 8. Mobile penetration in Colombia and in Latin America
Source: TMG study 2006 for Colombian Ministry of Communications. The entrance of the new mobile operator in 2003, forced the established cellular companies to change their technological standards from TDMA to GSM (for Comcel) and CDMA (for Bellsouth, now Telefonica). However, new mobile broadband technologies have not been highly implemented and adopted in the country, like GPRS.
Graph 9. Mobile Technologies 2005
Source: TMG study 2006 for Colombian Ministry of Communications.
C O M I S I O N D E R E G U L A C I O N D E T E L E C O M U N I C A C I O N E S - R E P U B L I C A D E C O L O M B I A
ITU WOKSHOP ON “THE FUTURE OF VOICE” Information about the Telecom Sector in Colombia CCN-Mercadeo OG
Fecha actualización: 26/06/06 Página 9 de 27
Revisado por:JPH/CXB
Fecha revisión: 26/06/06
Revisión No. 1 Aprobado por: Director Ejecutivo Fecha de vigencia: 01/02/05
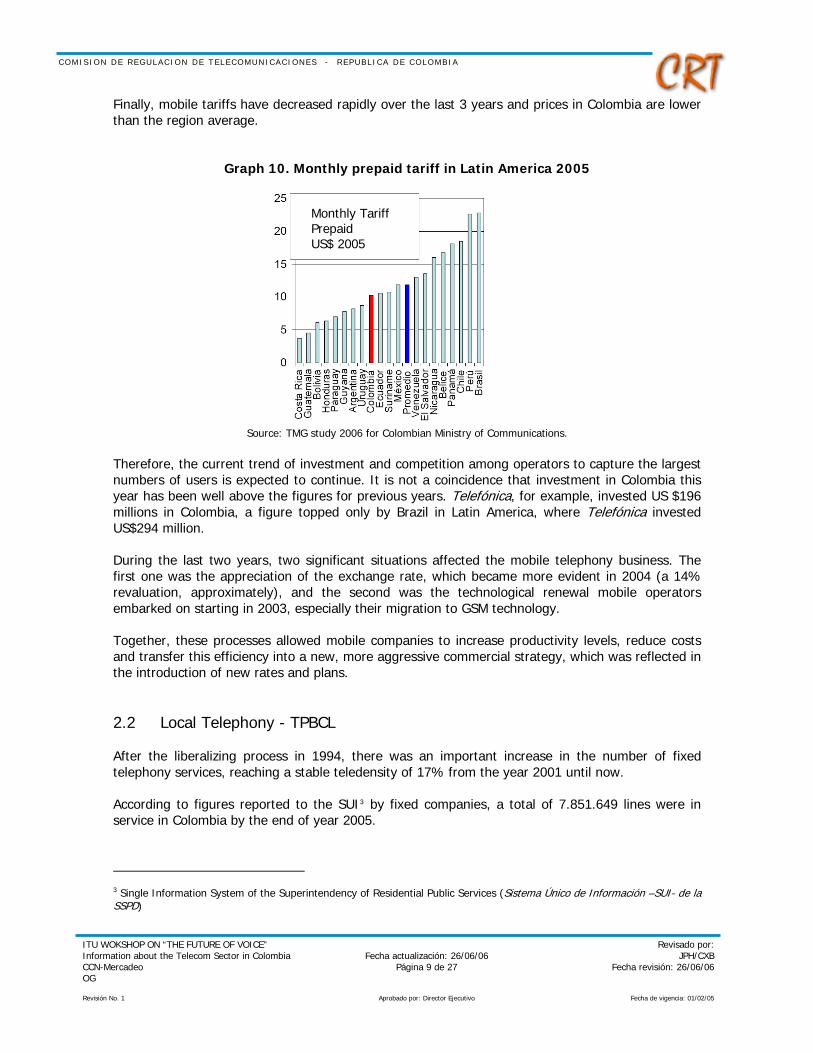
Finally, mobile tariffs have decreased rapidly over the last 3 years and prices in Colombia are lower than the region average.
Graph 10. Monthly prepaid tariff in Latin America 2005
Source: TMG study 2006 for Colombian Ministry of Communications. Therefore, the current trend of investment and competition among operators to capture the largest numbers of users is expected to continue. It is not a coincidence that investment in Colombia this year has been well above the figures for previous years. Telefónica, for example, invested US $196 millions in Colombia, a figure topped only by Brazil in Latin America, where Telefónica invested US$294 million. During the last two years, two significant situations affected the mobile telephony business. The first one was the appreciation of the exchange rate, which became more evident in 2004 (a 14% revaluation, approximately), and the second was the technological renewal mobile operators embarked on starting in 2003, especially their migration to GSM technology. Together, these processes allowed mobile companies to increase productivity levels, reduce costs and transfer this efficiency into a new, more aggressive commercial strategy, which was reflected in the introduction of new rates and plans. 2.2 Local Telephony - TPBCL After the liberalizing process in 1994, there was an important increase in the number of fixed telephony services, reaching a stable teledensity of 17% from the year 2001 until now. According to figures reported to the SUI3 by fixed companies, a total of 7.851.649 lines were in service in Colombia by the end of year 2005.
3 Single Information System of the Superintendency of Residential Public Services (Sistema Único de Información –SUI- de la SSPD)
Monthly TariffPrepaid US$ 2005
Monthly TariffPrepaid US$ 2005

C O M I S I O N D E R E G U L A C I O N D E T E L E C O M U N I C A C I O N E S - R E P U B L I C A D E C O L O M B I A
ITU WOKSHOP ON “THE FUTURE OF VOICE” Information about the Telecom Sector in Colombia CCN-Mercadeo OG
Fecha actualización: 26/06/06 Página 10 de 27
Revisado por:JPH/CXB
Fecha revisión: 26/06/06
Revisión No. 1 Aprobado por: Director Ejecutivo Fecha de vigencia: 01/02/05
Graph 11. Fixed lines and teledensity in Colombia.
Source: CRT, 2006. There are 28 operators with 7.9 million lines offering service in different territories (cities in most cases) and starting to being consolidated in five major groups. The largest fixed operators are: TELECOM, ETB, EPM and EMCALI. Together, they have near 80% of the market share. Most of the fixed-line operators are municipally owned and only few players are totally privatized. Municipally owned companies (such as EPM, ETB and Telecom) are seeking international partners to inject capital. On April 2006, Telefonica acquire 51% of the former incumbent TELECOM with a bid of US$370 million, 60% higher than the minimum price.
Chart 4. Fixed operators in Colombia 2006.
Source: CRT, 2006. Telephone consumption by the users of local fixed networks in the country fell for all socio-economic stratums or income levels4. In stratums 1 and 2, it dropped 6%; 8% in income levels 3 and 4, while in the higher income levels it dropped 12%. Average monthly consumption ranges
4 In Colombia, the provision of public services depends on a 6-income layer household classification based upon the socio-economic level of the inhabitants. The TPBCL tariffs are theoretically designed to allow layers 5 and 6 (corresponding to the richest people) to subsidize layers 1, 2 and 3 (the poorest and middle-class people).
0
1,000
2,000
3,000
4,000
5,000
6,000
7,000
8,000
9,000
1970
1972
1974
1976
1978
1980
1982
1984
1986
1988
1990
1992
1994
1996
1998
2000
2002
2004
2006
1Q
Fixe
d Li
nes
(Th
ousa
nds)
0.0
2.0
4.0
6.0
8.0
10.0
12.0
14.0
16.0
18.0
20.0
Tele
dens
ity
(%)
Fixed lines Teledensity
OPERATOR FIXED LINESMARKET SHARE
TELECOM 2.409.845 30.7%ETB 2.087.654 26.6%EPM 1.220.921 15.5%EMCALI 529.257 6.7%7 Operators 100.000 - 300.000 15.60%17 Operators 100 - 100000 4.90%TOTAL 7.851.649 100%
C O M I S I O N D E R E G U L A C I O N D E T E L E C O M U N I C A C I O N E S - R E P U B L I C A D E C O L O M B I A
ITU WOKSHOP ON “THE FUTURE OF VOICE” Information about the Telecom Sector in Colombia CCN-Mercadeo OG
Fecha actualización: 26/06/06 Página 11 de 27
Revisado por:JPH/CXB
Fecha revisión: 26/06/06
Revisión No. 1 Aprobado por: Director Ejecutivo Fecha de vigencia: 01/02/05
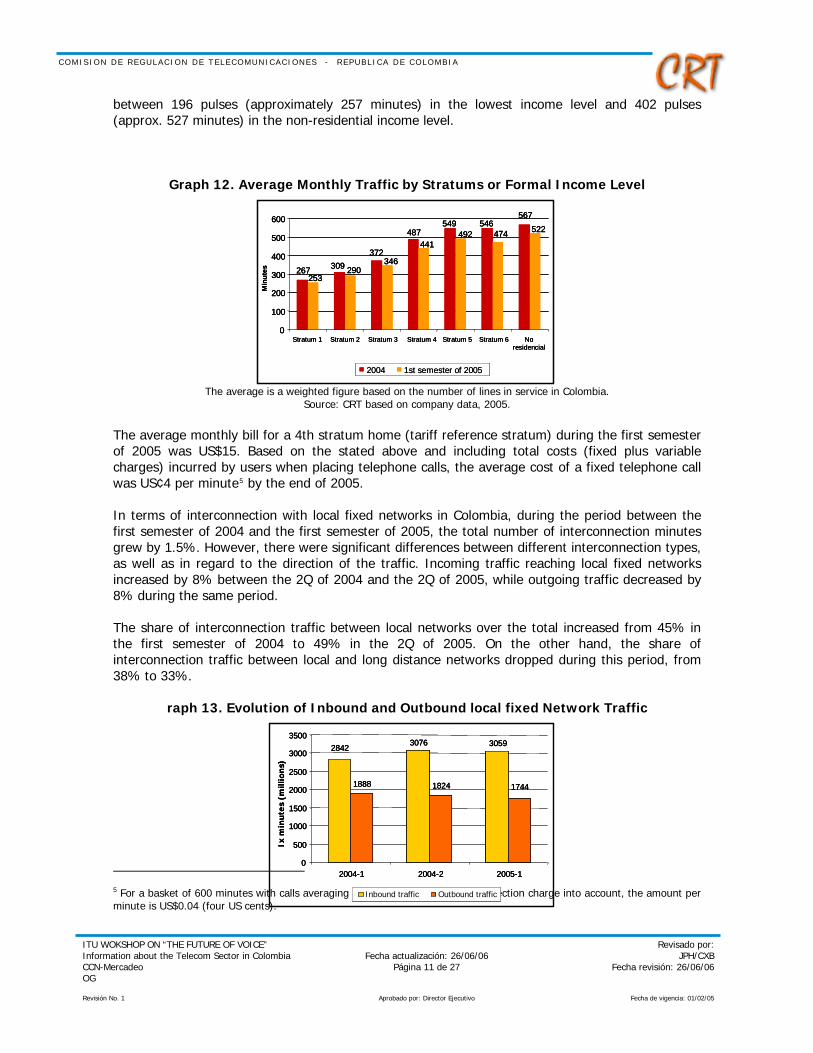
between 196 pulses (approximately 257 minutes) in the lowest income level and 402 pulses (approx. 527 minutes) in the non-residential income level.
Graph 12. Average Monthly Traffic by Stratums or Formal Income Level
The average is a weighted figure based on the number of lines in service in Colombia. Source: CRT based on company data, 2005.
The average monthly bill for a 4th stratum home (tariff reference stratum) during the first semester of 2005 was US$15. Based on the stated above and including total costs (fixed plus variable charges) incurred by users when placing telephone calls, the average cost of a fixed telephone call was US¢4 per minute5 by the end of 2005. In terms of interconnection with local fixed networks in Colombia, during the period between the first semester of 2004 and the first semester of 2005, the total number of interconnection minutes grew by 1.5%. However, there were significant differences between different interconnection types, as well as in regard to the direction of the traffic. Incoming traffic reaching local fixed networks increased by 8% between the 2Q of 2004 and the 2Q of 2005, while outgoing traffic decreased by 8% during the same period. The share of interconnection traffic between local networks over the total increased from 45% in the first semester of 2004 to 49% in the 2Q of 2005. On the other hand, the share of interconnection traffic between local and long distance networks dropped during this period, from 38% to 33%.
raph 13. Evolution of Inbound and Outbound local fixed Network Traffic
5 For a basket of 600 minutes with calls averaging 6 m s and taki c ection charge into account, the amount per minute is US$0.04 (four US cents).
inute ng the onn
3076 30592842
1824 17441888
0
500
1000
1500
2000
2500
3000
3500
2004-1 2004-2 2005-1
Ixm
inu
tes
(mill
ion
s)
I t cnbound raffi O tutbound raffic
3076 30592842
1824 17441888
0
500
1000
1500
2000
2500
3000
3500
2004-1 2004-2 2005-1
Ixm
inu
tes
(mill
ion
s)
3076 30592842
1824 17441888
0
500
1000
1500
2000
2500
3000
3500
2004-1 2004-2 2005-1
Ixm
inu
tes
(mill
ion
s)
I t cnbound raffi O tutbound rafficI t cnbound raffi O tutbound raffic
267 309372
487549 546
567
253290
346
441492 474 522
0
100
200
300
400
500
600
Stratum 1 Noresidencial
Min
utes
2004 1st semester of 2005
Stratum 2 Stratum 3 Stratum 4 Stratum 5 Stratum 6
267 309372
487549 546
567
253290
346
441492 474 522
0
100
200
300
400
500
600
Stratum 1 Noresidencial
Min
utes
2004 1st semester of 2005
Stratum 2 Stratum 3 Stratum 4 Stratum 5 Stratum 6
267 309372
487549 546
567
253290
346
441492 474 522
0
100
200
300
400
500
600
Stratum 1 Noresidencial
Min
utes
20042004 1st semester of 20051st semester of 2005
Stratum 2 Stratum 3 Stratum 4 Stratum 5 Stratum 6
C O M I S I O N D E R E G U L A C I O N D E T E L E C O M U N I C A C I O N E S - R E P U B L I C A D E C O L O M B I A
ITU WOKSHOP ON “THE FUTURE OF VOICE” Information about the Telecom Sector in Colombia CCN-Mercadeo OG
Fecha actualización: 26/06/06 Página 12 de 27
Revisado por:JPH/CXB
Fecha revisión: 26/06/06
Revisión No. 1 Aprobado por: Director Ejecutivo Fecha de vigencia: 01/02/05
Note: traffic generated by 60% of the lines in service in Colombia (4.7 million by the second quarter of 2005).
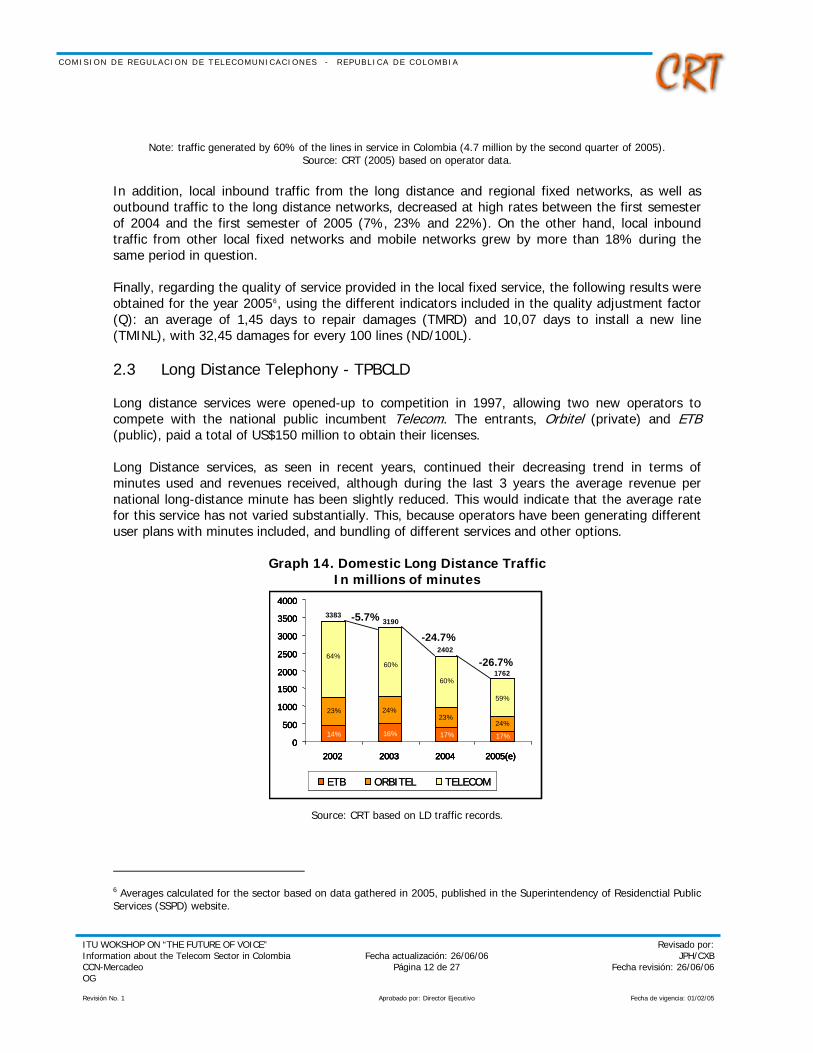
Source: CRT (2005) based on operator data. In addition, local inbound traffic from the long distance and regional fixed networks, as well as outbound traffic to the long distance networks, decreased at high rates between the first semester of 2004 and the first semester of 2005 (7%, 23% and 22%). On the other hand, local inbound traffic from other local fixed networks and mobile networks grew by more than 18% during the same period in question. Finally, regarding the quality of service provided in the local fixed service, the following results were obtained for the year 20056, using the different indicators included in the quality adjustment factor (Q): an average of 1,45 days to repair damages (TMRD) and 10,07 days to install a new line (TMINL), with 32,45 damages for every 100 lines (ND/100L). 2.3 Long Distance Telephony - TPBCLD Long distance services were opened-up to competition in 1997, allowing two new operators to compete with the national public incumbent Telecom. The entrants, Orbitel (private) and ETB (public), paid a total of US$150 million to obtain their licenses. Long Distance services, as seen in recent years, continued their decreasing trend in terms of minutes used and revenues received, although during the last 3 years the average revenue per national long-distance minute has been slightly reduced. This would indicate that the average rate for this service has not varied substantially. This, because operators have been generating different user plans with minutes included, and bundling of different services and other options.
Graph 14. Domestic Long Distance Traffic In millions of minutes
Source: CRT based on LD traffic records.
6 Averages calculated for the sector based on data gathered in 2005, published in the Superintendency of Residenctial Public Services (SSPD) website.
ETB ORBITEL TELECOM
-5.7%
-24.7%
-26.7%
0
500
1000
1500
2000
2500
3000
3500
4000
2002 2003 2004 2005(e)
33833190
2402
1762
64%60%
60%
59%
23% 24%23%
24%14% 16% 17% 17%
ETB ORBITEL TELECOM
-5.7%
-24.7%
-26.7%
0
500
1000
1500
2000
2500
3000
3500
4000
2002 2003 2004 2005(e)
33833190
2402
1762
64%60%
60%
59%
23% 24%23%
24%14% 16% 17% 17%
ETB ORBITEL TELECOMETBETB ORBITELORBITEL TELECOMTELECOM
-5.7%
-24.7%
-26.7%
0
500
1000
1500
2000
2500
3000
3500
4000
2002 2003 2004 2005(e)
33833190
2402
1762
64%60%
60%
59%
23% 24%23%
24%14% 16% 17% 17%
-5.7%
-24.7%
-26.7%
0
500
1000
1500
2000
2500
3000
3500
4000
2002 2003 2004 2005(e)
33833190
2402
1762
64%60%
60%
59%
23% 24%23%
24%14% 16% 17% 17%

C O M I S I O N D E R E G U L A C I O N D E T E L E C O M U N I C A C I O N E S - R E P U B L I C A D E C O L O M B I A
ITU WOKSHOP ON “THE FUTURE OF VOICE” Information about the Telecom Sector in Colombia CCN-Mercadeo OG
Fecha actualización: 26/06/06 Página 13 de 27
Revisado por:JPH/CXB
Fecha revisión: 26/06/06
Revisión No. 1 Aprobado por: Director Ejecutivo Fecha de vigencia: 01/02/05
Nevertheless, Colombian traffic reduction rates must be highlighted in comparison with nations such as Spain or the United States, where traffic has dropped by less than even 10%. In Colombia the traffic reduction rate figure for 2004 was 25%, and for 2005 it is estimated to be close to 27%.
Graph 15. Evolution of Domestic Long Distance Average Income per Minute (COP$)
INGRESOS POR MINUTO DEL MERCADO DE LARGA DISTANCIA NACIONAL
(Pesos Corrientes / minuto)
264 284 274 272258 267301 286
368398
426 421
050
100150200250300350400450
2002 2003 2004 2005
ETB ORBITEL TELECOM
Source: CRT based on LD revenue records. On the other hand, although international long-distance traffic increased during 2004, a reduction occurred during 2005. A variation in the number of minutes consumed in this service market can be observed, according to information provided to the CRT by operators, mainly indicating an increase in the share of Colombia Telecomunicaciones, a reduction in the share of ETB and a constant share for ORBITEL.
Graph 16. International Long Distance
Source: TMG study 2006 for Colombian Ministry of Communications. Nonetheless, revenues obtained from outbound international long-distance traffic increased during 2005, due to the rate increase introduced in this market, in which the offer of special rates has reduced. Colombia Telecomunicaciones continues to hold a dominant position in the market, although competition for international traffic is somewhat stronger than for domestic traffic. 59% of the domestic traffic and 44% of the outbound international traffic is held by Telecom.
Min
utes
(m
illio
ns)
Min
utes
(m
illio
ns)
Inbound
Outbound
Revenues
Min
utes
(m
illio
ns)
Min
utes
(m
illio
ns)
Inbound
Outbound
Revenues
C O M I S I O N D E R E G U L A C I O N D E T E L E C O M U N I C A C I O N E S - R E P U B L I C A D E C O L O M B I A
ITU WOKSHOP ON “THE FUTURE OF VOICE” Information about the Telecom Sector in Colombia CCN-Mercadeo OG
Fecha actualización: 26/06/06 Página 14 de 27
Revisado por:JPH/CXB
Fecha revisión: 26/06/06
Revisión No. 1 Aprobado por: Director Ejecutivo Fecha de vigencia: 01/02/05
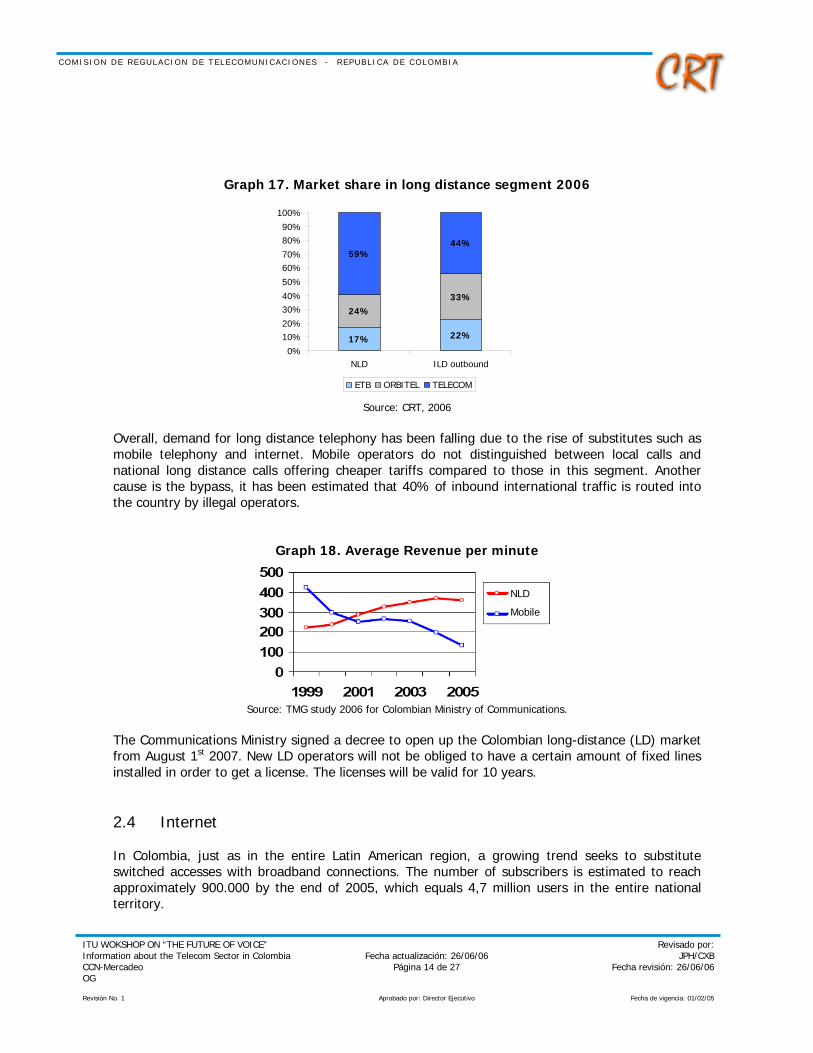
Graph 17. Market share in long distance segment 2006
Source: CRT, 2006 Overall, demand for long distance telephony has been falling due to the rise of substitutes such as mobile telephony and internet. Mobile operators do not distinguished between local calls and national long distance calls offering cheaper tariffs compared to those in this segment. Another cause is the bypass, it has been estimated that 40% of inbound international traffic is routed into the country by illegal operators.
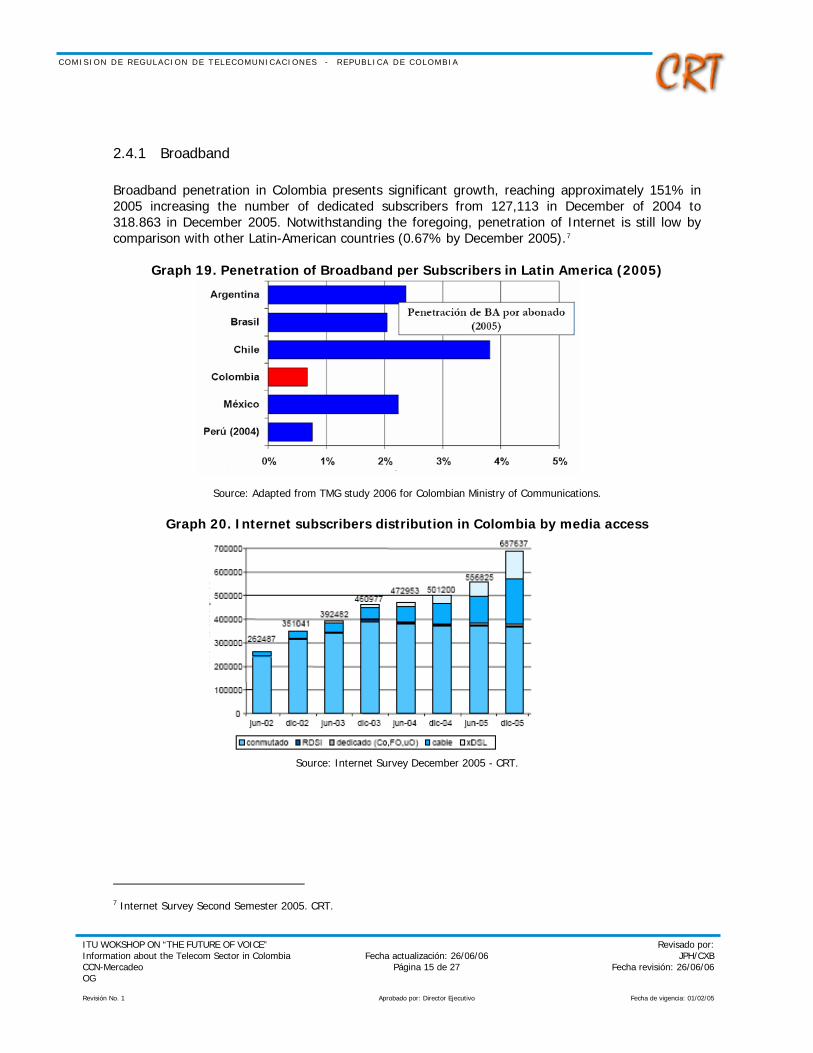
Graph 18. Average Revenue per minute
Source: TMG study 2006 for Colombian Ministry of Communications. The Communications Ministry signed a decree to open up the Colombian long-distance (LD) market from August 1st 2007. New LD operators will not be obliged to have a certain amount of fixed lines installed in order to get a license. The licenses will be valid for 10 years. 2.4 Internet In Colombia, just as in the entire Latin American region, a growing trend seeks to substitute switched accesses with broadband connections. The number of subscribers is estimated to reach approximately 900.000 by the end of 2005, which equals 4,7 million users in the entire national territory.
NLD
Mobile
NLD
Mobile
17% 22%
24%33%
59%44%
0%
10%20%
30%40%
50%
60%70%
80%90%
100%
NLD ILD outbound
ETB ORBITEL TELECOM
C O M I S I O N D E R E G U L A C I O N D E T E L E C O M U N I C A C I O N E S - R E P U B L I C A D E C O L O M B I A
ITU WOKSHOP ON “THE FUTURE OF VOICE” Information about the Telecom Sector in Colombia CCN-Mercadeo OG
Fecha actualización: 26/06/06 Página 15 de 27
Revisado por:JPH/CXB
Fecha revisión: 26/06/06
Revisión No. 1 Aprobado por: Director Ejecutivo Fecha de vigencia: 01/02/05
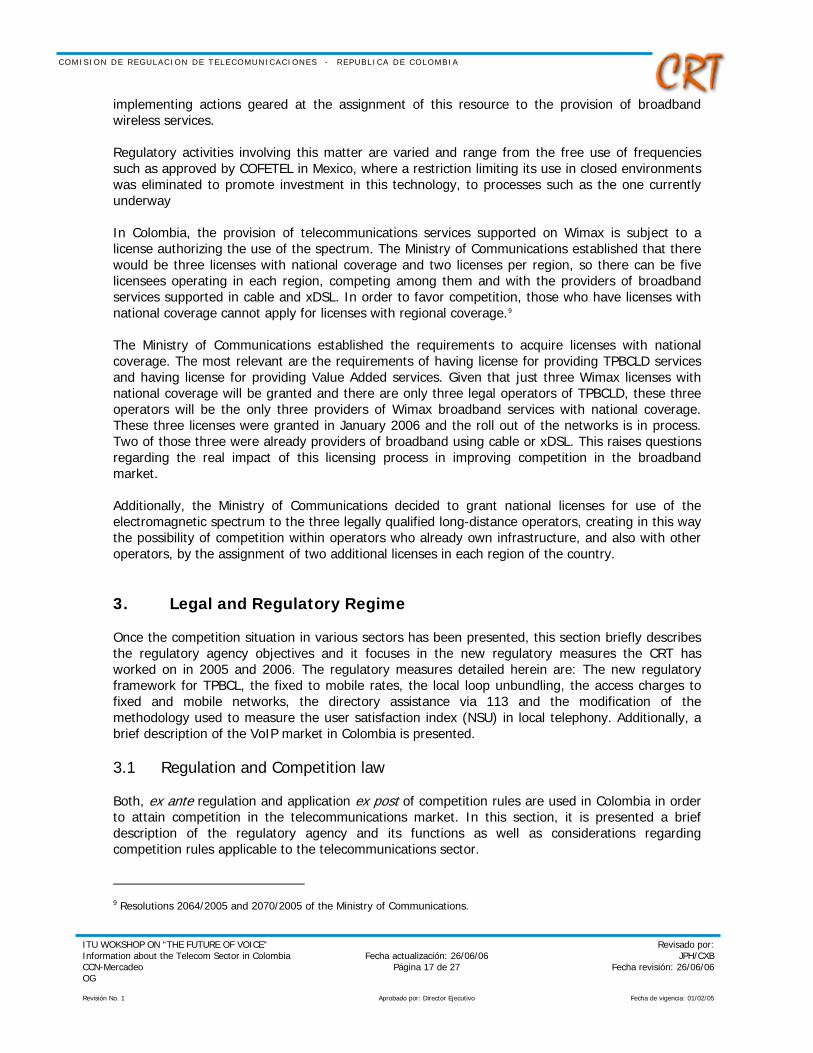
2.4.1 Broadband Broadband penetration in Colombia presents significant growth, reaching approximately 151% in 2005 increasing the number of dedicated subscribers from 127,113 in December of 2004 to 318.863 in December 2005. Notwithstanding the foregoing, penetration of Internet is still low by comparison with other Latin-American countries (0.67% by December 2005).7
Graph 19. Penetration of Broadband per Subscribers in Latin America (2005)
Source: Adapted from TMG study 2006 for Colombian Ministry of Communications.
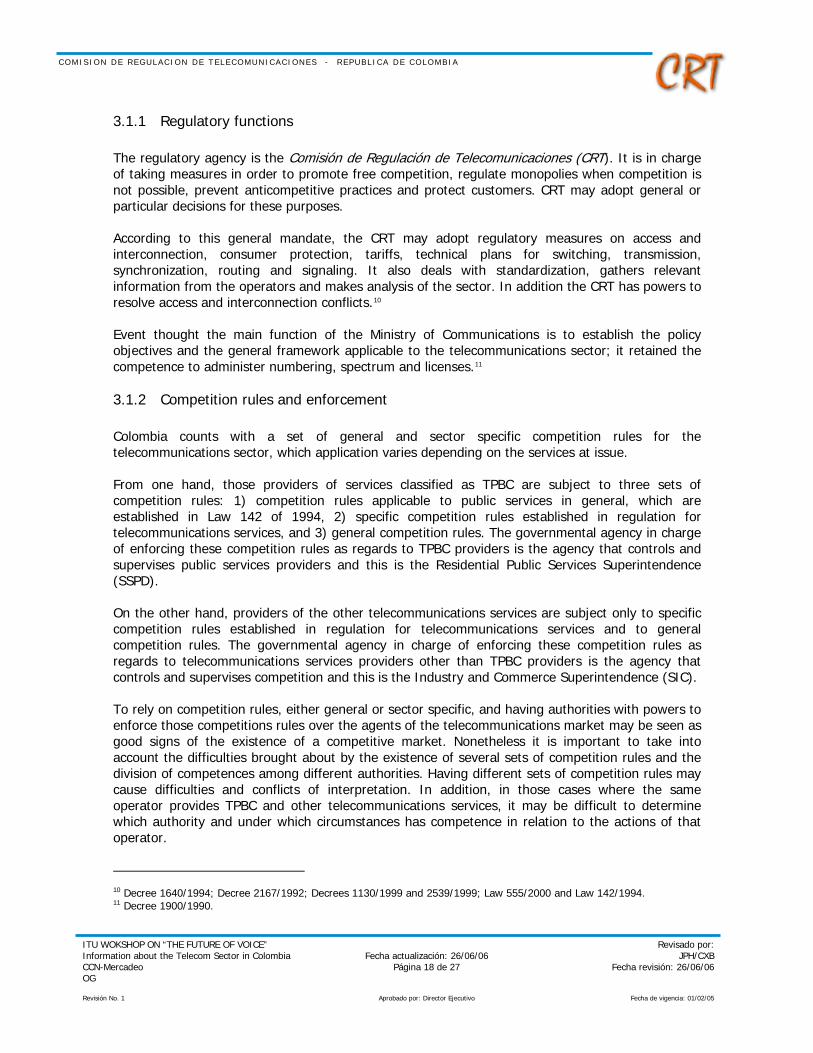
Graph 20. Internet subscribers distribution in Colombia by media access
Source: Internet Survey December 2005 - CRT.
7 Internet Survey Second Semester 2005. CRT.

C O M I S I O N D E R E G U L A C I O N D E T E L E C O M U N I C A C I O N E S - R E P U B L I C A D E C O L O M B I A
ITU WOKSHOP ON “THE FUTURE OF VOICE” Information about the Telecom Sector in Colombia CCN-Mercadeo OG
Fecha actualización: 26/06/06 Página 16 de 27
Revisado por:JPH/CXB
Fecha revisión: 26/06/06
Revisión No. 1 Aprobado por: Director Ejecutivo Fecha de vigencia: 01/02/05
Graph 21. Evolution of Internet Subscribers in Colombia by Technology
*Conmutado: Dial-up
Source: Internet Survey Second Semester 2005 - CRT. According to the previous graphs, cable is still the most widely used technology in the country, but this trend has been changing with the mass use of xDSL, which grew 93% from June 2005 to December 2005. If this trend continues, a balanced distribution of subscribers among these two technologies can be expected by the end of 2006.
2.4.2 Wireless Technologies Wireless technologies (WiFi and Wimax) are seen as tools to reach more penetration of the broadband services. The use of these technologies has generated business opportunities. In the cities of Bogotá and Bucaramanga, some companies provide broadband access using wireless media, in direct competition with traditional broadband operators and with those who provide solutions for the corporate sector. In Colombia WiFi can be provided freely and it is offered mostly to private entities. Recently a Pre-Wimax Metropolitan Area Network was deployed in the fifth major city of the country (Bucaramanga); the impact of this in the broadband penetration of is to be seen. As regards to Wimax, although its application standards have not been fully tested, WiMax technology access could represent an important source of income in Latin America for both operators currently offering broadband access through other technologies, and for new players interested in participating in this business. New initiatives for the installation of networks using this technology in different countries in the region8 have been developing recently, mainly with the goal of taking broadband to isolated regions. To this effect, regulatory bodies and electromagnetic spectrum administrators have been
8 Highlighting the initiatives developed by Ertach (Millicom) en Argentina, Intel – Prodam in Brazil and Americatel in Peru, among others.
C O M I S I O N D E R E G U L A C I O N D E T E L E C O M U N I C A C I O N E S - R E P U B L I C A D E C O L O M B I A
ITU WOKSHOP ON “THE FUTURE OF VOICE” Information about the Telecom Sector in Colombia CCN-Mercadeo OG
Fecha actualización: 26/06/06 Página 17 de 27
Revisado por:JPH/CXB
Fecha revisión: 26/06/06
Revisión No. 1 Aprobado por: Director Ejecutivo Fecha de vigencia: 01/02/05
implementing actions geared at the assignment of this resource to the provision of broadband wireless services. Regulatory activities involving this matter are varied and range from the free use of frequencies such as approved by COFETEL in Mexico, where a restriction limiting its use in closed environments was eliminated to promote investment in this technology, to processes such as the one currently underway In Colombia, the provision of telecommunications services supported on Wimax is subject to a license authorizing the use of the spectrum. The Ministry of Communications established that there would be three licenses with national coverage and two licenses per region, so there can be five licensees operating in each region, competing among them and with the providers of broadband services supported in cable and xDSL. In order to favor competition, those who have licenses with national coverage cannot apply for licenses with regional coverage.9 The Ministry of Communications established the requirements to acquire licenses with national coverage. The most relevant are the requirements of having license for providing TPBCLD services and having license for providing Value Added services. Given that just three Wimax licenses with national coverage will be granted and there are only three legal operators of TPBCLD, these three operators will be the only three providers of Wimax broadband services with national coverage. These three licenses were granted in January 2006 and the roll out of the networks is in process. Two of those three were already providers of broadband using cable or xDSL. This raises questions regarding the real impact of this licensing process in improving competition in the broadband market. Additionally, the Ministry of Communications decided to grant national licenses for use of the electromagnetic spectrum to the three legally qualified long-distance operators, creating in this way the possibility of competition within operators who already own infrastructure, and also with other operators, by the assignment of two additional licenses in each region of the country. 3. Legal and Regulatory Regime Once the competition situation in various sectors has been presented, this section briefly describes the regulatory agency objectives and it focuses in the new regulatory measures the CRT has worked on in 2005 and 2006. The regulatory measures detailed herein are: The new regulatory framework for TPBCL, the fixed to mobile rates, the local loop unbundling, the access charges to fixed and mobile networks, the directory assistance via 113 and the modification of the methodology used to measure the user satisfaction index (NSU) in local telephony. Additionally, a brief description of the VoIP market in Colombia is presented. 3.1 Regulation and Competition law Both, ex ante regulation and application ex post of competition rules are used in Colombia in order to attain competition in the telecommunications market. In this section, it is presented a brief description of the regulatory agency and its functions as well as considerations regarding competition rules applicable to the telecommunications sector.
9 Resolutions 2064/2005 and 2070/2005 of the Ministry of Communications.
C O M I S I O N D E R E G U L A C I O N D E T E L E C O M U N I C A C I O N E S - R E P U B L I C A D E C O L O M B I A
ITU WOKSHOP ON “THE FUTURE OF VOICE” Information about the Telecom Sector in Colombia CCN-Mercadeo OG
Fecha actualización: 26/06/06 Página 18 de 27
Revisado por:JPH/CXB
Fecha revisión: 26/06/06
Revisión No. 1 Aprobado por: Director Ejecutivo Fecha de vigencia: 01/02/05
3.1.1 Regulatory functions The regulatory agency is the Comisión de Regulación de Telecomunicaciones (CRT). It is in charge of taking measures in order to promote free competition, regulate monopolies when competition is not possible, prevent anticompetitive practices and protect customers. CRT may adopt general or particular decisions for these purposes. According to this general mandate, the CRT may adopt regulatory measures on access and interconnection, consumer protection, tariffs, technical plans for switching, transmission, synchronization, routing and signaling. It also deals with standardization, gathers relevant information from the operators and makes analysis of the sector. In addition the CRT has powers to resolve access and interconnection conflicts.10 Event thought the main function of the Ministry of Communications is to establish the policy objectives and the general framework applicable to the telecommunications sector; it retained the competence to administer numbering, spectrum and licenses.11
3.1.2 Competition rules and enforcement Colombia counts with a set of general and sector specific competition rules for the telecommunications sector, which application varies depending on the services at issue. From one hand, those providers of services classified as TPBC are subject to three sets of competition rules: 1) competition rules applicable to public services in general, which are established in Law 142 of 1994, 2) specific competition rules established in regulation for telecommunications services, and 3) general competition rules. The governmental agency in charge of enforcing these competition rules as regards to TPBC providers is the agency that controls and supervises public services providers and this is the Residential Public Services Superintendence (SSPD). On the other hand, providers of the other telecommunications services are subject only to specific competition rules established in regulation for telecommunications services and to general competition rules. The governmental agency in charge of enforcing these competition rules as regards to telecommunications services providers other than TPBC providers is the agency that controls and supervises competition and this is the Industry and Commerce Superintendence (SIC). To rely on competition rules, either general or sector specific, and having authorities with powers to enforce those competitions rules over the agents of the telecommunications market may be seen as good signs of the existence of a competitive market. Nonetheless it is important to take into account the difficulties brought about by the existence of several sets of competition rules and the division of competences among different authorities. Having different sets of competition rules may cause difficulties and conflicts of interpretation. In addition, in those cases where the same operator provides TPBC and other telecommunications services, it may be difficult to determine which authority and under which circumstances has competence in relation to the actions of that operator.
10 Decree 1640/1994; Decree 2167/1992; Decrees 1130/1999 and 2539/1999; Law 555/2000 and Law 142/1994. 11 Decree 1900/1990.
C O M I S I O N D E R E G U L A C I O N D E T E L E C O M U N I C A C I O N E S - R E P U B L I C A D E C O L O M B I A
ITU WOKSHOP ON “THE FUTURE OF VOICE” Information about the Telecom Sector in Colombia CCN-Mercadeo OG
Fecha actualización: 26/06/06 Página 19 de 27
Revisado por:JPH/CXB
Fecha revisión: 26/06/06
Revisión No. 1 Aprobado por: Director Ejecutivo Fecha de vigencia: 01/02/05
3.2 Measures oriented to improve competition and liberalization
3.2.1 New Regulatory Framework for local fixed telephony In June of 2005 the CRT adopted Resolution 1250, which modified the tariff framework for local fixed telephony. After it was issued, a positive market response can already be seen in the market. This would indicate that the sector is on the right track towards rate freedom, as is foreseen in that same resolution. The new tariff framework includes three components. The first one consists of shifting from methodologies that exercise direct control over rates to methodologies that regulate based on behavior rules, which assume a certain degree of competitive maturity in markets. The second component seeks to improve the competitiveness of companies and wellbeing of users by mandating minutes-based billing. The third component pursues evolution towards an incentives-based rate regulation by shifting from regulation based on income caps to a price-cap based regulation. Regarding the first component, the balance is very positive. In 10 of the largest cities in the country, which represent more than 70% of all existing lines, payment options with no fixed charges are now available for low income stratums, and at least five other different rate plan options for every customer. The operators in three cities have offered unlimited consumption plans, and this option is expected to reach two additional cities in the coming year. These offers have made future average billing reductions possible, estimated at between 9% and 33%, something unattainable with the last framework. In addition, 87% of all existing lines are expected to benefit from lower bills, once users select the rate option that best suits their consumption pattern. Even in cities such as Bogotá, Medellín, and Manizales it is expected that more than 95% of existing lines will see rate reductions. The balance is also positive for the second component, since the CRT agreed with all operators on the initiation of a new billing system based on minutes by January of 2006. This requirement led several operators to reconsider their investment plans and to introduce corrections regarding certain suppliers who sought to take advantage of the situation. This has been accomplished thanks to the work done in coordination with the SSPD in terms of implementing this measure. Finally, the CRT continues working on the third component, since most municipalities operating under the price-cap methodology are serviced by regional networks, and final cap amounts have not yet been determined for them. Nevertheless, the CRT has indicated there will be no price hikes in those municipalities if price caps have not been defined. The goal is to determine price caps during the first quarter of 2006.
3.2.2 Fixed to Mobile Rates
CRT Resolution 1296, enacted on September 13, 2005, set a cap (of COP $392 / US¢17) on fixed to mobile call rates. In addition, on October 31, 2005 the CRT extended the deadline set for operators to comply with an initial reduction set at COP $464 (US¢20).
C O M I S I O N D E R E G U L A C I O N D E T E L E C O M U N I C A C I O N E S - R E P U B L I C A D E C O L O M B I A
ITU WOKSHOP ON “THE FUTURE OF VOICE” Information about the Telecom Sector in Colombia CCN-Mercadeo OG
Fecha actualización: 26/06/06 Página 20 de 27
Revisado por:JPH/CXB
Fecha revisión: 26/06/06
Revisión No. 1 Aprobado por: Director Ejecutivo Fecha de vigencia: 01/02/05
Two aspects are noteworthy regarding these reductions: the savings of over US$6 million made available to Colombians making these calls, and the 38% reduction obtained just two months after the measure was issued. This demonstrates that the proposed 57% reduction as defined by the CRT is feasible. However, the national mobile industry must continue improving its service offerings to its users, as should be the case in a competitive market system. That means it should focus on costs, since currently only the PCS operator charges a lower rate than the ceiling set by the CRT and offers preferential rate plans to users who do not own mobile devices. In addition, it is expected that demand will respond in the short term, triggered by these reductions, so this market may be reactivated. The CRT will closely monitor the behavior of this market in the coming months.
3.2.3 Local Loop Unbundling Studies carried out by both the CRT and the Ministry of Communications have identified the need to adopt regulatory measures and policies that may allow Colombia to further develop broadband access. In 2004 and 2005 several documents were published in Colombia that portrayed the current status of broadband in the country, and they found that Colombia lags behind not only developed nations but also other nations in the region. This calls for measures that may promote competition in this market, so that the country may finally develop according to the level reached by similar nations in Latin America. Observing the situation in the principal nations of the region, Chile stands out with a penetration rate of 2.8 subscribers per 100 inhabitants, while nations such as Argentina, Brazil, Peru, Venezuela and Mexico have rates between 1.5% and 0.8%, which are closer to the regional average of 1 subscriber per 100 inhabitants. However, when the situation of Latin American nations is compared with that of other nations where these technologies have developed further, the effects produced by the implementation of effective policies on this matter can be observed. Such is the case of some Asia Pacific and European nations such as South Korea, Japan, Australia, Holland, Denmark, Finland, France, the United Kingdom and Spain, in which the number of broadband subscribers is greater than 10%, and in many cases greater than 20 and even 25%. In those nations, the implementation of regulatory measures has been subject to a variety of modifications, and in some cases, to a review of certain specific regulatory issues. These have arisen from the experience of these nations but are also based on clear policies targeting broadband development, which have set specific goals for the forthcoming years. One of the main reasons behind the current status of this market is the implementation of measures geared at unbundling the subscriber loop in incumbent operators, in that this promotes competition, helps incumbents see this market as a way to diversify their offer and find an alternate source of income, and subsequently promote investment in new infrastructure to service demand for these services by new users.
C O M I S I O N D E R E G U L A C I O N D E T E L E C O M U N I C A C I O N E S - R E P U B L I C A D E C O L O M B I A
ITU WOKSHOP ON “THE FUTURE OF VOICE” Information about the Telecom Sector in Colombia CCN-Mercadeo OG
Fecha actualización: 26/06/06 Página 21 de 27
Revisado por:JPH/CXB
Fecha revisión: 26/06/06
Revisión No. 1 Aprobado por: Director Ejecutivo Fecha de vigencia: 01/02/05
In the case of Colombia, although there is no major penetration of cable networks, the scarce development of xDSL technology is still insufficient to overcome the above, and for this reason the behavior currently observed in the country is different from that found in other nations in the region with a somewhat similar development pattern. Nevertheless, as it has been seen in Colombia as well as in the United States and Canada, the participation of xDSL technologies in the market is growing rapidly. The CRT has been working along these lines, designing new regulatory measures in order to promote faster development of the services, and plans to submit a proposal to the sector to this effect in the forthcoming months.
3.2.4 Access Charges to Fixed and Mobile Networks The CRT is currently undertaking a comprehensive review of access charges to fixed and mobile networks in Colombia, with the goal of defining a new regulatory framework for this matter. Concerning access charges to fixed networks, on November 9, 2005, the Commission published in its website the regulatory document titled "Comprehensive Review of Access Charges to Fixed Networks in Colombia" [“Revisión integral de los cargos de acceso a redes fijas en Colombia”], which presents a methodological proposal for the design of a new access charge plan for fixed networks for both the short and medium term, in light of the regulatory principles and objectives set forth by the Commission. This regulatory document seeks to obtain several fundamental goals related to interconnection prices, the access charge scheme in Colombia, technical network costing tools used in Colombia for local fixed networks, and the methodologies contained in the document titled "Consulting on the Implementation of an Interconnection Module for the Fixed Network Cost Model – MCRF v.20” [“Consultoría para la implementación del módulo de interconexión para el Modelo de Costos de Redes Fijas – MCRF v2.0”], which focuses on the determination of exclusive interconnection-related costs, and also the cost distribution between local and interconnection services. In order to promote the effective participation of different interested sector agents, commentaries on the regulatory document in question were accepted until December 9, 2005. These commentaries have been taken into account in the preparation of the forthcoming regulatory proposal. In terms of access charges to mobile networks, October 4, 2005 was the deadline for submission of proposals seeking participation in the consulting work for the design of access charges to mobile networks. After evaluating technical and financial proposals, the highest rating was obtained by the Center for Mathematical Modeling of the University of Chile. The consultation began in May of 2006. The results obtained by the consultants contracted under this project, together with the cost model for regional fixed networks, which should be consistent with the new tariff framework for local networks, are all fundamental inputs in the definition of the new regulatory framework for access charges in Colombia.
3.2.5 Directory Assistance via the 113 Seeking comments from the sector and users, the CRT published a regulatory project whereby users obtaining directory information via an operator would be able to select the service provider.

C O M I S I O N D E R E G U L A C I O N D E T E L E C O M U N I C A C I O N E S - R E P U B L I C A D E C O L O M B I A
This would be accomplished by dialing a four-digit number (currently the number 113 is in use), to be assigned to telecommunications or information service providers. In this way, users would be able to directly select a provider to obtain access to operator-provided directory assistance services. The deadline for commentaries expired last November 8, 2005, and the CRT is currently studying the sector and user comments received regarding this regulatory initiative, and plans to adopt the required modifications so as to comply with the objectives of improving the service offering, for the benefit of providers as well as users. The CRT has found that crucial aspects in this process are the scope and depth of the impact that this measure may produce on the mobile industry, the requirements companies must meet to provide the service, and the minimum conditions required for a healthy competition, such as billing costs, the cost of using networks and databases and the resolution of potential conflict between companies.
3.2.6 Modification of the Methodology Used to Measure the user satisfaction index (NSU) in Local Telephony
In recent years the CRT has continuously monitored and studied telecommunications service quality, and has developed a host of quality measurement mechanisms to this effect, for local, long-distance and mobile telephony services. These mechanisms not only provide the regulator complete information on the current management status and quality of the services provided. They are also a tool that protects users and helps provide different markets with indicators regarding the quality offered by current service providers. Giving the dynamic nature of the telecommunications sector, the CRT deemed it advisable to asses and supplements the current measurement methodology used for the NSU indicator in local services based on the needs of the sector and of the users. Preparation of the first draft resolution began during the first quarter of 2005. The draft resolution was presented for commentaries by operators and all interested parties during the month of March 2005. Following the commentaries stage, additional adjustments were made in the methodology and consultant final reports were received in early June. Consultant proposals were worth in review and the draft resolution as well as the measurement instruments was adjusted according to the guidelines set forth by the Commissioners and other members of the Commission Session. The Minister of Communications signed the final resolution on November 30, 2005. This resolution regulates the new measurement methodology used for the NSU indicator in local fixed services, and is due to take effect on January 1, 2006. As a way of conclusion, the principal changes found in this new methodology are described in what follows: a. the questions contained in the residential survey form were revised, adjusted and in some cases, reformulated; b. the method used to determine the number of surveys to be done was revised; the table containing service line number ranges disappeared and this sampling methodology was replaced by one that establishes reliability parameters that operators and market research agencies must ensure; c. a special form was created for corporate users; d. Operators can measure the NSU at any time of the year and distribute the number of planned surveys between one or several months ranging from January to October of the respective year; e. it will be possible to differentiate between a local NSU and regional NSU in the same sample, in the case of operators that provide the latter service; and lastly, f. responses such as “Does not know," "No opinion," "Does not respond" or "Does not apply" are not taken into account in calculating the NSU. This
ITU WOKSHOP ON “THE FUTURE OF VOICE” Information about the Telecom Sector in Colombia CCN-Mercadeo OG
Fecha actualización: 26/06/06 Página 22 de 27
Revisado por:JPH/CXB
Fecha revisión: 26/06/06
Revisión No. 1 Aprobado por: Director Ejecutivo Fecha de vigencia: 01/02/05
C O M I S I O N D E R E G U L A C I O N D E T E L E C O M U N I C A C I O N E S - R E P U B L I C A D E C O L O M B I A
ITU WOKSHOP ON “THE FUTURE OF VOICE” Information about the Telecom Sector in Colombia CCN-Mercadeo OG
Fecha actualización: 26/06/06 Página 23 de 27
Revisado por:JPH/CXB
Fecha revisión: 26/06/06
Revisión No. 1 Aprobado por: Director Ejecutivo Fecha de vigencia: 01/02/05
eliminates a bias generated previously when these cases were included with those of respondents who did answer the respective questions.
3.2.7 VoIP It should be remembered that VoIP is used in Colombia by different telecommunications operators, such as qualified companies that provide long distance services (Telecom, ETB and Orbitel) and some value added operators, to provide corporate voice services, according to the definitions set forth to this effect by the Ministry of Communications in Decrees 600 and 3055 of 2003 on value added and telematic services. In regard to the above decrees, it should be noted that the transport of corporate traffic over the data networks of value added operators is allowed, as long as not used exclusively for voice communications to or from the basic public switched telephone network, nor among closed user groups, given that if those conditions are not complied with, this could represent a transgression of the regime that governs telecommunications as well as competition. The year 2005 has been very dynamic in this segment, since international call services were introduced during the first quarter of this year through the ETB-Net2Phone alliance for broadband Internet access customers; and by the end of the year, Orbitel launched an offering to local users called “Voipiar.” These offers will consolidate the growth of domestic VoIP traffic, and the effects of this may be observed in 2006 in relation to conventional telephony. 4. Universal Service Finally and having presented the current situation in the telecom sector, the competition situation in various segments and the legal and regulatory regimes, it is important to described the policy on universal service in Colombia. The Ministry of Communications of Colombia has adopted a policy based on the provision of telephony and Internet on a community basis in order to reduce the digital divide and facilitate access to the information society to most of the people. Governmental initiatives are funded with resources of the “Communications Fund” which objectives are funding programs and projects designed to facilitate access to telecommunication services and promote information technologies. Fund resources are made up of obligatory contributions and payments done by operators either for acquisition of licenses, authorizations and concessions or for revenues.
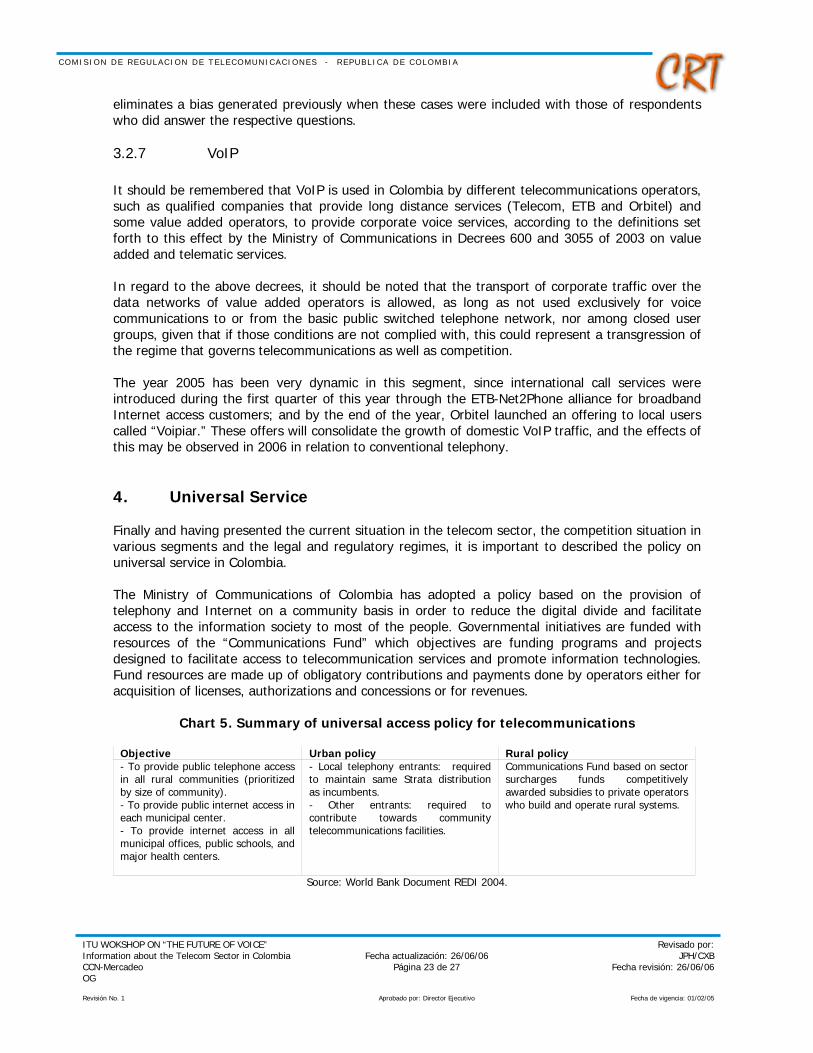
Chart 5. Summary of universal access policy for telecommunications
Objective Urban policy Rural policy - To provide public telephone access in all rural communities (prioritized by size of community). - To provide public internet access in each municipal center. - To provide internet access in all municipal offices, public schools, and major health centers.
- Local telephony entrants: required to maintain same Strata distribution as incumbents. - Other entrants: required to contribute towards community telecommunications facilities.
Communications Fund based on sector surcharges funds competitively awarded subsidies to private operators who build and operate rural systems.
Source: World Bank Document REDI 2004.
C O M I S I O N D E R E G U L A C I O N D E T E L E C O M U N I C A C I O N E S - R E P U B L I C A D E C O L O M B I A
ITU WOKSHOP ON “THE FUTURE OF VOICE” Information about the Telecom Sector in Colombia CCN-Mercadeo OG
Fecha actualización: 26/06/06 Página 24 de 27
Revisado por:JPH/CXB
Fecha revisión: 26/06/06
Revisión No. 1 Aprobado por: Director Ejecutivo Fecha de vigencia: 01/02/05
The most representative governmental programs financed by Communications Fund are: Compartel, Community, Computers for Education and Connectivity Agenda.
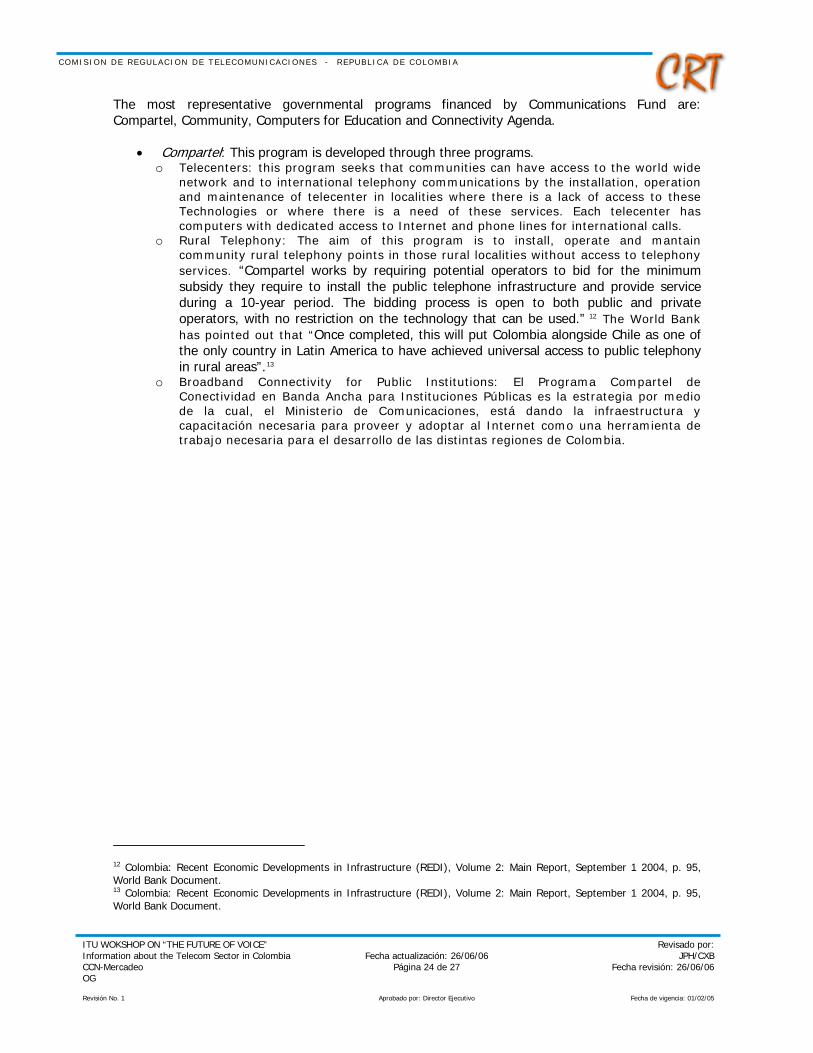
• Compartel: This program is developed through three programs. o Telecenters: this program seeks that communities can have access to the world wide
network and to international telephony communications by the installation, operation and maintenance of telecenter in localities where there is a lack of access to these Technologies or where there is a need of these services. Each telecenter has computers with dedicated access to Internet and phone lines for international calls.
o Rural Telephony: The aim of this program is to install, operate and mantain community rural telephony points in those rural localities without access to telephony services. “Compartel works by requiring potential operators to bid for the minimum subsidy they require to install the public telephone infrastructure and provide service during a 10-year period. The bidding process is open to both public and private operators, with no restriction on the technology that can be used.” 12 The World Bank has pointed out that “Once completed, this will put Colombia alongside Chile as one of the only country in Latin America to have achieved universal access to public telephony in rural areas”.13
o Broadband Connectivity for Public Institutions: El Programa Compartel de Conectividad en Banda Ancha para Instituciones Públicas es la estrategia por medio de la cual, el Ministerio de Comunicaciones, está dando la infraestructura y capacitación necesaria para proveer y adoptar al Internet como una herramienta de trabajo necesaria para el desarrollo de las distintas regiones de Colombia.
12 Colombia: Recent Economic Developments in Infrastructure (REDI), Volume 2: Main Report, September 1 2004, p. 95, World Bank Document. 13 Colombia: Recent Economic Developments in Infrastructure (REDI), Volume 2: Main Report, September 1 2004, p. 95, World Bank Document.
C O M I S I O N D E R E G U L A C I O N D E T E L E C O M U N I C A C I O N E S - R E P U B L I C A D E C O L O M B I A
ITU WOKSHOP ON “THE FUTURE OF VOICE” Information about the Telecom Sector in Colombia CCN-Mercadeo OG
Fecha actualización: 26/06/06 Página 25 de 27
Revisado por:JPH/CXB
Fecha revisión: 26/06/06
Revisión No. 1 Aprobado por: Director Ejecutivo Fecha de vigencia: 01/02/05
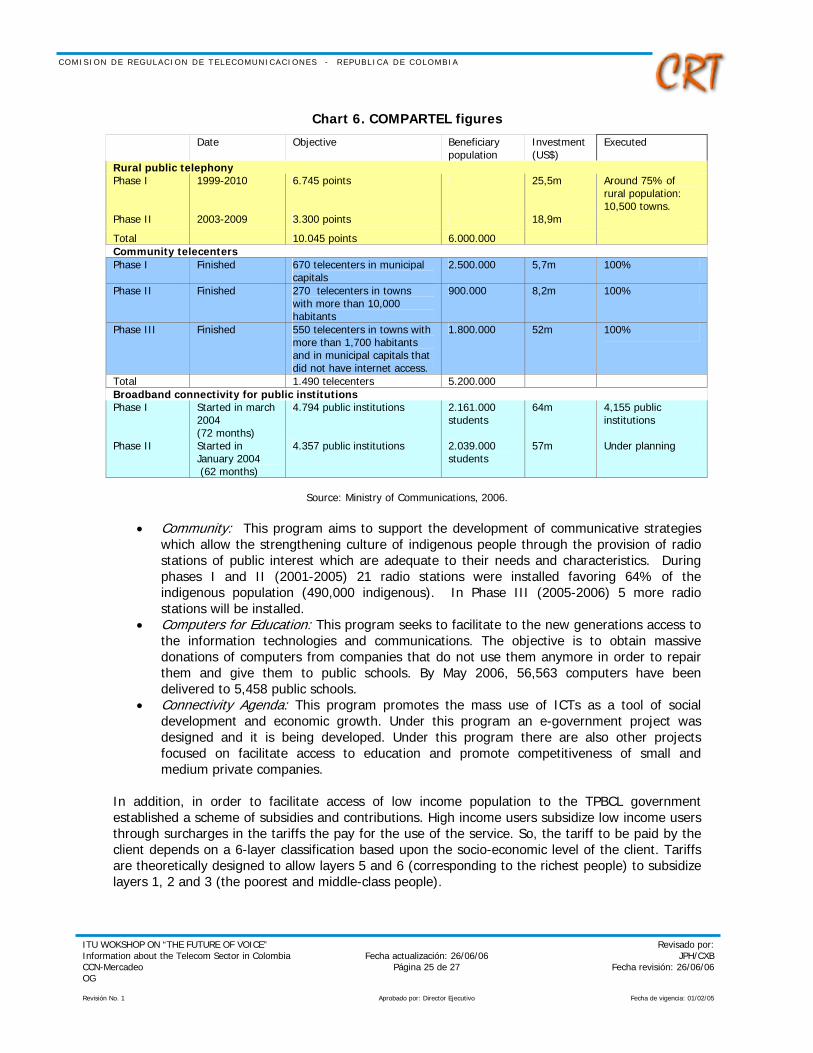
Chart 6. COMPARTEL figures
Source: Ministry of Communications, 2006.
• Community: This program aims to support the development of communicative strategies
which allow the strengthening culture of indigenous people through the provision of radio stations of public interest which are adequate to their needs and characteristics. During phases I and II (2001-2005) 21 radio stations were installed favoring 64% of the indigenous population (490,000 indigenous). In Phase III (2005-2006) 5 more radio stations will be installed.
• Computers for Education: This program seeks to facilitate to the new generations access to the information technologies and communications. The objective is to obtain massive donations of computers from companies that do not use them anymore in order to repair them and give them to public schools. By May 2006, 56,563 computers have been delivered to 5,458 public schools.
• Connectivity Agenda: This program promotes the mass use of ICTs as a tool of social development and economic growth. Under this program an e-government project was designed and it is being developed. Under this program there are also other projects focused on facilitate access to education and promote competitiveness of small and medium private companies.
In addition, in order to facilitate access of low income population to the TPBCL government established a scheme of subsidies and contributions. High income users subsidize low income users through surcharges in the tariffs the pay for the use of the service. So, the tariff to be paid by the client depends on a 6-layer classification based upon the socio-economic level of the client. Tariffs are theoretically designed to allow layers 5 and 6 (corresponding to the richest people) to subsidize layers 1, 2 and 3 (the poorest and middle-class people).
Date Objective Beneficiary population
Investment (US$)
Executed
Rural public telephony Phase I 1999-2010 6.745 points 25,5m Around 75% of
rural population: 10,500 towns.
Phase II 2003-2009 3.300 points 18,9m
Total 10.045 points 6.000.000 Community telecenters Phase I Finished 670 telecenters in municipal
capitals 2.500.000 5,7m 100%
Phase II Finished 270 telecenters in towns with more than 10,000 habitants
900.000 8,2m 100%
Phase III Finished 550 telecenters in towns with more than 1,700 habitants and in municipal capitals that did not have internet access.
1.800.000 52m 100%
Total 1.490 telecenters 5.200.000 Broadband connectivity for public institutions Phase I Started in march
2004 (72 months)
4.794 public institutions 2.161.000 students
64m 4,155 public institutions
Phase II Started in January 2004 (62 months)
4.357 public institutions 2.039.000 students
57m Under planning

C O M I S I O N D E R E G U L A C I O N D E T E L E C O M U N I C A C I O N E S - R E P U B L I C A D E C O L O M B I A
ITU WOKSHOP ON “THE FUTURE OF VOICE” Information about the Telecom Sector in Colombia CCN-Mercadeo OG
Fecha actualización: 26/06/06 Página 26 de 27
Revisado por:JPH/CXB
Fecha revisión: 26/06/06
Revisión No. 1 Aprobado por: Director Ejecutivo Fecha de vigencia: 01/02/05
ANNEX I – COLOMBIA´S OVERVIEW
Official Name: Republic of Colombia
Area: 1.141.748 Km2
Land Frontiers: Venezuela, Peru, Ecuador, Brazil and Panama
Coast Lines: Atlantic Ocean and Pacific Ocean
Population (2005): 45 million inhabitants (77% urban, 23% rural)
Population density: 39,4 people by Km2
Capital: Bogotá D.C., 7 million inhabitants
Climate: Tropical (climate based on altitude)
Official Language: Spanish
Literacy Rate: 92,1% (one of the highest in Latin America)
Currency (2005): Peso COP$ (1US$ = 2.321 COP & 1€ = 2.739 COP)
GDP (2005): US$ 122,3 billions (free market economy)
GDP per capita (2005): US$ 2.277
Important facts
• Colombia has one of the most stable economies in Latin America (5th place in the GCI of LAC countries).
• It has an economic growth (5,13%) above the region average The inflation index has decreased in recent years, it reached 4,85% in 2005.
• Colombia ranked 1st in net FDI flows among Andean countries, 3rd in South America (after Brazil and Chile) and 5th in LAC countries = US$3,92 billions in 2005.
C O M I S I O N D E R E G U L A C I O N D E T E L E C O M U N I C A C I O N E S - R E P U B L I C A D E C O L O M B I A
ITU WOKSHOP ON “THE FUTURE OF VOICE” Information about the Telecom Sector in Colombia CCN-Mercadeo OG
Fecha actualización: 26/06/06 Página 27 de 27
Revisado por:JPH/CXB
Fecha revisión: 26/06/06
Revisión No. 1 Aprobado por: Director Ejecutivo Fecha de vigencia: 01/02/05
ANNEX II – COLOMBIA´S RECENT ECONOMIC PERFORMANCE
According to DANE [National Statistics Bureau] figures, the economy grew 5.1% for the first nine months of year 2005. The sectors with the highest growth were imports (16.6%), construction (16.13%) and financial services (12.1%). The transportation and communications sub sector grew 5.91%. In addition, the growth in sectors associated with service provision accounted for national economic growth and benefited from macroeconomic stability. In terms of other relevant macroeconomic variables, inflation presented a decreasing trend. For 2005, the IPC [Consumer Price Index] variation was 4.85%, the lowest rate during the past 15 years. Inflation stability is expected with these conditions, and this would allow the Board of Directors of the Central Bank to set a 4% to 5% inflation goal for 2006. In terms of interest rates, the DTF [fixed-term deposit] rate reached 6%; lower than the rate seen in recent years, caused by inflation controls implemented by the Central Bank. During 2005, the exchange rate continued to appreciate but not at the levels seen the year before. A 7.4% revaluation was estimated by the end of the year 2005, with more stable levels expected for 2006.
Graph A.1: Evolution of Macroeconomic Variables
Source: DNP (National Planning Office) and DANE (National Statistics Bureau) data.
The macroeconomic stability of the national economy allowed the stock market to maintain a rising trend. The Colombian Stock Exchange Index [Índice de la Bolsa de Valores de Colombia - IGBC] grew 88% last year, which makes it one of the most profitable and reliable markets in the region. However, moderate growth is expected for the following months. Economic performance in 2006 will depend especially on the dynamics of private consumption, industrial production and the behavior of foreign trade. In this sense, analysts forecast moderate but stable growth due to factors that can generate uncertainty such as the need to control excessive public spending, the past presidential elections (May/2006) and the political and economic situation of the region.
-10%
-5%
0%
5%
10%
15%
20%
25%
1994
1995
1996
1997
1998
1999
2000
2001
2002
2003
2004
2005
(p)
0
500
1.000
1.500
2.000
2.500
3.000
3.500
In c
urre
ntpe
sos
Domestic Inflation (IPC) Real GDP Growth (%)Average Nominal Exchange Rate
-10%
-5%
0%
5%
10%
15%
20%
25%
1994
1995
1996
1997
1998
1999
2000
2001
2002
2003
2004
2005
(p)
0
500
1.000
1.500
2.000
2.500
3.000
3.500
In c
urre
ntpe
sos
Domestic Inflation (IPC) Real GDP Growth (%)Average Nominal Exchange Rate
-10%
-5%
0%
5%
10%
15%
20%
25%
1994
1995
1996
1997
1998
1999
2000
2001
2002
2003
2004
2005
(p)
0
500
1.000
1.500
2.000
2.500
3.000
3.500
In c
urre
ntpe
sos
Domestic Inflation (IPC) Domestic Inflation (IPC) Real GDP Growth (%)Real GDP Growth (%)Average Nominal Exchange RateAverage Nominal Exchange Rate