ELIMINACIÓ BIOLÒGICA DE NITROGEN VIA NITRIT D’UN … · Universitat Autònoma de Barcelona...
122
Universitat Autònoma de Barcelona Departament d’Enginyeria Química Escola d’Enginyeria ELIMINACIÓ BIOLÒGICA DE NITROGEN VIA NITRIT D’UN CORRENT AMB ALTA CÀRREGA D’AMONI (NITRITE PATHWAY BIOLOGICAL NITROGEN REMOVAL OF A HIGH STRENGTH AMMONIUM WASTEWATER) Memòria de tesi doctoral Sota la direcció de Dr. Juan Antonio Baeza Labat i Dr. Julián Carrera Muyo JOSEP ANTON TORÀ SUÁREZ Bellaterra, gener de 2012
Transcript of ELIMINACIÓ BIOLÒGICA DE NITROGEN VIA NITRIT D’UN … · Universitat Autònoma de Barcelona...
Universitat Autònoma de Barcelona
Departament d’Enginyeria Química Escola d’Enginyeria
ELIMINACIÓ BIOLÒGICA DE NITROGEN VIA NITRIT D’UN
CORRENT AMB ALTA CÀRREGA D’AMONI
(NITRITE PATHWAY BIOLOGICAL NITROGEN REMOVAL OF A HIGH
STRENGTH AMMONIUM WASTEWATER)
Memòria de tesi doctoral
Sota la direcció de
Dr. Juan Antonio Baeza Labat i Dr. Julián Carrera Muyo
JOSEP ANTON TORÀ SUÁREZ
Bellaterra, gener de 2012
Títol: Eliminació biològica de nitrogen via nitrit d’un corrent amb alta càrrega d’amoni
(Nitrite pathway biological nitrogen removal of a high strength ammonium wastewater)
Realitzat per: Josep Anton Torà Suárez
Dirigit per: Dr. Juan Antonio Baeza Labat i Dr. Julián Carrera Muyo
Programa de Doctorat de Ciències Ambientals, especialitat en Tecnologia Ambiental.
Departament d’Enginyeria Química.
Escola d’Enginyeria.
Universitat Autònoma de Barcelona. Bellaterra. 2012.
Aquest treball ha estat finançat pel projecte REMOVALS, Contracte FP6-018525 de la
Comissió Europea.
Part d’aquest treball ha estat realitzat al Departament d’Enginyeria Civil de la
Universitat de Manitoba (Winnipeg, Canadà), sota la supervisió del Prof. Jan A.
Oleszkiewicz.
JUAN ANTONIO BAEZA LABAT i JULIÁN CARRERA MUYO, professors agregats
del Departament d’Enginyeria Química de la Universitat Autònoma de Barcelona,
CERTIFIQUEM:
Que l’enginyer químic JOSEP ANTON TORÀ SUÁREZ ha dut a terme
sota la nostra direcció el treball que, amb títol “Eliminació biològica de
nitrogen via nitrit d’un corrent amb alta càrrega d’amoni (Nitrite pathway
biological nitrogen removal of a high strength ammonium wastewater)”,
es presenta en aquesta memòria, i que constitueix la seva Tesi per a optar
al Grau de Doctor per la Universitat Autònoma de Barcelona.
I perquè se’n prengui coneixement i consti als efectes oportuns,
presentem a l’Escola d’Enginyeria de la Universitat Autònoma de
Barcelona l’esmentada Tesi, signant el present certificat a
Bellaterra, gener de 2012
Dr. Juan Antonio Baeza Labat Dr. Julián Carrera Muyo


als meus pares,
a la meva germana
i a l’Ari
"L'èxit és aprendre a anar de fracàs en fracàs sense perdre l'entusiasme."
Winston Churchill

Agraïments Un ha esperat molt de temps perquè li arribi aquest moment i aquí està, escrivint la
pàgina més llegida de la tesi. Quan es comencen a escriure els agraïments un se n’adona
de la gran quantitat de gent que ha ajudat, donat suport o animat durant tots aquests
anys, està clar que sense el seu granet de sorra (alguns muntanyes senceres) no hauria
arribat fins aquí.
Primer de tot agrair a qui realment sense la seva ajuda això no hauria estat possible.
Aquests són sense cap dubte els meus directors, el Juan i el Julián. Sense la vostra
ajuda, paciència, idees, confiança i més paciència això no hauria sortit mai. Moltes
gràcies pel vostre recolzament, i si he arribat a escriure aquestes línies és gràcies a
vosaltres.
En segon lloc vull donar les gràcies al Javier. Gràcies per confiar en mi i donar-me
l’oportunitat de fer la tesi al vostre grup. Tot i les mil coses que tens a fer sempre trobes
temps per tothom, i sinó sempre ens queda el llarg passadís del departament. Gràcies
per preocupar-te per mi en tot moment.
I would also want to thank Prof. Jan A. Oleszkiewicz who accepted me in University of
Manitoba, Canada, thank you for your time and help. Thank you also to all the people I
met in Winnipeg: Alberto, Stan, Qiuyan, Peter, Victor, Chen, Damian,… you made my
stage a really great experience.
No puc deixar d’agrair a tots els companys de grup, des dels inicis amb la Irene
ensenyant-me com funciona la planta i deixant una gran tesi que en molts casos ha estat
com una bíblia per mi, passant pel Bartrolí amb qui sense cap dubte hem passat els
millors moments al laboratori. I la resta de companys, que a la majoria algun dia us ha
tocat mirar com estava la meva planta (Mar, Javi, Carlota, Edu, Mª Angel, MariE, Zulk,
Margot, Lorena, Guisa, Julio).
També vull agrair als companys de despatx que he tingut en tots aquests anys, des dels
inicis amb Ramon Ramon i la Carol, com era això d’un despatx de tres persones?
després canviant amb l’Engràcia, Cristina i Marcel i finalment amb les noves
incorporacions, Carles, Jordi, Núria i Marius. Sempre hem format un bon despatx, tot i
que a vegades ha semblat un despatx de sis amb les constants visites del Jero i l’Edu.
També s’ha d’agrair als companys d’aventures fora del departament, des de calçotades,
matances, Molina, sopars varis, paelles... Jero, Marcel, Carol, Roger, Oscar, Marc F,
Kristin, Bartrolí, Carlota, JuanMi, Edu, Michele... gràcies per fer els moments fora de la
universitat millors.
Carol, gran amiga després de la gran quantitat d’hores que ens hem aguantat..., però tot
s’ha de dir que hem anat de millor a pitjor, des d’un estiu amb els dos escrivint el màster
a acabar escoltant els Manel... i passant pel mític Gotteborg, ets tu Goteborg?
Grans companys i amics, Marcels i Jero, què dir de vosaltres, ja és impossible recordar
la gran quantitat de coses que hem fet junts des del principi a Fuentelsaz, als Sant
Fermins (tot i que el Marcel sempre hi haurà anat més vegades), matances, calçotades,
sopars... sense vosaltres dos aquests anys a la universitat no haurien estat el mateix.
Marcel inclús m’has fet redescobrir el món de l’esport després de tants anys.
També s’ha d’agrair als companys d’esmorzars, Carlota i Roger, gran quantitat de minis
i cafès al bar, perquè hi ha qui a les 9:15 ja està mort de gana i no pot esperar.
Com no també agrair als companys de viatges Manresa-UAB, UAB-Manresa, Alba E,
Alba S, Irene i companys puntuals, Enric i Edu. Quantes hores hem passat junts al cotxe
fent quilòmetres, caravana, i més quilòmetres.
També vull mencionar els companys de carrera que en els sopars que hem anat fent
sempre han demanat i rigut amb el que feia, que lluny us queda ja el món de
l’enginyeria: Cesar, Laura, Neus i Sergi.
També vull agrair als amics del poble, que tot i que ara ja no ens veiem tan com abans
degut a la distància sempre heu estat al meu costat alegrant-me els moments que passem
junts.
Ja per anar acabant no puc deixar d’agrair als meus pares i a la meva germana, amb els
qui sense cap mena de dubte sense el seu suport en tot moment, els seus ànims i sobretot
la paciència que han tingut durant tots aquest anys (que ja en són uns quants) això no
hauria estat possible. Moltes gràcies per tot.
I finalment a tu Ari, una de les persones a qui hi ha més a agrair, gràcies pel teu suport
incondicional, per la teva ajuda en tot moment. Perquè de ben segur ets qui més ha
aguantat els mals moments de la tesi, qui m’ha acompanyat els caps de setmana a la
UAB a veure què li passava a la planta. Perquè sempre has estat al meu costat ajudant-
me en tot. Perquè sempre t’has alegrat més que jo mateix quan les coses han sortit bé.
Pels moments difícils que hem passat però que n’hem sortit reforçats. I moltes més
coses que et podria agrair, moltes gràcies.
PD: Jo que em queixava de la gent que feia quatre pàgines d’agraïments, però al final un
comença a escriure i no és que m’hagi quedat gaire lluny.

Índex
Índex LLISTA DE PUBLICACIONS ................................................................................................................. I
RESUM .................................................................................................................................................... III
SUMMARY................................................................................................................................................V
RESUMEN..............................................................................................................................................VII
1 INTRODUCCIÓ ...............................................................................................................................1
1.1 VISIÓ GENERAL ..........................................................................................................................3
1.2 AIGÜES RESIDUALS AMB ALTA CÀRREGA DE NITROGEN .............................................................3
1.2.1 Aigües residuals urbanes......................................................................................................4
1.2.2 Aigües residuals industrials..................................................................................................5
1.3 TRACTAMENTS PER A L’ELIMINACIÓ DEL NITROGEN DE LES AIGÜES RESIDUALS ........................5
1.3.1 Nitrificació i desnitrificació convencional ...........................................................................6
1.3.2 Eliminació de nitrogen via nitrit...........................................................................................8
1.3.3 Nitrificació parcial i Anammox ..........................................................................................11
1.3.4 Nitrificació i desnitrificació autòtrofa................................................................................14
1.4 MOTIVACIONS DE LA RECERCA I PRESENTACIÓ DE LA TESI.......................................................16
2 OBJECTIUS....................................................................................................................................19
3 RESULTATS I DISCUSSIÓ..........................................................................................................23
3.1 ELIMINACIÓ DE NITROGEN VIA NITRIT......................................................................................25
3.2 ESTUDI DE DIFERENTS CONDICIONS D’ATURADA D’UN SISTEMA DE NITRIFICACIÓ PARCIAL I
POSTERIOR RECUPERACIÓ.......................................................................................................................29
3.3 ESTUDI DE LES LIMITACIONS PER CARBONI INORGÀNIC............................................................31
4 CONCLUSIONS .............................................................................................................................33
5 BIBLIOGRAFIA ............................................................................................................................37
APÈNDIX I: ARTICLES ACCEPTATS................................................................................................49
APÈNDIX II: CURRÍCULUM VITAE..................................................................................................93

Llista de publicacions
i
Llista de publicacions
I Torà, J. A., Lafuente, J., Carrera, J. and Baeza, J. A.
Fast start-up and controlled operation during a long term period of a high-
rate partial nitrification activated sludge system
[Environmental Technology. 2011; doi: 10.1080/09593330.2011.626802]
II Torà, J. A., Baeza, J. A., Carrera, J. and Oleszkiewicz, J. A.
Denitritation of a high-strength nitrite wastewater in a sequencing batch
reactor using different organic carbon sources
Chemical Engineering Journal. 2011; Volume 172, Issues (2-3), Pages 994-998
III Torà, J. A., Lafuente, J., Baeza, J. A. and Carrera, J.
Long-term starvation and subsequent reactivation of a high-rate partial
nitrification activated sludge pilot plant
Bioresource Technology. 2011; Volume 102, Issue 21, Pages 9870-9875
IV Torà, J. A., Lafuente, J., Baeza, J. A. and Carrera, J.
Combined effect of inorganic carbon limitation and inhibition by free
ammonia and free nitrous acid on ammonia oxidizing bacteria
Bioresource Technology. 2010; Volume 101, Issue 15, Pages 6051-6058

Resum
iii
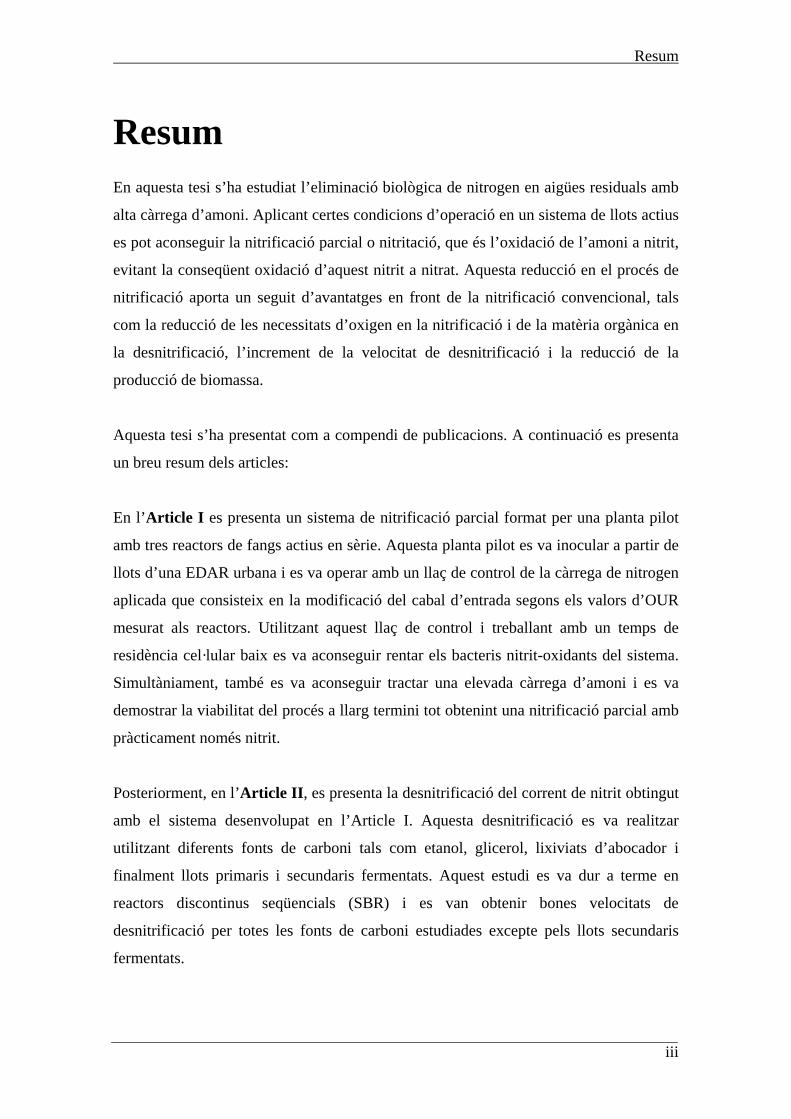
Resum En aquesta tesi s’ha estudiat l’eliminació biològica de nitrogen en aigües residuals amb
alta càrrega d’amoni. Aplicant certes condicions d’operació en un sistema de llots actius
es pot aconseguir la nitrificació parcial o nitritació, que és l’oxidació de l’amoni a nitrit,
evitant la conseqüent oxidació d’aquest nitrit a nitrat. Aquesta reducció en el procés de
nitrificació aporta un seguit d’avantatges en front de la nitrificació convencional, tals
com la reducció de les necessitats d’oxigen en la nitrificació i de la matèria orgànica en
la desnitrificació, l’increment de la velocitat de desnitrificació i la reducció de la
producció de biomassa.
Aquesta tesi s’ha presentat com a compendi de publicacions. A continuació es presenta
un breu resum dels articles:
En l’Article I es presenta un sistema de nitrificació parcial format per una planta pilot
amb tres reactors de fangs actius en sèrie. Aquesta planta pilot es va inocular a partir de
llots d’una EDAR urbana i es va operar amb un llaç de control de la càrrega de nitrogen
aplicada que consisteix en la modificació del cabal d’entrada segons els valors d’OUR
mesurat als reactors. Utilitzant aquest llaç de control i treballant amb un temps de
residència cel·lular baix es va aconseguir rentar els bacteris nitrit-oxidants del sistema.
Simultàniament, també es va aconseguir tractar una elevada càrrega d’amoni i es va
demostrar la viabilitat del procés a llarg termini tot obtenint una nitrificació parcial amb
pràcticament només nitrit.
Posteriorment, en l’Article II, es presenta la desnitrificació del corrent de nitrit obtingut
amb el sistema desenvolupat en l’Article I. Aquesta desnitrificació es va realitzar
utilitzant diferents fonts de carboni tals com etanol, glicerol, lixiviats d’abocador i
finalment llots primaris i secundaris fermentats. Aquest estudi es va dur a terme en
reactors discontinus seqüencials (SBR) i es van obtenir bones velocitats de
desnitrificació per totes les fonts de carboni estudiades excepte pels llots secundaris
fermentats.
Resum
iv
En l’Article III, es presenta l’estudi de l’efecte d’una llarga aturada del sistema de
nitrificació parcial tot deixant d’alimentar durant 30 dies. Aquest estudi es va realitzar
en quatre reactors discontinus que es van operar en diferents condicions d’aeració.
Durant aquest període de temps es va fer un seguiment de l’activitat dels bacteris
amoni-oxidants mitjançant respirometries i l’anàlisi FISH. Es va observar que és millor
aturar el sistema de nitrificació parcial en condicions anòxiques i, a poder ser, no més de
dues setmanes. Finalment, es va obtenir una recuperació ràpida del sistema utilitzant el
llaç de control per OUR emprat en la planta pilot de l’Article I.
Finalment, en l’Article IV es presenta l’estudi de l’efecte de les inhibicions per amoníac
i per àcid nitrós en els bacteris amoni-oxidants, a més de l’efecte d’aquestes inhibicions
en condicions de limitació per carboni inorgànic. Es va comprovar que la inhibició per
amoníac es pot descriure amb precisió amb al model cinètic Haldane i la inhibició per
àcid nitrós a un model d’inhibició no competitiva. Es va observar que l’efecte
d’aquestes inhibicions s’incrementa en condicions de limitació per carboni inorgànic,
sent molt més gran en el cas de l’àcid nitrós.
Summary
v
Summary Biological nitrogen removal of high-strength ammonium wastewater was studied in this
thesis. Applying specific operational conditions in an activated sludge system, partial
nitrification or nitritation (oxidation of ammonium to nitrite) was achieved, avoiding the
consequently oxidation of this nitrite to nitrate. This reduction in the nitrification
process provides some advantages in comparison to the complete nitrification process,
such as the reduction of the oxygen requirements during nitrification and the organic
matter during denitrification, the increasing of the denitrification rates and the reduction
of the biomass production.
This thesis was presented as a compendium of publications and a brief summary of the
papers are presented:
In Paper I, a partial nitrification system consisting of a pilot plant with three continuous
stirred tank reactors in series is presented. This pilot plant was inoculated with sludge
from a municipal WWTP and it was operated with a control loop of the nitrogen loading
rate which was applied modifying the inflow rate depending on the OUR values
measured in the reactors. With this control loop and low sludge retention time the
washout of the nitrite-oxidizing bacteria was performed. Simultaneously, almost a
complete partial nitrification to nitrite with a high nitrogen loading rate was achieved
during a long term operation.
Subsequently, in Paper II, the heterotrophic denitrification of the nitrite obtained with
the pilot plant developed in Paper I was presented. Different organic carbon sources
such as ethanol, glycerol, landfill leachate, fermented primary sludge centrate and
fermented secondary sludge centrate were used in the heterotrophic denitrification. This
study was carried out in sequential batch reactors (SBR) and a complete denitritation of
a high-strength nitrite wastewater was achieved using these organic carbon sources with
the exception of fermented secondary sludge centrate.
In Paper III the study of the effect of a long-term starvation of a partial nitrification
system during 30 days was presented. Four ammonium-starved reactors under different
Summary
vi
conditions of aeration were used. During this period the ammonia-oxidizing bacteria
activity was evaluated using respirometric tests and the FISH analysis. It was observed
that is better to shut-down a partial nitrification system under anoxic conditions and, if it
is possible, no more than two weeks. Finally, a fast recovery of the system was achieved
using the OUR control loop used in the pilot plant of Paper I.
Finally, in Paper IV a study of the inhibitory effect by free ammonia and free nitrous
acid on the ammonia-oxidizing bacteria under total inorganic carbon limitations and
without total inorganic carbon limitations was presented. It was observed that the
inhibition by free ammonia can be described accurately using the Haldane model and
the inhibition by free nitrous acid using a non-competitive inhibition model. The effect
of these inhibitions increased under total inorganic carbon limitation, being much higher
in the case of the free nitrous acid.
Resumen
vii
Resumen En esta tesis se estudia la eliminación biológica de nitrógeno en aguas residuales con
una alta carga de amonio. Aplicando ciertas condiciones de operación en un sistema de
lodos activos se puede conseguir la nitrificación parcial o nitritación, que es la
oxidación del amonio a nitrito, evitando la consecuente oxidación de este nitrito a
nitrato. Esta reducción en el proceso de nitrificación aporta unas ventajas frente a la
nitrificación convencional, tales como la reducción de les necesidades de oxigeno en la
nitrificación y de la materia orgánica en la desnitrificación, el incremento de la
velocidad de desnitrificación y la reducción de la producción de biomasa.
Esta tesis se presenta como compendio de publicaciones. A continuación se presenta un
breve resumen de los artículos:
En el Artículo I se presenta un sistema de nitrificación parcial formado por una planta
piloto con tres reactores de lodos activos en serie. Esta planta piloto se inoculó a partir
de lodos de una EDAR urbana y se operó con un lazo de control de la carga de
nitrógeno aplicada que consiste en la modificación del caudal de entrada según los
valores de OUR medidos en los reactores. Utilizando este lazo de control y trabajando
con un tiempo de residencia celular bajo se consiguió lavar las bacterias nitrito-
oxidantes del sistema. Simultáneamente, también se consiguió tratar una elevada carga
de amonio y se demostró la viabilidad del proceso a largo plazo obteniendo una
nitrificación parcial con prácticamente solo nitrito.
Posteriormente, en el Artículo II, se presenta la desnitrificación de la corriente de
nitrito obtenida con el sistema desarrollado en el Artículo I. Esta desnitrificación se
realizó utilizando distintas fuentes de carbono tales como etanol, glicerol, lixiviados de
vertedero y finalmente lodos primarios y secundarios fermentados. En este estudio se
utilizaron reactores discontinuos secuenciales (SBR) y se obtuvieron buenas
velocidades de desnitrificación para todas las fuentes de carbono estudiadas excepto
para los lodos secundarios fermentados.
Resumen
viii
En el Artículo III, se presenta el estudio del efecto de una larga parada del sistema de
nitrificación parcial dejando de alimentar durante 30 días. Este estudio se realizó en
cuatro reactores discontinuos que se operaron en distintas condiciones de aireación.
Durante este período de tiempo se hizo un seguimiento de la actividad de las bacterias
amonio-oxidantes utilizando técnicas respirométricas y el análisis FISH. Se observó que
es mejor parar el sistema de nitrificación parcial en condiciones anóxicas y, a poder ser,
no más de dos semanas. Finalmente, se consiguió una recuperación rápida del sistema
utilizando el lazo de control por OUR utilizado en la planta piloto del Artículo I.
Finalmente, en el Artículo IV se presenta el estudio del efecto de las inhibiciones por
amoníaco y por ácido nitroso en las bacterias amonio-oxidantes, además del efecto de
estas inhibiciones en condiciones de limitación por carbono inorgánico. Se comprobó
que la inhibición por amoníaco se puede ajustar con precisión utilizando el modelo
cinético Haldane y la inhibición por ácido nitroso utilizando el modelo de inhibición no
competitiva. Se observó que el efecto de estas inhibiciones se incrementa en
condiciones de limitación por carbono inorgánico, siendo mucho mayor en el caso del
ácido nitroso.

Capítol 1
Introducció

Introducció
3
1 Introducció
1.1 Visió general
Els compostos nitrogenats es troben entre els compostos contaminants més importants
de les aigües residuals, sobretot degut a la seva importància en l’eutrofització, al seu
efecte en la concentració d’oxigen de les masses aquàtiques i a la seva toxicitat sobre els
éssers vius (Dodds et al. 2009). Per tal de protegir el medi ambient, la Unió Europea
exigeix l’acompliment d’unes estrictes condicions per l’abocament de nutrients en les
aigües residuals (Directiva 91/271/CEE). Així els nivells de matèria orgànica
biodegradable dels rius europeus s’han reduït entre un 20 i un 30% des de la dècada dels
90, les concentracions de fòsfor han disminuït entre un 30 i un 40% i les de nitrogen
amoniacal al voltant del 40% (EEA 2002). Tot i així, els nivells de nitrogen en els rius
europeus s’han mantingut elevats, resultat de la incidència de l’agricultura i de l’encara
insuficient eliminació de nitrogen en les estacions depuradores d’aigües residuals
(EDARs). Moltes d’aquestes EDARs van ser dissenyades anteriorment a aquesta
directiva i només estaven pensades per eliminar matèria orgànica, per tant, s’han hagut
de modificar posteriorment per eliminar també els compostos nitrogenats (Henze et al.
2008).
Una de les fonts més importants de contaminació per nitrogen són les aigües residuals
que contenen una alta concentració d’aquests compostos, per tant una forma de reduir la
contaminació és realitzant un tractament específic d’aquests tipus d’aigua residual.
1.2 Aigües residuals amb alta càrrega de nitrogen
S’anomenen així les aigües residuals que contenen una alta concentració de compostos
nitrogenats (generalment amoni). Aquestes aigües es poden classificar en dos grans
tipus:
- Aigües residuals urbanes
- Aigües residuals industrials
Capítol 1
4
1.2.1 Aigües residuals urbanes
Les aigües residuals urbanes generalment no tenen una gran concentració de compostos
nitrogenats, tot i així en les EDARs hi ha un corrent que prové de l’assecament dels
fangs digerits en el digestor anaerobi que conté una alta concentració d’amoni. Aquesta
aigua, anomenada aigua de rebuig, és un corrent intern de l’EDAR que pot contenir fins
a un percentatge entre el 15 i el 30% del nitrogen total d’entrada a l’EDAR i, d’altra
banda, només representa entre l’1 i el 2% del cabal total. Actualment, aquesta aigua de
rebuig es recircula a la capçalera de l’EDAR, tot augmentant la quantitat de nitrogen a
eliminar. Degut a les característiques específiques (concentració d’amoníac, demanda
química d’oxigen (DQO), alcalinitat, pH i temperatura), es pot estudiar la realització
d’un tractament específic de l’aigua de rebuig, el qual permetria eliminar una gran part
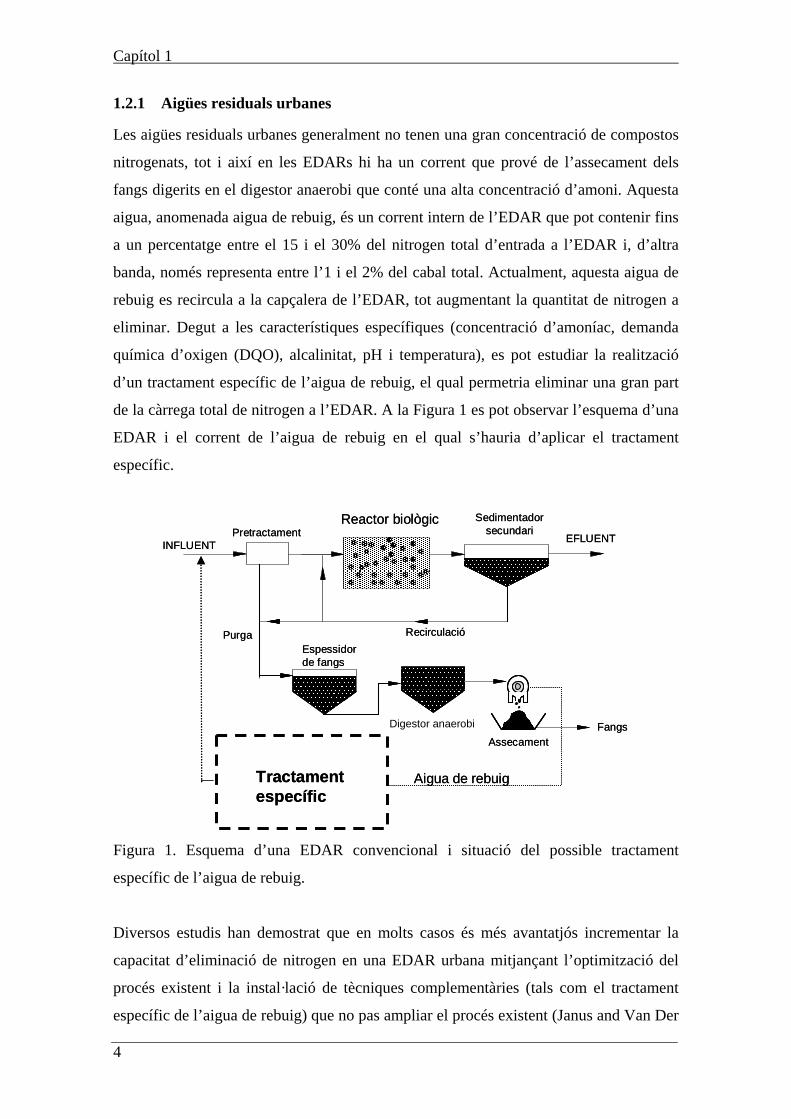
de la càrrega total de nitrogen a l’EDAR. A la Figura 1 es pot observar l’esquema d’una
EDAR i el corrent de l’aigua de rebuig en el qual s’hauria d’aplicar el tractament
específic.
PurgaEspessidorde fangs
Digestor anareòbi
Assecament
Aigua de rebuig
PretractamentReactor biològic
Recirculació
INFLUENTEFLUENT
Sedimentadorsecundari
Tractamentespecífic
Fangs
PurgaEspessidorde fangs
Digestor anareòbi
Assecament
Aigua de rebuig
PretractamentReactor biològic
Recirculació
INFLUENTEFLUENT
Sedimentadorsecundari
Tractamentespecífic
FangsDigestor anaerobi
Figura 1. Esquema d’una EDAR convencional i situació del possible tractament
específic de l’aigua de rebuig.
Diversos estudis han demostrat que en molts casos és més avantatjós incrementar la
capacitat d’eliminació de nitrogen en una EDAR urbana mitjançant l’optimització del
procés existent i la instal·lació de tècniques complementàries (tals com el tractament
específic de l’aigua de rebuig) que no pas ampliar el procés existent (Janus and Van Der
Introducció
5
Roest 1997; Wett et al. 1998; Fux and Siegrist 2004; Wyffels et al. 2004; Carrera et al.
2011).
1.2.2 Aigües residuals industrials
Hi ha diverses activitats industrials que generen aigües residuals amb un alt contingut
d’amoni: petroquímica, farmacèutica, indústria de fertilitzants, alimentària, etc.
Aquestes aigües residuals, que també han de ser tractades prèviament al seu abocament,
tenen una problemàtica afegida, i és que sovint experimenten canvis en el cabal o en les
seves característiques (Wun Jern 2006; Sipma et al. 2010). Aquests canvis en les aigües
residuals sovint estan relacionats amb períodes de baixa activitat industrial o fins i tot
amb l’aturada total de les indústries, ja sigui per tal de realitzar operacions de
manteniment o per períodes de vacances. Aquestes variacions en la producció poden
perjudicar seriosament als sistemes de tractament biològic, sobretot pel que fa a la seva
capacitat, podent arribar a la pèrdua total d’activitat en períodes prolongats d’aturada.
1.3 Tractaments per a l’eliminació del nitrogen de les
aigües residuals
L’eliminació dels compostos nitrogenats de les aigües residuals pot realitzar-se
mitjançant una gran varietat de processos, que poden ser tan biològics com
fisicoquímics. No obstant, com que l’eliminació biològica és més eficaç i té uns costos
menors, és el tractament més utilitzat (US-EPA 1993; Teichgräber and Stein 1994).
Les principals tecnologies per a l’eliminació biològica del nitrogen són les següents:
- Nitrificació i desnitrificació convencional
- Nitrificació parcial i desnitrificació via nitrit
- Nitrificació parcial i anammox
- Nitrificació i desnitrificació autòtrofa
Capítol 1
6
1.3.1 Nitrificació i desnitrificació convencional
Aquesta és la tecnologia més desenvolupada i aplicada arreu del món per a l’eliminació
biològica de nitrogen. Aquest procés es divideix en dues parts, que són la nitrificació i
la posterior desnitrificació.
La nitrificació és l’oxidació biològica de l’amoni fins a nitrat i es produeix en
condicions estrictament aeròbies. A més a més, la nitrificació succeeix en dues fases
d’oxidació consecutives: l’oxidació de l’amoni fins a nitrit (nitritació) i la posterior
oxidació del nitrit fins a nitrat (nitratació) (Wiesmann 1994). Cadascuna d’aquestes
fases d’oxidació està realitzada per un tipus de bacteri diferent, la nitritació pels bacteris
amoni oxidants (ammonia oxidizing bacteria, AOB) i la nitratació pels bacteris nitrit
oxidants (nitrite oxidizing bacteria, NOB). Aquests bacteris utilitzen l’amoni o el nitrit
com a font d’energia, l’oxigen com a acceptor d’electrons i el diòxid de carboni com a
font de carboni. El procés de nitrificació és un procés que consumeix alcalinitat, i en
alguns casos, quan les aigües residuals no contenen l’alcalinitat necessària per oxidar tot
l’amoni, aquesta alcalinitat s’ha de subministrar externament.
El segon pas, la desnitrificació, implica la reducció biològica del nitrat produït
anteriorment fins a nitrogen gas (N2). Igual que la nitrificació, aquest pas es realitza en
diferents fases, que són la reducció del nitrat fins a nitrit, la posterior reducció del nitrit
a òxid nítric, posteriorment a òxid nitrós, i finalment la reducció de l’òxid nitrós a
nitrogen gas (Gujer et al. 1999). El procés de desnitrificació és realitzat per bacteris
heteròtrofs en condicions anòxiques, que utilitzen el nitrat enlloc de l’oxigen com a
acceptor d’electrons i matèria orgànica com a font de carboni i d’energia. Normalment,
en aigües industrials que contenen una baixa relació DQO/N la desnitrificació està
limitada per la manca de font de carboni i aquesta s’ha de subministrar externament.
Aquesta font de carboni ha de ser biodegradable i es pot utilitzar un ampli rang de
productes, tals com àcid acètic, metanol, etanol, glucosa, etc, o fins i tot altres fonts de
carboni que presentin una alta relació DQO/N que poden provenir d’altres aigües
residuals (Ahn 2006). Per elegir la millor font de carboni s’ha de tenir en compte la
velocitat de desnitrificació que es pot assolir amb cadascuna d’elles, el cost i la seva
disponibilitat (Carrera et al. 2003). L’addició d’aquesta font de carboni suposa un
increment important en els costos de tractament de l’aigua residual.
Introducció
7
En general, la nitrificació i desnitrificació convencional consumeixen una considerable
quantitat de recursos, ja que es necessiten 4.57 kg d’O2 i entre 2 i 4 kg de DQO per cada
kg de nitrogen en forma d’amoni eliminat. Aquestes quantitats inclouen l’oxigen que es
necessita durant la nitrificació i l’addició de la font de carboni externa durant la
desnitrificació (Paredes et al. 2007).
Les reaccions de nitrificació i desnitrificació convencional sense considerar la formació
de biomassa són les següents (Wiesmann 1994):
- Nitrificació
NH4+ + 1.5 O2 NO2
- + H2O + 2 H+ (1)
NO2- + 0.5 O2 NO3
- (2)
- Desnitrificació utilitzant acetat com a font de carboni
8 NO3- + 5 CH3COOH 4 N2 + 10 CO2 + 6 H2O + 8 OH- (3)
Aquests dos processos biològics es poden dur a terme en reactors de biomassa en
suspensió o en reactors de biomassa immobilitzada o biopel·lícules. A més, tots aquests
reactors poden treballar en continu o en discontinuo (tipus Sequencing Batch Reactor,
SBR).
Aquesta tesi es centra en l’estudi d’un sistema de biomassa en suspensió en continu
(fangs actius). En fangs actius, la tecnologia de nitrificació i desnitrificació
convencional es pot implementar en dos tipus de sistemes: el sistema d’un llot (single-
sludge) o el sistema de dos llots (two-sludge). En el sistema d’un llot (Figura 2a) hi ha
dos reactors, un anòxic i un aerobi els quals contenen la mateixa biomassa. Al final del
sistema hi ha un sedimentador que permet recircular part de la biomassa al reactor
anòxic. Els principals inconvenients d’aquest sistema són: (a) que part de la biomassa
no es troba en condicions òptimes d’operació (els microorganismes heteròtrofs es troben
sense substrat en el reactor aerobi i els nitrificants sense oxigen en el reactor anòxic), (b)
la presència d’oxigen procedent de la recirculació interna en el reactor anòxic i
finalment (c) la presència de nitrat en l’efluent. D’altra banda, si l’aigua a tractar conté
la suficient DQO, aquest sistema no requereix l’addició d’una font de carboni externa ja
que en el reactor anòxic entra DQO procedent de l’aliment. D’altra banda, també permet
l’estalvi d’una gran quantitat d’alcalinitat externa ja que en el reactor anòxic es produeix
la meitat de l’alcalinitat que és consumida posteriorment en el reactor aerobi.
Capítol 1
8
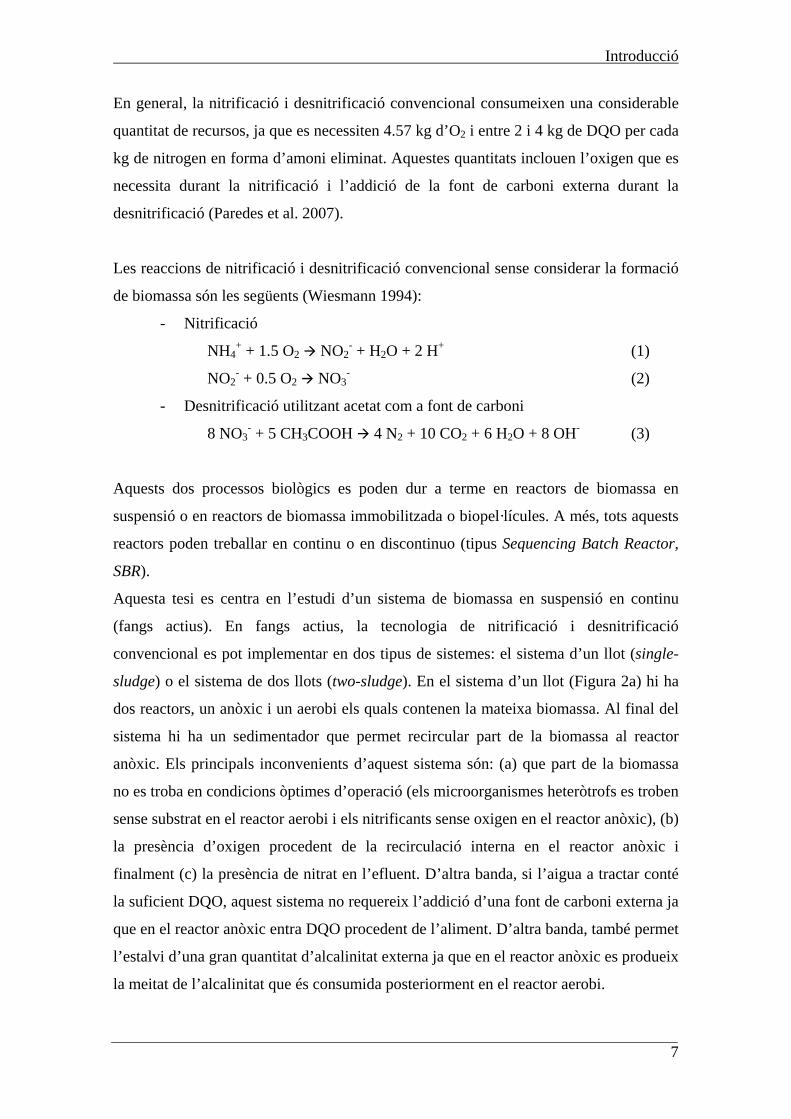
D’altra banda, el sistema de dos llots manté els dos processos separats (Figura 2b),
cadascun amb el seu propi sedimentador i la seva recirculació independent. Aquest
sistema és més eficaç per al tractament d’aigües residuals amb alta càrrega de nitrogen
que el sistema d’un llot ja que pot assolir velocitats de nitrificació i desnitrificació més
elevades i, per tant, requereix menor volum dels reactors (Carrera et al. 2003; Carrera et
al. 2004a). No obstant, aquest sistema de dos llots només es pot aplicar a aigües
residuals amb una baixa relació DQO/N i requereix de l’adició d’una font externa
d’alcalinitat en el reactor aerobi i d’una font externa de carboni en el reactor anòxic.
Recirculació externa
Influent
Efluent
Sedimentador
Reactor aerobiReactor anòxic
Recirculació interna
Recirculació externa
Influent Efluent
Sedimentador
Reactor anòxicReactor aerobi
Sedimentador
Purga
Recirculació externaPurga Purga
a
b Alcalinitat DQO
Figura 2. a) Esquema d’un sistema d’un llot. b) Esquema d’un sistema de dos llots.
1.3.2 Eliminació de nitrogen via nitrit
Tal i com s’ha comentat anteriorment en la nitrificació i desnitrificació convencional, el
nitrit és un producte intermedi, tant del procés de nitrificació com del procés de
desnitrificació. Per tant aquesta tecnologia consisteix en reduir el procés de nitrificació
d’una reacció de dos passos (nitritació i nitratació) a tan sols un pas, el de nitritació.
Aquest nou procés rep el nom de nitrificació parcial. Posteriorment aquest nitrit és
reduït a nitrogen gas mitjançant la desnitrificació des de nitrit o desnitritació. El procés
global de nitritació i desnitritació rep el nom d’eliminació de nitrogen via nitrit.
Introducció
9
Les reaccions de la nitrificació i desnitrificació via nitrit sense considerar la formació de
biomassa són les següents (Henze et al. 2008):
- Nitritació
NH4+ + 1.5 O2 NO2
- + H2O + 2 H+ (1)
- Desnitritació utilitzant acetat com a font de carboni
8 NO2- + 3 CH3COOH 4 N2 + 6 CO2 + 2 H2O + 8 OH- (4)
Comparant les reaccions anteriors de nitrificació i desnitrificació convencional (1)-(3) i
les de nitritació i desnitritació (1) i (4) s’observa que el fet de modificar el procés
convencional i reduir l’oxidació de l’amoni a nitrit, sense arribar a nitrat, comporta: (a)
una reducció del 25% dels requeriments d’oxigen necessaris per a la nitrificació, (b) una
reducció entre el 30 i el 40% de la matèria orgànica necessària per a la desnitrificació i a
més (c) com a resultat d’evitar la formació de nitrat, es produeix un 40% menys de
biomassa (Turk and Mavinic 1987; Van Hulle et al. 2010). A més, les velocitats de
desnitrificació des de nitrit són entre 1.5 i 2 vegades més ràpides que les velocitats de
desnitrificació des de nitrat (Peng and Zhu 2006; Aslan and Dahab 2008).
No obstant això, no és fàcil suprimir la nitratació, i s’ha de fer afectant el menys
possible a la nitritació. D’altra banda, s’ha reportat que tot i aconseguir evitar la
nitratació durant un cert període de temps, és difícil de mantenir aquesta supressió
durant un llarg període de temps (Villaverde et al. 2000; Yun and Kim 2003; Fux et al.
2004; Ma et al. 2009). Els mètodes de selecció de la nitritació en front de la nitratació es
fonamenten en el fet que els AOB i NOB tenen diferents característiques de resposta a
factors ambientals (Ruiz et al. 2003; Jubany et al. 2009a). Els factors que tenen major
influència per aconseguir la nitrificació parcial són els següents:
- Temperatura
Els AOB i els NOB presenten diferent variació de la velocitat de creixement en funció
de la temperatura, així doncs, a temperatures per sota dels 20ºC els NOB creixen a
major velocitat que els AOB, però aquesta tendència s’inverteix per temperatures
superiors als 20ºC (Hunik et al. 1994). El procés SHARON es fonamenta en aquesta
diferent influència de la temperatura sobre les velocitats de creixement. La velocitat de
creixement dels AOB és aproximadament el doble que la dels NOB a 35ºC (Bougard et
Capítol 1
10
al. 2006). Així doncs, aquest sistema treballa a 35ºC amb un reactor de mescla completa
sense retenció de biomassa. D’aquesta manera, el temps de residència cel·lular (TRC) és
igual al temps de residència hidràulic (TRH), i fixant un TRH adequat es pot aconseguir
rentar els NOB del sistema tot mantenint els AOB en el reactor (Hellinga et al. 1998;
Mosquera-Corral et al. 2005). No obstant això, aquest procés només és viable si es
treballa a temperatures entre 30-35ºC.
- Concentració d’oxigen dissolt
S’ha trobat que els NOB tenen una menor afinitat per l’oxigen que els AOB. Això es
reflecteix en el valor del coeficient d’afinitat per l’oxigen que és menor pels AOB que
pels NOB (Guisasola et al. 2005). Aquest fet pot ser aprofitat per aconseguir la
nitrificació parcial limitant l’activitat dels NOB amb baixes concentracions d’oxigen
dissolt (OD). Malgrat això, en sistemes de biomassa en suspensió és pràcticament
impossible eliminar completament l’activitat NOB només amb una disminució de la
concentració d’OD (Ruiz et al. 2003; Wang and Yang 2004; Wyffels et al. 2004). En
canvi, en sistemes de biopel·lícula s’ha demostrat que el factor clau per aconseguir una
nitrificació parcial estable i completa és la limitació per oxigen dels NOB (Bartroli et al.
2010).
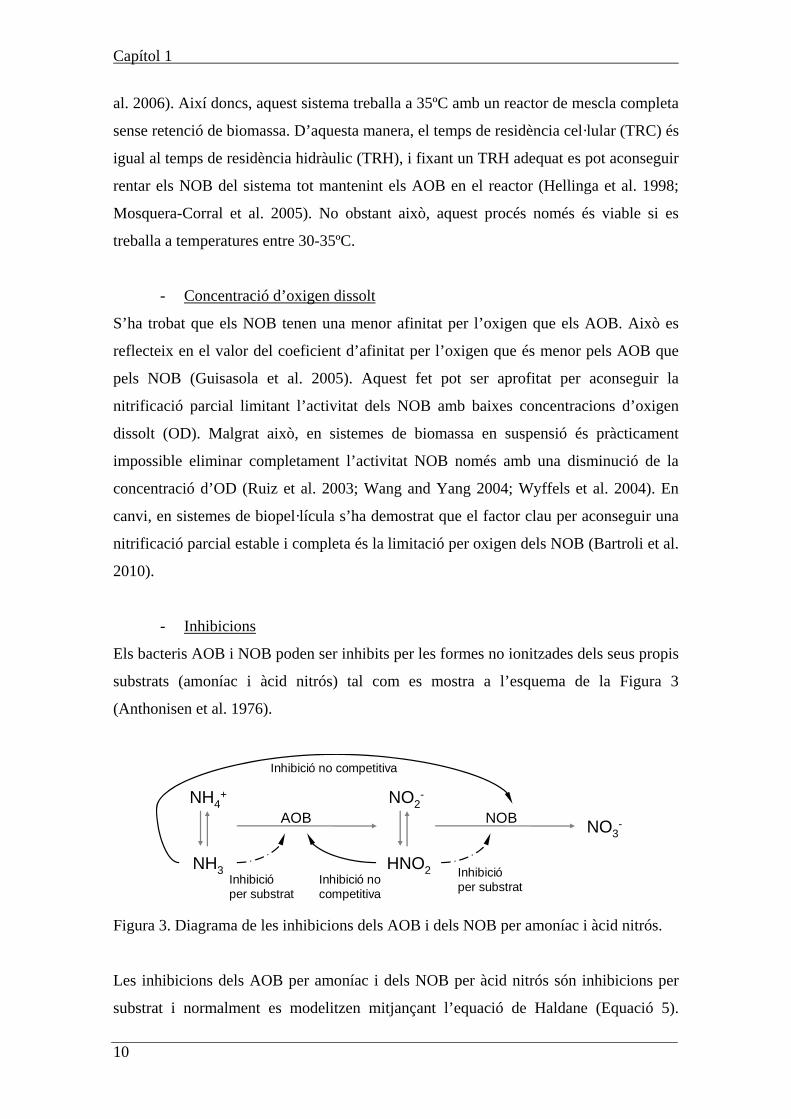
- Inhibicions
Els bacteris AOB i NOB poden ser inhibits per les formes no ionitzades dels seus propis
substrats (amoníac i àcid nitrós) tal com es mostra a l’esquema de la Figura 3
(Anthonisen et al. 1976).
NH4+ NO2
-
NO3-
NH3 HNO2
AOB NOB
Inhibicióper substrat
Inhibició no competitiva
Inhibicióper substrat
Inhibició no competitiva
Figura 3. Diagrama de les inhibicions dels AOB i dels NOB per amoníac i àcid nitrós.
Les inhibicions dels AOB per amoníac i dels NOB per àcid nitrós són inhibicions per
substrat i normalment es modelitzen mitjançant l’equació de Haldane (Equació 5).
Introducció
11
D’altra banda les inhibicions dels AOB per àcid nitrós i dels NOB per amoníac són
inhibicions no competitives i normalment es modelitzen amb l’Equació 6.
IS K
SSK
Srr
2max
(5)
IK
Krr
I
I
max (6)
On r és la velocitat de consum del substrat, rmax és la màxima velocitat de consum del
substrat, S és la concentració de substrat, KS és la constant d’afinitat pel substrat, KI és la
constant d’inhibició del compost inhibitori i I és la concentració del compost inhibitori.
Anthonisen et al. (1976) van demostrar que els NOB s’inhibeixen a concentracions
d’amoníac entre 0.1 i 1.0 mg L-1, i els AOB entre 10 i 150 mg L-1. Per tant, els NOB es
veuran molt més afectats per concentracions altes d’amoníac. Tot i així, el fet
d’aconseguir la nitrificació parcial utilitzant la major inhibició dels NOB té possibles
inconvenients, com ara la possibilitat de que els AOB també s’inhibeixin per una gran
acumulació d’amoníac o d’àcid nitrós (Carrera et al. 2004b) i la possibilitat de que els
NOB, amb el temps, s’aclimatin a l’amoníac tot deixant d’estar inhibits (Turk and
Mavinic 1989). No obstant això, s’ha demostrat experimentalment que es pot
aconseguir una nitrificació parcial estable en un sistema de fangs actius afavorint la
inhibició per amoníac a un pH elevat utilitzant més d’un reactor en sèrie (Jubany et al.
2009a).
1.3.3 Nitrificació parcial i Anammox
Aquest procés és el més innovador de tots els presentats a l’inici del capítol. El primer
pas consisteix en oxidar només el 50% de l’amoni d’entrada fins a nitrit, tot mantenint
el 50% restant sense oxidar. Aquest pas té certes diferències respecte la nitrificació
parcial comentada anteriorment ja que en el sistema anterior es pretén oxidar el 100%
de l’amoni fins a nitrit. Per tal d’obtenir un corrent amb una relació amoni-nitrit al 50%
es pot utilitzar un sistema de nitrificació parcial on es tracti la meitat del cabal d’aigua
residual oxidant tot l’amoni fins a nitrit. L’altra meitat del cabal seria derivat i mesclat
amb l’efluent del sistema nitrificant. Una altra alternativa és obtenir directament el 50%
de nitrificació parcial en un reactor nitrificant. Això s’aconsegueix, generalment,
Capítol 1
12
limitant la capacitat nitrificant del sistema per manca d’alcalinitat. Si l’aigua d’entrada
només conté la meitat de l’alcalinitat necessària per compensar tots els protons produïts
en l’oxidació de l’amoni, el pH baixarà a partir d’haver oxidat la meitat de l’amoni
present, fent cinèticament impossible l’oxidació de la resta d’amoni (Van Dongen et al.
2001; Okabe et al. 2011; Zhang et al. 2011). D’altra banda, és conegut que la
nitrificació és un procés que es troba limitat per carboni inorgànic (Wett and Rauch
2003; Guisasola et al. 2007) i, per tant, aquestes condicions d’operació podrien fer
disminuir la velocitat de nitrificació. A més, s’hauria d’estudiar l’efecte de les
inhibicions d’amoníac i d’àcid nitrós en condicions de limitació per carboni inorgànic.
El segon pas d’aquesta tecnologia (procés Anammox) és realitzat per uns bacteris
autòtrofs capaços d’oxidar l’amoni a nitrogen gas en condicions anòxiques utilitzant el
nitrit com a acceptor d’electrons. En aquest procés no es necessita afegir una font de
carboni orgànic i aproximadament un 10% del nitrogen es transforma a nitrat.
L’estequiometria del procés Anammox és la següent (Strous et al. 1998):
NH4+ + 1.32 NO2
- + 0.066 HCO3- + 0.13 H+1.02 N2 + 0.26 NO3
- + 0.066 CH2O0.5N0.15
+ 2.03 H2O (7)
Aquest procés té una sèrie d’avantatges importants (Strous et al. 1998; Liu et al. 2008):
- Al requerir només l’oxidació del 50% de l’amoni de l’aigua residual, la demanda
d’oxigen es redueix considerablement.
- Al ser una desnitrificació autòtrofa no es necessita afegir una font de carboni externa
per aigües amb baixa relació DQO/N.
- La producció de biomassa és baixa ja que el rendiment biomassa/substrat dels bacteris
Anammox és molt baix. Això disminueix considerablement els costos de tractament
de fangs.
Tot i els avantatges comentats anteriorment, el creixement extremadament lent
d’aquests bacteris (tenen un temps de duplicació d’11 dies (Strous et al. 1998)) i la
dificultat de trobar un inòcul amb prou presència d’aquests microorganismes, fan que la
posada en marxa d’un reactor Anammox sigui lenta. En el primer reactor Anammox que
es va construir a escala industrial a Rotterdam (Holanda), tot i que es va inocular amb
biomassa Anammox procedent d’una planta pilot, la posada en marxa va durar entre 3 i
Introducció
13
4 anys (van der Star et al. 2007). Tot i així, actualment hi ha onze reactors Anammox
operant a escala industrial arreu del món (Paques 2011). Una altra problemàtica que
presenta aquest procés és la inhibició per substrat dels bacteris Anammox a baixes
concentracions de nitrit. La inhibició s’inicia a partir de 20-30 mg N-NO2- L-1 i és
pràcticament total a 70 mg N-NO2 L-1 (Schmidt et al. 2003; Li et al. 2004). A més a
més, també s’ha observat inhibició per oxigen a concentracions per sobre de 0.042 mg
L-1 (Schmidt et al. 2003; Kuenen 2008).
Tot i així, s’han desenvolupat un cert nombre de processos que combinen la nitritació
amb el procés Anammox i que es poden agrupar en sistemes d’una i dues biomasses.
- Sistema de dues biomasses
El procés Anammox necessita un influent amb una relació amoni/nitrit de 1:1.3, per tant
es necessita un reactor de nitrificació parcial capaç de produir un efluent amb aquestes
característiques. Actualment el més utilitzat, sobretot a escala industrial, és el procés
SHARON/Anammox (Van Dongen et al. 2001; Hwang et al. 2005). No obstant això,
s’ha reportat que el procés SHARON/Anammox està limitat per la màxima càrrega que
pot tractar-se en el reactor SHARON (Jaroszynski and Oleszkiewicz 2011). Per tant,
s’han de dissenyar sistemes de nitrificació parcial que redueixin aquesta limitació amb
un augment de la càrrega tractada, com per exemple amb reactors continus de tanc
agitat amb sedimentador (Ciudad et al. 2005), reactors discontinus (Ganigue et al.
2009), reactors airlift amb biomassa granular (Bartroli et al. 2010), reactors airlift amb
biopel·lícula (Furukawa et al. 2009) o reactors de llit fluïditzat (Qiao et al. 2010).
- Sistema d’una biomassa
Aquest sistema consisteix en un sol reactor granular airejat que és capaç de fer la
nitritació simultàniament amb procés Anammox. Això s’aconsegueix perquè la part
interna dels grànuls està ocupada per bacteris Anammox i l’externa per bacteris AOB.
Els sistemes més utilitzats són: CANON (eliminació autòtrofa completa del nitrogen via
nitrit) (Sliekers et al. 2002; Third et al. 2005) i OLAND (nitrificació i desnitrificació
autòtrofa per limitació d’oxigen) (Kuai and Verstraete 1998; Windey et al. 2005).
Aquests sistemes es fonamenten en subministrar oxigen al procés per tal que l’oxidació
de l’amoni només arribi a nitrit. Llavors, degut a la falta d’un acceptor d’electrons, el
nitrit és consumit pels bacteris Anammox amb la resta d’amoni.
Capítol 1
14
Els principals inconvenients i avantatges de cadascun dels dos sistemes es troben
resumits en diferents treballs de recopilació (Van Hulle et al. 2010; Jaroszynski and
Oleszkiewicz 2011).
1.3.4 Nitrificació i desnitrificació autòtrofa
El primer pas d’aquesta tecnologia és la nitrificació convencional comentada
anteriorment, on l’amoni és oxidat a nitrat. Posteriorment aquest nitrat s’ha de reduir a
nitrogen gas tot utilitzant com a font d’energia hidrogen (Lee and Rittmann 2002;
Mansell and Schroeder 2002; Rezania et al. 2007) o compostos derivats del sofre, tals
com H2S, S, S2O32-, S4O6
2- o SO32- (Trouve et al. 1998; Kimura et al. 2002;
Kleerebezem and Mendez 2002; Soares 2002). Al tractar-se de bacteris autòtrofs
utilitzen CO2 com a font de carboni. Les equacions estequiomètriques de desnitrificació
autòtrofa utilitzant hidrogen (Lee and Rittmann 2002) i els diferents compostos derivats
del sofre (Campos et al. 2008) es presenten a continuació:
NO3- + 3.03 H2 + H+ + 0.229 CO2 0.0458 C5H7O2N + 0.477 N2 + 3.37 H2O (8)
0.844 S2O32- + NO3
- + 0.347 CO2 + 0.086 HCO3- + 0.086 NH4
+ + 0.434 H2O
1.689 SO42- + 0.500 N2 + 0.086 C5H7O2N + 0.697 H+ (9)
0.421 H2S + 0.421 HS- + NO3- + 0.346 CO2 + 0.086 HCO3
- + 0.086 NH4+
0.842 SO42- + 0.500 N2 + 0.086 C5H7O2N + 0.434 H2O + 0.262 H+ (10)
1.10 S0 + NO3- + 0.76 H2O + 0.40 CO2 + 0.08 NH4
+
1.10 SO42- + 0.50 N2 + 0.08 C5H7O2N + 1.28 H+ (11)
Comparada amb la desnitrificació heteròtrofa convencional, la desnitrificació autòtrofa
té dos grans avantatges: (1) no requereix d’una font externa de carboni orgànic com per
exemple metanol o etanol, que incrementarien els costos d’operació; i (2) es produeix
una menor quantitat de llots (Claus and Kutzner 1985; Zhang and Lampe 1999).
Últimament s’ha donat més importància a la desnitrificació autòtrofa amb productes
derivats del sofre que a la que utilitza hidrogen, degut al preu i a la dificultat de la
utilització d’aquest últim. D’altra banda, com es pot observar en les equacions (9)-(11),
la desnitrificació autòtrofa amb derivats del sofre incrementa la concentració de sulfats
en l’aigua residual i consumeix alcalinitat.
Introducció
15
Com que una possible aplicació d’aquests processos és el tractament d’una aigua
residual amb una alta concentració de nitrogen amoniacal, durant el primer pas de
nitrificació es produirà una gran quantitat de nitrat. Posteriorment, el procés de
desnitrificació autòtrofa amb productes derivats del sofre, aquesta alta concentració de
nitrat produirà una important quantitat de sulfats que poden esdevenir un problema de
producció de sulfit en condicions anaeròbies.
A més, el consum d’alcalinitat, tant en el procés de nitrificació, com en el procés de
desnitrificació autòtrofa, provoca que en aigües residuals amb un baix contingut
d’alcalinitat aquesta s’hagi d’addicionar externament per tal d’evitar un important
descens del pH. Aquesta possible addició d’alcalinitat comporta un important
incrementant en els costos d’operació del sistema. En molts casos s’ha utilitzat pedra
calcària com a font d’alcalinitat i de carboni inorgànic (Flere and Zhang 1999; Zhang
and Lampe 1999; Liu and Koenig 2002). Tot i que la utilització de pedra calcària
sembla ser una metodologia econòmica i efectiva per compensar el consum d’alcalinitat,
també té alguns inconvenients com l’increment de la duresa de l’aigua, l’increment de
sòlids totals en l’efluent i la baixa solubilitat del CaCO3, que dificulta el
subministrament de l’alcalinitat suficient (Oh et al. 2001) quan es tracta una aigua
residual amb una alta concentració de nitrat.
Recentment, en alguns estudis s’ha desenvolupat un sistema de dos passos on es
combina la desnitrificació heteròtrofa i l’autòtrofa (Kim and Bae 2000; Lee et al. 2001;
Liu et al. 2009). En aquest sistema, inicialment es redueix una part del nitrat utilitzant la
desnitrificació heteròtrofa, posteriorment la part restant del nitrat es redueix utilitzant la
desnitrificació autòtrofa amb compostos derivats del sofre. D’aquesta manera, en la
desnitrificació heteròtrofa es produeix alcalinitat i hidroxils (Equació 3) que
posteriorment es consumeixen en la desnitrificació autòtrofa (Equacions 9-11). Així
s’aconsegueix mantenir el pH constant i s’obté una bona eliminació de nitrat.
Capítol 1
16
1.4 Motivacions de la recerca i presentació de la tesi
Aquesta tesi es troba emmarcada en una de les línies del grup de recerca GENOCOV
(Grup de tractament biològic d’efluents líquids i gasosos: Eliminació de Nutrients,
Olors i Compostos Orgànics Volàtils) del Departament d’Enginyeria Química de la
Universitat Autònoma de Barcelona. Aquest grup és un grup de recerca consolidat de la
Generalitat de Catalunya (referència 2009 SGR 815).
Aquesta tesi és una continuació de la recerca iniciada per la Dra. Irene Jubany, que va
desenvolupar l’operació, la modelització i el control mitjançant velocitats de consum
d’oxigen (oxygen uptake rate, OUR) d’un sistema de nitrificació total (a nitrat) i de
nitrificació parcial (a nitrit) en llots actius tot tractant un corrent d’alta concentració
d’amoni (Jubany 2007). En la seva tesi es va definir un sistema de control de la càrrega
basat en la mesura de l’activitat nitrificant amb l’OUR tot modificant el cabal d’entrada
(Jubany et al. 2008). Es va desenvolupar un sistema de nitrificació parcial estable amb
llots actius treballant en continu, demostrant que la causa del rentat total dels NOB era
la combinació de diversos factors d’operació (inhibició per amoníac, inhibició per àcid
nitrós, temperatura i limitació per oxigen). Malgrat aquesta combinació es va observar
que el factor més important era la inhibició per amoníac (Jubany et al. 2009a). A més,
es va desenvolupar, calibrar i validar un model matemàtic per aquest procés (Jubany et
al. 2005; Jubany et al. 2009b). No obstant això, van quedar diversos temes per estudiar.
Es va treballar amb una molt elevada concentració d’amoni a l’aigua d’entrada (3000
mg N-NH4+ L-1) que afavoreix aconseguir la nitrificació parcial per l’efecte de les
inhibicions per amoníac i àcid nitrós, però no es va provar a una concentració menor,
típica de l’aigua de rebuig (1000 mg N-NH4+ L-1). A més, es va demostrar l’estabilitat
del sistema amb 100 dies d’operació però alguns autors han reportat la dificultat de
mantenir la nitrificació parcial a més llarg termini (Villaverde et al. 2000; Yun and Kim
2003; Fux et al. 2004; Ma et al. 2009). No es va determinar el possible efecte combinat
de la inhibició per amoníac i àcid nitrós amb la limitació per carboni inorgànic, ni
l’efecte d’un llarg procés d’aturada sense alimentació.
En la present tesi, per tal de demostrar l’estabilitat d’aquest sistema durant un llarg
període de temps, es va operar durant 800 dies, obtenint els resultats presentats en
l’Article I d’aquest treball. Un cop aconseguida i optimitzada la nitrificació parcial, el
Introducció
17
pas següent va ser l’estudi del posterior tractament, la desnitrificació heteròtrofa des de
nitrit, amb els resultats presentats en l’Article II d’aquesta tesi. Tal com s’ha comentat
anteriorment, el principal cost del procés de desnitrificació és l’elevat preu de la font de
carboni que s’ha d’afegir. Per aquest motiu, en aquesta tesi s’han provat diverses fonts
de carboni més econòmiques a les normalment utilitzades (metanol i etanol). Per tal de
reduir costos d’operació s’han utilitzat com a font de carboni residus d’altres processos,
tals com llots primaris i secundaris d’EDAR, els quals s’han fermentat per obtenir una
major concentració de DQO soluble, glicerol (subproducte de les plantes de producció
de biodiesel) i lixiviats d’abocador. Anteriorment, s’havia estudiat la viabilitat d’alguna
d’aquestes fonts de carboni en processos de desnitrificació des de nitrat (ÆsØy et al.
1998; Fernández-Nava et al. 2010), però no des de nitrit. Part d’aquests resultats s’han
realitzat en una estada de 4 mesos a la University of Manitoba (Winnipeg, Canadà).
Tal com s’ha comentat anteriorment, al tractar-se d’un procés d’eliminació biològica,
els sistemes de nitrificació parcial en aigües residuals industrials presenten una
problemàtica addicional, ja que aquestes aigües no presenten un cabal amb unes
condicions constants durant tot l’any. Moltes indústries paren la seva producció, i per
tant també la producció de l’aigua residual a tractar, durant algunes setmanes o inclús
un mes. Això significa que, durant aquest període, el sistema de tractament biològic no
rebrà aliment. En l’Article III es van estudiar les millors condicions d’aturada d’un
sistema de nitrificació parcial (anòxic, aerobi, o diferents combinacions d’aquests), així
com la seva posterior recuperació després de 30 dies d’aturada.
S’ha observat que molts sistemes de nitrificació parcial obtenen un efluent idoni per un
reactor Anammox aprofitant que algunes aigües com ara l’aigua de rebuig contenen
l’alcalinitat justa per tal d’oxidar només la meitat de l’amoni d’entrada. Això significa
que aquests sistemes treballen, durant certs períodes, en condicions limitants de carboni
inorgànic i, a la vegada, amb altes concentracions d’amoníac i àcid nitrós. Per tant, es va
estudiar l’efecte de les inhibicions per amoníac i per àcid nitrós dels AOB en condicions
limitants de carboni inorgànic per establir les possibles interaccions entre aquests
processos. Aquests resultats es presenten en l’Article IV.


Capítol 2
Objectius

Objectius
21
2 Objectius L’objectiu principal d’aquesta tesi és l’obtenció d’un sistema d’eliminació biològica de
nitrogen via nitrit a escala pilot pel tractament d’aigües residuals amb elevada
concentració d’amoni i poc contingut en matèria orgànica, tals com l’aigua de rebuig de
l’assecatge de fangs d’EDAR o altres aigües industrials. El sistema a estudiar estarà
basat en configuracions de dos llots amb una primera etapa de nitritació autotròfica i
una segona etapa de desnitritació heterotròfica.
El primer pas per a assolir l’objectiu principal és l’obtenció d’un sistema de nitrificació
parcial de fangs actius que pugui operar de forma estable i robusta a llarg termini.
Posteriorment es tractarà l’efluent del sistema de nitrificació parcial en un sistema de
desnitrificació de fangs actius per tal de poder tancar el cicle d’eliminació biològica de
nitrogen per la via del nitrit. A més, es buscaran alternatives a les típiques fonts externes
de carboni orgànic (metanol i etanol) per tal de poder-ne abaratir els costos d’operació.
Un cop demostrada la viabilitat del sistema d’eliminació biològica de nitrogen via nitrit
s’estudiarà la problemàtica que pot aparèixer en algunes indústries degut a les possibles
aturades temporals en el sistema de producció que poden tenir conseqüències en
l’activitat dels microorganismes. Per tant, es desenvoluparà i aplicarà una estratègia
d’aturada del sistema de nitrificació parcial, així com la seva posterior recuperació
després d’un llarg període sense estar alimentat.
Finalment, es vol estudiar l’efecte de les inhibicions, tant d’amoníac com d’àcid nitrós,
en sistemes que es troben en condicions limitants de carboni inorgànic, ja que poden
aparèixer aquestes condicions d’operació en el sistema de nitritació. A més, es vol
calcular les constants d’inhibició tant en condicions limitants com en condicions no
limitants de carboni inorgànic.


Capítol 3
Resultats i discussió

Resultats i discussió
25
3 Resultats i discussió En aquesta secció es presenta un breu resum dels resultats obtinguts en aquesta tesi i la
seva discussió. Una descripció més detallada amb un major anàlisi d’aquests resultats es
pot trobar en el recull dels articles que es presenta a l’Apèndix I.
3.1 Eliminació de nitrogen via nitrit
Tal com s’ha comentat anteriorment, en el nostre grup de recerca s’havia desenvolupat
un sistema de nitrificació parcial amb un llaç de control basat en la mesura d’OUR.
Inicialment es va partir d’un sistema de nitrificació total i amb el canvi d’alguns
paràmetres d’operació tals com el pH i la concentració d’OD es va assolir un sistema de
nitrificació parcial. En aquest cas s’ha utilitzat la mateixa planta pilot que s’havia
utilitzat prèviament, formada per tres reactors en sèrie de 26 L cadascun, juntament amb
un sedimentador de 25 L, però s’ha inoculat directament amb el fang d’una EDAR i
s’ha operat la planta pilot per tal d’obtenir una ràpida posada en marxa d’un sistema de
nitrificació parcial. A la Figura 4 es presenta un esquema de la planta pilot utilitzada
amb els llaços de control corresponents.
L’aliment utilitzat ha estat una aigua sintètica que simula la concentració típica de
l’aigua de rebuig. Així doncs, aquest corrent d’entrada contenia una alta concentració
d’amoni (1150±150 mg N-NH4+ L-1) amb una baixa concentració de demanda química
d’oxigen biodegradable (DQOb) en forma d’acetat (30-35 mg O2 L-1).

Capítol 3
26
OD
TpH
OD
T
pH
OD
T
pH
Recirculacióinterna
Recirculacióexterna
Na 2C
O3
Influent
Aire
Efluent
R2 R1 R3
SedimentadorN
a 2CO
3
Control Cabal
COD COD COD
CT CT
CT
CpH CpH
Estimacióde la OUR
OUR MitjanaOURsp
Figura 4. Esquema de la planta pilot on es mostren els llaços de control. CT és el control
de temperatura, COD és el control d’oxigen dissolt i CpH és el control de pH.
Per tal d’afavorir la nitrificació parcial s’han fixat els següents paràmetres d’operació:
- Temperatura de 30ºC. A part d’afavorir el creixement dels AOB en front dels
NOB a temperatures superiors a 20ºC (Hunik et al. 1994) l’objectiu d’aquest
treball ha estat simular el tractament de l’aigua de rebuig, i aquesta aigua es
troba a una temperatura al voltant dels 30ºC.
- pH de 8.3. La configuració de tres reactors en sèrie permet obtenir un
gradient de concentracions d’amoni entre el primer i el tercer reactor. Això
permet obtenir una concentració elevada d’amoni en els dos primers reactors,
que combinada amb el pH elevat de 8.3, fa que la concentració d’amoníac
sigui inhibitòria pels NOB tot afectant el menys possible als AOB. En el
tercer reactor s’aplica el llaç de control per OUR amb un punt de consigna
fixat del 40% de la OUR en el primer reactor. Aquest punt de consigna
permet que la concentració d’amoni en el tercer reactor, i també a la sortida,
sigui menor de 1 mg N L-1 degut a la baixa constant d’afinitat dels AOB per
l’amoni.
- Concentració d’OD de 2.0 mg L-1. Aquesta concentració relativament baixa
d’oxigen permet que els NOB es trobin al voltant de la seva constant
Resultats i discussió
27
d’afinitat per oxigen (1.75 mg L-1, (Guisasola et al. 2005)) i per tant estiguin
limitats per oxigen. D’altra banda, els AOB es troben menys afectats per la
concentració d’OD que els NOB perquè tenen una constant d’afinitat menor
(0.74 mg L-1; Guisasola et al. (2005)).
Apart dels paràmetres comentats, s’ha fixat un TRC de 8±3 dies. Aquest TRC baix
permet que els NOB es rentin del sistema al trobar-se clarament desfavorits en front dels
AOB per les condicions d’operació aplicades (Ahn et al. 2008; Jubany et al. 2009a).
Mantenint aquests paràmetres d’operació es va assolir una posada en marxa molt ràpida.
En tan sols 30 dies es va aconseguir tractar un cabal d’entrada més de 10 vegades
superior al cabal inicial i la població d’AOB va passar de 2±0.5% a 72±10% del total de
bacteris. D’altra banda, pel que fa als NOB se’n va assolir el 2±1% al final de la posada
en marxa, la qual cosa demostra que s’han vist molt desafavorits en front dels AOB.
Aquest baix percentatge de NOB va veure’s reflectit en un important percentatge de
nitrit a la sortida (85%).
Hi ha sistemes de nitrificació parcial que funcionen correctament durant un cert període
de temps però després perden la capacitat d’acumular nitrit (Villaverde et al. 2000; Fux
et al. 2004). Per tant, una vegada finalitzada la posada en marxa del sistema, aquest es
va operar durant 800 dies per tal de demostrar que el sistema format per tres reactors en
sèrie treballant amb un TRC baix i amb un llaç de control de la càrrega aplicada, és
capaç de mantenir la nitrificació parcial a llarg termini de forma estable. Durant tot
aquest període s’ha obtingut un efluent amb pràcticament un 100% de nitrogen en forma
de nitrit i només en tres períodes curts el percentatge de nitrit va disminuir al 70%, sent
la resta nitrat. Precisament aquests períodes on va disminuir el percentatge
d’acumulació de nitrit van correspondre a períodes on el TRC havia augmentat per una
millora en les propietats de sedimentació de la biomassa. Per compensar la menor
pèrdua de sòlids del sistema es va purgar més i per tant es va disminuir el TRC de nou,
tot recuperant l’acumulació de pràcticament el 100% de nitrit. Per tant, s’ha pogut
observar la importància de treballar amb un TRC baix per tal d’obtenir un sistema de
nitrificació parcial de forma estable. Pel que fa als percentatges d’AOB i NOB, aquests
es van mantenir a 80±7% i menor al 1%, respectivament.
Capítol 3
28
D’altra banda la càrrega volumètrica mitjana tractada pel sistema durant els 800 dies
d’operació va ser de 2.0±0.4 g N L-1 d-1 a 30ºC. Aquesta càrrega va ser molt superior a
la de 0.72 g N L-1 d-1 obtinguda anteriorment per Jubany et al. (2009a) a 25ºC. El motiu
principal és perquè en aquest sistema s’ha treballat amb un TRC de 8±3 dies, molt
menor als 30 dies amb els que van treballar Jubany et al. (2009a). Treballar amb un
TRC menor implica que la concentració de biomassa en el sistema també és menor,
però a la vegada aquesta biomassa té una major capacitat específica d’oxidació d’amoni
(Pollice et al. 2002; Munz et al. 2010).
Després d’obtenir, de forma estable, un efluent amb una concentració aproximadament
del 100% de nitrit, s’ha investigat la posterior desnitrificació heteròtrofa d’aquest nitrit
(desnitritació). Tal com s’ha comentat anteriorment, la desnitrificació heteròtrofa
requereix d’una font de carboni que pot ser interna, present a la pròpia aigua residual, o
externa, addicionada externament. Normalment, les fonts de carboni externes més
utilitzades són l’etanol i el metanol (Christensson et al. 1994; Carrera et al. 2003),
perquè es poden trobar de forma abundant i relativament econòmica. A més,
proporcionen unes bones velocitats de desnitrificació (Christensson et al. 1994; Carrera
et al. 2003). Tot i ser productes relativament barats, aquests augmenten
significativament els costos d’operació en el procés d’eliminació del nitrogen. Per tant,
en aquesta tesi s’han estudiat diverses fonts de carboni econòmicament més viables i
més sostenibles des d’un punt de vista ambiental tals com els llots primaris i secundaris
fermentats, lixiviats d’abocador i una solució de glicerol que simula un residu de la
indústria del biodiesel. S’han avaluat les velocitats de desnitritació amb aquestes fonts
alternatives de carboni orgànic en un reactor SBR i s’han comparat amb l’obtinguda
amb l’etanol.
S’han obtingut uns bons resultats de desnitritació amb glicerol, etanol, llots primaris
fermentats i lixiviats utilitzant un reactor SBR sense control de pH i a una temperatura
de 23ºC. La càrrega específica més elevada s’ha obtingut amb el glicerol (0.25±0.05 g N
g-1 SSV d-1) mentre que amb l’etanol, lixiviats d’abocador i llots primaris fermentats
s’han obtingut càrregues més baixes (0.17, 0.16 i 0.13 g N g-1SSV d-1, respectivament).
D’altra banda, pel que fa als llots secundaris fermentats, s’ha obtingut una velocitat de
desnitritació molt baixa degut, probablement, a la baixa DQO biodegradable obtinguda
amb la fermentació d’aquest residu (Gavala et al. 2003; Arnaiz et al. 2006).
Resultats i discussió
29
D’altra banda, utilitzant els lixiviats d’abocador com a font externa de carboni s’ha
observat un increment important de la quantitat de sòlids inorgànics en el sistema, amb
una relació SSV/SST de 0.42 quan amb la resta de fonts de carboni, aquesta relació s’ha
mantingut constant al voltant de 0.80. Aquesta part important de sòlids inorgànics prové
de la precipitació de les sals que es formen a partir de l’alt contingut d’ions Ca2+ i Mg2+
i el bicarbonat dels lixiviats (Lozecznik et al. 2010).
Com que les necessitats de DQO per al procés de desnitritació depenen específicament
del tipus de matèria orgànica utilitzada, s’han mesurat els requeriments de cadascuna de
les fonts utilitzades, obtenint unes necessitats molt menors per l’etanol i el glicerol (3.0 i
3.8 mg DQO/mg N, respectivament) que pels llots primaris fermentats (5.5 mg
DQO/mg N) o pels lixiviats d’abocador (8.8 mg DQO/mg N). Aquest consum s’ha de
tenir molt en compte quan la font de carboni s’ha de comprar a preu de mercat. Tot i
així, una relació elevada no ha de ser necessàriament dolenta ja que, per exemple, l’alt
contingut de DQO que tenen els lixiviats d’abocador s’ha d’eliminar igualment ja que és
un residu que ha de ser tractat.
3.2 Estudi de diferents condicions d’aturada d’un
sistema de nitrificació parcial i posterior
recuperació
Una de les problemàtiques que poden presentar els sistemes de nitrificació parcial
aplicats al tractament d’aigües industrials és l’aturada durant un llarg període de temps
per requeriments de producció. L’objectiu d’aquest treball era obtenir les millors
condicions d’aturada del sistema (ja sigui en condicions aeròbies, anòxiques o alternant
les dues) i comprovar si és possible la posterior recuperació de la planta pilot (Figura 4)
després d’haver estat aturada sense aliment durant 30 dies.
Per a estudiar l’efecte d’aquesta aturada s’han omplert quatre reactors de 25 L cadascun
amb biomassa nitrificant i s’han deixat d’alimentar en condicions diferents. Un s’ha
mantingut en condicions anòxiques, un altre en condicions aeròbies i finalment dos
Capítol 3
30
reactors en els quals s’han alternat les condicions anòxiques i aeròbies (un 1h aerobi i
5h anòxic i un altre 1h aerobi i 23h anòxic). Durant el mes en el qual no s’han alimentat
els reactors, s’ha fet un seguiment de la pèrdua d’activitat mitjançant tècniques
respiromètriques i també s’ha fet un seguiment de la pèrdua de biomassa nitrificant
mitjançant l’anàlisi FISH (Fluorescence in situ hybridization). Finalment s’han mesclat
les biomasses dels quatre reactors en la planta pilot i s’ha tornat a posar en marxa.
Mitjançant el seguiment de l’activitat (mesurat amb OUR) que s’ha realitzat durant els
30 dies d’aturada del sistema, s’han pogut calcular les diferents velocitats de mort dels
AOB en les diferents condicions d’operació. Aquesta velocitat de mort ha estat més
baixa en condicions anòxiques (0.11±0.01 d-1) i més elevada a mesura que la fracció
aeròbia s’anava incrementant (0.14±0.02 d-1 pel reactor que estava 1 h aerobi i 23 h
anòxic i 0.19±0.02 d-1 pel que va operar a 1 h aerobi i 5 h anòxic). Finalment, pel
reactor completament aerobi la velocitat de mort va ser de 0.24±0.02 d-1. Aquest
augment de la velocitat de mort en condicions aeròbies front les condicions anòxiques
també va ser observat per altres autors (Siegrist et al. 1999; Lee and Oleszkiewicz
2003).
Mitjançant l’anàlisi FISH s’ha determinat la disminució dels AOB al llarg dels 30 dies
d’aturada del sistema. Igual que en el cas de les activitats per OUR, s’ha observat que la
disminució dels AOB ha estat més accentuada a mesura que la fracció aeròbia era
major. Tot i així, a partir de 20 dies d’aturada de l’alimentació, el percentatge dels AOB
mesurat amb FISH era pràcticament zero en els quatre reactors, determinant que en cas
d’haver d’aturar un sistema nitrificant la millor opció és que aquesta aturada no
sobrepassi els 15 dies. D’altra banda també s’han quantificat els NOB en els quatre
reactors. Pel que fa aquests bacteris, s’ha observat un increment del percentatge en els
reactors aerobis, degut a que en aquests reactors tenen oxigen per poder oxidar el nitrit
present en el medi en el moment d’aturar el sistema i, conseqüentment, poden créixer i
augmentar el percentatge. D’altra banda en el reactor anòxic no s’ha observat cap
increment dels NOB degut a que en aquest reactor no tenen oxigen per a poder oxidar el
nitrit. Aquest creixement dels NOB en els reactors aerobis dificultaria la posterior
recuperació de la nitrificació parcial, i per tant és un motiu més que confirma que si s’ha
d’aturar un sistema de nitrificació parcial és millor fer-ho en condicions anòxiques.
Resultats i discussió
31
Finalment, per tal de recuperar el sistema de nitrificació parcial es va mesclar la
biomassa dels quatre reactors. La fracció d’AOB en aquests quatre reactors era molt
semblant i es va mesclar per tal de tenir una major concentració de biomassa i així poder
obtenir una recuperació del sistema més ràpida. Des del moment inicial es va connectar
el llaç de control de la càrrega d’entrada amb l’OUR com a variable mesurada, el qual
permetia anar augmentant la càrrega d’entrada de tal manera que la quantitat d’amoni
que entra al sistema és la quantitat d’amoni que aquest pot consumir, tot evitant les
possibles acumulacions d’amoni. La càrrega d’entrada va augmentar ràpidament dels
0.05 g N L-1 d-1 inicials a 1.2 g N L-1 d-1 a 30ºC en tan sols 5 dies, tot obtenint un 98%
de nitrit en l’efluent. D’aquesta manera es va demostrar que es pot recuperar un sistema
de nitrificació parcial que ha estat aturat sense alimentació durant un llarg període de
temps i que el llaç de control utilitzat és una bona forma de recuperar-lo ràpidament.
3.3 Estudi de les limitacions per carboni inorgànic
Molts sistemes de nitrificació parcial utilitzats pel tractament de l’aigua de rebuig de la
digestió anaeròbia aprofiten, per tal d’obtenir un efluent adequat per a un reactor
Anammox, el fet de que aquesta aigua conté aproximadament la meitat de carboni
inorgànic necessari per oxidar tot el nitrogen amoniacal (Gali et al. 2007). Aquests
sistemes treballen sense control de pH, deixant que pràcticament s’esgoti el carboni
inorgànic. Per tant, aquests sistemes poden treballar en condicions limitants de carboni
inorgànic i com a conseqüència la velocitat de nitritació es pot veure afectada (Wett and
Rauch 2003; Guisasola et al. 2007). En aquesta tesis s’ha comprovat que pel sol fet de
treballar en condicions limitants de carboni inorgànic, sense limitació ni inhibició de
cap altre compost, la velocitat de nitritació es veu reduïda a un 75 % de la velocitat
màxima.
A més, al tractar-se d‘aigües residuals amb alta concentració d’amoni, les
concentracions d’amoni i nitrit als reactors nitrificants poden ser elevades. És conegut
que els AOB s’inhibeixen a altes concentracions d’amoníac i d’àcid nitrós (Anthonisen
et al. 1976). El que no es coneix és si existeix un efecte sinèrgic entre les limitacions per
carboni inorgànic i les inhibicions per amoníac i àcid nitrós. Per tant, s’ha estudiat
l’efecte d’aquestes inhibicions en sistemes limitats per carboni inorgànic.
Capítol 3
32
Pel que fa a la inhibició per amoníac dels AOB, s’ha comprovat que es pot modelitzar
com una inhibició per substrat de tipus Haldane i s’ha observat un increment d’aquesta
inhibició quan el sistema es troba en condicions limitants de carboni inorgànic. La
constant d’inhibició va disminuir de 376±45 a 139±17 mg NH3 L-1. A més, la constant
d’afinitat pel substrat va augmentar de 0.28±0.04 a 4.3±0.7 mg NH3 L-1, fet que indica
que es necessita una concentració més elevada d’amoni per obtenir la mateixa velocitat
de nitritació quan el sistema treballa amb limitació de carboni inorgànic. D’altra banda,
la inhibició per àcid nitrós dels AOB es va ajustar al tipus d’inhibició no competitiva i
es va comprovar que està fortament afectada quan es treballa en condicions limitants de
carboni inorgànic. En aquest cas la constant d’inhibició va disminuir de 1.32±0.14 a
0.21±0.02 mg HNO2 L-1 quan es treballa amb limitacions de carboni inorgànic. S’ha de
considerar que els sistemes de nitrificació parcial que treballen en condicions de
limitació per carboni inorgànic, també ho fan a un pH baix, normalment igual o inferior
a 7 (Feng et al. 2007; Ganigue et al. 2007). La comprovació de que la inhibició per àcid
nitrós dels AOB augmenta amb la limitació per carboni inorgànic té una gran
rellevància en aquests sistemes ja que al treballar a pH lleugerament àcid, la
concentració d’àcid nitrós augmenta i com a conseqüència, la inhibició dels AOB es veu
incrementada per la suma dels dos efectes. Per exemple, una concentració d’àcid nitrós
de 0.5 mg HNO2 L-1 sense limitació per carboni inorgànic suposa una disminució de la
velocitat màxima de nitritació del 28 %, però en canvi, en condicions limitants per
carboni inorgànic aquesta disminució és del 70 %. Això té un efecte molt important
sobre la càrrega tractada o sobre el volum de disseny del reactor.

Capítol 4
Conclusions

Conclusions
35
4 Conclusions S’ha demostrat que és possible obtenir un sistema de nitrificació parcial de fangs actius
que treballi en continu i que estigui format per tres reactors agitats en sèrie i un
sedimentador. El sistema s’ha operat de forma estable durant un llarg període de temps
tot utilitzant un control fonamentat en la mesura de l’OUR als reactors i tractant una
aigua sintètica amb una concentració d’amoni de 1000 mg N L-1 que simula l’aigua de
rebuig d’una EDAR. S’ha assolit una càrrega mitjana molt elevada, al voltant de 2.0 g N
L-1 d-1, a la temperatura de 30ºC. A més, s’ha aconseguit fer un rentat selectiu dels NOB
tot combinant la inhibició per amoníac i les limitacions per oxigen dissolt juntament
amb la selecció d’un temps de residència cel·lular adequat.
Un cop desenvolupat el sistema de nitrificació parcial, s’ha estudiat la posterior
desnitritació en un reactor SBR sense control de pH. Al tractar-se d’una desnitrificació
heteròtrofa s’han utilitzat diferents fonts de carboni tals com l’etanol, el glicerol, els
llots primaris i secundaris fermentats i finalment els lixiviats d’abocador. S’han obtingut
elevades velocitats de desnitrificació per tots els compostos menys pels llots secundaris
fermentats, ja que són de difícil fermentació. Els reactors s’han inoculat amb biomassa
convencional d’EDAR, i després de 20 dies de posada en marxa s’ha obtingut una
càrrega volumètrica al voltant de 0.2 g N L-1 d-1 pel glicerol, etanol i lixiviats
d’abocador. Les velocitats específiques d’eliminació de nitrit han estat, de major a
menor: glicerol > etanol > lixiviats d’abocador > llots primaris fermentats. Tot i haver
obtingut una elevada velocitat d’eliminació de nitrit utilitzant els lixiviats d’abocador
s’ha observat que no és la millor font de carboni que es pot utilitzar degut a un
increment important de la fracció inorgànica de la biomassa. D’altra banda s’han
obtingut uns requeriments de DQO/N en la desnitrificació heteròtrofa que varien entre
3.0 per l’etanol i 8.8 pels lixiviats d’abocador.
En aquesta tesi s’ha demostrat que un llarg període d’aturada (30 dies) del sistema de
nitrificació parcial de fangs actius no suposa un gran inconvenient per a la
implementació del sistema a escala industrial ja que es pot aconseguir amb facilitat la
seva recuperació després del període d’aturada. Després de l’aturada, el sistema s’ha
recuperat en tan sols 5 dies d’operació tot obtenint la mateixa càrrega de 1.2 g N L-1 que
Capítol 4
36
s’havia assolit anteriorment a la parada i amb una acumulació de nitrit del 98 %. S’ha
demostrat que les millors condicions de conservació dels AOB i la seva activitat durant
l’aturada són condicions anòxiques i que, a mesura que s’incrementa la fracció aeròbia
en les condicions de conservació, la velocitat de mort dels AOB es veu incrementada.
Amb l’anàlisi FISH s’ha corroborat aquest increment de la mort en incrementar la fase
aeròbia i, a més, s’ha observat que la fracció d’AOB disminueix dràsticament a partir
dels 17 dies d’aturada, el que significa que si s’ha d’aturar un sistema de nitrificació
parcial és millor no fer-ho més de dues setmanes. També s’ha observat un increment de
la fracció de NOB en condicions aeròbies, ja que aquests poden consumir l’oxigen i el
nitrit present en el medi en el moment d’aturar el sistema.
S’ha demostrat que els AOB es poden inhibir per amoníac i per àcid nitrós i que
aquestes dues inhibicions s’incrementen quan els AOB es troben limitats per carboni
inorgànic. Pel que fa a la inhibició per amoníac, la seva cinètica s’ha ajustat a un model
d’inhibició per substrat de tipus Haldane, tot obtenint unes constants d’inhibició de 139
i 376 mg NH3 L-1 en condicions limitants i no limitants de carboni inorgànic,
respectivament. A més, s’ha observat que la constant d’afinitat s’ha incrementat de 0.28
mg NH3 L-1 sense limitacions per carboni inorgànic a 4.3 mg NH3 L-1 en condicions
limitants. D’altra banda, la cinètica d’inhibició dels AOB per àcid nitrós s’ha ajustat a
un model d’inhibició no competitiva, obtenint també un increment considerable
d’aquesta inhibició en condicions limitants de carboni inorgànic (passant d’una constant
d’inhibició de 1.31 mg HNO2 L-1 sense limitació per carboni inorgànic a 0.21 mg HNO2
L-1 en condicions limitants). Finalment, també s’ha observat que només pel fet d’estar
en condicions limitants de carboni inorgànic la velocitat màxima d’oxidació d’amoni es
veu reduïda al 75 %.

Capítol 5
Bibliografia

Bibliografia
39
5 Bibliografia ÆsØy, A., Ødegaard, H., Bach, K., Pujol, R. and Hamon, M., 1998. Denitrification in a
packed bed biofilm reactor (BIOFOR) - Experiments with different carbon
sources. Water Res. 32,(5), 1463-1470.
Ahn, J. H., Yu, R. and Chandran, K., 2008. Distinctive microbial ecology and
biokinetics of autotrophic ammonia and nitrite oxidation in a partial nitrification
Bioreactor. Biotechnol. Bioeng. 100,(6), 1078-1087.
Ahn, Y. H., 2006. Sustainable nitrogen elimination biotechnologies: A review. Process
Biochem. 41,(8), 1709-1721.
Anthonisen, A. C., Loehr, R. C., Prakasam, T. B. S. and Srinath, E. G., 1976. Inhibition
of nitrification by ammonia and nitrous acid. J. Water Pollut. Control Fed.
48,(5), 835-852.
Arnaiz, C., Gutierrez, J. C. and Lebrato, J., 2006. Biomass stabilization in the anaerobic
digestion of wastewater sludges. Bioresour. Technol. 97,(10), 1179-1184.
Aslan, S. and Dahab, M., 2008. Nitritation and denitritation of ammonium-rich
wastewater using fluidized-bed biofilm reactors. J. Hazard. Mater. 156,(1-3), 56-
63.
Bartroli, A., Perez, J. and Carrera, J., 2010. Applying Ratio Control in a Continuous
Granular Reactor to Achieve Full Nitritation under Stable Operating Conditions.
Environ. Sci. Technol. 44,(23), 8930-8935.
Bougard, D., Bernet, N., Cheneby, D. and Delgenes, J. P., 2006. Nitrification of a high-
strength wastewater in an inverse turbulent bed reactor: Effect of temperature on
nitrite accumulation. Process Biochem. 41,(1), 106-113.
Campos, J. L., Carvalho, S., Portela, R., Mosquera-Corral, A. and Méndez, R., 2008.
Kinetics of denitrification using sulphur compounds: Effects of S/N ratio,
endogenous and exogenous compounds. Bioresour. Technol. 99,(5), 1293-1299.
Carrera, J., Baeza, J. A., Vicent, T. and Lafuente, J., 2003. Biological nitrogen removal
of high-strength ammonium industrial wastewater with two-sludge system.
Water Res. 37,(17), 4211-4221.
Carrera, J., Vicent, T. and Lafuente, J., 2004a. Effect of influent COD/N ratio on
biological nitrogen removal (BNR) from high-strength ammonium industrial
wastewater. Process Biochem. 39,(12), 2035-2041.
Capítol 5
40
Carrera, J., Jubany, I., Carvallo, L., Chamy, R. and Lafuente, J., 2004b. Kinetic models
for nitrification inhibition by ammonium and nitrite in a suspended and an
immobilised biomass systems. Process Biochem. 39,(9), 1159-1165.
Carrera, J., Bartrolí, A., Isanta, E., Jubany, I., Torà, J. A., Baeza, J. A. and Pérez, J.,
2011. Advanced technology for the biological nitrogen removal of the reject
water from the sludge dewatering systems. Reduction, Modification and
Valorisation of Sludge (REMOVALS). C. Bengoa, A. Fabregat, J. Font and F.
Stüber. London, IWA Publishing. 101-116.
Christensson, M., Lie, E. and Welander, T., 1994. A Comparison between Ethanol and
Methanol as Carbon-Sources for Denitrification. Water Sci. Technol. 30,(6), 83-
90.
Ciudad, G., Rubilar, O., Muñoz, P., Ruiz, G., Chamy, R., Vergara, C. and Jeison, D.,
2005. Partial nitrification of high ammonia concentration wastewater as a part of
a shortcut biological nitrogen removal process. Process Biochem. 40,(5), 1715-
1719.
Claus, G. and Kutzner, H. J., 1985. Physiology and Kinetics of Autotrophic
Denitrification by Thiobacillus-Denitrificans. Appl. Microbiol. Biotechnol.
22,(4), 283-288.
Dodds, W. K., Bouska, W. W., Eitzmann, J. L., Pilger, T. J., Pitts, K. L., Riley, A. J.,
Schloesser, J. T. and Thornbrugh, D. J., 2009. Eutrophication of US
Freshwaters: Analysis of Potential Economic Damages. Environ. Sci. Technol.
43,(1), 12-19.
EEA, 2002. European Environmental Agency. Environmental signals.
http://reports.eea.europa.eu/environmental_assessment_report_2002_9/en.
Feng, Y. J., Tseng, S. K., Hsia, T. H., Ho, C. M. and Chou, W. P., 2007. Partial
nitrification of ammonium-rich wastewater as pretreatment for anaerobic
ammonium oxidation (Anammox) using membrane aeration Bioreactor. J.
Biosci. Bioeng. 104,(3), 182-187.
Fernández-Nava, Y., Marañón, E., Soons, J. and Castrillón, L., 2010. Denitrification of
high nitrate concentration wastewater using alternative carbon sources. J.
Hazard. Mater. 173,(1-3), 682-688.
Flere, J. M. and Zhang, T. C., 1999. Nitrate removal with sulfur-limestone autotrophic
denitrification processes. J. Environ. Eng.-ASCE 125,(8), 721-729.
Bibliografia
41
Furukawa, K., Inatomi, Y., Qiao, S., Quan, L., Yamamoto, T., Isaka, K. and Sumino, T.,
2009. Innovative treatment system for digester liquor using anammox process.
Bioresour. Technol. 100,(22), 5437-5443.
Fux, C., Huang, D., Monti, A. and Siegrist, H., 2004. Difficulties in maintaining long-
term partial nitritation of ammonium-rich sludge digester liquids in a moving-
bed biofilm reactor (MBBR). Water Sci. Technol. 49(11-12),(53-60.
Fux, C. and Siegrist, H., 2004. Nitrogen removal from sludge digester liquids by
nitrification/denitrification or partial nitritation/anammox: Environmental and
economical considerations. Water Sci. Technol. 50,(10), 19-26.
Gali, A., Dosta, J., van Loosdrecht, M. C. M. and Mata-Alvarez, J., 2007. Two ways to
achieve an anammox influent from real reject water treatment at lab-scale:
Partial SBR nitrification and SHARON process. Process Biochem. 42,(4), 715-
720.
Ganigue, R., López, H., Balaguer, M. D. and Colprim, J., 2007. Partial ammonium
oxidation to nitrite of high ammonium content urban landfill leachates. Water
Res. 41,(15), 3317-3326.
Ganigue, R., Gabarro, J., Sanchez-Melsio, A., Ruscalleda, M., Lopez, H., Vila, X.,
Colprim, J. and Balaguer, M. D., 2009. Long-term operation of a partial
nitritation pilot plant treating leachate with extremely high ammonium
concentration prior to an anammox process. Bioresour. Technol. 100,(23), 5624-
5632.
Gavala, H. N., Yenal, U., Skiadas, I. V., Westermann, P. and Ahring, B. K., 2003.
Mesophilic and thermophilic anaerobic digestion of primary and secondary
sludge. Effect of pre-treatment at elevated temperature. Water Res. 37,(19),
4561-4572.
Guisasola, A., Jubany, I., Baeza, J. A., Carrera, J. and Lafuente, J., 2005. Respirometric
estimation of the oxygen affinity constants for biological ammonium and nitrite
oxidation. J. Chem. Technol. Biotechnol. 80,(4), 388-396.
Guisasola, A., Petzet, S., Baeza, J. A., Carrera, J. and Lafuente, J., 2007. Inorganic
carbon limitations on nitrification: Experimental assessment and modelling.
Water Res. 41,(2), 277-286.
Gujer, W., Henze, M., Mino, T. and Van Loosdrecht, M., 1999. Activated Sludge
Model No. 3. Water Sci. Technol. 39,(1), 183-193.
Capítol 5
42
Hellinga, C., Schellen, A. A. J. C., Mulder, J. W., Van Loosdrecht, M. C. M. and
Heijnen, J. J., 1998. The SHARON process: An innovative method for nitrogen
removal from ammonium-rich waste water. Water Sci. Technol. 37(9),(135-142.
Henze, M., van Loosdrecht, M., Ekama, G. A. and Brdjanovic, D., 2008. Biological
wastewater treatment: Principles, Modelling and Design. London, IWA
Publishing.
Hunik, J. H., Tramper, J. and Wijffels, R. H., 1994. A strategy to scale up nitrification
processes with immobilized cells of Nitrosomonas europaea and Nitrobacter
agilis. Bioprocess Eng. 11,(2), 73-82.
Hwang, I. S., Min, K. S., Choi, E. and Yun, Z., 2005. Nitrogen removal from piggery
waste using the combined SHARON and ANAMMOX process. Water Sci.
Technol. 52,(10-11), 487-494.
Janus, H. M. and Van Der Roest, H. F., 1997. Don't reject the idea of treating reject
water. Water Sci. Technol. 35,(10), 27-34.
Jaroszynski, L. W. and Oleszkiewicz, J. A., 2011. Autotrophic ammonium removal
from reject water: partial nitrification and anammox in one-reactor versus two-
reactor systems. Environ. Technol. 32,(3), 289-294.
Jubany, I., Baeza, J. A., Carrera, J. and Lafuente, J., 2005. Respirometric calibration and
validation of a biological nitrite oxidation model including biomass growth and
substrate inhibition. Water Res. 39,(18), 4574-4584.
Jubany, I., 2007. Operation, modeling and automatic control of complete and partial
nitrification of highly concentrated ammonium wastewater. PhD Thesis,
Universitat Autònoma de Barcelona, http://hdl.handle.net/10803/5310.
Jubany, I., Carrera, J., Lafuente, J. and Baeza, J. A., 2008. Start-up of a nitrification
system with automatic control to treat highly concentrated ammonium
wastewater: Experimental results and modeling. Chem. Eng. J. 144,(3), 407-419.
Jubany, I., Lafuente, J., Baeza, J. A. and Carrera, J., 2009a. Total and stable washout of
nitrite oxidizing bacteria from a nitrifying continuous activated sludge system
using automatic control based on Oxygen Uptake Rate measurements. Water
Res. 43,(11), 2761-2772.
Jubany, I., Antonio Baeza, J., Lafuente, J. and Carrera, J., 2009b. Model-based study of
nitrite accumulation with OUR control in two continuous nitrifying activated
sludge configurations. Water Sci. Technol. 60,(10), 2685-2693.
Bibliografia
43
Kim, E. W. and Bae, J. H., 2000. Alkalinity requirements and the possibility of
simultaneous heterotrophic denitrification during sulfur-utilizing autotrophic
denitrification. Water Sci. Technol. 42,(3-4), 233-238.
Kimura, K., Nakamura, M. and Watanabe, Y., 2002. Nitrate removal by a combination
of elemental sulfur-based denitrification and membrane filtration. Water Res.
36,(7), 1758-1766.
Kleerebezem, R. and Mendez, R., 2002. Autotrophic denitrification for combined
hydrogen sulfide removal from biogas and post-denitrification. Water Sci.
Technol. 45,(10), 349-356.
Kuai, L. P. and Verstraete, W., 1998. Ammonium removal by the oxygen-limited
autotrophic nitrification-denitrification system. Appl. Environ. Microbiol.
64,(11), 4500-4506.
Kuenen, J. G., 2008. Anammox bacteria: from discovery to application. Nat. Rev.
Microbiol. 6,(4), 320-326.
Lee, D. U., Lee, I. S., Choi, Y. D. and Bae, J. H., 2001. Effects of external carbon
source and empty bed contact time on simultaneous heterotrophic and sulfur-
utilizing autotrophic denitrification. Process Biochem. 36,(12), 1215-1224.
Lee, K.-C. and Rittmann, B. E., 2002. Applying a novel autohydrogenotrophic hollow-
fiber membrane biofilm reactor for denitrification of drinking water. Water Res.
36,(8), 2040-2052.
Lee, Y. and Oleszkiewicz, J. A., 2003. Effects of predation and ORP conditions on the
performance of nitrifiers in activated sludge systems. Water Res. 37,(17), 4202-
4210.
Li, X., Zen, G., Rosenwinkel, K. H., Kunst, S., Weichgrebe, D., Cornelius, A. and
Yang, Q., 2004. Start up of deammonification process in one single SBR system.
Water Sci. Technol. 50,(6), 1-8.
Liu, H., Jiang, W., Wan, D. and Qu, J., 2009. Study of a combined heterotrophic and
sulfur autotrophic denitrification technology for removal of nitrate in water. J.
Hazard. Mater. 169,(1-3), 23-28.
Liu, L. H. and Koenig, A., 2002. Use of limestone for pH control in autotrophic
denitrification: batch experiments. Process Biochem. 37,(8), 885-893.
Liu, S. T., Yang, F. L., Xue, Y., Gong, Z., Chen, H. H., Wang, T. and Su, Z. C., 2008.
Evaluation of oxygen adaptation and identification of functional bacteria
Capítol 5
44
composition for anammox consortium in non-woven biological rotating
contactor. Bioresour. Technol. 99,(17), 8273-8279.
Lozecznik, S., Sparling, R., Oleszkiewicz, J. A., Clark, S. and VanGulck, J. F., 2010.
Leachate treatment before injection into a bioreactor landfill: Clogging potential
reduction and benefits of using methanogenesis. Waste Manage. 30,(11), 2030-
2036.
Ma, Y., Peng, Y., Wang, S., Yuan, Z. and Wang, X., 2009. Achieving nitrogen removal
via nitrite in a pilot-scale continuous pre-denitrification plant. Water Res. 43,(3),
563-572.
Mansell, B. O. and Schroeder, E. D., 2002. Hydrogenotrophic denitrification in a
microporous membrane bioreactor. Water Res. 36,(19), 4683-4690.
Mosquera-Corral, A., Gonzalez, F., Campos, J. L. and Mendez, R., 2005. Partial
nitrification in a SHARON reactor in the presence of salts and organic carbon
compounds. Process Biochem. 40,(9), 3109-3118.
Munz, G., Mori, G., Vannini, C. and Lubello, C., 2010. Kinetic parameters and
inhibition response of ammonia- and nitrite-oxidizing bacteria in membrane
bioreactors and conventional activated sludge processes. Environ. Technol.
31,(14), 1557-1564.
Oh, S. E., Yoo, Y. B., Young, J. C. and Kim, I. S., 2001. Effect of organics on sulfur-
utilizing autotrophic denitrification under mixotrophic conditions. J. Biotechnol.
92,(1), 1-8.
Okabe, S., Oshiki, M., Takahashi, Y. and Satoh, H., 2011. Development of long-term
stable partial nitrification and subsequent anammox process. Bioresour. Technol.
102,(13), 6801-6807.
Paques, 2011. http://www.paques.nl/pageid=66/ANAMMOX®.html.
Paredes, D., Kuschk, P., Mbwette, T. S. A., Stange, F., Muller, R. A. and Koser, H.,
2007. New aspects of microbial nitrogen transformations in the context of
wastewater treatment - A review. Eng. Life Sci. 7,(1), 13-25.
Peng, Y. and Zhu, G., 2006. Biological nitrogen removal with nitrification and
denitrification via nitrite pathway. Appl. Microbiol. Biotechnol. 73,(1), 15-26.
Pollice, A., Tandoi, V. and Lestingi, C., 2002. Influence of aeration and sludge retention
time on ammonium oxidation to nitrite and nitrate. Water Res. 36,(10), 2541-
2546.
Bibliografia
45
Qiao, S., Matsumoto, N., Shinohara, T., Nishiyama, T., Fujii, T., Bhatti, Z. and
Furukawa, K., 2010. High-rate partial nitrification performance of high
ammonium containing wastewater under low temperatures. Bioresour. Technol.
101,(1), 111-117.
Rezania, B., Oleszkiewicz, J. A. and Cicek, N., 2007. Hydrogen-dependent
denitrification of water in an anaerobic submerged membrane bioreactor coupled
with a novel hydrogen delivery system. Water Res. 41,(5), 1074-1080.
Ruiz, G., Jeison, D. and Chamy, R., 2003. Nitrification with high nitrite accumulation
for the treatment of wastewater with high ammonia concentration. Water Res.
37,(6), 1371-1377.
Schmidt, I., Sliekers, O., Schmid, M., Bock, E., Fuerst, J., Kuenen, J. G., Jetten, M. S.
M. and Strous, M., 2003. New concepts of microbial treatment processes for the
nitrogen removal in wastewater. FEMS Microbiol. Rev. 27,(4), 481-492.
Siegrist, H., Brunner, I., Koch, G., Phan, L. C. and Le, V. C., 1999. Reduction of
biomass decay rate under anoxic and anaerobic conditions. Water Sci. Technol.
39,(1), 129-137.
Sipma, J., Osuna, M. B., Emanuelsson, M. A. E. and Castro, P. M. L., 2010.
Biotreatment of Industrial Wastewaters under Transient-State Conditions:
Process Stability with Fluctuations of Organic Load, Substrates, Toxicants, and
Environmental Parameters. Crit. Rev. Environ. Sci. Technol. 40,(2), 147-197.
Sliekers, A. O., Derwort, N., Gomez, J. L. C., Strous, M., Kuenen, J. G. and Jetten, M.
S. M., 2002. Completely autotrophic nitrogen removal over nitrite in one single
reactor. Water Res. 36,(10), 2475-2482.
Soares, M. I. M., 2002. Denitrification of groundwater with elemental sulfur. Water
Res. 36,(5), 1392-1395.
Strous, M., Heijnen, J. J., Kuenen, J. G. and Jetten, M. S. M., 1998. The sequencing
batch reactor as a powerful tool for the study of slowly growing anaerobic
ammonium-oxidizing microorganisms. Appl. Microbiol. Biotechnol. 50,(5),
589-596.
Teichgräber, B. and Stein, A., 1994. Nitrogen elimination from sludge treatment reject
water - Comparison of the steam-stripping and denitrification processes. Water
Sci. Technol. 30,(6), 41-51.
Capítol 5
46
Third, K. A., Paxman, J., Schmid, M., Strous, M., Jetten, M. S. M. and Cord-Ruwisch,
R., 2005. Treatment of nitrogen-rich wastewater using partial nitrification and
Anammox in the CANON process. Water Sci. Technol. 52,(4), 47-54.
Trouve, C., Chazal, P. M., Gueroux, B. and Sauvaitre, N., 1998. Denitrification by new
strains of Thiobacillus denitrificans under non-standard physicochemical
conditions. Effect of temperature, pH, and sulphur source. Environ. Technol.
19,(6), 601-610.
Turk, O. and Mavinic, D. S., 1987. Benefits of using selective inhibition to remove
nitrogen from highly nitrogenous wastes. Environ. Technol. Lett. 8,(9), 419-426.
Turk, O. and Mavinic, D. S., 1989. Maintaining nitrite build-up in a system acclimated
to free ammonia. Water Res. 23,(11), 1383-1388.
US-EPA, 1993. Manual of Nitrogen Control. Washington, DC, USA, EPA 625/r-
93/010.
van der Star, W. R. L., Abma, W. R., Blommers, D., Mulder, J.-W., Tokutomi, T.,
Strous, M., Picioreanu, C. and van Loosdrecht, M. C. M., 2007. Startup of
reactors for anoxic ammonium oxidation: Experiences from the first full-scale
anammox reactor in Rotterdam. Water Res. 41,(18), 4149-4163.
Van Dongen, U., Jetten, M. S. M. and Van Loosdrecht, M. C. M., 2001. The
SHARON®-Anammox® process for treatment of ammonium rich wastewater.
Water Sci. Technol. 44,(1), 153-160.
Van Hulle, S. W. H., Vandeweyer, H. J. P., Meesschaert, B. D., Vanrolleghem, P. A.,
Dejans, P. and Dumoulin, A., 2010. Engineering aspects and practical
application of autotrophic nitrogen removal from nitrogen rich streams. Chem.
Eng. J. 162,(1), 1-20.
Villaverde, S., Fdz-Polanco, F. and García, P. A., 2000. Nitrifying biofilm acclimation
to free ammonia in submerged biofilters. Start-up influence. Water Res. 34,(2),
602-610.
Wang, J. L. and Yang, N., 2004. Partial nitrification under limited dissolved oxygen
conditions. Process Biochem. 39,(10), 1223-1229.
Wett, B., Rostek, R., Rauch, W. and Ingerle, K., 1998. pH-controlled reject-water-
treatment. Water Sci. Technol. 37,(12), 165-172.
Wett, B. and Rauch, W., 2003. The role of inorganic carbon limitation in biological
nitrogen removal of extremely ammonia concentrated wastewater. Water Res.
37,(5), 1100-1110.
Bibliografia
47
Wiesmann, U., 1994. Biological nitrogen removal from wastewater. Advances in
Biochemical Engineering Biotechnology; Biotechnics/wastewater. A. Fiechter.
Springer-Verlag, Heidelberger Platz 3, D-1000 Berlin, Germany 175 Fifth
Avenue, New York, New York 10010, USA. 51: 113-154.
Windey, K., De Bo, I. and Verstraete, W., 2005. Oxygen-limited autotrophic
nitrification-denitrification (OLAND) in a rotating biological contactor treating
high-salinity wastewater. Water Res. 39,(18), 4512-4520.
Wun Jern, N. G., 2006. Industrial Wastewater Treatment. London, Imperial College
Press.
Wyffels, S., Van Hulle, S. W. H., Boeckx, P., Volcke, E. I. P., Van Cleemput, O.,
Vanrolleghem, P. A. and Verstraete, W., 2004. Modeling and simulation of
oxygen-limited partial nitritation in a membrane-assisted bioreactor (MBR).
Biotechnol. Bioeng. 86,(5), 531-542.
Yun, H. J. and Kim, D. J., 2003. Nitrite accumulation characteristics of high strength
ammonia wastewater in an autotrophic nitrifying biofilm reactor. J. Chem.
Technol. Biotechnol. 78,(4), 377-383.
Zhang, L., Yang, J., Hira, D., Fujii, T. and Furukawa, K., 2011. High-rate partial
nitrification treatment of reject water as a pretreatment for anaerobic ammonium
oxidation (anammox). Bioresour. Technol. 102,(4), 3761-3767.
Zhang, T. C. and Lampe, D. G., 1999. Sulfur: limestone autotrophic denitrification
processes for treatment of nitrate-contaminated water: Batch experiments. Water
Res. 33,(3), 599-608.

Apèndix I
Articles acceptats


ITorà, J. A., Lafuente, J., Carrera, J. and Baeza, J. A.
Fast start-up and controlled operation during a long term period of a
high-rate partial nitrification activated sludge system
[Environmental Technology. 2011; doi: 10.1080/09593330.2011.626802]

This article was downloaded by: [Universidad Autonoma de Barcelona]On: 21 November 2011, At: 07:39Publisher: Taylor & FrancisInforma Ltd Registered in England and Wales Registered Number: 1072954 Registered office: Mortimer House,37-41 Mortimer Street, London W1T 3JH, UK
Environmental TechnologyPublication details, including instructions for authors and subscription information:http://www.tandfonline.com/loi/tent20
Fast start-up and controlled operation during along-term period of a high-rate partial nitrificationactivated sludge systemJosep A. Torà a , Javier Lafuente a , Julián Carrera a & Juan A. Baeza aa Departament d'Enginyeria Química, Escola d'Enginyeria, Universitat Autònoma deBarcelona, Barcelona, Spain
Available online: 17 Oct 2011
To cite this article: Josep A. Torà, Javier Lafuente, Julián Carrera & Juan A. Baeza (2011): Fast start-up and controlledoperation during a long-term period of a high-rate partial nitrification activated sludge system, Environmental Technology,DOI:10.1080/09593330.2011.626802
To link to this article: http://dx.doi.org/10.1080/09593330.2011.626802
PLEASE SCROLL DOWN FOR ARTICLE
Full terms and conditions of use: http://www.tandfonline.com/page/terms-and-conditions
This article may be used for research, teaching, and private study purposes. Any substantial or systematicreproduction, redistribution, reselling, loan, sub-licensing, systematic supply, or distribution in any form toanyone is expressly forbidden.
The publisher does not give any warranty express or implied or make any representation that the contentswill be complete or accurate or up to date. The accuracy of any instructions, formulae, and drug doses shouldbe independently verified with primary sources. The publisher shall not be liable for any loss, actions, claims,proceedings, demand, or costs or damages whatsoever or howsoever caused arising directly or indirectly inconnection with or arising out of the use of this material.

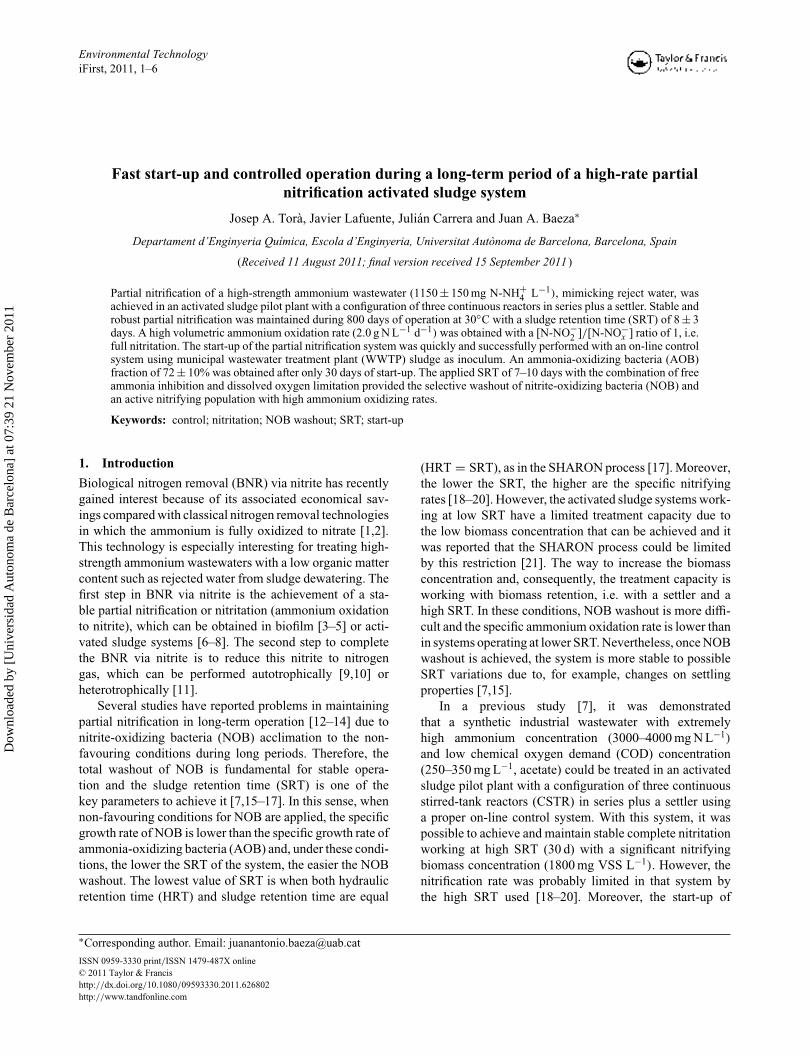
Environmental TechnologyiFirst, 2011, 1–6
Fast start-up and controlled operation during a long-term period of a high-rate partialnitrification activated sludge system
Josep A. Torà, Javier Lafuente, Julián Carrera and Juan A. Baeza∗
Departament d’Enginyeria Química, Escola d’Enginyeria, Universitat Autònoma de Barcelona, Barcelona, Spain
(Received 11 August 2011; final version received 15 September 2011 )
Partial nitrification of a high-strength ammonium wastewater (1150 ± 150 mg N-NH+4 L−1), mimicking reject water, was
achieved in an activated sludge pilot plant with a configuration of three continuous reactors in series plus a settler. Stable androbust partial nitrification was maintained during 800 days of operation at 30◦C with a sludge retention time (SRT) of 8 ± 3days. A high volumetric ammonium oxidation rate (2.0 g N L−1 d−1) was obtained with a [N-NO−
2 ]/[N-NO−x ] ratio of 1, i.e.
full nitritation. The start-up of the partial nitrification system was quickly and successfully performed with an on-line controlsystem using municipal wastewater treatment plant (WWTP) sludge as inoculum. An ammonia-oxidizing bacteria (AOB)fraction of 72 ± 10% was obtained after only 30 days of start-up. The applied SRT of 7–10 days with the combination of freeammonia inhibition and dissolved oxygen limitation provided the selective washout of nitrite-oxidizing bacteria (NOB) andan active nitrifying population with high ammonium oxidizing rates.
Keywords: control; nitritation; NOB washout; SRT; start-up
1. IntroductionBiological nitrogen removal (BNR) via nitrite has recentlygained interest because of its associated economical sav-ings compared with classical nitrogen removal technologiesin which the ammonium is fully oxidized to nitrate [1,2].This technology is especially interesting for treating high-strength ammonium wastewaters with a low organic mattercontent such as rejected water from sludge dewatering. Thefirst step in BNR via nitrite is the achievement of a sta-ble partial nitrification or nitritation (ammonium oxidationto nitrite), which can be obtained in biofilm [3–5] or acti-vated sludge systems [6–8]. The second step to completethe BNR via nitrite is to reduce this nitrite to nitrogengas, which can be performed autotrophically [9,10] orheterotrophically [11].
Several studies have reported problems in maintainingpartial nitrification in long-term operation [12–14] due tonitrite-oxidizing bacteria (NOB) acclimation to the non-favouring conditions during long periods. Therefore, thetotal washout of NOB is fundamental for stable opera-tion and the sludge retention time (SRT) is one of thekey parameters to achieve it [7,15–17]. In this sense, whennon-favouring conditions for NOB are applied, the specificgrowth rate of NOB is lower than the specific growth rate ofammonia-oxidizing bacteria (AOB) and, under these condi-tions, the lower the SRT of the system, the easier the NOBwashout. The lowest value of SRT is when both hydraulicretention time (HRT) and sludge retention time are equal
∗Corresponding author. Email: [email protected]
(HRT = SRT), as in the SHARON process [17]. Moreover,the lower the SRT, the higher are the specific nitrifyingrates [18–20]. However, the activated sludge systems work-ing at low SRT have a limited treatment capacity due tothe low biomass concentration that can be achieved and itwas reported that the SHARON process could be limitedby this restriction [21]. The way to increase the biomassconcentration and, consequently, the treatment capacity isworking with biomass retention, i.e. with a settler and ahigh SRT. In these conditions, NOB washout is more diffi-cult and the specific ammonium oxidation rate is lower thanin systems operating at lower SRT. Nevertheless, once NOBwashout is achieved, the system is more stable to possibleSRT variations due to, for example, changes on settlingproperties [7,15].
In a previous study [7], it was demonstratedthat a synthetic industrial wastewater with extremelyhigh ammonium concentration (3000–4000 mg N L−1)
and low chemical oxygen demand (COD) concentration(250–350 mg L−1, acetate) could be treated in an activatedsludge pilot plant with a configuration of three continuousstirred-tank reactors (CSTR) in series plus a settler usinga proper on-line control system. With this system, it waspossible to achieve and maintain stable complete nitritationworking at high SRT (30 d) with a significant nitrifyingbiomass concentration (1800 mg VSS L−1). However, thenitrification rate was probably limited in that system bythe high SRT used [18–20]. Moreover, the start-up of
ISSN 0959-3330 print/ISSN 1479-487X online© 2011 Taylor & Francishttp://dx.doi.org/10.1080/09593330.2011.626802http://www.tandfonline.com
Dow
nloa
ded
by [
Uni
vers
idad
Aut
onom
a de
Bar
celo
na]
at 0
7:39
21
Nov
embe
r 20
11
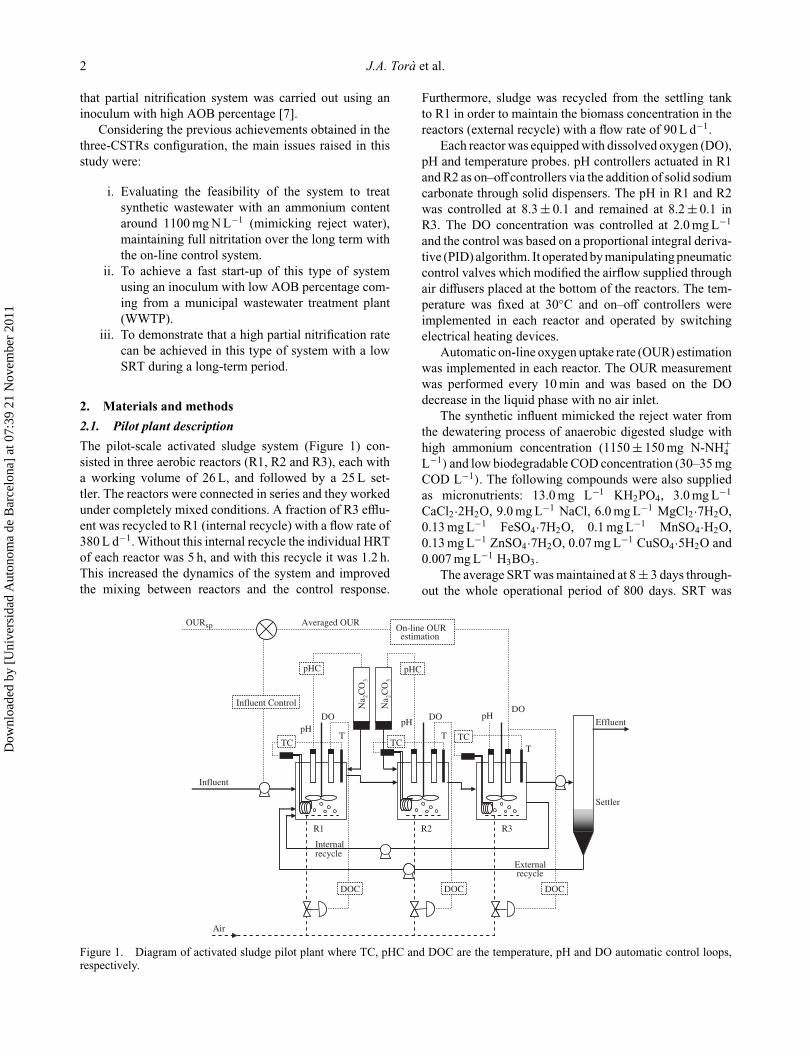
2 J.A. Torà et al.
that partial nitrification system was carried out using aninoculum with high AOB percentage [7].
Considering the previous achievements obtained in thethree-CSTRs configuration, the main issues raised in thisstudy were:
i. Evaluating the feasibility of the system to treatsynthetic wastewater with an ammonium contentaround 1100 mg N L−1 (mimicking reject water),maintaining full nitritation over the long term withthe on-line control system.
ii. To achieve a fast start-up of this type of systemusing an inoculum with low AOB percentage com-ing from a municipal wastewater treatment plant(WWTP).
iii. To demonstrate that a high partial nitrification ratecan be achieved in this type of system with a lowSRT during a long-term period.
2. Materials and methods2.1. Pilot plant descriptionThe pilot-scale activated sludge system (Figure 1) con-sisted in three aerobic reactors (R1, R2 and R3), each witha working volume of 26 L, and followed by a 25 L set-tler. The reactors were connected in series and they workedunder completely mixed conditions. A fraction of R3 efflu-ent was recycled to R1 (internal recycle) with a flow rate of380 L d−1. Without this internal recycle the individual HRTof each reactor was 5 h, and with this recycle it was 1.2 h.This increased the dynamics of the system and improvedthe mixing between reactors and the control response.
Furthermore, sludge was recycled from the settling tankto R1 in order to maintain the biomass concentration in thereactors (external recycle) with a flow rate of 90 L d−1.
Each reactor was equipped with dissolved oxygen (DO),pH and temperature probes. pH controllers actuated in R1and R2 as on–off controllers via the addition of solid sodiumcarbonate through solid dispensers. The pH in R1 and R2was controlled at 8.3 ± 0.1 and remained at 8.2 ± 0.1 inR3. The DO concentration was controlled at 2.0 mg L−1
and the control was based on a proportional integral deriva-tive (PID) algorithm. It operated by manipulating pneumaticcontrol valves which modified the airflow supplied throughair diffusers placed at the bottom of the reactors. The tem-perature was fixed at 30◦C and on–off controllers wereimplemented in each reactor and operated by switchingelectrical heating devices.
Automatic on-line oxygen uptake rate (OUR) estimationwas implemented in each reactor. The OUR measurementwas performed every 10 min and was based on the DOdecrease in the liquid phase with no air inlet.
The synthetic influent mimicked the reject water fromthe dewatering process of anaerobic digested sludge withhigh ammonium concentration (1150 ± 150 mg N-NH+
4L−1) and low biodegradable COD concentration (30–35 mgCOD L−1). The following compounds were also suppliedas micronutrients: 13.0 mg L−1 KH2PO4, 3.0 mg L−1
CaCl2·2H2O, 9.0 mg L−1 NaCl, 6.0 mg L−1 MgCl2·7H2O,0.13 mg L−1 FeSO4·7H2O, 0.1 mg L−1 MnSO4·H2O,0.13 mg L−1 ZnSO4·7H2O, 0.07 mg L−1 CuSO4·5H2O and0.007 mg L−1 H3BO3.
The average SRT was maintained at 8 ± 3 days through-out the whole operational period of 800 days. SRT was
DO
TpH
DO
T
pH
DO
T
pH
Internal recycle
External recycle
Na 2C
O3
Influent
Air
Effluent
R2 3R1R
Settler
Na 2C
O3
Influent Control
DOC DOC DOC
TC TC
TC
pHC pHC
On-line OUR estimation
Averaged OUROURsp
Figure 1. Diagram of activated sludge pilot plant where TC, pHC and DOC are the temperature, pH and DO automatic control loops,respectively.
Dow
nloa
ded
by [
Uni
vers
idad
Aut
onom
a de
Bar
celo
na]
at 0
7:39
21
Nov
embe
r 20
11
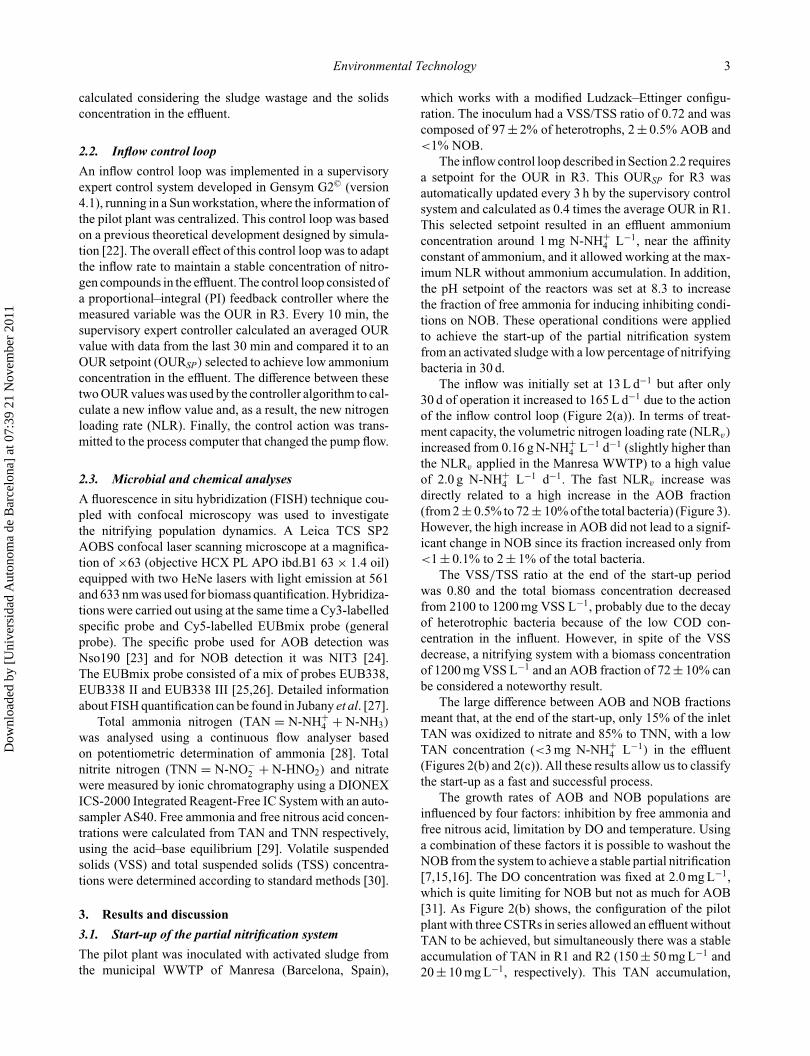
Environmental Technology 3
calculated considering the sludge wastage and the solidsconcentration in the effluent.
2.2. Inflow control loopAn inflow control loop was implemented in a supervisoryexpert control system developed in Gensym G2© (version4.1), running in a Sun workstation, where the information ofthe pilot plant was centralized. This control loop was basedon a previous theoretical development designed by simula-tion [22]. The overall effect of this control loop was to adaptthe inflow rate to maintain a stable concentration of nitro-gen compounds in the effluent. The control loop consisted ofa proportional–integral (PI) feedback controller where themeasured variable was the OUR in R3. Every 10 min, thesupervisory expert controller calculated an averaged OURvalue with data from the last 30 min and compared it to anOUR setpoint (OURSP) selected to achieve low ammoniumconcentration in the effluent. The difference between thesetwo OUR values was used by the controller algorithm to cal-culate a new inflow value and, as a result, the new nitrogenloading rate (NLR). Finally, the control action was trans-mitted to the process computer that changed the pump flow.
2.3. Microbial and chemical analysesA fluorescence in situ hybridization (FISH) technique cou-pled with confocal microscopy was used to investigatethe nitrifying population dynamics. A Leica TCS SP2AOBS confocal laser scanning microscope at a magnifica-tion of ×63 (objective HCX PL APO ibd.B1 63 × 1.4 oil)equipped with two HeNe lasers with light emission at 561and 633 nm was used for biomass quantification. Hybridiza-tions were carried out using at the same time a Cy3-labelledspecific probe and Cy5-labelled EUBmix probe (generalprobe). The specific probe used for AOB detection wasNso190 [23] and for NOB detection it was NIT3 [24].The EUBmix probe consisted of a mix of probes EUB338,EUB338 II and EUB338 III [25,26]. Detailed informationabout FISH quantification can be found in Jubany et al. [27].
Total ammonia nitrogen (TAN = N-NH+4 + N-NH3)
was analysed using a continuous flow analyser basedon potentiometric determination of ammonia [28]. Totalnitrite nitrogen (TNN = N-NO−
2 + N-HNO2) and nitratewere measured by ionic chromatography using a DIONEXICS-2000 Integrated Reagent-Free IC System with an auto-sampler AS40. Free ammonia and free nitrous acid concen-trations were calculated from TAN and TNN respectively,using the acid–base equilibrium [29]. Volatile suspendedsolids (VSS) and total suspended solids (TSS) concentra-tions were determined according to standard methods [30].
3. Results and discussion3.1. Start-up of the partial nitrification systemThe pilot plant was inoculated with activated sludge fromthe municipal WWTP of Manresa (Barcelona, Spain),
which works with a modified Ludzack–Ettinger configu-ration. The inoculum had a VSS/TSS ratio of 0.72 and wascomposed of 97 ± 2% of heterotrophs, 2 ± 0.5% AOB and<1% NOB.
The inflow control loop described in Section 2.2 requiresa setpoint for the OUR in R3. This OURSP for R3 wasautomatically updated every 3 h by the supervisory controlsystem and calculated as 0.4 times the average OUR in R1.This selected setpoint resulted in an effluent ammoniumconcentration around 1 mg N-NH+
4 L−1, near the affinityconstant of ammonium, and it allowed working at the max-imum NLR without ammonium accumulation. In addition,the pH setpoint of the reactors was set at 8.3 to increasethe fraction of free ammonia for inducing inhibiting condi-tions on NOB. These operational conditions were appliedto achieve the start-up of the partial nitrification systemfrom an activated sludge with a low percentage of nitrifyingbacteria in 30 d.
The inflow was initially set at 13 L d−1 but after only30 d of operation it increased to 165 L d−1 due to the actionof the inflow control loop (Figure 2(a)). In terms of treat-ment capacity, the volumetric nitrogen loading rate (NLRv)
increased from 0.16 g N-NH+4 L−1 d−1 (slightly higher than
the NLRv applied in the Manresa WWTP) to a high valueof 2.0 g N-NH+
4 L−1 d−1. The fast NLRv increase wasdirectly related to a high increase in the AOB fraction(from 2 ± 0.5% to 72 ± 10% of the total bacteria) (Figure 3).However, the high increase in AOB did not lead to a signif-icant change in NOB since its fraction increased only from<1 ± 0.1% to 2 ± 1% of the total bacteria.
The VSS/TSS ratio at the end of the start-up periodwas 0.80 and the total biomass concentration decreasedfrom 2100 to 1200 mg VSS L−1, probably due to the decayof heterotrophic bacteria because of the low COD con-centration in the influent. However, in spite of the VSSdecrease, a nitrifying system with a biomass concentrationof 1200 mg VSS L−1 and an AOB fraction of 72 ± 10% canbe considered a noteworthy result.
The large difference between AOB and NOB fractionsmeant that, at the end of the start-up, only 15% of the inletTAN was oxidized to nitrate and 85% to TNN, with a lowTAN concentration (<3 mg N-NH+
4 L−1) in the effluent(Figures 2(b) and 2(c)). All these results allow us to classifythe start-up as a fast and successful process.
The growth rates of AOB and NOB populations areinfluenced by four factors: inhibition by free ammonia andfree nitrous acid, limitation by DO and temperature. Usinga combination of these factors it is possible to washout theNOB from the system to achieve a stable partial nitrification[7,15,16]. The DO concentration was fixed at 2.0 mg L−1,which is quite limiting for NOB but not as much for AOB[31]. As Figure 2(b) shows, the configuration of the pilotplant with three CSTRs in series allowed an effluent withoutTAN to be achieved, but simultaneously there was a stableaccumulation of TAN in R1 and R2 (150 ± 50 mg L−1 and20 ± 10 mg L−1, respectively). This TAN accumulation,
Dow
nloa
ded
by [
Uni
vers
idad
Aut
onom
a de
Bar
celo
na]
at 0
7:39
21
Nov
embe
r 20
11
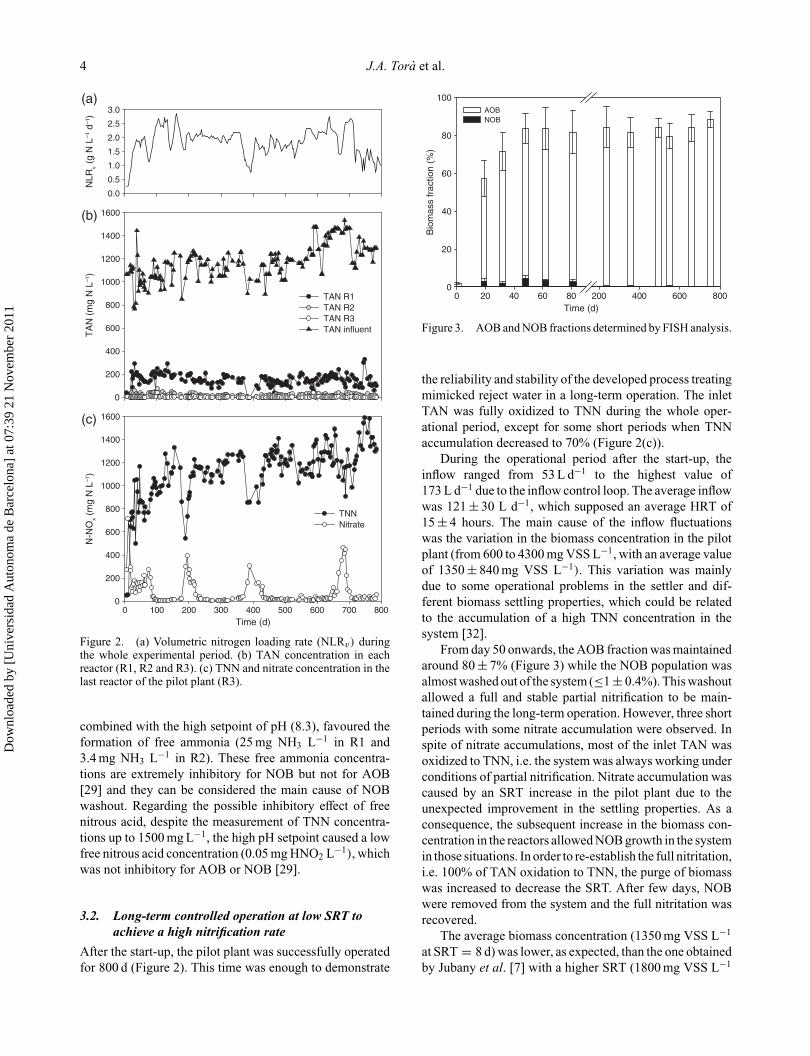
4 J.A. Torà et al.
Time (d)0 100 200 300 400 500 600 700 800
N-N
Ox (
mg
N L
–1)
0
200
400
600
800
1000
1200
1400
1600
TNNNitrate
TA
N (
mg
N L
–1)
0
200
400
600
800
1000
1200
1400
1600
TAN R1 TAN R2 TAN R3 TAN influent
NLR
v (g
N L
–1 d
–1)
0.0
0.5
1.0
1.5
2.0
2.5
3.0(a)
(b)
(c)
Figure 2. (a) Volumetric nitrogen loading rate (NLRv) duringthe whole experimental period. (b) TAN concentration in eachreactor (R1, R2 and R3). (c) TNN and nitrate concentration in thelast reactor of the pilot plant (R3).
combined with the high setpoint of pH (8.3), favoured theformation of free ammonia (25 mg NH3 L−1 in R1 and3.4 mg NH3 L−1 in R2). These free ammonia concentra-tions are extremely inhibitory for NOB but not for AOB[29] and they can be considered the main cause of NOBwashout. Regarding the possible inhibitory effect of freenitrous acid, despite the measurement of TNN concentra-tions up to 1500 mg L−1, the high pH setpoint caused a lowfree nitrous acid concentration (0.05 mg HNO2 L−1), whichwas not inhibitory for AOB or NOB [29].
3.2. Long-term controlled operation at low SRT toachieve a high nitrification rate
After the start-up, the pilot plant was successfully operatedfor 800 d (Figure 2). This time was enough to demonstrate
Time (d)0 20 40 60 80 200 400 600 800
Bio
mas
s fr
actio
n (%
)
0
20
40
60
80
100AOBNOB
Figure 3. AOB and NOB fractions determined by FISH analysis.
the reliability and stability of the developed process treatingmimicked reject water in a long-term operation. The inletTAN was fully oxidized to TNN during the whole oper-ational period, except for some short periods when TNNaccumulation decreased to 70% (Figure 2(c)).
During the operational period after the start-up, theinflow ranged from 53 L d−1 to the highest value of173 L d−1 due to the inflow control loop. The average inflowwas 121 ± 30 L d−1, which supposed an average HRT of15 ± 4 hours. The main cause of the inflow fluctuationswas the variation in the biomass concentration in the pilotplant (from 600 to 4300 mg VSS L−1, with an average valueof 1350 ± 840 mg VSS L−1). This variation was mainlydue to some operational problems in the settler and dif-ferent biomass settling properties, which could be relatedto the accumulation of a high TNN concentration in thesystem [32].
From day 50 onwards, the AOB fraction was maintainedaround 80 ± 7% (Figure 3) while the NOB population wasalmost washed out of the system (≤1 ± 0.4%). This washoutallowed a full and stable partial nitrification to be main-tained during the long-term operation. However, three shortperiods with some nitrate accumulation were observed. Inspite of nitrate accumulations, most of the inlet TAN wasoxidized to TNN, i.e. the system was always working underconditions of partial nitrification. Nitrate accumulation wascaused by an SRT increase in the pilot plant due to theunexpected improvement in the settling properties. As aconsequence, the subsequent increase in the biomass con-centration in the reactors allowed NOB growth in the systemin those situations. In order to re-establish the full nitritation,i.e. 100% of TAN oxidation to TNN, the purge of biomasswas increased to decrease the SRT. After few days, NOBwere removed from the system and the full nitritation wasrecovered.
The average biomass concentration (1350 mg VSS L−1
at SRT = 8 d) was lower, as expected, than the one obtainedby Jubany et al. [7] with a higher SRT (1800 mg VSS L−1
Dow
nloa
ded
by [
Uni
vers
idad
Aut
onom
a de
Bar
celo
na]
at 0
7:39
21
Nov
embe
r 20
11
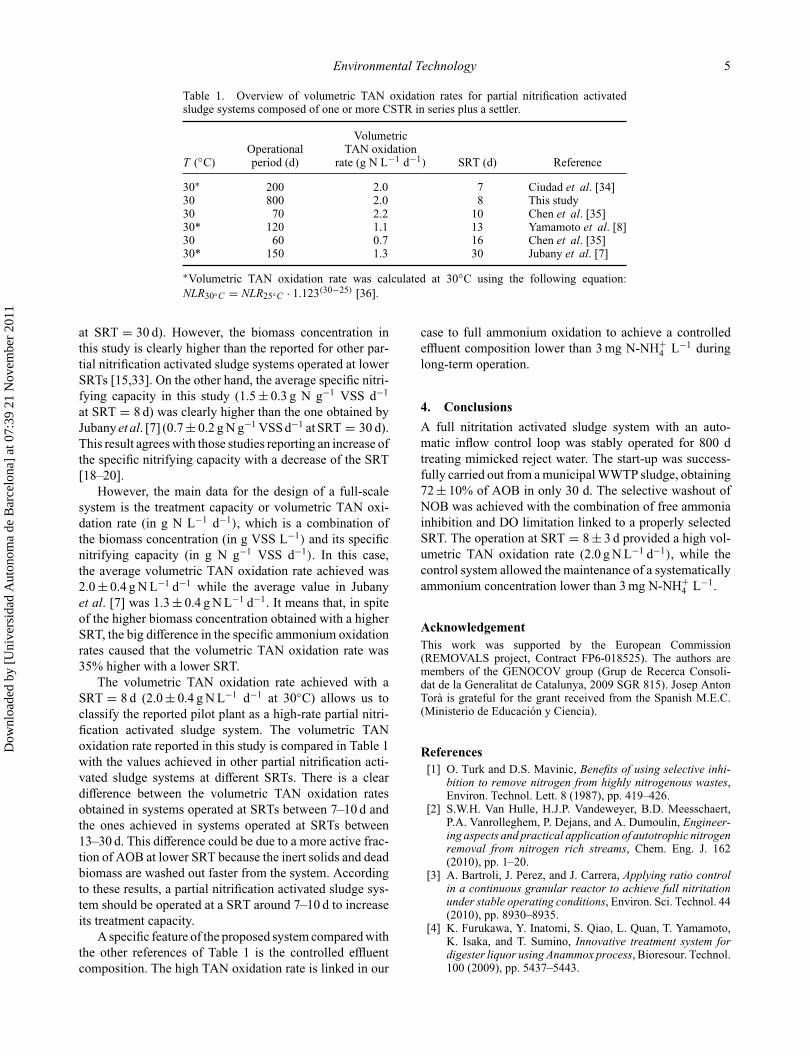
Environmental Technology 5
Table 1. Overview of volumetric TAN oxidation rates for partial nitrification activatedsludge systems composed of one or more CSTR in series plus a settler.
VolumetricOperational TAN oxidation
T (◦C) period (d) rate (g N L−1 d−1) SRT (d) Reference
30∗ 200 2.0 7 Ciudad et al. [34]30 800 2.0 8 This study30 70 2.2 10 Chen et al. [35]30* 120 1.1 13 Yamamoto et al. [8]30 60 0.7 16 Chen et al. [35]30* 150 1.3 30 Jubany et al. [7]
∗Volumetric TAN oxidation rate was calculated at 30◦C using the following equation:NLR30◦C = NLR25◦C · 1.123(30−25) [36].
at SRT = 30 d). However, the biomass concentration inthis study is clearly higher than the reported for other par-tial nitrification activated sludge systems operated at lowerSRTs [15,33]. On the other hand, the average specific nitri-fying capacity in this study (1.5 ± 0.3 g N g−1 VSS d−1
at SRT = 8 d) was clearly higher than the one obtained byJubany et al. [7] (0.7 ± 0.2 g N g−1 VSS d−1 at SRT = 30 d).This result agrees with those studies reporting an increase ofthe specific nitrifying capacity with a decrease of the SRT[18–20].
However, the main data for the design of a full-scalesystem is the treatment capacity or volumetric TAN oxi-dation rate (in g N L−1 d−1), which is a combination ofthe biomass concentration (in g VSS L−1) and its specificnitrifying capacity (in g N g−1 VSS d−1). In this case,the average volumetric TAN oxidation rate achieved was2.0 ± 0.4 g N L−1 d−1 while the average value in Jubanyet al. [7] was 1.3 ± 0.4 g N L−1 d−1. It means that, in spiteof the higher biomass concentration obtained with a higherSRT, the big difference in the specific ammonium oxidationrates caused that the volumetric TAN oxidation rate was35% higher with a lower SRT.
The volumetric TAN oxidation rate achieved with aSRT = 8 d (2.0 ± 0.4 g N L−1 d−1 at 30◦C) allows us toclassify the reported pilot plant as a high-rate partial nitri-fication activated sludge system. The volumetric TANoxidation rate reported in this study is compared in Table 1with the values achieved in other partial nitrification acti-vated sludge systems at different SRTs. There is a cleardifference between the volumetric TAN oxidation ratesobtained in systems operated at SRTs between 7–10 d andthe ones achieved in systems operated at SRTs between13–30 d. This difference could be due to a more active frac-tion of AOB at lower SRT because the inert solids and deadbiomass are washed out faster from the system. Accordingto these results, a partial nitrification activated sludge sys-tem should be operated at a SRT around 7–10 d to increaseits treatment capacity.
A specific feature of the proposed system compared withthe other references of Table 1 is the controlled effluentcomposition. The high TAN oxidation rate is linked in our
case to full ammonium oxidation to achieve a controlledeffluent composition lower than 3 mg N-NH+
4 L−1 duringlong-term operation.
4. ConclusionsA full nitritation activated sludge system with an auto-matic inflow control loop was stably operated for 800 dtreating mimicked reject water. The start-up was success-fully carried out from a municipal WWTP sludge, obtaining72 ± 10% of AOB in only 30 d. The selective washout ofNOB was achieved with the combination of free ammoniainhibition and DO limitation linked to a properly selectedSRT. The operation at SRT = 8 ± 3 d provided a high vol-umetric TAN oxidation rate (2.0 g N L−1 d−1), while thecontrol system allowed the maintenance of a systematicallyammonium concentration lower than 3 mg N-NH+
4 L−1.
AcknowledgementThis work was supported by the European Commission(REMOVALS project, Contract FP6-018525). The authors aremembers of the GENOCOV group (Grup de Recerca Consoli-dat de la Generalitat de Catalunya, 2009 SGR 815). Josep AntonTorà is grateful for the grant received from the Spanish M.E.C.(Ministerio de Educación y Ciencia).
References[1] O. Turk and D.S. Mavinic, Benefits of using selective inhi-
bition to remove nitrogen from highly nitrogenous wastes,Environ. Technol. Lett. 8 (1987), pp. 419–426.
[2] S.W.H. Van Hulle, H.J.P. Vandeweyer, B.D. Meesschaert,P.A. Vanrolleghem, P. Dejans, and A. Dumoulin, Engineer-ing aspects and practical application of autotrophic nitrogenremoval from nitrogen rich streams, Chem. Eng. J. 162(2010), pp. 1–20.
[3] A. Bartroli, J. Perez, and J. Carrera, Applying ratio controlin a continuous granular reactor to achieve full nitritationunder stable operating conditions, Environ. Sci. Technol. 44(2010), pp. 8930–8935.
[4] K. Furukawa, Y. Inatomi, S. Qiao, L. Quan, T. Yamamoto,K. Isaka, and T. Sumino, Innovative treatment system fordigester liquor using Anammox process, Bioresour. Technol.100 (2009), pp. 5437–5443.
Dow
nloa
ded
by [
Uni
vers
idad
Aut
onom
a de
Bar
celo
na]
at 0
7:39
21
Nov
embe
r 20
11
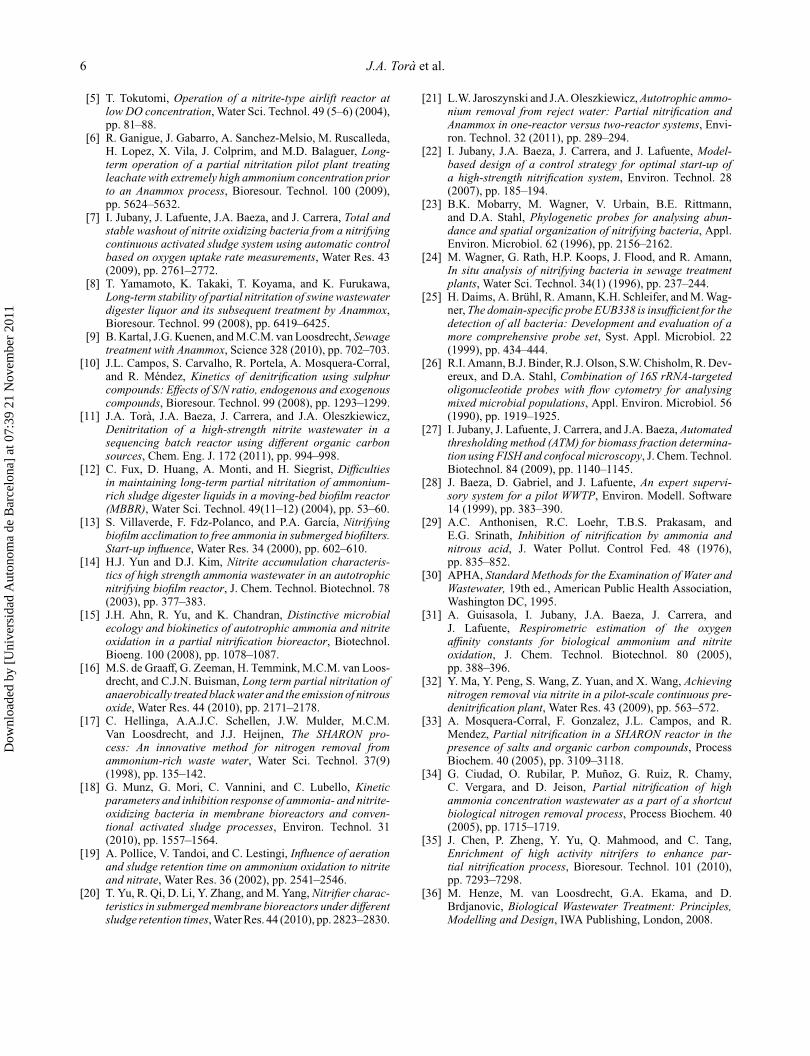
6 J.A. Torà et al.
[5] T. Tokutomi, Operation of a nitrite-type airlift reactor atlow DO concentration, Water Sci. Technol. 49 (5–6) (2004),pp. 81–88.
[6] R. Ganigue, J. Gabarro, A. Sanchez-Melsio, M. Ruscalleda,H. Lopez, X. Vila, J. Colprim, and M.D. Balaguer, Long-term operation of a partial nitritation pilot plant treatingleachate with extremely high ammonium concentration priorto an Anammox process, Bioresour. Technol. 100 (2009),pp. 5624–5632.
[7] I. Jubany, J. Lafuente, J.A. Baeza, and J. Carrera, Total andstable washout of nitrite oxidizing bacteria from a nitrifyingcontinuous activated sludge system using automatic controlbased on oxygen uptake rate measurements, Water Res. 43(2009), pp. 2761–2772.
[8] T. Yamamoto, K. Takaki, T. Koyama, and K. Furukawa,Long-term stability of partial nitritation of swine wastewaterdigester liquor and its subsequent treatment by Anammox,Bioresour. Technol. 99 (2008), pp. 6419–6425.
[9] B. Kartal, J.G. Kuenen, and M.C.M. van Loosdrecht, Sewagetreatment with Anammox, Science 328 (2010), pp. 702–703.
[10] J.L. Campos, S. Carvalho, R. Portela, A. Mosquera-Corral,and R. Méndez, Kinetics of denitrification using sulphurcompounds: Effects of S/N ratio, endogenous and exogenouscompounds, Bioresour. Technol. 99 (2008), pp. 1293–1299.
[11] J.A. Torà, J.A. Baeza, J. Carrera, and J.A. Oleszkiewicz,Denitritation of a high-strength nitrite wastewater in asequencing batch reactor using different organic carbonsources, Chem. Eng. J. 172 (2011), pp. 994–998.
[12] C. Fux, D. Huang, A. Monti, and H. Siegrist, Difficultiesin maintaining long-term partial nitritation of ammonium-rich sludge digester liquids in a moving-bed biofilm reactor(MBBR), Water Sci. Technol. 49(11–12) (2004), pp. 53–60.
[13] S. Villaverde, F. Fdz-Polanco, and P.A. García, Nitrifyingbiofilm acclimation to free ammonia in submerged biofilters.Start-up influence, Water Res. 34 (2000), pp. 602–610.
[14] H.J. Yun and D.J. Kim, Nitrite accumulation characteris-tics of high strength ammonia wastewater in an autotrophicnitrifying biofilm reactor, J. Chem. Technol. Biotechnol. 78(2003), pp. 377–383.
[15] J.H. Ahn, R. Yu, and K. Chandran, Distinctive microbialecology and biokinetics of autotrophic ammonia and nitriteoxidation in a partial nitrification bioreactor, Biotechnol.Bioeng. 100 (2008), pp. 1078–1087.
[16] M.S. de Graaff, G. Zeeman, H. Temmink, M.C.M. van Loos-drecht, and C.J.N. Buisman, Long term partial nitritation ofanaerobically treated black water and the emission of nitrousoxide, Water Res. 44 (2010), pp. 2171–2178.
[17] C. Hellinga, A.A.J.C. Schellen, J.W. Mulder, M.C.M.Van Loosdrecht, and J.J. Heijnen, The SHARON pro-cess: An innovative method for nitrogen removal fromammonium-rich waste water, Water Sci. Technol. 37(9)(1998), pp. 135–142.
[18] G. Munz, G. Mori, C. Vannini, and C. Lubello, Kineticparameters and inhibition response of ammonia- and nitrite-oxidizing bacteria in membrane bioreactors and conven-tional activated sludge processes, Environ. Technol. 31(2010), pp. 1557–1564.
[19] A. Pollice, V. Tandoi, and C. Lestingi, Influence of aerationand sludge retention time on ammonium oxidation to nitriteand nitrate, Water Res. 36 (2002), pp. 2541–2546.
[20] T. Yu, R. Qi, D. Li, Y. Zhang, and M. Yang, Nitrifier charac-teristics in submerged membrane bioreactors under differentsludge retention times, Water Res. 44 (2010), pp. 2823–2830.
[21] L.W. Jaroszynski and J.A. Oleszkiewicz, Autotrophic ammo-nium removal from reject water: Partial nitrification andAnammox in one-reactor versus two-reactor systems, Envi-ron. Technol. 32 (2011), pp. 289–294.
[22] I. Jubany, J.A. Baeza, J. Carrera, and J. Lafuente, Model-based design of a control strategy for optimal start-up ofa high-strength nitrification system, Environ. Technol. 28(2007), pp. 185–194.
[23] B.K. Mobarry, M. Wagner, V. Urbain, B.E. Rittmann,and D.A. Stahl, Phylogenetic probes for analysing abun-dance and spatial organization of nitrifying bacteria, Appl.Environ. Microbiol. 62 (1996), pp. 2156–2162.
[24] M. Wagner, G. Rath, H.P. Koops, J. Flood, and R. Amann,In situ analysis of nitrifying bacteria in sewage treatmentplants, Water Sci. Technol. 34(1) (1996), pp. 237–244.
[25] H. Daims, A. Brühl, R. Amann, K.H. Schleifer, and M. Wag-ner, The domain-specific probe EUB338 is insufficient for thedetection of all bacteria: Development and evaluation of amore comprehensive probe set, Syst. Appl. Microbiol. 22(1999), pp. 434–444.
[26] R.I. Amann, B.J. Binder, R.J. Olson, S.W. Chisholm, R. Dev-ereux, and D.A. Stahl, Combination of 16S rRNA-targetedoligonucleotide probes with flow cytometry for analysingmixed microbial populations, Appl. Environ. Microbiol. 56(1990), pp. 1919–1925.
[27] I. Jubany, J. Lafuente, J. Carrera, and J.A. Baeza, Automatedthresholding method (ATM) for biomass fraction determina-tion using FISH and confocal microscopy, J. Chem. Technol.Biotechnol. 84 (2009), pp. 1140–1145.
[28] J. Baeza, D. Gabriel, and J. Lafuente, An expert supervi-sory system for a pilot WWTP, Environ. Modell. Software14 (1999), pp. 383–390.
[29] A.C. Anthonisen, R.C. Loehr, T.B.S. Prakasam, andE.G. Srinath, Inhibition of nitrification by ammonia andnitrous acid, J. Water Pollut. Control Fed. 48 (1976),pp. 835–852.
[30] APHA, Standard Methods for the Examination of Water andWastewater, 19th ed., American Public Health Association,Washington DC, 1995.
[31] A. Guisasola, I. Jubany, J.A. Baeza, J. Carrera, andJ. Lafuente, Respirometric estimation of the oxygenaffinity constants for biological ammonium and nitriteoxidation, J. Chem. Technol. Biotechnol. 80 (2005),pp. 388–396.
[32] Y. Ma, Y. Peng, S. Wang, Z. Yuan, and X. Wang, Achievingnitrogen removal via nitrite in a pilot-scale continuous pre-denitrification plant, Water Res. 43 (2009), pp. 563–572.
[33] A. Mosquera-Corral, F. Gonzalez, J.L. Campos, and R.Mendez, Partial nitrification in a SHARON reactor in thepresence of salts and organic carbon compounds, ProcessBiochem. 40 (2005), pp. 3109–3118.
[34] G. Ciudad, O. Rubilar, P. Muñoz, G. Ruiz, R. Chamy,C. Vergara, and D. Jeison, Partial nitrification of highammonia concentration wastewater as a part of a shortcutbiological nitrogen removal process, Process Biochem. 40(2005), pp. 1715–1719.
[35] J. Chen, P. Zheng, Y. Yu, Q. Mahmood, and C. Tang,Enrichment of high activity nitrifers to enhance par-tial nitrification process, Bioresour. Technol. 101 (2010),pp. 7293–7298.
[36] M. Henze, M. van Loosdrecht, G.A. Ekama, and D.Brdjanovic, Biological Wastewater Treatment: Principles,Modelling and Design, IWA Publishing, London, 2008.
Dow
nloa
ded
by [
Uni
vers
idad
Aut
onom
a de
Bar
celo
na]
at 0
7:39
21
Nov
embe
r 20
11

IITorà, J. A., Baeza, J. A., Carrera, J. and Oleszkiewicz, J. A.
Denitritation of a high-strength nitrite wastewater in a sequencing batch
reactor using different organic carbon sources
Chemical Engineering Journal. 2011; Volume 172, Issues (2-3), Pages 994-998

This article appeared in a journal published by Elsevier. The attachedcopy is furnished to the author for internal non-commercial researchand education use, including for instruction at the authors institution
and sharing with colleagues.
Other uses, including reproduction and distribution, or selling orlicensing copies, or posting to personal, institutional or third party
websites are prohibited.
In most cases authors are permitted to post their version of thearticle (e.g. in Word or Tex form) to their personal website orinstitutional repository. Authors requiring further information
regarding Elsevier’s archiving and manuscript policies areencouraged to visit:
http://www.elsevier.com/copyright

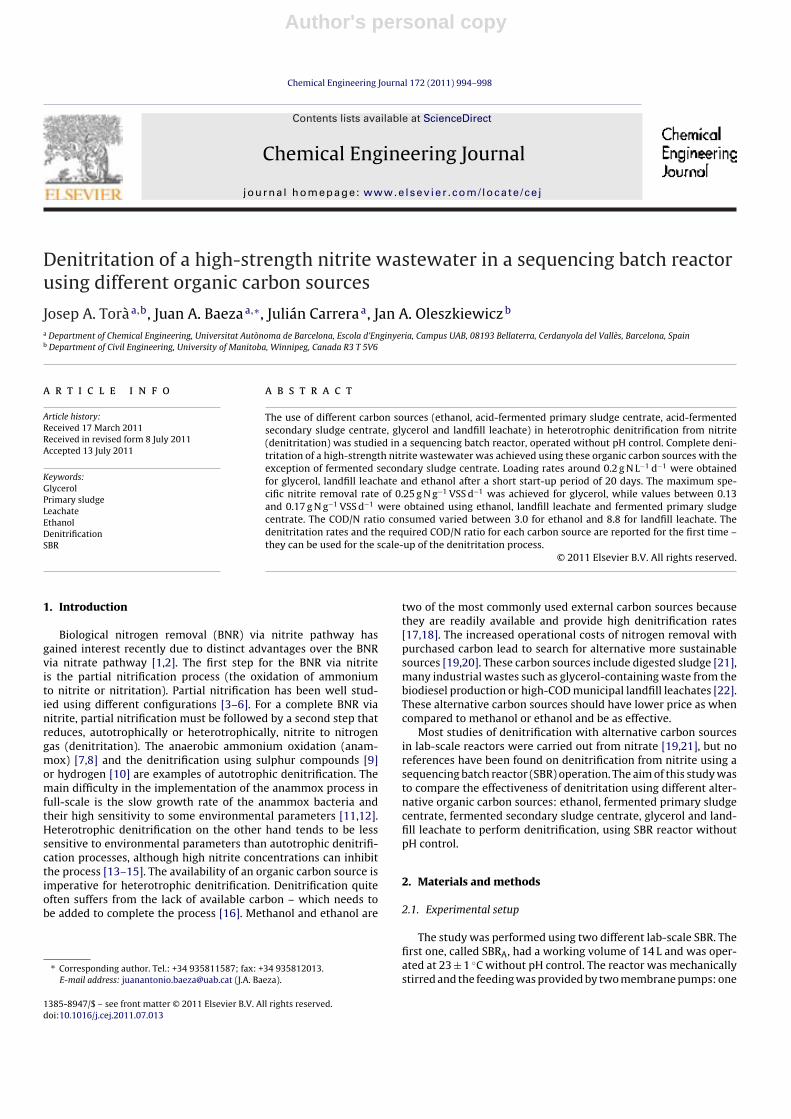
Author's personal copy
Chemical Engineering Journal 172 (2011) 994– 998
Contents lists available at ScienceDirect
Chemical Engineering Journal
jo u r n al hom epage: www.elsev ier .com/ locate /ce j
Denitritation of a high-strength nitrite wastewater in a sequencing batch reactorusing different organic carbon sources
Josep A. Toràa,b, Juan A. Baezaa,∗, Julián Carreraa, Jan A. Oleszkiewiczb
a Department of Chemical Engineering, Universitat Autònoma de Barcelona, Escola d’Enginyeria, Campus UAB, 08193 Bellaterra, Cerdanyola del Vallès, Barcelona, Spainb Department of Civil Engineering, University of Manitoba, Winnipeg, Canada R3 T 5V6
a r t i c l e i n f o
Article history:Received 17 March 2011Received in revised form 8 July 2011Accepted 13 July 2011
Keywords:GlycerolPrimary sludgeLeachateEthanolDenitrificationSBR
a b s t r a c t
The use of different carbon sources (ethanol, acid-fermented primary sludge centrate, acid-fermentedsecondary sludge centrate, glycerol and landfill leachate) in heterotrophic denitrification from nitrite(denitritation) was studied in a sequencing batch reactor, operated without pH control. Complete deni-tritation of a high-strength nitrite wastewater was achieved using these organic carbon sources with theexception of fermented secondary sludge centrate. Loading rates around 0.2 g N L−1 d−1 were obtainedfor glycerol, landfill leachate and ethanol after a short start-up period of 20 days. The maximum spe-cific nitrite removal rate of 0.25 g N g−1 VSS d−1 was achieved for glycerol, while values between 0.13and 0.17 g N g−1 VSS d−1 were obtained using ethanol, landfill leachate and fermented primary sludgecentrate. The COD/N ratio consumed varied between 3.0 for ethanol and 8.8 for landfill leachate. Thedenitritation rates and the required COD/N ratio for each carbon source are reported for the first time –they can be used for the scale-up of the denitritation process.
© 2011 Elsevier B.V. All rights reserved.
1. Introduction
Biological nitrogen removal (BNR) via nitrite pathway hasgained interest recently due to distinct advantages over the BNRvia nitrate pathway [1,2]. The first step for the BNR via nitriteis the partial nitrification process (the oxidation of ammoniumto nitrite or nitritation). Partial nitrification has been well stud-ied using different configurations [3–6]. For a complete BNR vianitrite, partial nitrification must be followed by a second step thatreduces, autotrophically or heterotrophically, nitrite to nitrogengas (denitritation). The anaerobic ammonium oxidation (anam-mox) [7,8] and the denitrification using sulphur compounds [9]or hydrogen [10] are examples of autotrophic denitrification. Themain difficulty in the implementation of the anammox process infull-scale is the slow growth rate of the anammox bacteria andtheir high sensitivity to some environmental parameters [11,12].Heterotrophic denitrification on the other hand tends to be lesssensitive to environmental parameters than autotrophic denitrifi-cation processes, although high nitrite concentrations can inhibitthe process [13–15]. The availability of an organic carbon source isimperative for heterotrophic denitrification. Denitrification quiteoften suffers from the lack of available carbon – which needs tobe added to complete the process [16]. Methanol and ethanol are
∗ Corresponding author. Tel.: +34 935811587; fax: +34 935812013.E-mail address: [email protected] (J.A. Baeza).
two of the most commonly used external carbon sources becausethey are readily available and provide high denitrification rates[17,18]. The increased operational costs of nitrogen removal withpurchased carbon lead to search for alternative more sustainablesources [19,20]. These carbon sources include digested sludge [21],many industrial wastes such as glycerol-containing waste from thebiodiesel production or high-COD municipal landfill leachates [22].These alternative carbon sources should have lower price as whencompared to methanol or ethanol and be as effective.
Most studies of denitrification with alternative carbon sourcesin lab-scale reactors were carried out from nitrate [19,21], but noreferences have been found on denitrification from nitrite using asequencing batch reactor (SBR) operation. The aim of this study wasto compare the effectiveness of denitritation using different alter-native organic carbon sources: ethanol, fermented primary sludgecentrate, fermented secondary sludge centrate, glycerol and land-fill leachate to perform denitrification, using SBR reactor withoutpH control.
2. Materials and methods
2.1. Experimental setup
The study was performed using two different lab-scale SBR. Thefirst one, called SBRA, had a working volume of 14 L and was oper-ated at 23 ± 1 ◦C without pH control. The reactor was mechanicallystirred and the feeding was provided by two membrane pumps: one
1385-8947/$ – see front matter © 2011 Elsevier B.V. All rights reserved.doi:10.1016/j.cej.2011.07.013
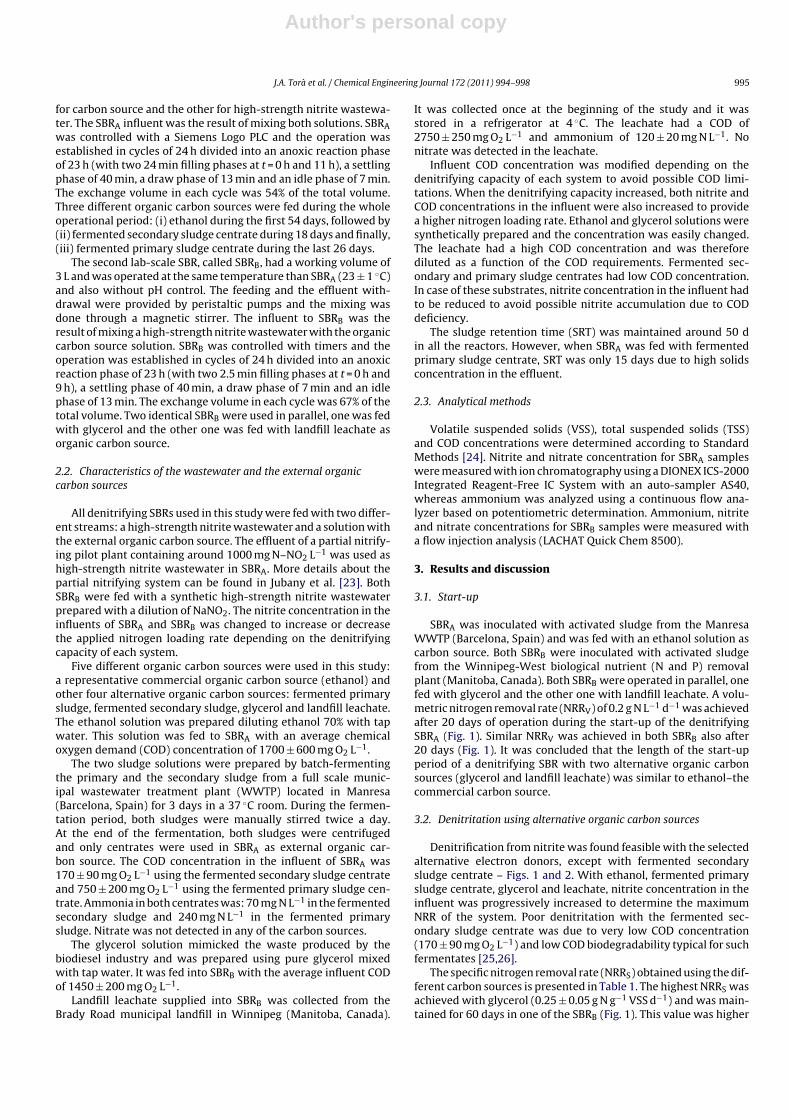
Author's personal copy
J.A. Torà et al. / Chemical Engineering Journal 172 (2011) 994– 998 995
for carbon source and the other for high-strength nitrite wastewa-ter. The SBRA influent was the result of mixing both solutions. SBRAwas controlled with a Siemens Logo PLC and the operation wasestablished in cycles of 24 h divided into an anoxic reaction phaseof 23 h (with two 24 min filling phases at t = 0 h and 11 h), a settlingphase of 40 min, a draw phase of 13 min and an idle phase of 7 min.The exchange volume in each cycle was 54% of the total volume.Three different organic carbon sources were fed during the wholeoperational period: (i) ethanol during the first 54 days, followed by(ii) fermented secondary sludge centrate during 18 days and finally,(iii) fermented primary sludge centrate during the last 26 days.
The second lab-scale SBR, called SBRB, had a working volume of3 L and was operated at the same temperature than SBRA (23 ± 1 ◦C)and also without pH control. The feeding and the effluent with-drawal were provided by peristaltic pumps and the mixing wasdone through a magnetic stirrer. The influent to SBRB was theresult of mixing a high-strength nitrite wastewater with the organiccarbon source solution. SBRB was controlled with timers and theoperation was established in cycles of 24 h divided into an anoxicreaction phase of 23 h (with two 2.5 min filling phases at t = 0 h and9 h), a settling phase of 40 min, a draw phase of 7 min and an idlephase of 13 min. The exchange volume in each cycle was 67% of thetotal volume. Two identical SBRB were used in parallel, one was fedwith glycerol and the other one was fed with landfill leachate asorganic carbon source.
2.2. Characteristics of the wastewater and the external organiccarbon sources
All denitrifying SBRs used in this study were fed with two differ-ent streams: a high-strength nitrite wastewater and a solution withthe external organic carbon source. The effluent of a partial nitrify-ing pilot plant containing around 1000 mg N–NO2 L−1 was used ashigh-strength nitrite wastewater in SBRA. More details about thepartial nitrifying system can be found in Jubany et al. [23]. BothSBRB were fed with a synthetic high-strength nitrite wastewaterprepared with a dilution of NaNO2. The nitrite concentration in theinfluents of SBRA and SBRB was changed to increase or decreasethe applied nitrogen loading rate depending on the denitrifyingcapacity of each system.
Five different organic carbon sources were used in this study:a representative commercial organic carbon source (ethanol) andother four alternative organic carbon sources: fermented primarysludge, fermented secondary sludge, glycerol and landfill leachate.The ethanol solution was prepared diluting ethanol 70% with tapwater. This solution was fed to SBRA with an average chemicaloxygen demand (COD) concentration of 1700 ± 600 mg O2 L−1.
The two sludge solutions were prepared by batch-fermentingthe primary and the secondary sludge from a full scale munic-ipal wastewater treatment plant (WWTP) located in Manresa(Barcelona, Spain) for 3 days in a 37 ◦C room. During the fermen-tation period, both sludges were manually stirred twice a day.At the end of the fermentation, both sludges were centrifugedand only centrates were used in SBRA as external organic car-bon source. The COD concentration in the influent of SBRA was170 ± 90 mg O2 L−1 using the fermented secondary sludge centrateand 750 ± 200 mg O2 L−1 using the fermented primary sludge cen-trate. Ammonia in both centrates was: 70 mg N L−1 in the fermentedsecondary sludge and 240 mg N L−1 in the fermented primarysludge. Nitrate was not detected in any of the carbon sources.
The glycerol solution mimicked the waste produced by thebiodiesel industry and was prepared using pure glycerol mixedwith tap water. It was fed into SBRB with the average influent CODof 1450 ± 200 mg O2 L−1.
Landfill leachate supplied into SBRB was collected from theBrady Road municipal landfill in Winnipeg (Manitoba, Canada).
It was collected once at the beginning of the study and it wasstored in a refrigerator at 4 ◦C. The leachate had a COD of2750 ± 250 mg O2 L−1 and ammonium of 120 ± 20 mg N L−1. Nonitrate was detected in the leachate.
Influent COD concentration was modified depending on thedenitrifying capacity of each system to avoid possible COD limi-tations. When the denitrifying capacity increased, both nitrite andCOD concentrations in the influent were also increased to providea higher nitrogen loading rate. Ethanol and glycerol solutions weresynthetically prepared and the concentration was easily changed.The leachate had a high COD concentration and was thereforediluted as a function of the COD requirements. Fermented sec-ondary and primary sludge centrates had low COD concentration.In case of these substrates, nitrite concentration in the influent hadto be reduced to avoid possible nitrite accumulation due to CODdeficiency.
The sludge retention time (SRT) was maintained around 50 din all the reactors. However, when SBRA was fed with fermentedprimary sludge centrate, SRT was only 15 days due to high solidsconcentration in the effluent.
2.3. Analytical methods
Volatile suspended solids (VSS), total suspended solids (TSS)and COD concentrations were determined according to StandardMethods [24]. Nitrite and nitrate concentration for SBRA sampleswere measured with ion chromatography using a DIONEX ICS-2000Integrated Reagent-Free IC System with an auto-sampler AS40,whereas ammonium was analyzed using a continuous flow ana-lyzer based on potentiometric determination. Ammonium, nitriteand nitrate concentrations for SBRB samples were measured witha flow injection analysis (LACHAT Quick Chem 8500).
3. Results and discussion
3.1. Start-up
SBRA was inoculated with activated sludge from the ManresaWWTP (Barcelona, Spain) and was fed with an ethanol solution ascarbon source. Both SBRB were inoculated with activated sludgefrom the Winnipeg-West biological nutrient (N and P) removalplant (Manitoba, Canada). Both SBRB were operated in parallel, onefed with glycerol and the other one with landfill leachate. A volu-metric nitrogen removal rate (NRRV) of 0.2 g N L−1 d−1 was achievedafter 20 days of operation during the start-up of the denitrifyingSBRA (Fig. 1). Similar NRRV was achieved in both SBRB also after20 days (Fig. 1). It was concluded that the length of the start-upperiod of a denitrifying SBR with two alternative organic carbonsources (glycerol and landfill leachate) was similar to ethanol–thecommercial carbon source.
3.2. Denitritation using alternative organic carbon sources
Denitrification from nitrite was found feasible with the selectedalternative electron donors, except with fermented secondarysludge centrate – Figs. 1 and 2. With ethanol, fermented primarysludge centrate, glycerol and leachate, nitrite concentration in theinfluent was progressively increased to determine the maximumNRR of the system. Poor denitritation with the fermented sec-ondary sludge centrate was due to very low COD concentration(170 ± 90 mg O2 L−1) and low COD biodegradability typical for suchfermentates [25,26].
The specific nitrogen removal rate (NRRS) obtained using the dif-ferent carbon sources is presented in Table 1. The highest NRRS wasachieved with glycerol (0.25 ± 0.05 g N g−1 VSS d−1) and was main-tained for 60 days in one of the SBRB (Fig. 1). This value was higher
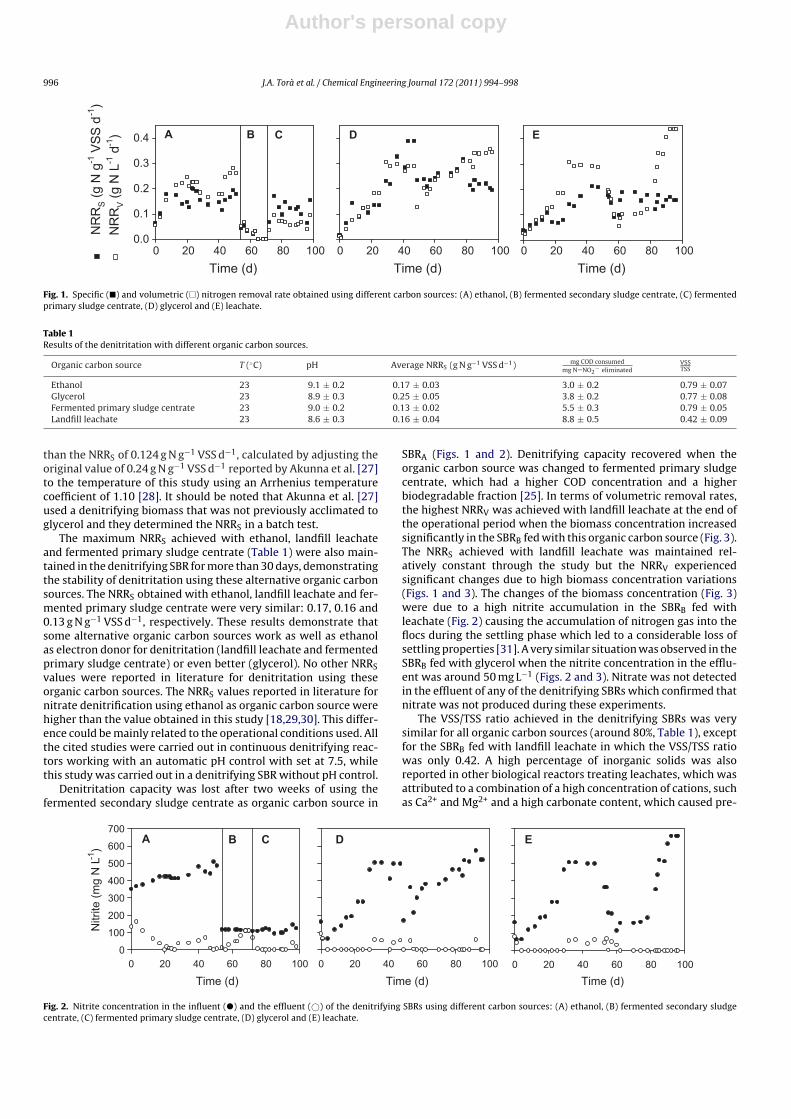
Author's personal copy
996 J.A. Torà et al. / Chemical Engineering Journal 172 (2011) 994– 998
Time (d)100806040200
NR
RS (g
N g
-1 V
SS d
-1)
0.0
0.1
0.2
0.3
0.4
Time (d)100806040200
Time (d)100806040200
NR
RV (g
N L
-1 d
-1) A B EDC
Fig. 1. Specific (�) and volumetric (�) nitrogen removal rate obtained using different carbon sources: (A) ethanol, (B) fermented secondary sludge centrate, (C) fermentedprimary sludge centrate, (D) glycerol and (E) leachate.
Table 1Results of the denitritation with different organic carbon sources.
Organic carbon source T (◦C) pH Average NRRS (g N g−1 VSS d−1) mg COD consumedmg N–NO2
− eliminatedVSSTSS
Ethanol 23 9.1 ± 0.2 0.17 ± 0.03 3.0 ± 0.2 0.79 ± 0.07Glycerol 23 8.9 ± 0.3 0.25 ± 0.05 3.8 ± 0.2 0.77 ± 0.08Fermented primary sludge centrate 23 9.0 ± 0.2 0.13 ± 0.02 5.5 ± 0.3 0.79 ± 0.05Landfill leachate 23 8.6 ± 0.3 0.16 ± 0.04 8.8 ± 0.5 0.42 ± 0.09
than the NRRS of 0.124 g N g−1 VSS d−1, calculated by adjusting theoriginal value of 0.24 g N g−1 VSS d−1 reported by Akunna et al. [27]to the temperature of this study using an Arrhenius temperaturecoefficient of 1.10 [28]. It should be noted that Akunna et al. [27]used a denitrifying biomass that was not previously acclimated toglycerol and they determined the NRRS in a batch test.
The maximum NRRS achieved with ethanol, landfill leachateand fermented primary sludge centrate (Table 1) were also main-tained in the denitrifying SBR for more than 30 days, demonstratingthe stability of denitritation using these alternative organic carbonsources. The NRRS obtained with ethanol, landfill leachate and fer-mented primary sludge centrate were very similar: 0.17, 0.16 and0.13 g N g−1 VSS d−1, respectively. These results demonstrate thatsome alternative organic carbon sources work as well as ethanolas electron donor for denitritation (landfill leachate and fermentedprimary sludge centrate) or even better (glycerol). No other NRRSvalues were reported in literature for denitritation using theseorganic carbon sources. The NRRS values reported in literature fornitrate denitrification using ethanol as organic carbon source werehigher than the value obtained in this study [18,29,30]. This differ-ence could be mainly related to the operational conditions used. Allthe cited studies were carried out in continuous denitrifying reac-tors working with an automatic pH control with set at 7.5, whilethis study was carried out in a denitrifying SBR without pH control.
Denitritation capacity was lost after two weeks of using thefermented secondary sludge centrate as organic carbon source in
SBRA (Figs. 1 and 2). Denitrifying capacity recovered when theorganic carbon source was changed to fermented primary sludgecentrate, which had a higher COD concentration and a higherbiodegradable fraction [25]. In terms of volumetric removal rates,the highest NRRV was achieved with landfill leachate at the end ofthe operational period when the biomass concentration increasedsignificantly in the SBRB fed with this organic carbon source (Fig. 3).The NRRS achieved with landfill leachate was maintained rel-atively constant through the study but the NRRV experiencedsignificant changes due to high biomass concentration variations(Figs. 1 and 3). The changes of the biomass concentration (Fig. 3)were due to a high nitrite accumulation in the SBRB fed withleachate (Fig. 2) causing the accumulation of nitrogen gas into theflocs during the settling phase which led to a considerable loss ofsettling properties [31]. A very similar situation was observed in theSBRB fed with glycerol when the nitrite concentration in the efflu-ent was around 50 mg L−1 (Figs. 2 and 3). Nitrate was not detectedin the effluent of any of the denitrifying SBRs which confirmed thatnitrate was not produced during these experiments.
The VSS/TSS ratio achieved in the denitrifying SBRs was verysimilar for all organic carbon sources (around 80%, Table 1), exceptfor the SBRB fed with landfill leachate in which the VSS/TSS ratiowas only 0.42. A high percentage of inorganic solids was alsoreported in other biological reactors treating leachates, which wasattributed to a combination of a high concentration of cations, suchas Ca2+ and Mg2+ and a high carbonate content, which caused pre-
Time (d)100806040200
Nitr
ite (m
g N
L-1)
0
100
200
300
400
500
600
700
Time (d)100806040200
Time (d)100806040200
A EDCB
Fig. 2. Nitrite concentration in the influent (�) and the effluent (©) of the denitrifying SBRs using different carbon sources: (A) ethanol, (B) fermented secondary sludgecentrate, (C) fermented primary sludge centrate, (D) glycerol and (E) leachate.
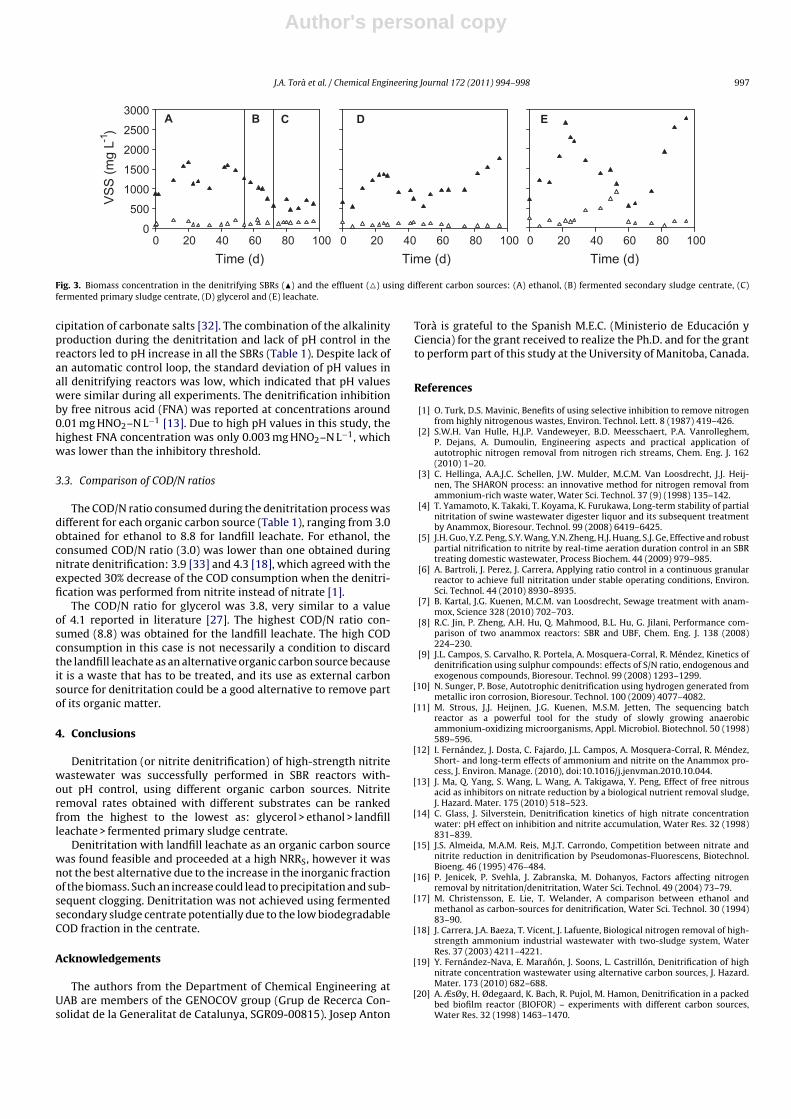
Author's personal copy
J.A. Torà et al. / Chemical Engineering Journal 172 (2011) 994– 998 997
Time (d)100806040200
VS
S (m
g L-1
)
0
500
1000
1500
2000
2500
3000A
Time (d)100806040200
Time (d)100806040200
B EDC
Fig. 3. Biomass concentration in the denitrifying SBRs (�) and the effluent (�) using different carbon sources: (A) ethanol, (B) fermented secondary sludge centrate, (C)fermented primary sludge centrate, (D) glycerol and (E) leachate.
cipitation of carbonate salts [32]. The combination of the alkalinityproduction during the denitritation and lack of pH control in thereactors led to pH increase in all the SBRs (Table 1). Despite lack ofan automatic control loop, the standard deviation of pH values inall denitrifying reactors was low, which indicated that pH valueswere similar during all experiments. The denitrification inhibitionby free nitrous acid (FNA) was reported at concentrations around0.01 mg HNO2–N L−1 [13]. Due to high pH values in this study, thehighest FNA concentration was only 0.003 mg HNO2–N L−1, whichwas lower than the inhibitory threshold.
3.3. Comparison of COD/N ratios
The COD/N ratio consumed during the denitritation process wasdifferent for each organic carbon source (Table 1), ranging from 3.0obtained for ethanol to 8.8 for landfill leachate. For ethanol, theconsumed COD/N ratio (3.0) was lower than one obtained duringnitrate denitrification: 3.9 [33] and 4.3 [18], which agreed with theexpected 30% decrease of the COD consumption when the denitri-fication was performed from nitrite instead of nitrate [1].
The COD/N ratio for glycerol was 3.8, very similar to a valueof 4.1 reported in literature [27]. The highest COD/N ratio con-sumed (8.8) was obtained for the landfill leachate. The high CODconsumption in this case is not necessarily a condition to discardthe landfill leachate as an alternative organic carbon source becauseit is a waste that has to be treated, and its use as external carbonsource for denitritation could be a good alternative to remove partof its organic matter.
4. Conclusions
Denitritation (or nitrite denitrification) of high-strength nitritewastewater was successfully performed in SBR reactors with-out pH control, using different organic carbon sources. Nitriteremoval rates obtained with different substrates can be rankedfrom the highest to the lowest as: glycerol > ethanol > landfillleachate > fermented primary sludge centrate.
Denitritation with landfill leachate as an organic carbon sourcewas found feasible and proceeded at a high NRRS, however it wasnot the best alternative due to the increase in the inorganic fractionof the biomass. Such an increase could lead to precipitation and sub-sequent clogging. Denitritation was not achieved using fermentedsecondary sludge centrate potentially due to the low biodegradableCOD fraction in the centrate.
Acknowledgements
The authors from the Department of Chemical Engineering atUAB are members of the GENOCOV group (Grup de Recerca Con-solidat de la Generalitat de Catalunya, SGR09-00815). Josep Anton
Torà is grateful to the Spanish M.E.C. (Ministerio de Educación yCiencia) for the grant received to realize the Ph.D. and for the grantto perform part of this study at the University of Manitoba, Canada.
References
[1] O. Turk, D.S. Mavinic, Benefits of using selective inhibition to remove nitrogenfrom highly nitrogenous wastes, Environ. Technol. Lett. 8 (1987) 419–426.
[2] S.W.H. Van Hulle, H.J.P. Vandeweyer, B.D. Meesschaert, P.A. Vanrolleghem,P. Dejans, A. Dumoulin, Engineering aspects and practical application ofautotrophic nitrogen removal from nitrogen rich streams, Chem. Eng. J. 162(2010) 1–20.
[3] C. Hellinga, A.A.J.C. Schellen, J.W. Mulder, M.C.M. Van Loosdrecht, J.J. Heij-nen, The SHARON process: an innovative method for nitrogen removal fromammonium-rich waste water, Water Sci. Technol. 37 (9) (1998) 135–142.
[4] T. Yamamoto, K. Takaki, T. Koyama, K. Furukawa, Long-term stability of partialnitritation of swine wastewater digester liquor and its subsequent treatmentby Anammox, Bioresour. Technol. 99 (2008) 6419–6425.
[5] J.H. Guo, Y.Z. Peng, S.Y. Wang, Y.N. Zheng, H.J. Huang, S.J. Ge, Effective and robustpartial nitrification to nitrite by real-time aeration duration control in an SBRtreating domestic wastewater, Process Biochem. 44 (2009) 979–985.
[6] A. Bartroli, J. Perez, J. Carrera, Applying ratio control in a continuous granularreactor to achieve full nitritation under stable operating conditions, Environ.Sci. Technol. 44 (2010) 8930–8935.
[7] B. Kartal, J.G. Kuenen, M.C.M. van Loosdrecht, Sewage treatment with anam-mox, Science 328 (2010) 702–703.
[8] R.C. Jin, P. Zheng, A.H. Hu, Q. Mahmood, B.L. Hu, G. Jilani, Performance com-parison of two anammox reactors: SBR and UBF, Chem. Eng. J. 138 (2008)224–230.
[9] J.L. Campos, S. Carvalho, R. Portela, A. Mosquera-Corral, R. Méndez, Kinetics ofdenitrification using sulphur compounds: effects of S/N ratio, endogenous andexogenous compounds, Bioresour. Technol. 99 (2008) 1293–1299.
[10] N. Sunger, P. Bose, Autotrophic denitrification using hydrogen generated frommetallic iron corrosion, Bioresour. Technol. 100 (2009) 4077–4082.
[11] M. Strous, J.J. Heijnen, J.G. Kuenen, M.S.M. Jetten, The sequencing batchreactor as a powerful tool for the study of slowly growing anaerobicammonium-oxidizing microorganisms, Appl. Microbiol. Biotechnol. 50 (1998)589–596.
[12] I. Fernández, J. Dosta, C. Fajardo, J.L. Campos, A. Mosquera-Corral, R. Méndez,Short- and long-term effects of ammonium and nitrite on the Anammox pro-cess, J. Environ. Manage. (2010), doi:10.1016/j.jenvman.2010.10.044.
[13] J. Ma, Q. Yang, S. Wang, L. Wang, A. Takigawa, Y. Peng, Effect of free nitrousacid as inhibitors on nitrate reduction by a biological nutrient removal sludge,J. Hazard. Mater. 175 (2010) 518–523.
[14] C. Glass, J. Silverstein, Denitrification kinetics of high nitrate concentrationwater: pH effect on inhibition and nitrite accumulation, Water Res. 32 (1998)831–839.
[15] J.S. Almeida, M.A.M. Reis, M.J.T. Carrondo, Competition between nitrate andnitrite reduction in denitrification by Pseudomonas-Fluorescens, Biotechnol.Bioeng. 46 (1995) 476–484.
[16] P. Jenicek, P. Svehla, J. Zabranska, M. Dohanyos, Factors affecting nitrogenremoval by nitritation/denitritation, Water Sci. Technol. 49 (2004) 73–79.
[17] M. Christensson, E. Lie, T. Welander, A comparison between ethanol andmethanol as carbon-sources for denitrification, Water Sci. Technol. 30 (1994)83–90.
[18] J. Carrera, J.A. Baeza, T. Vicent, J. Lafuente, Biological nitrogen removal of high-strength ammonium industrial wastewater with two-sludge system, WaterRes. 37 (2003) 4211–4221.
[19] Y. Fernández-Nava, E. Maranón, J. Soons, L. Castrillón, Denitrification of highnitrate concentration wastewater using alternative carbon sources, J. Hazard.Mater. 173 (2010) 682–688.
[20] A. ÆsØy, H. Ødegaard, K. Bach, R. Pujol, M. Hamon, Denitrification in a packedbed biofilm reactor (BIOFOR) – experiments with different carbon sources,Water Res. 32 (1998) 1463–1470.

Author's personal copy
998 J.A. Torà et al. / Chemical Engineering Journal 172 (2011) 994– 998
[21] A. Soares, P. Kampas, S. Maillard, E. Wood, J. Brigg, M. Tillotson, S.A. Parsons,E. Cartmell, Comparison between disintegrated and fermented sewage sludgefor production of a carbon source suitable for biological nutrient removal, J.Hazard. Mater. 175 (2010) 733–739.
[22] C. Di Iaconi, S. Rossetti, A. Lopez, A. Ried, Effective treatment of stabilizedmunicipal landfill leachates, Chem. Eng. J. 168 (2011) 1085–1092.
[23] I. Jubany, J. Lafuente, J.A. Baeza, J. Carrera, Total and stable washout of nitriteoxidizing bacteria from a nitrifying continuous activated sludge system usingautomatic control based on oxygen uptake rate measurements, Water Res. 43(2009) 2761–2772.
[24] APHA, Standard Methods for the Examination of Water and Wastewater, 19thed., American Public Health Association, Washington DC, USA, 1995.
[25] C. Arnaiz, J.C. Gutierrez, J. Lebrato, Biomass stabilization in the anaerobic diges-tion of wastewater sludges, Bioresour. Technol. 97 (2006) 1179–1184.
[26] H.N. Gavala, U. Yenal, I.V. Skiadas, P. Westermann, B.K. Ahring, Mesophilicand thermophilic anaerobic digestion of primary and secondary sludge.Effect of pre-treatment at elevated temperature, Water Res. 37 (2003)4561–4572.
[27] J.C. Akunna, C. Bizeau, R. Moletta, Nitrate and nitrite reductions with anaerobicsludge using various carbon sources: glucose glycerol, acetic acid, lactic acidand methanol, Water Res. 27 (1993) 1303–1312.
[28] J. Carrera, T. Vicent, F.J. Lafuente, Influence of temperature on denitrificationof an industrial high-strength nitrogen wastewater in a two-sludge system,Water SA 29 (2003) 11–16.
[29] S. Hasselblad, S. Hallin, Intermittent addition of external carbon to enhancedenitrification in activated sludge, Water Sci. Technol. 37 (1998) 227–233.
[30] P.J. Strong, B. McDonald, D.J. Gapes, Enhancing denitrification using a carbonsupplement generated from the wet oxidation of waste activated sludge, Biore-sour. Technol. 102 (2011) 5533–5540.
[31] M. Henze, R. Dupont, P. Grau, A. de la Sota, Rising sludge in secondary settlersdue to denitrification, Water Res. 27 (1993) 231–236.
[32] S. Lozecznik, R. Sparling, J.A. Oleszkiewicz, S. Clark, J.F. VanGulck, Leachate treat-ment before injection into a bioreactor landfill: clogging potential reductionand benefits of using methanogenesis, Waste Manage. 30 (2010) 2030–2036.
[33] P. Sobieszuk, K.W. Szewczyk, Estimation of (C/N) ratio for microbial denitrifi-cation, Environ. Technol. 27 (2006) 103–108.

IIITorà, J. A., Lafuente, J., Baeza, J. A. and Carrera, J.
Long-term starvation and subsequent reactivation of a high-rate partial
nitrification activated sludge pilot plant
Bioresource Technology. 2011; Volume 102, Issue 21, Pages 9870-9875

This article appeared in a journal published by Elsevier. The attachedcopy is furnished to the author for internal non-commercial researchand education use, including for instruction at the authors institution
and sharing with colleagues.
Other uses, including reproduction and distribution, or selling orlicensing copies, or posting to personal, institutional or third party
websites are prohibited.
In most cases authors are permitted to post their version of thearticle (e.g. in Word or Tex form) to their personal website orinstitutional repository. Authors requiring further information
regarding Elsevier’s archiving and manuscript policies areencouraged to visit:
http://www.elsevier.com/copyright

Author's personal copy
Long-term starvation and subsequent reactivation of a high-rate partialnitrification activated sludge pilot plant
Josep A. Torà, Javier Lafuente, Juan A. Baeza, Julián Carrera ⇑Department of Chemical Engineering, Escola d’Enginyeria, Universitat Autònoma de Barcelona, 08193 Cerdanyola del Vallès, Barcelona, Spain
a r t i c l e i n f o
Article history:Received 24 May 2011Received in revised form 1 August 2011Accepted 2 August 2011Available online 10 August 2011
Keywords:RecoveryNitritationDecay rateShutdownIdle
a b s t r a c t
The starvation process of a high-rate partial nitrification system during 30 days and its controlled recov-ery were studied in an activated sludge pilot plant. Four ammonium-starved reactors under anoxic, aer-obic and two different alternating aerobic/anoxic conditions were evaluated. The highest and the lowestdecay rates of ammonia oxidizing bacteria (AOB) were obtained under full aerobic (0.24 d�1) and fullanoxic (0.11 d�1) conditions, respectively. The evolution of biomass activity correlated well with theAOB quantification using FISH technique. AOB fractions lower than 1% were measured in the four reactorsafter 23 days of starvation. The recovery of the system was achieved in only 5 days using a nitrogen load-ing rate (NLR) control loop, obtaining the same conditions than before the long-term starvation periodwith a NLR of 1.2 g N L�1 d�1 and 98% of nitrite accumulation in the effluent.
� 2011 Elsevier Ltd. All rights reserved.
1. Introduction
There are many different industrial activities that generatehigh-strength ammonium wastewaters: petrochemical, pharma-ceutical, fertilizer and food industries, leachates produced by urbansolid waste disposal sites, waste from pig farms, anaerobic treat-ment or sludge dewatering processes. Currently, it is widely ac-cepted that the biological nitrogen removal via nitrite is thecheapest and most recommended treatment for this kind of waste-water (Carrera et al., 2011; Van Hulle et al., 2010). However, thebiological treatment of industrial wastewater is often challengedby its operation under transient states with respect to the flow pat-tern or variable influent characteristics (Sipma et al., 2010; WunJern, 2006). The fluctuation of the wastewater flow and periodswith low activity or even the complete production shutdown(due to annual maintenance or vacation periods) during someweeks and even months are common in some of the abovemen-tioned industries. During these periods, the biological treatmentsystem can be found under starvation conditions and its removalcapacity can be seriously affected. For this reason, a procedure tomaintain the biological activity under starvation conditions as wellas a fast start-up of the biological treatment capacity have to bedesigned.
The value of the decay rate for the nitrifying biomass is a keyparameter in the design of a procedure for managing a long-termstarvation period and the subsequent reactivation of a nitrifying
activated sludge (Jaroszynski and Oleszkiewicz, 2011; Salemet al., 2006). Some researchers have investigated the decay rateof a nitrifying population (including ammonia and nitrite oxidizingbacteria) during a starvation period on different biological waste-water treatments. These studies demonstrated that the nitrifyingdecay rate is higher under aerobic conditions and the best strategyto maintain the activity of the nitrifiers should be keeping thesludge under anoxic or anaerobic conditions (Salem et al., 2006;Siegrist et al., 1999) and even alternating aerobic/non-aerobic con-ditions (Lee and Oleszkiewicz, 2003; Morgenroth et al., 2000). Inaddition, the separate identification of the decay rate for ammoniaoxidizing bacteria (AOB) (Munz et al., 2011a) and nitrite oxidizingbacteria (NOB) (Jubany et al., 2005) is required to achieve a bettermodel description of nitrification systems.
Some authors have studied the recovery of different biologicalwastewater treatments after some weeks of starvation: anaerobicdigestion of a swine wastewater (Hwang et al., 2010), simulta-neous nitrogen and phosphorus removal from a domestic waste-water (Pijuan et al., 2009; Yilmaz et al., 2007) and completenitrification to nitrate of an industrial wastewater (Cabezas et al.,2009). However, no in-depth study about the evolution of biomassactivity and composition under different long-term starvationconditions and its subsequent recovery has been reported in theliterature for a high-rate partial nitrification system treating ahigh-strength ammonium wastewater.
The goal of this study is to determine the best conditions to dealwith a long-term starvation period of a partial nitrification acti-vated sludge system and its subsequent reactivation. The study in-cludes: (i) the determination of the AOB decay rate under four
0960-8524/$ - see front matter � 2011 Elsevier Ltd. All rights reserved.doi:10.1016/j.biortech.2011.08.008
⇑ Corresponding author. Tel.: +34 935812141; fax: +34 935812013.E-mail address: [email protected] (J. Carrera).
Bioresource Technology 102 (2011) 9870–9875
Contents lists available at SciVerse ScienceDirect
Bioresource Technology
journal homepage: www.elsevier .com/locate /bior tech
Author's personal copy
different starvation conditions: full aerobic, full anoxic and two dif-ferent alternating aerobic/anoxic, (ii) the evolution of the AOBactivity and the microbial population by fluorescence in situhybridization (FISH) analysis during a long-term starvation period(30 days) and (iii) the fast recovery of the partial nitrification sys-tem after a long-term starvation period through the use of an auto-matic control loop of the applied nitrogen loading rate (NLR).
2. Methods
2.1. Pilot plant configuration and nitrogen loading rate control loop
The pilot-scale activated sludge system consisted in three aero-bic reactors (called R1, R2 and R3) with a working volume of 26 Leach one and followed by a 25 L settler. The reactors were con-nected in series and they worked under completely mixed condi-tions. A fraction of R3 effluent was recycled to R1 (internalrecycle) to increase the dynamics of the system and to improvethe mixing between reactors and the control response. Detailedinformation about the pilot plant operation can be found in Jubanyet al. (2009a).
Each reactor was equipped with dissolved oxygen (DO) (WTWOxi 340i CellOx 325), pH (Crison pH 52-03) and temperatureprobes (Pt-100). The pH controller actuated in R1 and R2 as on–off controller by the addition of solid sodium carbonate throughsolid dispensers. The DO control was based on a PID algorithmand operated by manipulating pneumatic control valves whichmodified the airflow supplied through air diffusers placed at thebottom of the reactors. The temperature control, based on an on–off control, was implemented in each reactor and it was operatedby switching an electrical heating device.
Automatic on-line oxygen uptake rate (OUR) estimation wasimplemented in each reactor. The OUR measurement was per-formed every 10 min and it was based on the DO decrease in theliquid phase with no air inlet. These OUR measurements were usedby the control loop, which consisted of a proportional-integral (PI)feedback controller where the measured variable was the OUR inR3. Every 10 min, the supervisory expert controller calculated anaveraged OUR value with data from the last 30 min and comparedit to an OUR setpoint (OURSP) selected to achieve low ammoniumconcentration in the effluent. The difference among these twoOUR values was used by the controller algorithm to calculate anew inflow value and, as a result, the new NLR. Finally, the controlaction was transmitted to the process computer that changed thepump flow. Detailed information about the control system andthe selection of the OURSP can be found in Jubany et al. (2009a).
The synthetic influent mimics an industrial high-strengthammonium wastewater (1350 ± 25 mg N-NH4
+ L�1) with low bio-degradable COD concentration (30–35 mg L�1). The average sludgeretention time (SRT) was maintained at 5.0 ± 0.7 days and it wascalculated considering the purge of the system and the solids con-centration in the effluent.
2.2. Starvation conditions
Some industries have periods around 1 month with low activityor even the complete production shutdown (due to annual mainte-nance or vacation periods). Hence, four reactors (26 L each one)were filled with the nitrifying biomass of the activated sludge pilotplant and were maintained under ammonium starvation condi-tions for 30 days to simulate a long shutdown period. The starva-tion conditions were different in each reactor. One of them wasmaintained under full aerobic conditions, another one was main-tained under full anoxic conditions and two of them were main-tained under alternating aerobic/anoxic conditions (one of them
was aerated 1 h in every 6 h and the other one was aerated 1 hin every 24 h). During the aerobic phases the DO was maintainedat 6.5 ± 0.4 mg L�1 and during the anoxic phases DO was lowerthan 0.1 mg L�1. The average temperature in the four reactors dur-ing the long-term starvation period was 18 ± 2 �C. Although duringnormal plant operation the pH was controlled at 8.3, in order tosimulate the easiest and cheapest shutdown procedure for anindustry, the pH was not modified nor controlled during the star-vation period. Consequently, the pH increased to 8.5–9.0 duringthe starvation due to the stripping of inorganic carbon. Finally,no mechanical mixing conditions were applied in the reactorsand each of them contained an initial nitrite concentration of1350 mg N-NO2
� L�1 corresponding to the usual operational condi-tions of the pilot plant.
2.3. AOB activity measurement and decay rate determination
The AOB activity was determined through respirometric exper-iments using a LFS (liquid-flow-static) respirometer, where DOconcentration is measured in the liquid phase, which is staticand continuously aerated (Spanjers et al., 1998). The respirometerconsisted of a magnetically stirred vessel of 1 L capacity. Aerationwas supplied from the bottom through a microdiffuser, which en-sured small air bubbles and good oxygen transfer from the gasphase to liquid phase. A mass flow controller (Bronckhorst HiTec825) was used to provide the steady and specific air flow requiredfor an accurate OUR calculation. The temperature of the vessel wascontrolled at 18 �C with a thermostatic bath. The pH was continu-ously measured with a pH probe (WTW-Sentix 81) and controlledat 8.3 by the automatic addition of acid or base by an automaticburette (Crison MultiBurette 2S). DO was measured with aWTW-CellOx 325 probe. The probes were connected to a WTWinoLab Level 3 terminal which was connected via RS232 to a PCallowing for data monitoring and storage. A detailed descriptionof the procedure for OUR calculation using a LFS respirometercan be found elsewhere (Spanjers et al., 1998).
The AOB activity was measured as the maximum OUR obtainedafter the addition of an ammonium pulse of 25 mg N-NH4
+ L�1 inthe respirometer. A previous ammonium pulse was added 3 h be-fore the AOB activity determination to avoid the overestimationof the decay rate due to enzyme deactivation (Vanrolleghemet al., 2004). OUR was divided by the volatile suspended solids(VSS) concentration in the respirometer to obtain the specificOUR (SOUR). The SOUR reported in this work corresponds to exog-enous SOUR obtained subtracting the endogenous SOUR value tothe total measured SOUR. Each SOUR value was corrected for pos-sible oxygen limitation effects using the oxygen affinity coefficientfor AOB (KO,AOB = 0.74 mg O2 L�1; (Guisasola et al., 2005)). The res-pirometric experiments were carried out with 1 L of biomass fromone of the reactors under starvation conditions and biomass con-centrations between 750 and 900 mg VSS L�1. After performingthe respirometric tests the biomass was not returned to the reac-tors to avoid any interference to the starved biomass.
The respirometric experiments were performed at days 3, 7, 10,16, 22 and 29 of the starvation experiment for the full aerobic and1 h aerobic/23 h anoxic reactors and at days 4, 8, 11, 17, 23 and 30of the starvation experiment for full anoxic and 1 h aerobic/5 h an-oxic reactors.
The mathematical model used to determine the AOB decay ratewas an extension of the IWA Activated Sludge Model 1 (ASM1)(Henze et al., 2000) modified with two-step nitrification and deni-trification processes. The kinetic and stoichiometric parameters ofthe model were obtained from Henze et al. (2000) and Jubany et al.(2008). The model was implemented in MATLAB� and integratedusing ode15s. The AOB decay rate was optimized using fminsearch
J.A. Torà et al. / Bioresource Technology 102 (2011) 9870–9875 9871
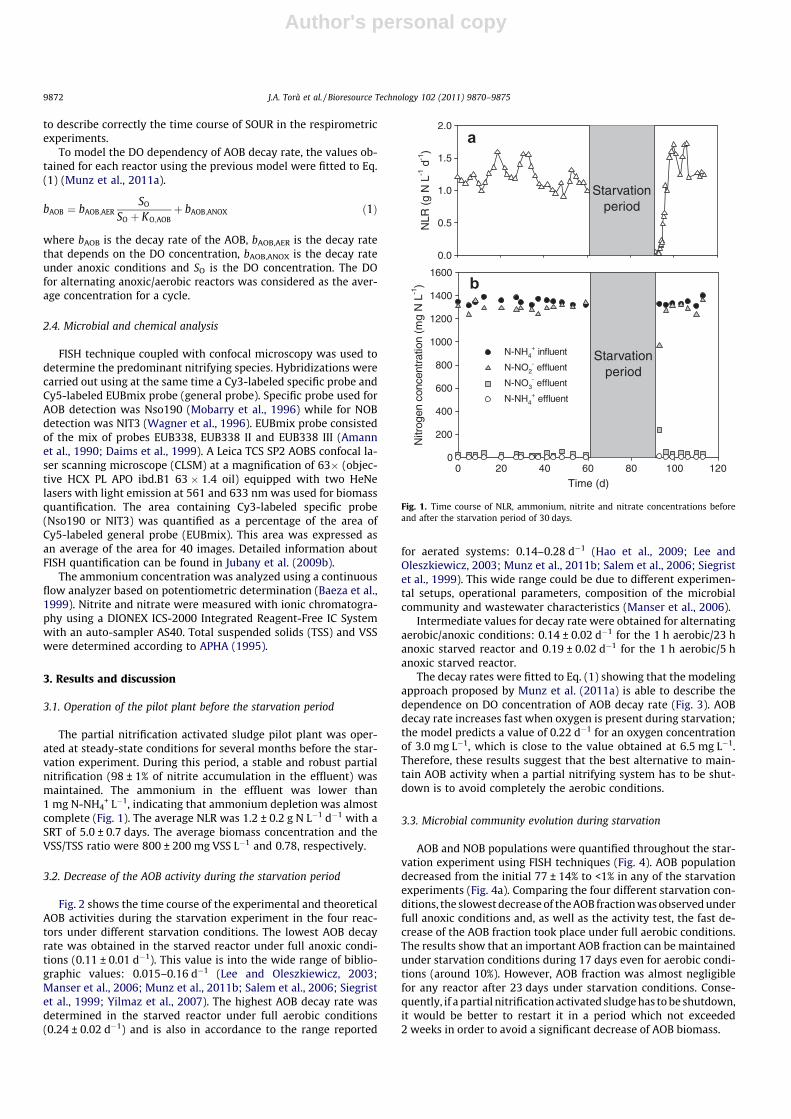
Author's personal copy
to describe correctly the time course of SOUR in the respirometricexperiments.
To model the DO dependency of AOB decay rate, the values ob-tained for each reactor using the previous model were fitted to Eq.(1) (Munz et al., 2011a).
bAOB ¼ bAOB;AERSO
SO þ KO;AOBþ bAOB;ANOX ð1Þ
where bAOB is the decay rate of the AOB, bAOB,AER is the decay ratethat depends on the DO concentration, bAOB,ANOX is the decay rateunder anoxic conditions and SO is the DO concentration. The DOfor alternating anoxic/aerobic reactors was considered as the aver-age concentration for a cycle.
2.4. Microbial and chemical analysis
FISH technique coupled with confocal microscopy was used todetermine the predominant nitrifying species. Hybridizations werecarried out using at the same time a Cy3-labeled specific probe andCy5-labeled EUBmix probe (general probe). Specific probe used forAOB detection was Nso190 (Mobarry et al., 1996) while for NOBdetection was NIT3 (Wagner et al., 1996). EUBmix probe consistedof the mix of probes EUB338, EUB338 II and EUB338 III (Amannet al., 1990; Daims et al., 1999). A Leica TCS SP2 AOBS confocal la-ser scanning microscope (CLSM) at a magnification of 63� (objec-tive HCX PL APO ibd.B1 63 � 1.4 oil) equipped with two HeNelasers with light emission at 561 and 633 nm was used for biomassquantification. The area containing Cy3-labeled specific probe(Nso190 or NIT3) was quantified as a percentage of the area ofCy5-labeled general probe (EUBmix). This area was expressed asan average of the area for 40 images. Detailed information aboutFISH quantification can be found in Jubany et al. (2009b).
The ammonium concentration was analyzed using a continuousflow analyzer based on potentiometric determination (Baeza et al.,1999). Nitrite and nitrate were measured with ionic chromatogra-phy using a DIONEX ICS-2000 Integrated Reagent-Free IC Systemwith an auto-sampler AS40. Total suspended solids (TSS) and VSSwere determined according to APHA (1995).
3. Results and discussion
3.1. Operation of the pilot plant before the starvation period
The partial nitrification activated sludge pilot plant was oper-ated at steady-state conditions for several months before the star-vation experiment. During this period, a stable and robust partialnitrification (98 ± 1% of nitrite accumulation in the effluent) wasmaintained. The ammonium in the effluent was lower than1 mg N-NH4
+ L�1, indicating that ammonium depletion was almostcomplete (Fig. 1). The average NLR was 1.2 ± 0.2 g N L�1 d�1 with aSRT of 5.0 ± 0.7 days. The average biomass concentration and theVSS/TSS ratio were 800 ± 200 mg VSS L�1 and 0.78, respectively.
3.2. Decrease of the AOB activity during the starvation period
Fig. 2 shows the time course of the experimental and theoreticalAOB activities during the starvation experiment in the four reac-tors under different starvation conditions. The lowest AOB decayrate was obtained in the starved reactor under full anoxic condi-tions (0.11 ± 0.01 d�1). This value is into the wide range of biblio-graphic values: 0.015–0.16 d�1 (Lee and Oleszkiewicz, 2003;Manser et al., 2006; Munz et al., 2011b; Salem et al., 2006; Siegristet al., 1999; Yilmaz et al., 2007). The highest AOB decay rate wasdetermined in the starved reactor under full aerobic conditions(0.24 ± 0.02 d�1) and is also in accordance to the range reported
for aerated systems: 0.14–0.28 d�1 (Hao et al., 2009; Lee andOleszkiewicz, 2003; Munz et al., 2011b; Salem et al., 2006; Siegristet al., 1999). This wide range could be due to different experimen-tal setups, operational parameters, composition of the microbialcommunity and wastewater characteristics (Manser et al., 2006).
Intermediate values for decay rate were obtained for alternatingaerobic/anoxic conditions: 0.14 ± 0.02 d�1 for the 1 h aerobic/23 hanoxic starved reactor and 0.19 ± 0.02 d�1 for the 1 h aerobic/5 hanoxic starved reactor.
The decay rates were fitted to Eq. (1) showing that the modelingapproach proposed by Munz et al. (2011a) is able to describe thedependence on DO concentration of AOB decay rate (Fig. 3). AOBdecay rate increases fast when oxygen is present during starvation;the model predicts a value of 0.22 d�1 for an oxygen concentrationof 3.0 mg L�1, which is close to the value obtained at 6.5 mg L�1.Therefore, these results suggest that the best alternative to main-tain AOB activity when a partial nitrifying system has to be shut-down is to avoid completely the aerobic conditions.
3.3. Microbial community evolution during starvation
AOB and NOB populations were quantified throughout the star-vation experiment using FISH techniques (Fig. 4). AOB populationdecreased from the initial 77 ± 14% to <1% in any of the starvationexperiments (Fig. 4a). Comparing the four different starvation con-ditions, the slowest decrease of the AOB fraction was observed underfull anoxic conditions and, as well as the activity test, the fast de-crease of the AOB fraction took place under full aerobic conditions.The results show that an important AOB fraction can be maintainedunder starvation conditions during 17 days even for aerobic condi-tions (around 10%). However, AOB fraction was almost negligiblefor any reactor after 23 days under starvation conditions. Conse-quently, if a partial nitrification activated sludge has to be shutdown,it would be better to restart it in a period which not exceeded2 weeks in order to avoid a significant decrease of AOB biomass.
NLR
(g
N L
-1 d
-1)
0.0
0.5
1.0
1.5
2.0
Starvationperiod
Time (d)0 20 40 60 80 100 120
Nitr
ogen
con
cent
ratio
n (m
g N
L-1
)
0
200
400
600
800
1000
1200
1400
1600
N-NH4+ influent
N-NO2- effluent
N-NO3- effluent
N-NH4+ effluent
Starvationperiod
a
b
Fig. 1. Time course of NLR, ammonium, nitrite and nitrate concentrations beforeand after the starvation period of 30 days.
9872 J.A. Torà et al. / Bioresource Technology 102 (2011) 9870–9875
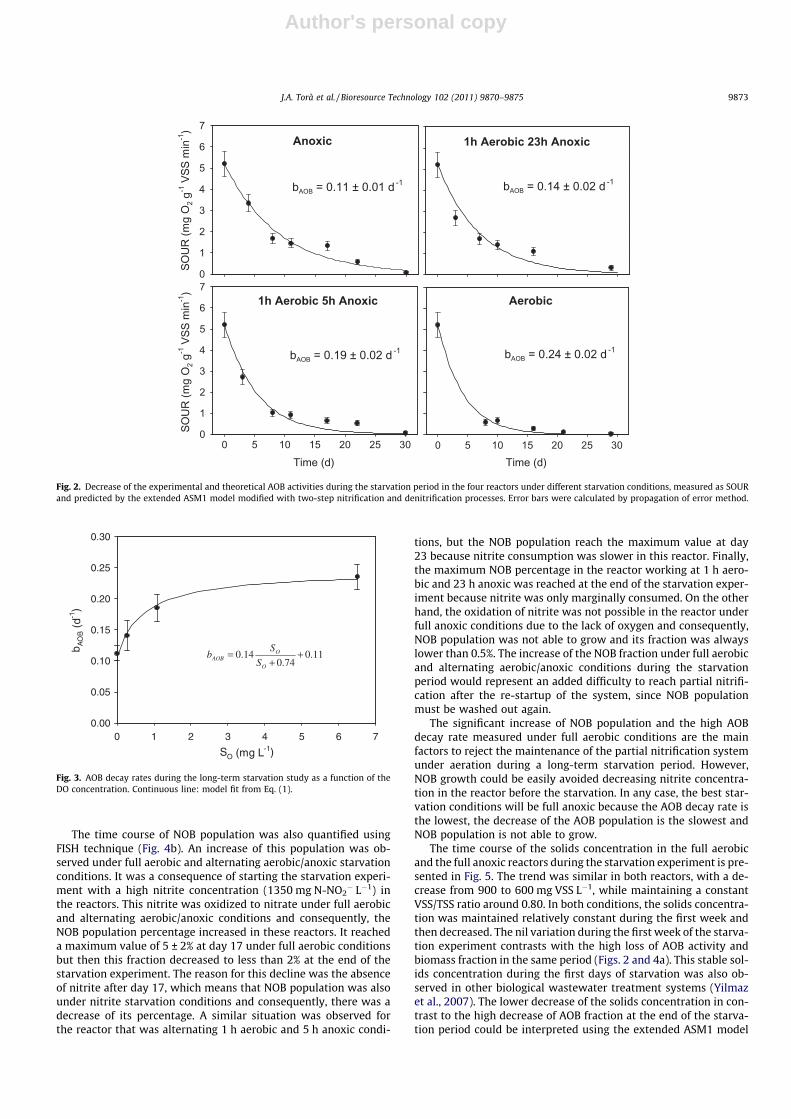
Author's personal copy
The time course of NOB population was also quantified usingFISH technique (Fig. 4b). An increase of this population was ob-served under full aerobic and alternating aerobic/anoxic starvationconditions. It was a consequence of starting the starvation experi-ment with a high nitrite concentration (1350 mg N-NO2
� L�1) inthe reactors. This nitrite was oxidized to nitrate under full aerobicand alternating aerobic/anoxic conditions and consequently, theNOB population percentage increased in these reactors. It reacheda maximum value of 5 ± 2% at day 17 under full aerobic conditionsbut then this fraction decreased to less than 2% at the end of thestarvation experiment. The reason for this decline was the absenceof nitrite after day 17, which means that NOB population was alsounder nitrite starvation conditions and consequently, there was adecrease of its percentage. A similar situation was observed forthe reactor that was alternating 1 h aerobic and 5 h anoxic condi-
tions, but the NOB population reach the maximum value at day23 because nitrite consumption was slower in this reactor. Finally,the maximum NOB percentage in the reactor working at 1 h aero-bic and 23 h anoxic was reached at the end of the starvation exper-iment because nitrite was only marginally consumed. On the otherhand, the oxidation of nitrite was not possible in the reactor underfull anoxic conditions due to the lack of oxygen and consequently,NOB population was not able to grow and its fraction was alwayslower than 0.5%. The increase of the NOB fraction under full aerobicand alternating aerobic/anoxic conditions during the starvationperiod would represent an added difficulty to reach partial nitrifi-cation after the re-startup of the system, since NOB populationmust be washed out again.
The significant increase of NOB population and the high AOBdecay rate measured under full aerobic conditions are the mainfactors to reject the maintenance of the partial nitrification systemunder aeration during a long-term starvation period. However,NOB growth could be easily avoided decreasing nitrite concentra-tion in the reactor before the starvation. In any case, the best star-vation conditions will be full anoxic because the AOB decay rate isthe lowest, the decrease of the AOB population is the slowest andNOB population is not able to grow.
The time course of the solids concentration in the full aerobicand the full anoxic reactors during the starvation experiment is pre-sented in Fig. 5. The trend was similar in both reactors, with a de-crease from 900 to 600 mg VSS L�1, while maintaining a constantVSS/TSS ratio around 0.80. In both conditions, the solids concentra-tion was maintained relatively constant during the first week andthen decreased. The nil variation during the first week of the starva-tion experiment contrasts with the high loss of AOB activity andbiomass fraction in the same period (Figs. 2 and 4a). This stable sol-ids concentration during the first days of starvation was also ob-served in other biological wastewater treatment systems (Yilmazet al., 2007). The lower decrease of the solids concentration in con-trast to the high decrease of AOB fraction at the end of the starva-tion period could be interpreted using the extended ASM1 model
1h Aerobic 23h Anoxic
Aerobic
Time (d)0 5 10 15 20 25 30
1h Aerobic 5h Anoxic
Time (d)0 5 10 15 20 25 30
SOU
R (m
g O
2 g-1
VSS
min
-1)
0
1
2
3
4
5
6
7
Anoxic
SOU
R (m
g O
2 g-1
VSS
min
-1)
0
1
2
3
4
5
6
7
bAOB = 0.11 ± 0.01 d -1 bAOB = 0.14 ± 0.02 d -1
bAOB = 0.19 ± 0.02 d -1 bAOB = 0.24 ± 0.02 d -1
Fig. 2. Decrease of the experimental and theoretical AOB activities during the starvation period in the four reactors under different starvation conditions, measured as SOURand predicted by the extended ASM1 model modified with two-step nitrification and denitrification processes. Error bars were calculated by propagation of error method.
SO (mg L-1)0 1 2 3 4 5 6 7
b AO
B (
d-1)
0.00
0.05
0.10
0.15
0.20
0.25
0.30
11.074.0
14.0 ++
=O
OAOB S
Sb
Fig. 3. AOB decay rates during the long-term starvation study as a function of theDO concentration. Continuous line: model fit from Eq. (1).
J.A. Torà et al. / Bioresource Technology 102 (2011) 9870–9875 9873
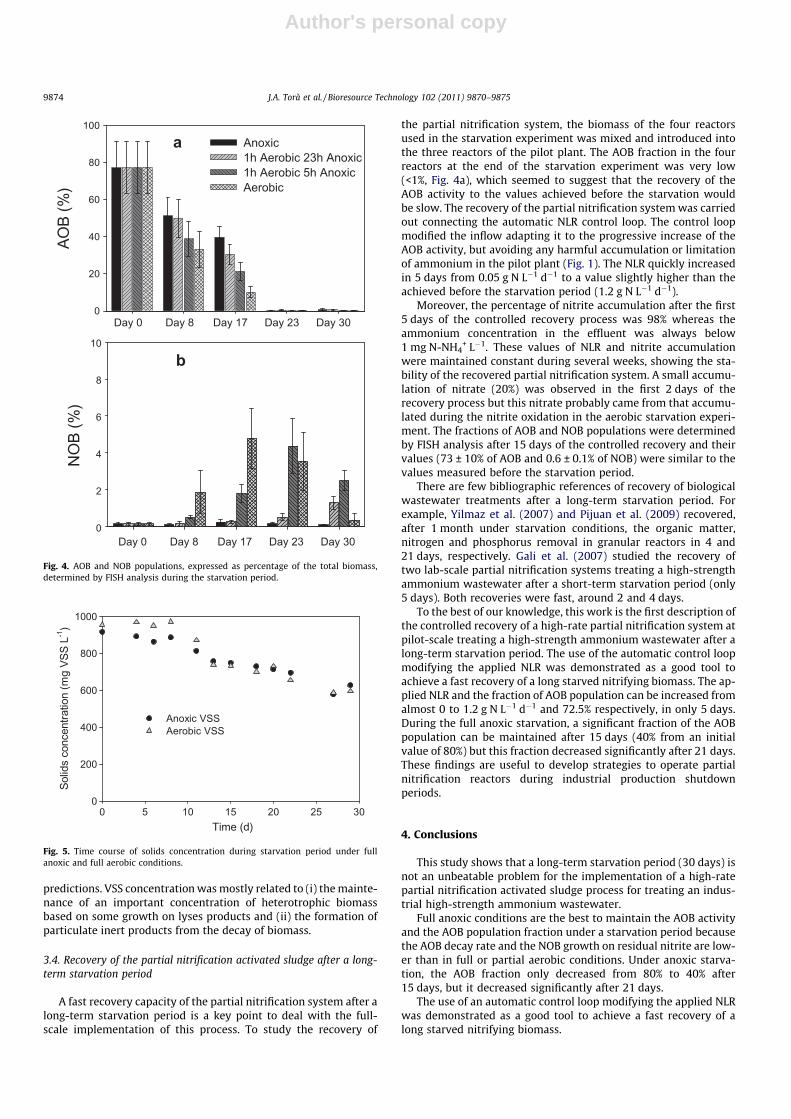
Author's personal copy
predictions. VSS concentration was mostly related to (i) the mainte-nance of an important concentration of heterotrophic biomassbased on some growth on lyses products and (ii) the formation ofparticulate inert products from the decay of biomass.
3.4. Recovery of the partial nitrification activated sludge after a long-term starvation period
A fast recovery capacity of the partial nitrification system after along-term starvation period is a key point to deal with the full-scale implementation of this process. To study the recovery of
the partial nitrification system, the biomass of the four reactorsused in the starvation experiment was mixed and introduced intothe three reactors of the pilot plant. The AOB fraction in the fourreactors at the end of the starvation experiment was very low(<1%, Fig. 4a), which seemed to suggest that the recovery of theAOB activity to the values achieved before the starvation wouldbe slow. The recovery of the partial nitrification system was carriedout connecting the automatic NLR control loop. The control loopmodified the inflow adapting it to the progressive increase of theAOB activity, but avoiding any harmful accumulation or limitationof ammonium in the pilot plant (Fig. 1). The NLR quickly increasedin 5 days from 0.05 g N L�1 d�1 to a value slightly higher than theachieved before the starvation period (1.2 g N L�1 d�1).
Moreover, the percentage of nitrite accumulation after the first5 days of the controlled recovery process was 98% whereas theammonium concentration in the effluent was always below1 mg N-NH4
+ L�1. These values of NLR and nitrite accumulationwere maintained constant during several weeks, showing the sta-bility of the recovered partial nitrification system. A small accumu-lation of nitrate (20%) was observed in the first 2 days of therecovery process but this nitrate probably came from that accumu-lated during the nitrite oxidation in the aerobic starvation experi-ment. The fractions of AOB and NOB populations were determinedby FISH analysis after 15 days of the controlled recovery and theirvalues (73 ± 10% of AOB and 0.6 ± 0.1% of NOB) were similar to thevalues measured before the starvation period.
There are few bibliographic references of recovery of biologicalwastewater treatments after a long-term starvation period. Forexample, Yilmaz et al. (2007) and Pijuan et al. (2009) recovered,after 1 month under starvation conditions, the organic matter,nitrogen and phosphorus removal in granular reactors in 4 and21 days, respectively. Gali et al. (2007) studied the recovery oftwo lab-scale partial nitrification systems treating a high-strengthammonium wastewater after a short-term starvation period (only5 days). Both recoveries were fast, around 2 and 4 days.
To the best of our knowledge, this work is the first description ofthe controlled recovery of a high-rate partial nitrification system atpilot-scale treating a high-strength ammonium wastewater after along-term starvation period. The use of the automatic control loopmodifying the applied NLR was demonstrated as a good tool toachieve a fast recovery of a long starved nitrifying biomass. The ap-plied NLR and the fraction of AOB population can be increased fromalmost 0 to 1.2 g N L�1 d�1 and 72.5% respectively, in only 5 days.During the full anoxic starvation, a significant fraction of the AOBpopulation can be maintained after 15 days (40% from an initialvalue of 80%) but this fraction decreased significantly after 21 days.These findings are useful to develop strategies to operate partialnitrification reactors during industrial production shutdownperiods.
4. Conclusions
This study shows that a long-term starvation period (30 days) isnot an unbeatable problem for the implementation of a high-ratepartial nitrification activated sludge process for treating an indus-trial high-strength ammonium wastewater.
Full anoxic conditions are the best to maintain the AOB activityand the AOB population fraction under a starvation period becausethe AOB decay rate and the NOB growth on residual nitrite are low-er than in full or partial aerobic conditions. Under anoxic starva-tion, the AOB fraction only decreased from 80% to 40% after15 days, but it decreased significantly after 21 days.
The use of an automatic control loop modifying the applied NLRwas demonstrated as a good tool to achieve a fast recovery of along starved nitrifying biomass.
Time (d)0 5 10 15 20 25 30
Solid
s co
ncen
tratio
n (m
g VS
S L-1
)
0
200
400
600
800
1000
Anoxic VSSAerobic VSS
Fig. 5. Time course of solids concentration during starvation period under fullanoxic and full aerobic conditions.
Day 0 Day 8 Day 17 Day 23 Day 30
Day 0 Day 8 Day 17 Day 23 Day 30
AOB
(%)
0
20
40
60
80
100
Anoxic 1h Aerobic 23h Anoxic 1h Aerobic 5h Anoxic Aerobic
NO
B (%
)
0
2
4
6
8
10
a
b
Fig. 4. AOB and NOB populations, expressed as percentage of the total biomass,determined by FISH analysis during the starvation period.
9874 J.A. Torà et al. / Bioresource Technology 102 (2011) 9870–9875
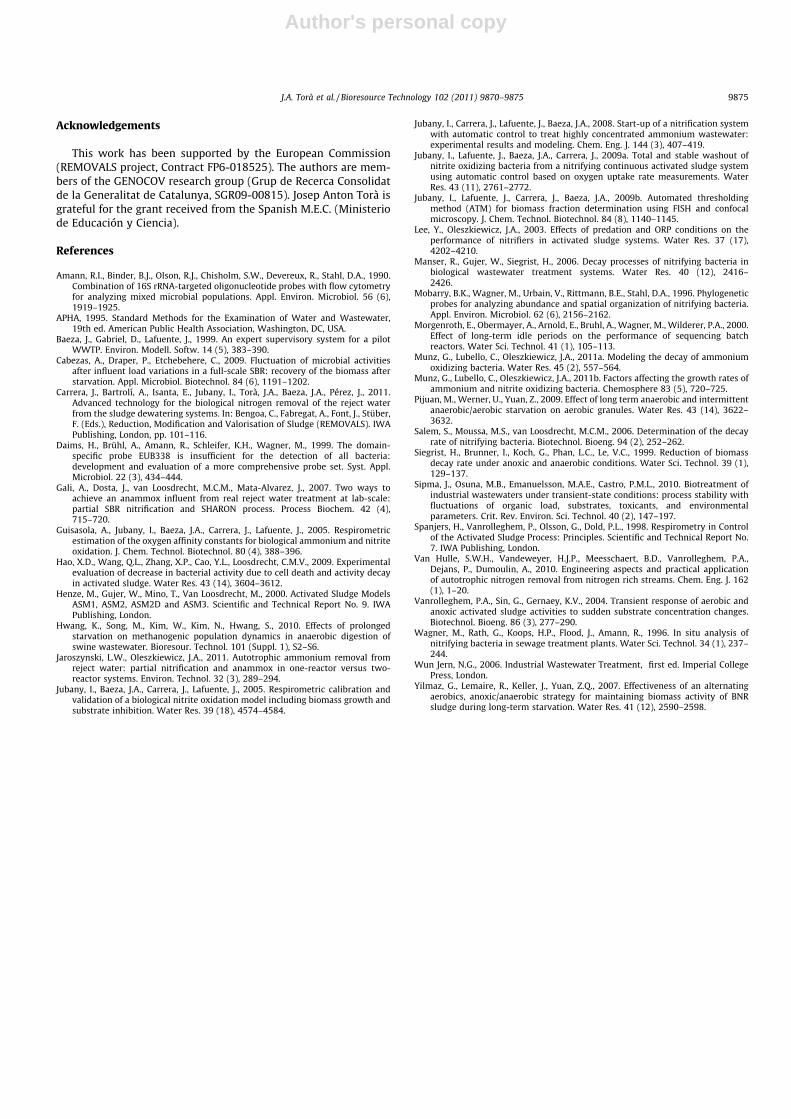
Author's personal copy
Acknowledgements
This work has been supported by the European Commission(REMOVALS project, Contract FP6-018525). The authors are mem-bers of the GENOCOV research group (Grup de Recerca Consolidatde la Generalitat de Catalunya, SGR09-00815). Josep Anton Torà isgrateful for the grant received from the Spanish M.E.C. (Ministeriode Educación y Ciencia).
References
Amann, R.I., Binder, B.J., Olson, R.J., Chisholm, S.W., Devereux, R., Stahl, D.A., 1990.Combination of 16S rRNA-targeted oligonucleotide probes with flow cytometryfor analyzing mixed microbial populations. Appl. Environ. Microbiol. 56 (6),1919–1925.
APHA, 1995. Standard Methods for the Examination of Water and Wastewater,19th ed. American Public Health Association, Washington, DC, USA.
Baeza, J., Gabriel, D., Lafuente, J., 1999. An expert supervisory system for a pilotWWTP. Environ. Modell. Softw. 14 (5), 383–390.
Cabezas, A., Draper, P., Etchebehere, C., 2009. Fluctuation of microbial activitiesafter influent load variations in a full-scale SBR: recovery of the biomass afterstarvation. Appl. Microbiol. Biotechnol. 84 (6), 1191–1202.
Carrera, J., Bartrolí, A., Isanta, E., Jubany, I., Torà, J.A., Baeza, J.A., Pérez, J., 2011.Advanced technology for the biological nitrogen removal of the reject waterfrom the sludge dewatering systems. In: Bengoa, C., Fabregat, A., Font, J., Stüber,F. (Eds.), Reduction, Modification and Valorisation of Sludge (REMOVALS). IWAPublishing, London, pp. 101–116.
Daims, H., Brühl, A., Amann, R., Schleifer, K.H., Wagner, M., 1999. The domain-specific probe EUB338 is insufficient for the detection of all bacteria:development and evaluation of a more comprehensive probe set. Syst. Appl.Microbiol. 22 (3), 434–444.
Gali, A., Dosta, J., van Loosdrecht, M.C.M., Mata-Alvarez, J., 2007. Two ways toachieve an anammox influent from real reject water treatment at lab-scale:partial SBR nitrification and SHARON process. Process Biochem. 42 (4),715–720.
Guisasola, A., Jubany, I., Baeza, J.A., Carrera, J., Lafuente, J., 2005. Respirometricestimation of the oxygen affinity constants for biological ammonium and nitriteoxidation. J. Chem. Technol. Biotechnol. 80 (4), 388–396.
Hao, X.D., Wang, Q.L., Zhang, X.P., Cao, Y.L., Loosdrecht, C.M.V., 2009. Experimentalevaluation of decrease in bacterial activity due to cell death and activity decayin activated sludge. Water Res. 43 (14), 3604–3612.
Henze, M., Gujer, W., Mino, T., Van Loosdrecht, M., 2000. Activated Sludge ModelsASM1, ASM2, ASM2D and ASM3. Scientific and Technical Report No. 9. IWAPublishing, London.
Hwang, K., Song, M., Kim, W., Kim, N., Hwang, S., 2010. Effects of prolongedstarvation on methanogenic population dynamics in anaerobic digestion ofswine wastewater. Bioresour. Technol. 101 (Suppl. 1), S2–S6.
Jaroszynski, L.W., Oleszkiewicz, J.A., 2011. Autotrophic ammonium removal fromreject water: partial nitrification and anammox in one-reactor versus two-reactor systems. Environ. Technol. 32 (3), 289–294.
Jubany, I., Baeza, J.A., Carrera, J., Lafuente, J., 2005. Respirometric calibration andvalidation of a biological nitrite oxidation model including biomass growth andsubstrate inhibition. Water Res. 39 (18), 4574–4584.
Jubany, I., Carrera, J., Lafuente, J., Baeza, J.A., 2008. Start-up of a nitrification systemwith automatic control to treat highly concentrated ammonium wastewater:experimental results and modeling. Chem. Eng. J. 144 (3), 407–419.
Jubany, I., Lafuente, J., Baeza, J.A., Carrera, J., 2009a. Total and stable washout ofnitrite oxidizing bacteria from a nitrifying continuous activated sludge systemusing automatic control based on oxygen uptake rate measurements. WaterRes. 43 (11), 2761–2772.
Jubany, I., Lafuente, J., Carrera, J., Baeza, J.A., 2009b. Automated thresholdingmethod (ATM) for biomass fraction determination using FISH and confocalmicroscopy. J. Chem. Technol. Biotechnol. 84 (8), 1140–1145.
Lee, Y., Oleszkiewicz, J.A., 2003. Effects of predation and ORP conditions on theperformance of nitrifiers in activated sludge systems. Water Res. 37 (17),4202–4210.
Manser, R., Gujer, W., Siegrist, H., 2006. Decay processes of nitrifying bacteria inbiological wastewater treatment systems. Water Res. 40 (12), 2416–2426.
Mobarry, B.K., Wagner, M., Urbain, V., Rittmann, B.E., Stahl, D.A., 1996. Phylogeneticprobes for analyzing abundance and spatial organization of nitrifying bacteria.Appl. Environ. Microbiol. 62 (6), 2156–2162.
Morgenroth, E., Obermayer, A., Arnold, E., Bruhl, A., Wagner, M., Wilderer, P.A., 2000.Effect of long-term idle periods on the performance of sequencing batchreactors. Water Sci. Technol. 41 (1), 105–113.
Munz, G., Lubello, C., Oleszkiewicz, J.A., 2011a. Modeling the decay of ammoniumoxidizing bacteria. Water Res. 45 (2), 557–564.
Munz, G., Lubello, C., Oleszkiewicz, J.A., 2011b. Factors affecting the growth rates ofammonium and nitrite oxidizing bacteria. Chemosphere 83 (5), 720–725.
Pijuan, M., Werner, U., Yuan, Z., 2009. Effect of long term anaerobic and intermittentanaerobic/aerobic starvation on aerobic granules. Water Res. 43 (14), 3622–3632.
Salem, S., Moussa, M.S., van Loosdrecht, M.C.M., 2006. Determination of the decayrate of nitrifying bacteria. Biotechnol. Bioeng. 94 (2), 252–262.
Siegrist, H., Brunner, I., Koch, G., Phan, L.C., Le, V.C., 1999. Reduction of biomassdecay rate under anoxic and anaerobic conditions. Water Sci. Technol. 39 (1),129–137.
Sipma, J., Osuna, M.B., Emanuelsson, M.A.E., Castro, P.M.L., 2010. Biotreatment ofindustrial wastewaters under transient-state conditions: process stability withfluctuations of organic load, substrates, toxicants, and environmentalparameters. Crit. Rev. Environ. Sci. Technol. 40 (2), 147–197.
Spanjers, H., Vanrolleghem, P., Olsson, G., Dold, P.L., 1998. Respirometry in Controlof the Activated Sludge Process: Principles. Scientific and Technical Report No.7. IWA Publishing, London.
Van Hulle, S.W.H., Vandeweyer, H.J.P., Meesschaert, B.D., Vanrolleghem, P.A.,Dejans, P., Dumoulin, A., 2010. Engineering aspects and practical applicationof autotrophic nitrogen removal from nitrogen rich streams. Chem. Eng. J. 162(1), 1–20.
Vanrolleghem, P.A., Sin, G., Gernaey, K.V., 2004. Transient response of aerobic andanoxic activated sludge activities to sudden substrate concentration changes.Biotechnol. Bioeng. 86 (3), 277–290.
Wagner, M., Rath, G., Koops, H.P., Flood, J., Amann, R., 1996. In situ analysis ofnitrifying bacteria in sewage treatment plants. Water Sci. Technol. 34 (1), 237–244.
Wun Jern, N.G., 2006. Industrial Wastewater Treatment, first ed. Imperial CollegePress, London.
Yilmaz, G., Lemaire, R., Keller, J., Yuan, Z.Q., 2007. Effectiveness of an alternatingaerobics, anoxic/anaerobic strategy for maintaining biomass activity of BNRsludge during long-term starvation. Water Res. 41 (12), 2590–2598.
J.A. Torà et al. / Bioresource Technology 102 (2011) 9870–9875 9875

IVTorà, J. A., Lafuente, J., Baeza, J. A. and Carrera, J.
Combined effect of inorganic carbon limitation and inhibition by free
ammonia and free nitrous acid on ammonia oxidizing bacteria
Bioresource Technology. 2010; Volume 101, Issue 15, Pages 6051-6058

This article appeared in a journal published by Elsevier. The attachedcopy is furnished to the author for internal non-commercial researchand education use, including for instruction at the authors institution
and sharing with colleagues.
Other uses, including reproduction and distribution, or selling orlicensing copies, or posting to personal, institutional or third party
websites are prohibited.
In most cases authors are permitted to post their version of thearticle (e.g. in Word or Tex form) to their personal website orinstitutional repository. Authors requiring further information
regarding Elsevier’s archiving and manuscript policies areencouraged to visit:
http://www.elsevier.com/copyright

Author's personal copy
Combined effect of inorganic carbon limitation and inhibition by free ammoniaand free nitrous acid on ammonia oxidizing bacteria
Josep A. Torà, Javier Lafuente, Juan A. Baeza, Julián Carrera *
Department of Chemical Engineering, Escola d’Enginyeria – Campus UAB – 08193 Bellaterra, Cerdanyola del Vallès, Barcelona, Universitat Autònoma de Barcelona, Spain
a r t i c l e i n f o
Article history:Received 23 November 2009Received in revised form 22 February 2010Accepted 3 March 2010Available online 30 March 2010
Keywords:Partial nitrificationKinetic modelingOxygen uptake rateStarvationFISH
a b s t r a c t
The inhibitory effect of free ammonia (NH3 or FA) and free nitrous acid (HNO2 or FNA) on the ammoniaoxidizing bacteria (AOB) and the dependence of the AOB activity on the concentration of total inorganiccarbon (TIC) are well-established. In contrast, less is know about the effect of high FA and FNA concen-trations in combination with TIC limitation. Respirometric tests performed with an enriched AOB sludge(81% of AOB as measured with fluorescent in situ hybridization) established that AOB inhibition by FAunder TIC limitation was higher than under non-limiting TIC conditions (Haldane inhibition coefficientsof 139 and 376 mg NH3 L�1). AOB affinity for FA decreased under TIC limitation conditions (half-satura-tion coefficient of 0.28 mg NH3 L�1 without TIC limitation and 4.3 mg NH3 L�1 with TIC limitation). Higherinhibition by FNA was observed when TIC was limited since the non-competitive inhibition coefficientdecreased from 1.31 mg HNO2 L�1 (without TIC limitation) to 0.21 mg HNO2 L�1 (with TIC limitation).This study demonstrates that AOB inhibitions by FA and FNA are amplified with TIC limitation and con-sequently, AOB dynamics are strongly modified under TIC limitation conditions.
� 2010 Elsevier Ltd. All rights reserved.
1. Introduction
The process of partial nitrification (ammonium oxidation to ni-trite) for treating high-strength wastewaters (reject water, landfillleachate and others) has many advantages with respect to com-plete nitrification (ammonium oxidation to nitrate) since it haslower oxygen requirements, reduced COD demand and CO2 emis-sions during heterotrophic denitrification, lower biomass produc-tion during anoxic growth and the opportunity to use theautotrophic denitrification or Anammox process (Peng and Zhu,2006; Turk and Mavinic, 1987; Van der Star et al., 2007).
Partial nitrification is achieved in continuous or batch reactorsprovided that growth of ammonia oxidizing bacteria (AOB) is fa-vored and the growth of nitrite oxidizing bacteria (NOB) is limitedor inhibited (Jubany et al., 2009a). Temperature, dissolved oxygen(DO) and pH are the main factors that affect AOB and NOB kineticsto a different degree and therefore are useful to achieve partialnitrification (Guisasola et al., 2005; Van Hulle et al., 2007). ThepH also influences the ammonium/free ammonia (NHþ4 =NH3 orFA) and nitrite/free nitrous acid (NO�2 =HNO2 or FNA) equilibria,and the unionized nitrogen forms (FA and FNA) can inhibit bothAOB and NOB populations. NOB is affected by FA and FNA morethan AOB (Anthonisen et al., 1976; Park and Bae, 2009; Vadiveluet al., 2006, 2007) and hence this characteristic can be used to
washout NOB from the process obtaining an enriched AOB popula-tion (Jubany et al., 2009a).
The effluents of partial nitrification systems treating high-strength wastewaters typically contain as nitrogen dischargeeither only nitrite (Jubany et al., 2009a; Tokutomi, 2004) or ammo-nium/nitrite ratio of 50% (Xue et al., 2009; Yamamoto et al., 2008).Consequently, the enriched AOB population of these systems issubjected to high concentrations of total nitrite nitrogen ðTNN ¼NO�2 þHNO2Þ or total ammonia nitrogen ðTAN ¼ NHþ4 þNH3Þ andTNN. Another feature of these systems is the possible existenceof inorganic carbon limitations, which can decrease AOB activity(Guisasola et al., 2007). This limitation can be due to the lack of en-ough total inorganic carbon (TIC) in the influent (Parkes et al.,2007; Wett and Rauch, 2003; Whang et al., 2009) or due to theoperation mode used for achieving partial nitrification (Fenget al., 2007; Ganigué et al., 2007). TNN and/or TAN accumulation,jointly to lack of TIC, are useful situations to eliminate NOB popu-lation or to obtain a suitable effluent for the Anammox process. Inthese circumstances, however, AOB population can be affected byFA and/or FNA inhibition, by TIC limitation or by the combinationof these effects. In this sense, some authors point out the need forstudies devoted to clarify these effects during partial nitrificationprocess (Ganigué et al., 2009; Yamamoto et al., 2008).
The objective of this work was to evaluate the combined effectof TIC limitation and inhibition by FA or FNA on the kinetics of anenriched AOB population by respirometry and fitting of the data toa kinetic model.
0960-8524/$ - see front matter � 2010 Elsevier Ltd. All rights reserved.doi:10.1016/j.biortech.2010.03.005
* Corresponding author. Tel.: +34 935812141; fax: +34 935812013.E-mail address: [email protected] (J. Carrera).
Bioresource Technology 101 (2010) 6051–6058
Contents lists available at ScienceDirect
Bioresource Technology
journal homepage: www.elsevier .com/locate /bior tech
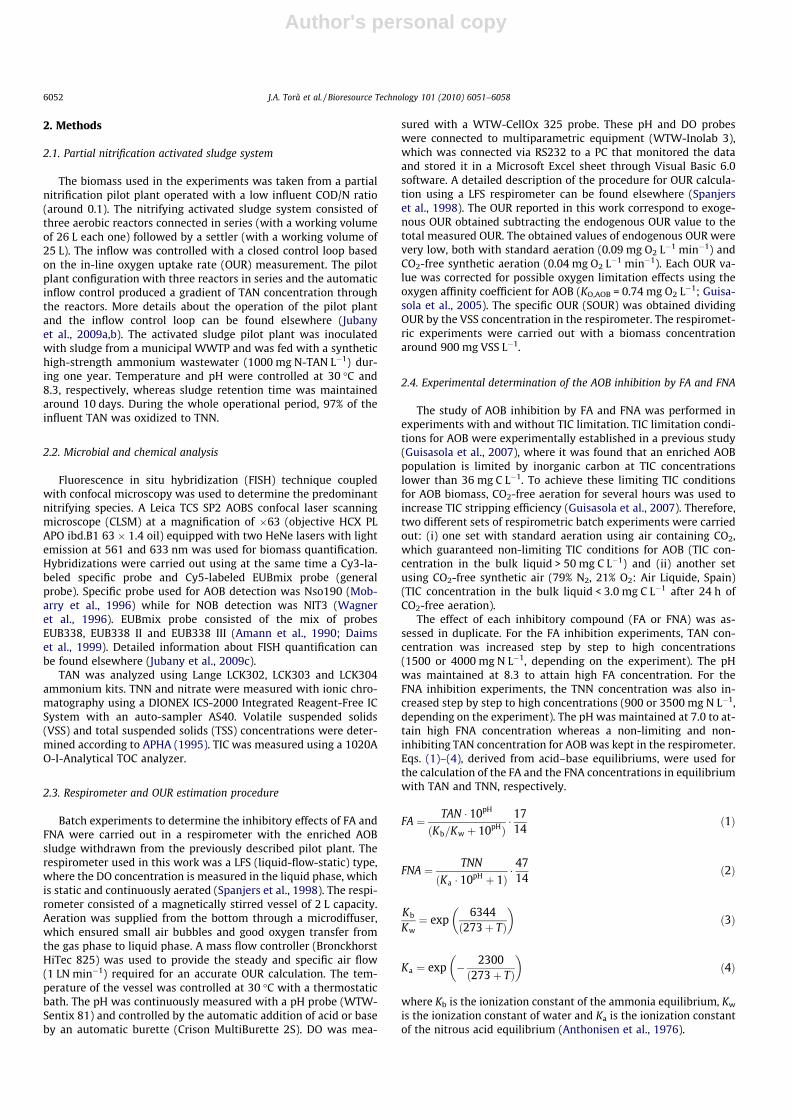
Author's personal copy
2. Methods
2.1. Partial nitrification activated sludge system
The biomass used in the experiments was taken from a partialnitrification pilot plant operated with a low influent COD/N ratio(around 0.1). The nitrifying activated sludge system consisted ofthree aerobic reactors connected in series (with a working volumeof 26 L each one) followed by a settler (with a working volume of25 L). The inflow was controlled with a closed control loop basedon the in-line oxygen uptake rate (OUR) measurement. The pilotplant configuration with three reactors in series and the automaticinflow control produced a gradient of TAN concentration throughthe reactors. More details about the operation of the pilot plantand the inflow control loop can be found elsewhere (Jubanyet al., 2009a,b). The activated sludge pilot plant was inoculatedwith sludge from a municipal WWTP and was fed with a synthetichigh-strength ammonium wastewater (1000 mg N-TAN L�1) dur-ing one year. Temperature and pH were controlled at 30 �C and8.3, respectively, whereas sludge retention time was maintainedaround 10 days. During the whole operational period, 97% of theinfluent TAN was oxidized to TNN.
2.2. Microbial and chemical analysis
Fluorescence in situ hybridization (FISH) technique coupledwith confocal microscopy was used to determine the predominantnitrifying species. A Leica TCS SP2 AOBS confocal laser scanningmicroscope (CLSM) at a magnification of �63 (objective HCX PLAPO ibd.B1 63 � 1.4 oil) equipped with two HeNe lasers with lightemission at 561 and 633 nm was used for biomass quantification.Hybridizations were carried out using at the same time a Cy3-la-beled specific probe and Cy5-labeled EUBmix probe (generalprobe). Specific probe used for AOB detection was Nso190 (Mob-arry et al., 1996) while for NOB detection was NIT3 (Wagneret al., 1996). EUBmix probe consisted of the mix of probesEUB338, EUB338 II and EUB338 III (Amann et al., 1990; Daimset al., 1999). Detailed information about FISH quantification canbe found elsewhere (Jubany et al., 2009c).
TAN was analyzed using Lange LCK302, LCK303 and LCK304ammonium kits. TNN and nitrate were measured with ionic chro-matography using a DIONEX ICS-2000 Integrated Reagent-Free ICSystem with an auto-sampler AS40. Volatile suspended solids(VSS) and total suspended solids (TSS) concentrations were deter-mined according to APHA (1995). TIC was measured using a 1020AO-I-Analytical TOC analyzer.
2.3. Respirometer and OUR estimation procedure
Batch experiments to determine the inhibitory effects of FA andFNA were carried out in a respirometer with the enriched AOBsludge withdrawn from the previously described pilot plant. Therespirometer used in this work was a LFS (liquid-flow-static) type,where the DO concentration is measured in the liquid phase, whichis static and continuously aerated (Spanjers et al., 1998). The respi-rometer consisted of a magnetically stirred vessel of 2 L capacity.Aeration was supplied from the bottom through a microdiffuser,which ensured small air bubbles and good oxygen transfer fromthe gas phase to liquid phase. A mass flow controller (BronckhorstHiTec 825) was used to provide the steady and specific air flow(1 LN min�1) required for an accurate OUR calculation. The tem-perature of the vessel was controlled at 30 �C with a thermostaticbath. The pH was continuously measured with a pH probe (WTW-Sentix 81) and controlled by the automatic addition of acid or baseby an automatic burette (Crison MultiBurette 2S). DO was mea-
sured with a WTW-CellOx 325 probe. These pH and DO probeswere connected to multiparametric equipment (WTW-Inolab 3),which was connected via RS232 to a PC that monitored the dataand stored it in a Microsoft Excel sheet through Visual Basic 6.0software. A detailed description of the procedure for OUR calcula-tion using a LFS respirometer can be found elsewhere (Spanjerset al., 1998). The OUR reported in this work correspond to exoge-nous OUR obtained subtracting the endogenous OUR value to thetotal measured OUR. The obtained values of endogenous OUR werevery low, both with standard aeration (0.09 mg O2 L�1 min�1) andCO2-free synthetic aeration (0.04 mg O2 L�1 min�1). Each OUR va-lue was corrected for possible oxygen limitation effects using theoxygen affinity coefficient for AOB (KO,AOB = 0.74 mg O2 L�1; Guisa-sola et al., 2005). The specific OUR (SOUR) was obtained dividingOUR by the VSS concentration in the respirometer. The respiromet-ric experiments were carried out with a biomass concentrationaround 900 mg VSS L�1.
2.4. Experimental determination of the AOB inhibition by FA and FNA
The study of AOB inhibition by FA and FNA was performed inexperiments with and without TIC limitation. TIC limitation condi-tions for AOB were experimentally established in a previous study(Guisasola et al., 2007), where it was found that an enriched AOBpopulation is limited by inorganic carbon at TIC concentrationslower than 36 mg C L�1. To achieve these limiting TIC conditionsfor AOB biomass, CO2-free aeration for several hours was used toincrease TIC stripping efficiency (Guisasola et al., 2007). Therefore,two different sets of respirometric batch experiments were carriedout: (i) one set with standard aeration using air containing CO2,which guaranteed non-limiting TIC conditions for AOB (TIC con-centration in the bulk liquid > 50 mg C L�1) and (ii) another setusing CO2-free synthetic air (79% N2, 21% O2: Air Liquide, Spain)(TIC concentration in the bulk liquid < 3.0 mg C L�1 after 24 h ofCO2-free aeration).
The effect of each inhibitory compound (FA or FNA) was as-sessed in duplicate. For the FA inhibition experiments, TAN con-centration was increased step by step to high concentrations(1500 or 4000 mg N L�1, depending on the experiment). The pHwas maintained at 8.3 to attain high FA concentration. For theFNA inhibition experiments, the TNN concentration was also in-creased step by step to high concentrations (900 or 3500 mg N L�1,depending on the experiment). The pH was maintained at 7.0 to at-tain high FNA concentration whereas a non-limiting and non-inhibiting TAN concentration for AOB was kept in the respirometer.Eqs. (1)–(4), derived from acid–base equilibriums, were used forthe calculation of the FA and the FNA concentrations in equilibriumwith TAN and TNN, respectively.
FA ¼ TAN � 10pH
ðKb=Kw þ 10pHÞ� 1714
ð1Þ
FNA ¼ TNN
ðKa � 10pH þ 1Þ� 4714
ð2Þ
Kb
Kw¼ exp
6344ð273þ TÞ
� �ð3Þ
Ka ¼ exp � 2300ð273þ TÞ
� �ð4Þ
where Kb is the ionization constant of the ammonia equilibrium, Kw
is the ionization constant of water and Ka is the ionization constantof the nitrous acid equilibrium (Anthonisen et al., 1976).
6052 J.A. Torà et al. / Bioresource Technology 101 (2010) 6051–6058
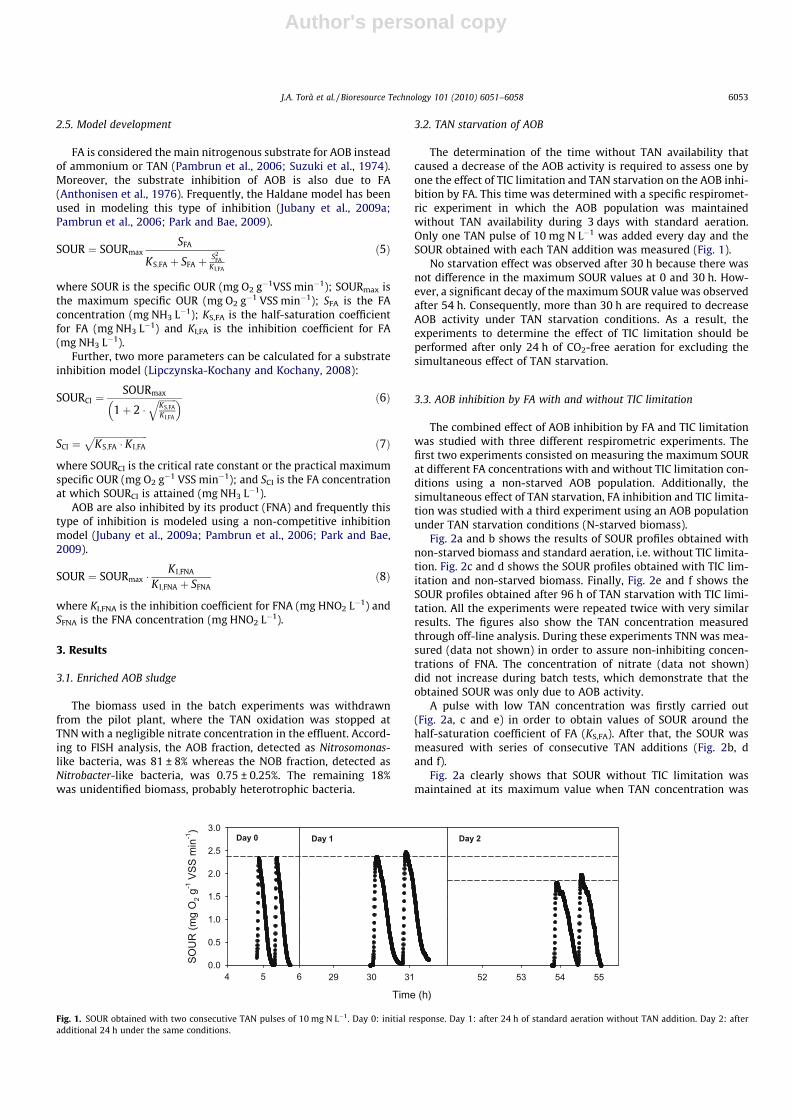
Author's personal copy
2.5. Model development
FA is considered the main nitrogenous substrate for AOB insteadof ammonium or TAN (Pambrun et al., 2006; Suzuki et al., 1974).Moreover, the substrate inhibition of AOB is also due to FA(Anthonisen et al., 1976). Frequently, the Haldane model has beenused in modeling this type of inhibition (Jubany et al., 2009a;Pambrun et al., 2006; Park and Bae, 2009).
SOUR ¼ SOURmaxSFA
KS;FA þ SFA þ S2FA
K I;FA
ð5Þ
where SOUR is the specific OUR (mg O2 g�1VSS min�1); SOURmax isthe maximum specific OUR (mg O2 g�1 VSS min�1); SFA is the FAconcentration (mg NH3 L�1); KS,FA is the half-saturation coefficientfor FA (mg NH3 L�1) and KI,FA is the inhibition coefficient for FA(mg NH3 L�1).
Further, two more parameters can be calculated for a substrateinhibition model (Lipczynska-Kochany and Kochany, 2008):
SOURCI ¼SOURmax
1þ 2 �ffiffiffiffiffiffiffiffiKS;FAKI;FA
q� � ð6Þ
SCI ¼ffiffiffiffiffiffiffiffiffiffiffiffiffiffiffiffiffiffiffiffiffiffiffiKS;FA � K I;FA
pð7Þ
where SOURCI is the critical rate constant or the practical maximumspecific OUR (mg O2 g�1 VSS min�1); and SCI is the FA concentrationat which SOURCI is attained (mg NH3 L�1).
AOB are also inhibited by its product (FNA) and frequently thistype of inhibition is modeled using a non-competitive inhibitionmodel (Jubany et al., 2009a; Pambrun et al., 2006; Park and Bae,2009).
SOUR ¼ SOURmax �K I;FNA
K I;FNA þ SFNAð8Þ
where KI,FNA is the inhibition coefficient for FNA (mg HNO2 L�1) andSFNA is the FNA concentration (mg HNO2 L�1).
3. Results
3.1. Enriched AOB sludge
The biomass used in the batch experiments was withdrawnfrom the pilot plant, where the TAN oxidation was stopped atTNN with a negligible nitrate concentration in the effluent. Accord-ing to FISH analysis, the AOB fraction, detected as Nitrosomonas-like bacteria, was 81 ± 8% whereas the NOB fraction, detected asNitrobacter-like bacteria, was 0.75 ± 0.25%. The remaining 18%was unidentified biomass, probably heterotrophic bacteria.
3.2. TAN starvation of AOB
The determination of the time without TAN availability thatcaused a decrease of the AOB activity is required to assess one byone the effect of TIC limitation and TAN starvation on the AOB inhi-bition by FA. This time was determined with a specific respiromet-ric experiment in which the AOB population was maintainedwithout TAN availability during 3 days with standard aeration.Only one TAN pulse of 10 mg N L�1 was added every day and theSOUR obtained with each TAN addition was measured (Fig. 1).
No starvation effect was observed after 30 h because there wasnot difference in the maximum SOUR values at 0 and 30 h. How-ever, a significant decay of the maximum SOUR value was observedafter 54 h. Consequently, more than 30 h are required to decreaseAOB activity under TAN starvation conditions. As a result, theexperiments to determine the effect of TIC limitation should beperformed after only 24 h of CO2-free aeration for excluding thesimultaneous effect of TAN starvation.
3.3. AOB inhibition by FA with and without TIC limitation
The combined effect of AOB inhibition by FA and TIC limitationwas studied with three different respirometric experiments. Thefirst two experiments consisted on measuring the maximum SOURat different FA concentrations with and without TIC limitation con-ditions using a non-starved AOB population. Additionally, thesimultaneous effect of TAN starvation, FA inhibition and TIC limita-tion was studied with a third experiment using an AOB populationunder TAN starvation conditions (N-starved biomass).
Fig. 2a and b shows the results of SOUR profiles obtained withnon-starved biomass and standard aeration, i.e. without TIC limita-tion. Fig. 2c and d shows the SOUR profiles obtained with TIC lim-itation and non-starved biomass. Finally, Fig. 2e and f shows theSOUR profiles obtained after 96 h of TAN starvation with TIC limi-tation. All the experiments were repeated twice with very similarresults. The figures also show the TAN concentration measuredthrough off-line analysis. During these experiments TNN was mea-sured (data not shown) in order to assure non-inhibiting concen-trations of FNA. The concentration of nitrate (data not shown)did not increase during batch tests, which demonstrate that theobtained SOUR was only due to AOB activity.
A pulse with low TAN concentration was firstly carried out(Fig. 2a, c and e) in order to obtain values of SOUR around thehalf-saturation coefficient of FA (KS,FA). After that, the SOUR wasmeasured with series of consecutive TAN additions (Fig. 2b, dand f).
Fig. 2a clearly shows that SOUR without TIC limitation wasmaintained at its maximum value when TAN concentration was
4 5 6
SOU
R (m
g O
2 g-1
VSS
min
-1)
0.0
0.5
1.0
1.5
2.0
2.5
3.0Day 0
Time (h)
29 30 31
Day 1
52 53 54 55
Day 2
Fig. 1. SOUR obtained with two consecutive TAN pulses of 10 mg N L�1. Day 0: initial response. Day 1: after 24 h of standard aeration without TAN addition. Day 2: afteradditional 24 h under the same conditions.
J.A. Torà et al. / Bioresource Technology 101 (2010) 6051–6058 6053
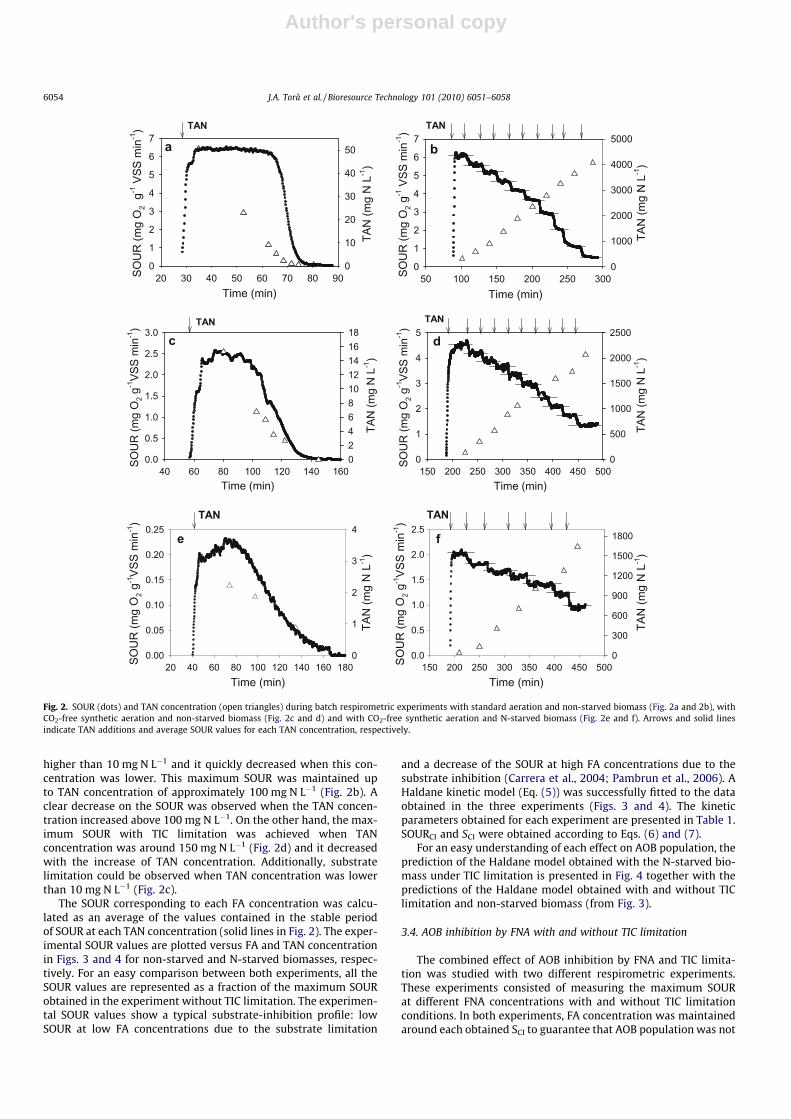
Author's personal copy
higher than 10 mg N L�1 and it quickly decreased when this con-centration was lower. This maximum SOUR was maintained upto TAN concentration of approximately 100 mg N L�1 (Fig. 2b). Aclear decrease on the SOUR was observed when the TAN concen-tration increased above 100 mg N L�1. On the other hand, the max-imum SOUR with TIC limitation was achieved when TANconcentration was around 150 mg N L�1 (Fig. 2d) and it decreasedwith the increase of TAN concentration. Additionally, substratelimitation could be observed when TAN concentration was lowerthan 10 mg N L�1 (Fig. 2c).
The SOUR corresponding to each FA concentration was calcu-lated as an average of the values contained in the stable periodof SOUR at each TAN concentration (solid lines in Fig. 2). The exper-imental SOUR values are plotted versus FA and TAN concentrationin Figs. 3 and 4 for non-starved and N-starved biomasses, respec-tively. For an easy comparison between both experiments, all theSOUR values are represented as a fraction of the maximum SOURobtained in the experiment without TIC limitation. The experimen-tal SOUR values show a typical substrate-inhibition profile: lowSOUR at low FA concentrations due to the substrate limitation
and a decrease of the SOUR at high FA concentrations due to thesubstrate inhibition (Carrera et al., 2004; Pambrun et al., 2006). AHaldane kinetic model (Eq. (5)) was successfully fitted to the dataobtained in the three experiments (Figs. 3 and 4). The kineticparameters obtained for each experiment are presented in Table 1.SOURCI and SCI were obtained according to Eqs. (6) and (7).
For an easy understanding of each effect on AOB population, theprediction of the Haldane model obtained with the N-starved bio-mass under TIC limitation is presented in Fig. 4 together with thepredictions of the Haldane model obtained with and without TIClimitation and non-starved biomass (from Fig. 3).
3.4. AOB inhibition by FNA with and without TIC limitation
The combined effect of AOB inhibition by FNA and TIC limita-tion was studied with two different respirometric experiments.These experiments consisted of measuring the maximum SOURat different FNA concentrations with and without TIC limitationconditions. In both experiments, FA concentration was maintainedaround each obtained SCI to guarantee that AOB population was not
Time (min)20 30 40 50 60 70 80 90SO
UR
(mg
O2
g-1VS
S m
in-1
)
0
1
2
3
4
5
6
7
TAN
(mg
N L
-1)
0
10
20
30
40
50
Time (min)50 100 150 200 250 300SO
UR
(mg
O2 g
-1VS
S m
in-1
)
0
1
2
3
4
5
6
7
TAN
(mg
N L
-1)
0
1000
2000
3000
4000
5000ba
TAN TAN
Time (min)40 60 80 100 120 140 160
SOU
R (m
g O
2 g-1
VSS
min
-1)
0.0
0.5
1.0
1.5
2.0
2.5
3.0
TAN
(mg
N L
-1)
024681012141618
Time (min)150 200 250 300 350 400 450 500
SOU
R (m
g O
2 g-1
VSS
min
-1)
0
1
2
3
4
5
TAN
(mg
N L
-1)
0
500
1000
1500
2000
2500cTAN
d
TAN
Time (min)20 40 60 80 100 120 140 160 180SO
UR
(mg
O2 g
-1VS
S m
in-1
)
0.00
0.05
0.10
0.15
0.20
0.25
TAN
(mg
N L
-1)
0
1
2
3
4
Time (min)150 200 250 300 350 400 450 500SO
UR
(mg
O2 g
-1VS
S m
in-1
)
0.0
0.5
1.0
1.5
2.0
2.5
TAN
(mg
N L
-1)
0
300
600
900
1200
1500
1800fe
TAN TAN
Fig. 2. SOUR (dots) and TAN concentration (open triangles) during batch respirometric experiments with standard aeration and non-starved biomass (Fig. 2a and 2b), withCO2-free synthetic aeration and non-starved biomass (Fig. 2c and d) and with CO2-free synthetic aeration and N-starved biomass (Fig. 2e and f). Arrows and solid linesindicate TAN additions and average SOUR values for each TAN concentration, respectively.
6054 J.A. Torà et al. / Bioresource Technology 101 (2010) 6051–6058
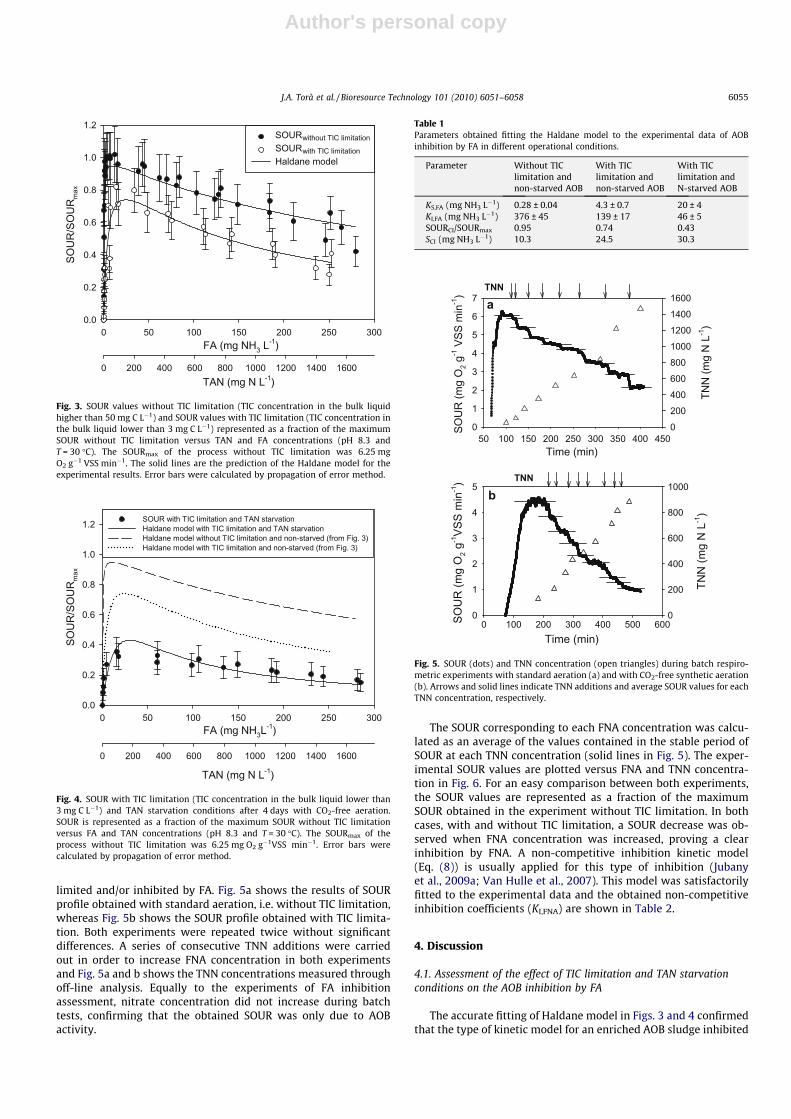
Author's personal copy
limited and/or inhibited by FA. Fig. 5a shows the results of SOURprofile obtained with standard aeration, i.e. without TIC limitation,whereas Fig. 5b shows the SOUR profile obtained with TIC limita-tion. Both experiments were repeated twice without significantdifferences. A series of consecutive TNN additions were carriedout in order to increase FNA concentration in both experimentsand Fig. 5a and b shows the TNN concentrations measured throughoff-line analysis. Equally to the experiments of FA inhibitionassessment, nitrate concentration did not increase during batchtests, confirming that the obtained SOUR was only due to AOBactivity.
The SOUR corresponding to each FNA concentration was calcu-lated as an average of the values contained in the stable period ofSOUR at each TNN concentration (solid lines in Fig. 5). The exper-imental SOUR values are plotted versus FNA and TNN concentra-tion in Fig. 6. For an easy comparison between both experiments,the SOUR values are represented as a fraction of the maximumSOUR obtained in the experiment without TIC limitation. In bothcases, with and without TIC limitation, a SOUR decrease was ob-served when FNA concentration was increased, proving a clearinhibition by FNA. A non-competitive inhibition kinetic model(Eq. (8)) is usually applied for this type of inhibition (Jubanyet al., 2009a; Van Hulle et al., 2007). This model was satisfactorilyfitted to the experimental data and the obtained non-competitiveinhibition coefficients (KI,FNA) are shown in Table 2.
4. Discussion
4.1. Assessment of the effect of TIC limitation and TAN starvationconditions on the AOB inhibition by FA
The accurate fitting of Haldane model in Figs. 3 and 4 confirmedthat the type of kinetic model for an enriched AOB sludge inhibited
FA (mg NH3 L-1)
0 50 100 150 200 250 300
SOU
R/S
OU
Rm
ax
0.0
0.2
0.4
0.6
0.8
1.0
1.2
TAN (mg N L-1)0 200 400 600 800 1000 1200 1400 1600
SOURwithout TIC limitationSOURwith TIC limitationHaldane model
Fig. 3. SOUR values without TIC limitation (TIC concentration in the bulk liquidhigher than 50 mg C L�1) and SOUR values with TIC limitation (TIC concentration inthe bulk liquid lower than 3 mg C L�1) represented as a fraction of the maximumSOUR without TIC limitation versus TAN and FA concentrations (pH 8.3 andT = 30 �C). The SOURmax of the process without TIC limitation was 6.25 mgO2 g�1 VSS min�1. The solid lines are the prediction of the Haldane model for theexperimental results. Error bars were calculated by propagation of error method.
FA (mg NH3L-1)
0 50 100 150 200 250 300
SOU
R/S
OU
Rm
ax
0.0
0.2
0.4
0.6
0.8
1.0
1.2
TAN (mg N L-1)
0 200 400 600 800 1000 1200 1400 1600
SOUR with TIC limitation and TAN starvationHaldane model with TIC limitation and TAN starvationHaldane model without TIC limitation and non-starved (from Fig. 3)Haldane model with TIC limitation and non-starved (from Fig. 3)
Fig. 4. SOUR with TIC limitation (TIC concentration in the bulk liquid lower than3 mg C L�1) and TAN starvation conditions after 4 days with CO2-free aeration.SOUR is represented as a fraction of the maximum SOUR without TIC limitationversus FA and TAN concentrations (pH 8.3 and T = 30 �C). The SOURmax of theprocess without TIC limitation was 6.25 mg O2 g�1VSS min�1. Error bars werecalculated by propagation of error method.
Table 1Parameters obtained fitting the Haldane model to the experimental data of AOBinhibition by FA in different operational conditions.
Parameter Without TIClimitation andnon-starved AOB
With TIClimitation andnon-starved AOB
With TIClimitation andN-starved AOB
KS,FA (mg NH3 L�1) 0.28 ± 0.04 4.3 ± 0.7 20 ± 4KI,FA (mg NH3 L�1) 376 ± 45 139 ± 17 46 ± 5SOURCI/SOURmax 0.95 0.74 0.43SCI (mg NH3 L�1) 10.3 24.5 30.3
TNN
Time (min)50 100 150 200 250 300 350 400 450
SOU
R (m
g O
2 g-1
VSS
min
-1)
0
1
2
3
4
5
6
7
TNN
(mg
N L
-1)
0
200
400
600
800
1000
1200
1400
1600
Time (min)0 100 200 300 400 500 600SO
UR
(mg
O2 g
-1VS
S m
in-1
)
0
1
2
3
4
5
TNN
(mg
N L
-1)
0
200
400
600
800
1000TNN
a
b
Fig. 5. SOUR (dots) and TNN concentration (open triangles) during batch respiro-metric experiments with standard aeration (a) and with CO2-free synthetic aeration(b). Arrows and solid lines indicate TNN additions and average SOUR values for eachTNN concentration, respectively.
J.A. Torà et al. / Bioresource Technology 101 (2010) 6051–6058 6055
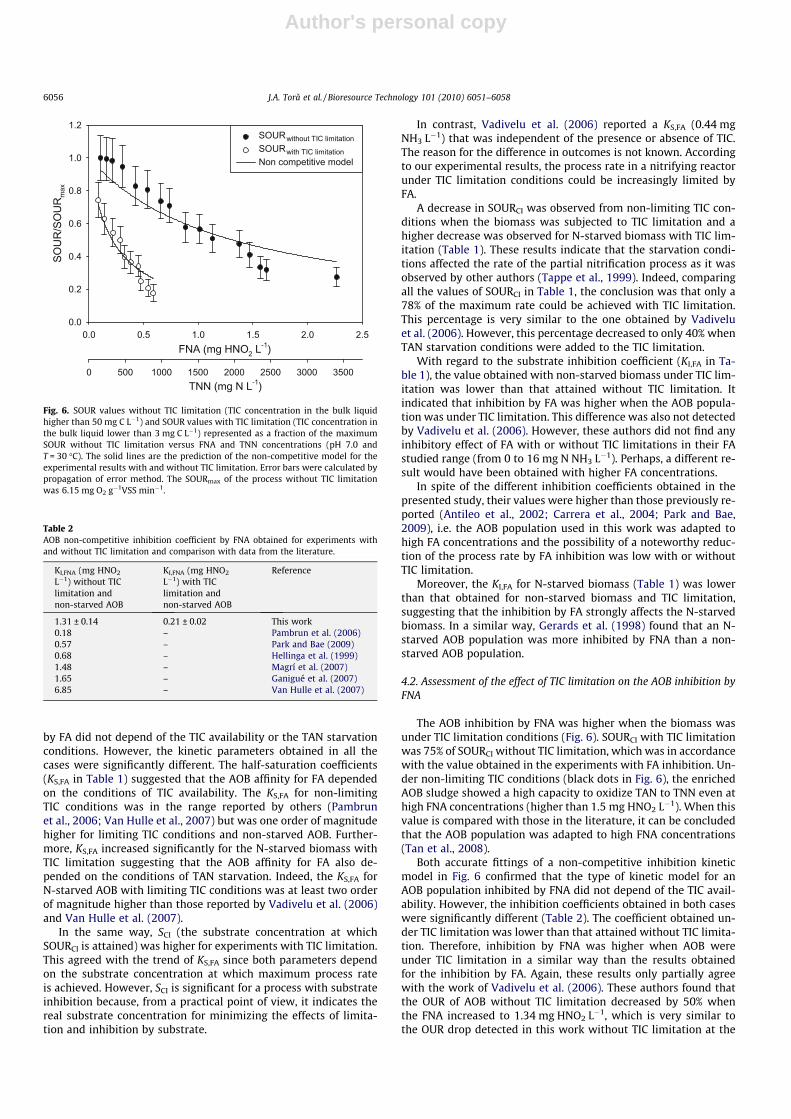
Author's personal copy
by FA did not depend of the TIC availability or the TAN starvationconditions. However, the kinetic parameters obtained in all thecases were significantly different. The half-saturation coefficients(KS,FA in Table 1) suggested that the AOB affinity for FA dependedon the conditions of TIC availability. The KS,FA for non-limitingTIC conditions was in the range reported by others (Pambrunet al., 2006; Van Hulle et al., 2007) but was one order of magnitudehigher for limiting TIC conditions and non-starved AOB. Further-more, KS,FA increased significantly for the N-starved biomass withTIC limitation suggesting that the AOB affinity for FA also de-pended on the conditions of TAN starvation. Indeed, the KS,FA forN-starved AOB with limiting TIC conditions was at least two orderof magnitude higher than those reported by Vadivelu et al. (2006)and Van Hulle et al. (2007).
In the same way, SCI (the substrate concentration at whichSOURCI is attained) was higher for experiments with TIC limitation.This agreed with the trend of KS,FA since both parameters dependon the substrate concentration at which maximum process rateis achieved. However, SCI is significant for a process with substrateinhibition because, from a practical point of view, it indicates thereal substrate concentration for minimizing the effects of limita-tion and inhibition by substrate.
In contrast, Vadivelu et al. (2006) reported a KS,FA (0.44 mgNH3 L�1) that was independent of the presence or absence of TIC.The reason for the difference in outcomes is not known. Accordingto our experimental results, the process rate in a nitrifying reactorunder TIC limitation conditions could be increasingly limited byFA.
A decrease in SOURCI was observed from non-limiting TIC con-ditions when the biomass was subjected to TIC limitation and ahigher decrease was observed for N-starved biomass with TIC lim-itation (Table 1). These results indicate that the starvation condi-tions affected the rate of the partial nitrification process as it wasobserved by other authors (Tappe et al., 1999). Indeed, comparingall the values of SOURCI in Table 1, the conclusion was that only a78% of the maximum rate could be achieved with TIC limitation.This percentage is very similar to the one obtained by Vadiveluet al. (2006). However, this percentage decreased to only 40% whenTAN starvation conditions were added to the TIC limitation.
With regard to the substrate inhibition coefficient (KI,FA in Ta-ble 1), the value obtained with non-starved biomass under TIC lim-itation was lower than that attained without TIC limitation. Itindicated that inhibition by FA was higher when the AOB popula-tion was under TIC limitation. This difference was also not detectedby Vadivelu et al. (2006). However, these authors did not find anyinhibitory effect of FA with or without TIC limitations in their FAstudied range (from 0 to 16 mg N NH3 L�1). Perhaps, a different re-sult would have been obtained with higher FA concentrations.
In spite of the different inhibition coefficients obtained in thepresented study, their values were higher than those previously re-ported (Antileo et al., 2002; Carrera et al., 2004; Park and Bae,2009), i.e. the AOB population used in this work was adapted tohigh FA concentrations and the possibility of a noteworthy reduc-tion of the process rate by FA inhibition was low with or withoutTIC limitation.
Moreover, the KI,FA for N-starved biomass (Table 1) was lowerthan that obtained for non-starved biomass and TIC limitation,suggesting that the inhibition by FA strongly affects the N-starvedbiomass. In a similar way, Gerards et al. (1998) found that an N-starved AOB population was more inhibited by FNA than a non-starved AOB population.
4.2. Assessment of the effect of TIC limitation on the AOB inhibition byFNA
The AOB inhibition by FNA was higher when the biomass wasunder TIC limitation conditions (Fig. 6). SOURCI with TIC limitationwas 75% of SOURCI without TIC limitation, which was in accordancewith the value obtained in the experiments with FA inhibition. Un-der non-limiting TIC conditions (black dots in Fig. 6), the enrichedAOB sludge showed a high capacity to oxidize TAN to TNN even athigh FNA concentrations (higher than 1.5 mg HNO2 L�1). When thisvalue is compared with those in the literature, it can be concludedthat the AOB population was adapted to high FNA concentrations(Tan et al., 2008).
Both accurate fittings of a non-competitive inhibition kineticmodel in Fig. 6 confirmed that the type of kinetic model for anAOB population inhibited by FNA did not depend of the TIC avail-ability. However, the inhibition coefficients obtained in both caseswere significantly different (Table 2). The coefficient obtained un-der TIC limitation was lower than that attained without TIC limita-tion. Therefore, inhibition by FNA was higher when AOB wereunder TIC limitation in a similar way than the results obtainedfor the inhibition by FA. Again, these results only partially agreewith the work of Vadivelu et al. (2006). These authors found thatthe OUR of AOB without TIC limitation decreased by 50% whenthe FNA increased to 1.34 mg HNO2 L�1, which is very similar tothe OUR drop detected in this work without TIC limitation at the
FNA (mg HNO2 L-1)
0.0 0.5 1.0 1.5 2.0 2.5
SOU
R/S
OU
Rm
ax
0.0
0.2
0.4
0.6
0.8
1.0
1.2
TNN (mg N L-1)0 500 1000 1500 2000 2500 3000 3500
SOURwithout TIC limitationSOURwith TIC limitationNon competitive model
Fig. 6. SOUR values without TIC limitation (TIC concentration in the bulk liquidhigher than 50 mg C L�1) and SOUR values with TIC limitation (TIC concentration inthe bulk liquid lower than 3 mg C L�1) represented as a fraction of the maximumSOUR without TIC limitation versus FNA and TNN concentrations (pH 7.0 andT = 30 �C). The solid lines are the prediction of the non-competitive model for theexperimental results with and without TIC limitation. Error bars were calculated bypropagation of error method. The SOURmax of the process without TIC limitationwas 6.15 mg O2 g�1VSS min�1.
Table 2AOB non-competitive inhibition coefficient by FNA obtained for experiments withand without TIC limitation and comparison with data from the literature.
KI,FNA (mg HNO2
L�1) without TIClimitation andnon-starved AOB
KI,FNA (mg HNO2
L�1) with TIClimitation andnon-starved AOB
Reference
1.31 ± 0.14 0.21 ± 0.02 This work0.18 – Pambrun et al. (2006)0.57 – Park and Bae (2009)0.68 – Hellinga et al. (1999)1.48 – Magrí et al. (2007)1.65 – Ganigué et al. (2007)6.85 – Van Hulle et al. (2007)
6056 J.A. Torà et al. / Bioresource Technology 101 (2010) 6051–6058
Author's personal copy
same FNA concentration (see Fig. 6). However, Vadivelu et al.(2006) found that the OUR of AOB with a high TIC limitation(defined in that work as complete absence of TIC) was less inhib-ited by FNA than the OUR without TIC limitation. Moreover, theseauthors found that the OUR with TIC limitation at 1.7 mg HNO2 L�1
was 50% of the maximum OUR without neither TIC limitation norFNA inhibition. However, as can be observed in Fig. 6, the OUR ob-tained in this work with TIC limitation at 0.5 mg HNO2 L�1 wasonly 20% of the maximum OUR without neither TIC limitationnor FNA inhibition. The reasons for this discrepancy are not known.
Both KI,FNA obtained in this work are included in the wide rangeof the bibliographic references for this type of inhibition (Table 2).This wide range of coefficients could be due to the different adap-tion of AOB to FNA in each study (Van Hulle et al., 2007). However,our results suggest that the determination of some of these coeffi-cients under TIC limitations conditions could explain the widerange of bibliographic coefficients.
4.3. Practical considerations of the combined effect of FA or FNAinhibition, TIC limitation and TAN starvation on an enriched AOBsludge
The AOB inhibition by FA is somewhat increased under TIC lim-itation conditions but, as the previous results demonstrated, theinhibition by FA increases if AOB are simultaneously under TIC lim-itation and TAN starvation conditions. A partial nitrification systemcould be under TAN starvation due to different operational situa-tions, i.e. an unplanned inflow stop or a seasonal closure of thewastewater production. Under these circumstances, if the start-up of the inflow is carried out without a well designed scheduling,the biomass could experience the combination of three differenteffects: TAN starvation, FA inhibition and TIC limitation, whichcan lead to an unexpected failure of the partial nitrification system.
The inhibition of AOB by FNA is especially amplified by thecombination with TIC limitation conditions. For instance, the accu-mulation of a FNA concentration of 0.5 mg HNO2 L�1 under non-limiting TIC conditions caused a decrease of 28% of the maximumAOB activity. Nevertheless, this percentage increases up to 70% ifthe system is under TIC limitation conditions.
The combination of a pH below 7.0 (which typically indicatesTIC limitation) and a high TNN concentration (consequently highFNA concentration) can often be found in partial nitrification sys-tems treating high-strength ammonium wastewaters (Feng et al.,2007; Gali et al., 2007; Magrí et al., 2007; Parkes et al., 2007;Yamamoto et al., 2008). Under these circumstances, the reactorperformance worsens and this problem is sometimes attributedto the intrinsic effect of pH on the nitritation rate (Gali et al.,2007). However, the results of this study demonstrate that the de-crease of the nitritation rate in these situations can be related tothe increase of the AOB inhibition by FNA under TIC limitationconditions.
5. Conclusions
This study showed that AOB were inhibited by FA and FNA, andboth inhibitions were higher under TIC limitation conditions.
AOB inhibition by FA was successfully fitted to a Haldane ki-netic model for both limiting and non-limiting TIC conditionsalthough a lower inhibition coefficient was obtained under TIClimitation. The values of the half-saturation coefficients showedthat the AOB affinity for FA depends on the conditions of TICavailability. Moreover, this study demonstrated that both theAOB inhibition and the affinity by FA worsen after four days underTAN starvation conditions.
The non-competitive inhibition model provided a good fittingfor inhibition by FNA under both limiting and non-limiting TICconditions but this inhibition was especially amplified with TIClimitation.
The findings of this study can explain some of the problems thatoccur in the operation of partial nitrification systems. However,further work is needed to understand the consequences of thecombined effect of FA and FNA inhibitions with TIC limitation forlong operational periods of those systems.
Acknowledgements
This work has been supported by the European Commission(REMOVALS project, Contract FP6-018525) and by the SpanishMinisterio de Educación y Ciencia (CTQ2008-02701-E). The authorsare members of the GENOCOV group (Grup de Recerca Consolidatde la Generalitat de Catalunya, SGR09-00815). Josep Anton Torà isgrateful for the grant received from the Spanish Ministerio de Edu-cación y Ciencia.
References
Amann, R.I., Binder, B.J., Olson, R.J., Chisholm, S.W., Devereux, R., Stahl, D.A., 1990.Combination of 16S rRNA-targeted oligonucleotide probes with flow cytometryfor analyzing mixed microbial populations. Appl. Environ. Microbiol. 56 (6),1919–1925.
Anthonisen, A.C., Loehr, R.C., Prakasan, T.B.S., Srineth, E.G., 1976. Inhibition ofnitrification by ammonia and nitrous acid. J. Water Pollut. Control Fed. 48, 835–852.
Antileo, C., Aspé, E., Urrutia, H., Zaror, C., Roeckel, M., 2002. Nitrifying biomassacclimation to high ammonia concentration. J. Environ. Eng. 128, 367–375.
APHA, 1995. Standard Methods for the Examination of Water and Wastewater, 19thed. American Publishers Health Association, Washington DC, USA.
Carrera, J., Jubany, I., Carvallo, L., Chamy, R., Lafuente, J., 2004. Kinetic models fornitrification inhibition by ammonium and nitrite in a suspended and animmobilised biomass systems. Process Biochem. 39, 1159–1165.
Daims, H., Brühl, A., Amann, R., Schleifer, K.H., Wagner, M., 1999. The domain-specific probe EUB338 is insufficient for the detection of all bacteria:development and evaluation of a more comprehensive probe set. Syst. Appl.Microbiol. 22 (3), 434–444.
Feng, Y., Tseng, S., Hsia, T., Ho, C., Chou, W., 2007. Partial nitrification of ammonium-rich wastewater as pretreatment for anaerobic ammonium oxidation(Anammox) using membrane aeration bioreactor. J. Biosci. Bioeng. 104, 182–187.
Gali, A., Dosta, J., van Loosdrecht, M.C.M., Mata-Alvarez, J., 2007. Two ways toachieve an Anammox influent from real reject water treatment at lab-scale:partial SBR nitrification and SHARON process. Process Biochem. 42, 715–720.
Ganigué, R., López, H., Balaguer, M.D., Colprim, J., 2007. Partial ammonium oxidationto nitrite of high ammonium content urban landfill leachates. Water Res. 41,3317–3326.
Ganigué, R., Gabarró, J., Sànchez-Melsió, A., Ruscadella, M., López, H., Vila, X.,Colprim, J., Balaguer, M., 2009. Long-term operation of a partial nitritation pilotplant treating leachate with extremely high ammonium concentration prior toan Anammox process. Bioresour. Technol. 100, 5624–5632.
Gerards, S., Duyts, H., Laanbroek, H.J., 1998. Ammonium-induced inhibition ofammonium-starved Nitrosomonas europaea cells in soil and sand slurries. FEMSMicrobiol. Ecol. 26, 269–280.
Guisasola, A., Jubany, I., Baeza, J.A., Carrera, J., Lafuente, J., 2005. Respirometricestimation of the oxygen affinity constants for biological ammonium and nitriteoxidation. J. Chem. Technol. Biotechnol. 80, 388–396.
Guisasola, A., Petzet, S., Baeza, J.A., Carrera, J., Lafuente, J., 2007. Inorganic carbonlimitations on nitrification: experimental assessment and modelling. Water Res.41, 277–286.
Hellinga, C., Van Loosdrecht, M.C.M., Heijnen, J.J., 1999. Model based design of anovel process for nitrogen removal from concentrated flows. Math. Comp.Model. Dyn. 5, 351–371.
Jubany, I., Lafuente, J., Baeza, J.A., Carrera, J., 2009a. Total and stable washout ofnitrite oxidizing bacteria from a nitrifying continuous activated sludge systemusing automatic control based on oxygen uptake rate measurements. WaterRes. 43, 2761–2772.
Jubany, I., Carrera, J., Lafuente, J., Baeza, J.A., 2009b. Expert control for a stableoperation of a partial nitrification system to treat highly concentratedammonium wastewater. Water Sci. Technol. 60 (5), 1191–1199.
Jubany, I., Lafuente, J., Carrera, J., Baeza, J.A., 2009c. Automated thresholding method(ATM) for biomass fraction determination using FISH and confocal microscopy.J. Chem. Technol. Biotechnol. 84, 1140–1145.
Lipczynska-Kochany, E., Kochany, J., 2008. Humic substances in bioremediation ofindustrial wastewater – mitigation of inhibition of activated sludge caused byphenol and formaldehyde. J. Environ. Sci. Health Part A 43, 619–626.
J.A. Torà et al. / Bioresource Technology 101 (2010) 6051–6058 6057
Author's personal copy
Magrí, A., Corominas, L., López, H., Campos, E., Balaguer, M., Colprim, J., Flotats, X.,2007. A model for the simulation of the SHARON process: pH as a key factor.Environ. Technol. 28, 255–265.
Mobarry, B.K., Wagner, M., Urbain, V., Rittmann, B.E., Stahl, D.A., 1996. Phylogeneticprobes for analyzing abundance and spatial organization of nitrifying bacteria.Appl. Environ. Microbiol. 62 (6), 2156–2162.
Pambrun, V., Paul, E., Sperandio, M., 2006. Modeling the partial nitrification insequencing batch reactor for biomass adapted to high ammonia concentrations.Biotechnol. Bioeng. 95, 120–131.
Park, S., Bae, W., 2009. Modeling kinetics of ammonium oxidation and nitriteoxidation under simultaneous inhibition by free ammonia and free nitrous acid.Process Biochem. 44, 631–640.
Parkes, S., Jolley, D., Wilson, S., 2007. Inorganic nitrogen transformations in thetreatment of landfill leachate with a high ammonium load: a case study.Environ. Monit. Assess. 124, 51–61.
Peng, Y., Zhu, G., 2006. Biological nitrogen removal with nitrification anddenitrification via nitrite pathway. Appl. Microbiol. Biotechnol. 73, 15–26.
Spanjers, H., Vanrolleghem, P., Olsson, G., Dold, P.L., 1998. Respirometry in Controlof the Activated Sludge Process: Principles. Scientific and technical report no. 7.IWA Publishing, London.
Suzuki, I., Dular, U., Kwok, S.C., 1974. Ammonia or ammonium ion as substrate foroxidation by Nitrosomonas europaea cells and extracts. J. Bacteriol. 120 (1), 556–558.
Tan, N., Kampschreur, M., Wanders, W., van der Pol, W., van de Vossenberg, J.,Kleerebezem, R., van Loosdrecht, M., Jetten, M., 2008. Physiological andphylogenetic study of an ammonium-oxidizing culture at high nitriteconcentrations. Syst. Appl. Microbiol. 31, 114–125.
Tappe, W., Laverman, A., Bohland, M., Braster, M., Rittershaus, S., Groeneweg, J., vanVerseveld, H.W., 1999. Maintenance energy demand and starvation recoverydynamics of Nitrosomonas europaea and Nitrobacter winogradkskyi cultivated ina retentostat with complete biomass retention. Appl. Environ. Microbiol. 65,2471–2477.
Tokutomi, T., 2004. Operation of a nitrite-type airlift reactor at low DOconcentration. Water Sci. Technol. 49 (5–6), 81–88.
Turk, O., Mavinic, D.S., 1987. Benefits of using selective inhibition to removenitrogen from highly nitrogenous wastes. Environ. Technol. Lett. 8 (9), 419–426.
Vadivelu, V., Keller, J., Yuan, Z., 2006. Effect of free ammonia and free nitrous acidconcentration on the anabolic and catabolic processes of an enrichedNitrosomonas culture. Biotechnol. Bioeng. 95, 830–839.
Vadivelu, V., Keller, J., Yuan, Z., 2007. Free ammonia and free nitrous acid inhibitionon the anabolic and catabolic processes of Nitrosomonas and Nitrobacter. WaterSci. Technol. 56 (7), 89–97.
Van der Star, W., Abma, W., Blommers, D., Mulder, J., Tokutomi, T., Strous, M.,Picioreanu, C., van Loosdrecht, M., 2007. Startup of reactors for anoxicammonium oxidation: experiences from the first full-scale Anammox reactorin Rotterdam. Water Res. 41, 4149–4163.
Van Hulle, S., Volcke, E., Lopez Teruel, J., Donckels, B., van Loosdrecht, M.,Vanrolleghem, P., 2007. Influence of temperature and pH on the kinetics ofthe Sharon nitritation process. J. Chem. Technol. Biotechnol. 82, 471–480.
Wagner, M., Rath, G., Koops, H.P., Flood, J., Amann, R., 1996. In situ analysis of nitrifyingbacteria in sewage treatment plants. Water Sci. Technol. 34 (1), 237–244.
Wett, B., Rauch, W., 2003. The role of inorganic carbon limitation in biologicalnitrogen removal of extremely ammonia concentrated wastewater. Water Res.37, 1100–1110.
Whang, L., Yang, K., Yang, Y., Han, Y., Chen, Y., Cheng, S., 2009. Microbial ecology andperformance of ammonia oxidizing bacteria (AOB) in biological processestreating petrochemical wastewater with high strength of ammonia: effect ofNa2CO3 addition. Water Sci. Technol. 59 (2), 223–231.
Xue, Y., Yang, F., Liu, S., Fu, Z., 2009. The influence of controlling factors on the start-up and operation for partial nitrification in membrane bioreactor. Bioresour.Technol. 100, 1055–1060.
Yamamoto, T., Takaki, K., Koyama, T., Furukawa, K., 2008. Long-term stability ofpartial nitritation of swine wastewater digester liquor and its subsequenttreatment by Anammox. Bioresour. Technol. 99, 6419–6425.
6058 J.A. Torà et al. / Bioresource Technology 101 (2010) 6051–6058

Apèndix II
Currículum Vitae

Currículum Vitae
95
Josep Anton Torà Suárez Aguilar de Segarra (Barcelona), 27 de Novembre de 1983
E-mail: [email protected]
Educació personal
2007–present: Estudiant de doctorat en Ciències Ambientals a la Universitat
Autònoma de Barcelona.
Títol: Eliminació biològica de nitrogen via nitrit d’un corrent amb alta
càrrega d’amoni (Nitrite pathway biological nitrogen removal of a high
strength ammonium wastewater).
2006–2007 Màster en Estudis Ambientals. Especialitat Tecnologia Ambiental per
la Universitat Autònoma de Barcelona.
Títol: Posada en marxa d’un sistema de nitrificació parcial a escala pilot
pel tractament de l’aigua de rebuig.
2001 – 2006 Llicenciat en Enginyeria Química per la Universitat Autònoma de
Barcelona amb l’obtenció del premi extraordinari.
Publicacions
Josep A. Torà, Javier Lafuente, Juan A. Baeza, Julián Carrera (2010). Combined effect
of inorganic carbon limitation and inhibition by free ammonia and free nitrous acid on
ammonia-oxidizing bacteria. Bioresource Technology. Volume 101, Issue 15, Pages
6051-6058.
Josep A. Torà, Javier Lafuente, Julián Carrera, Juan A. Baeza (2011). Fast start-up and
controlled operation during a long term period of a high-rate partial nitrification
activated sludge system. Environmental Technology. 2011; doi:
10.1080/09593330.2011.626802.
Apèndix II
96
Josep A. Torà, Juan A. Baeza, Julián Carrera, Jan A. Oleszkiewicz (2011).
Denitritation of a high-strength nitrite wastewater in a sequencing batch reactor using
different organic carbon sources. Chemical Engineering Journal. Volume 172, Issues (2-
3), Pages 994-998.
Josep A. Torà, Javier Lafuente, Juan A. Baeza, Julián Carrera (2011). Long-term
starvation and subsequent reactivation of a partial nitrification activated sludge system.
Bioresource Technology. Volume 102, Issue 21, Pages 9870-9875.
Ana García, Lucia Delgado, Josep A. Torà, Eudald Casals, Edgar González,
Víctor Puntes, Xavier Font, Julián Carrera, Antoni Sánchez (2011). Effect of cerium
dioxide, titanium dioxide, silver, and gold nanoparticles on the activity of microbial
communities intended in wastewater treatment. Journal of Hazardous Materials.
doi:10.1016/j.jhazmat.2011.10.057
Capítols de llibre
Julián Carrera, Albert Bartrolí, Eduardo Isanta, Irene Jubany, Josep A. Torà, Juan A.
Baeza, Julio Pérez. Advanced technology for the biological nitrogen removal of the
reject water from the sludge dewatering systems. In: Reduction, Modification and
Valorisation of Sludge (REMOVALS). Editors: Christophe Bengoa, Azael Fabregat,
Josep Font, Frank Stüber. IWA Publishing. ISBN: 9781843393450 (2011). Chapter 7,
Pages 101-116.
Participació en projectes
Finançats en convocatòries públiques
- REduction, MOdification and VALorisation of Sludge (REMOVALS).
Entitat finançadora: Comissió Europea. Contracte No.018525
Duració: Juliol 2006 – Juny 2009
Investigador responsable: Julián Carrera Muyo
Import al grup UAB: 274.000 €
Import total del projecte: 3.053.000 €
Currículum Vitae
97
- Automatic coNtrol for partial nitriFIcation to nitrite in BIOfilm reactors (ANFIBIO).
Entitat finançadora: Generalitat de Catalunya 2010 VALOR 0096
Duració: Gener 2011 – Desembre 2012
Investigador responsable: Julio Pérez Cañestro
Import del projecte: 76.970 €
Finançats per empreses
- Tractament i depuració biològica d’efluents.
Entitat finançadora: ECOIMSA S.A.
Duració: Febrer 2009 – Abril 2009
Investigador responsable: Julián Carrera Muyo i Javier Lafuente Sancho
Import del projecte: 42.000 €
- Investigació en matèria de bioreactors.
Entitat finançadora: Centro Tecnológico del Agua (CETaqua)
Duració: Setembre 2010 – Febrer 2011
Investigador responsable: Julián Carrera Muyo
Import del projecte: 18.000 €
Congressos
Congrés: Third International Meeting on Environmental Biotechnology and
Engineering (3IMEBE)
Lloc de Celebració: Palma de Mallorca (Espanya)
Data: 21-25 Set. 2008
Autors: Josep A. Torà, Juan A. Baeza, Javier Lafuente, Julián Carrera
Títol: Kinetic models for ammonium-oxidising bacteria inhibition by free ammonia and
free nitrous acid.
Tipus: Presentació oral
Estades
Estada a la University of Manitoba (Winnipeg, Canadà) del juliol de 2010 a l’octubre de
2010 sota la direcció del Prof. Jan A. Oleszkiewicz.


Notes

Notes

Notes