
ON-LINE POSSIBILISTIC DIAGNOSIS BASED ON EXPERT KNOWLEDGE FOR ENGINE … · 2017-08-25 · Engine...
14
ON-LINE POSSIBILISTIC DIAGNOSIS BASED ON EXPERT KNOWLEDGE FOR ENGINE DYNO TEST BENCHES O. de Mouzon, 1 X. Guérandel, 2 D. Dubois, 1 H. Prade, 1 and S. Boverie 3 1 Institut de Recherche en Informatique de Toulouse IRIT – UPS, 118 route de Narbonne, 31062 Toulouse Cedex 4, France {Olivier.deMouzon | Didier.Dubois | Henri.Prade}@irit.fr 2 Université Paul sabatier DRT ISI, UPS, 118 route de Narbonne, 31062 Toulouse Cedex 4, France [email protected] 3 Siemens VDO Automotive S.A.S. 1 Avenue Paul Ourliac, BP 1149, 31036 Toulouse Cedex, France [email protected] Abstract Car engine electronic control unit tuning is a tedious and difficult task. Engi- neers can no more check on-line the measurements validity: Control strategies are becoming more complex and measurements more numerous. A fault diag- nosis approach relying on experts’ qualitative and uncertain knowledge has been developed to identify whenever a malfunction is present. The theoretical frame- work - based on possibility theory and on consistency and abductive indices - is first explained. The latest results are then presented. Finally, the whole incre- mental development process of the prototypes is described, explaining the most difficult points and how they were handled. Keywords: Diagnosis, engine dynamometer, uncertainty, fuzzy sets, possibility theory. Introduction The paper presents a prototype implementation part of a long term research and development project, which aims at improving the calibration of car en- gine Electronic Control Unit (ECU), on engine dyno test benches, by detecting malfunctions when they occur. The approach is based on a fault diagnosis system (named BEST: Bench Expert System Tool) that makes use of expert’s knowledge formalized with fuzzy sets. In fact, since [Sanchez, 1977], much work has been carried out in
Transcript of ON-LINE POSSIBILISTIC DIAGNOSIS BASED ON EXPERT KNOWLEDGE FOR ENGINE … · 2017-08-25 · Engine...
ON-LINE POSSIBILISTIC DIAGNOSISBASED ON EXPERT KNOWLEDGEFOR ENGINE DYNO TEST BENCHES
O. de Mouzon,1 X. Guérandel,2 D. Dubois,1 H. Prade,1 and S. Boverie3
1 Institut de Recherche en Informatique de ToulouseIRIT – UPS, 118 route de Narbonne, 31062 Toulouse Cedex 4, France{Olivier.deMouzon | Didier.Dubois | Henri.Prade}@irit.fr
2 Université Paul sabatierDRT ISI, UPS, 118 route de Narbonne, 31062 Toulouse Cedex 4, [email protected]
3 Siemens VDO Automotive S.A.S.1 Avenue Paul Ourliac, BP 1149, 31036 Toulouse Cedex, [email protected]
Abstract Car engine electronic control unit tuning is a tedious and difficult task. Engi-neers can no more check on-line the measurements validity: Control strategiesare becoming more complex and measurements more numerous. A fault diag-nosis approach relying on experts’ qualitative and uncertain knowledge has beendeveloped to identify whenever a malfunction is present. The theoretical frame-work - based on possibility theory and on consistency and abductive indices - isfirst explained. The latest results are then presented. Finally, the whole incre-mental development process of the prototypes is described, explaining the mostdifficult points and how they were handled.
Keywords: Diagnosis, engine dynamometer, uncertainty, fuzzy sets, possibility theory.
IntroductionThe paper presents a prototype implementation part of a long term research
and development project, which aims at improving the calibration of car en-gine Electronic Control Unit (ECU), on engine dyno test benches, by detectingmalfunctions when they occur.
The approach is based on a fault diagnosis system (named BEST: BenchExpert System Tool) that makes use of expert’s knowledge formalized withfuzzy sets. In fact, since [Sanchez, 1977], much work has been carried out in
436
this field of fuzzy sets and diagnosis, and applied in different fields: E.g. inmedical applications ([Buisson, 1999]) or industrial processes ([Ulieru, 2000]).
The paper is organized as follows: Section 1 describes the engine dynocontext, the needs and expected benefits, and the architecture of BEST. Thetheoretical base on which it relies is presented in section 2. Then, section 3presents the current prototypes and latest results. The discussion in section 4points out the problems that were encountered and how they were solved. Theconclusion indicates the last steps to be further developed.
1. Context and frameworkIn oder to better understand the results and the choices made during the
project, this section first presents the engine dyno test bench context and thengives the general architecture designed for BEST.
Engine dyno test benchesWithin one century, diesel and gasoline cars have gone from the carburettor
to the electronic injection (ECU-controlled). More and more complex strate-gies have been implemented to answer to increasing constraints (pollutant reg-ulations, vehicle behavior, new engine configuration: Direct injection, dieselcommon rail, variable valve timing, electric controlled throttle...) and an in-creasing number of variables must be taken into account.
For each new engine or new version, the control strategy parameters haveto be calibrated in order to fit the requirements. This is done through a largeamount of testing and tuning, starting on engine dyno test benches.
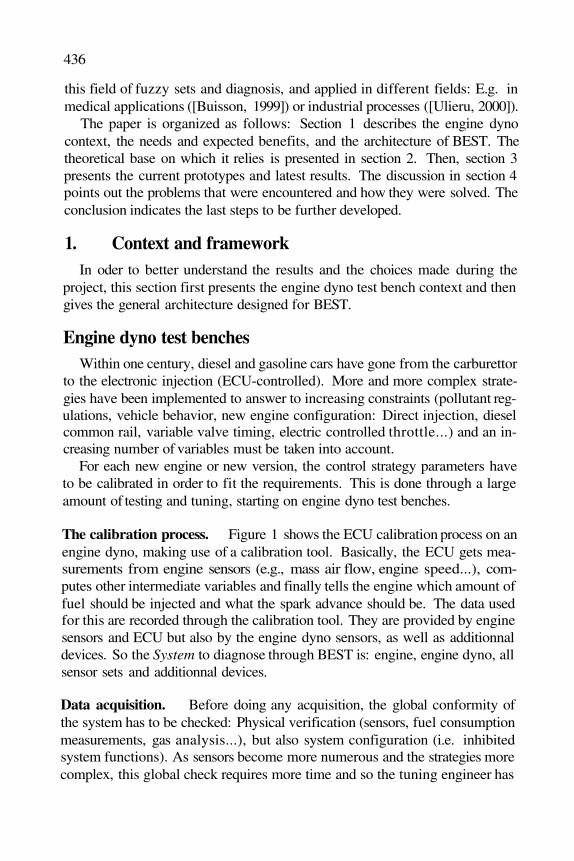
The calibration process. Figure 1 shows the ECU calibration process on anengine dyno, making use of a calibration tool. Basically, the ECU gets mea-surements from engine sensors (e.g., mass air flow, engine speed...), com-putes other intermediate variables and finally tells the engine which amount offuel should be injected and what the spark advance should be. The data usedfor this are recorded through the calibration tool. They are provided by enginesensors and ECU but also by the engine dyno sensors, as well as additionnaldevices. So the System to diagnose through BEST is: engine, engine dyno, allsensor sets and additionnal devices.
Data acquisition. Before doing any acquisition, the global conformity ofthe system has to be checked: Physical verification (sensors, fuel consumptionmeasurements, gas analysis...), but also system configuration (i.e. inhibitedsystem functions). As sensors become more numerous and the strategies morecomplex, this global check requires more time and so the tuning engineer has
Engine dyno test bench on-line, expert knowledge based diagnosis 437
Figure 1 The calibrationprocess
less time for the testing itself and its methodology. Hence test duration isincreasing while reliability is degraded.
Then, during the tests, an on-line verification must be done to guaranteethe acquisition validity. Again the tuning engineers used to check the validityof measurements manually while running: Single-parameter raw thresholds,coherence of some parameters with standard values, and sometimes coherencebetween several parameters and previous tests. Today it is nearly impossiblefor engineers to ensure the global coherence on-line, due to the complexityraise of parameters and strategies. Most of the time, when there is a problem,it is discovered during post processing data treatment. Quite often the test hasto be performed again.
Needs and expected benefits. In fact, 10 to 20% of the manual tests must bereworked due to bad acquisitions, bad software configuration... Most of thetime malfunctions are due to dyno bench environmental problems (gaz analy-sis, fuel balance...). So wrong acquisitions should be detected right away andthe malfunction that occured should be identified as soon as possible in orderto correct it quickly and make sound acquisitions again.
Some common and simple malfunctions are still identified by engineers. Yetothers require time-consumming searches for their origin and symptoms when-ever they occur. Indeed, engineers cannot keep in mind all the information andpast experiences. Moreover they cannot watch in real time all the (numerous)measured channels.
In order to cope with such checkings, an expert system, BEST, has beenconsidered. It has to perform global coherence checking, in the same way asfor manual tests. It should also detect and identify malfunctions as soon asthey appear: That is on-line detection.
General architecture for BESTBEST represents a huge amount of work and investment. It gathers several
functionalities divided into different modules for step by step development andvalidation (a key point in the success of the implementation, as discussed in
438
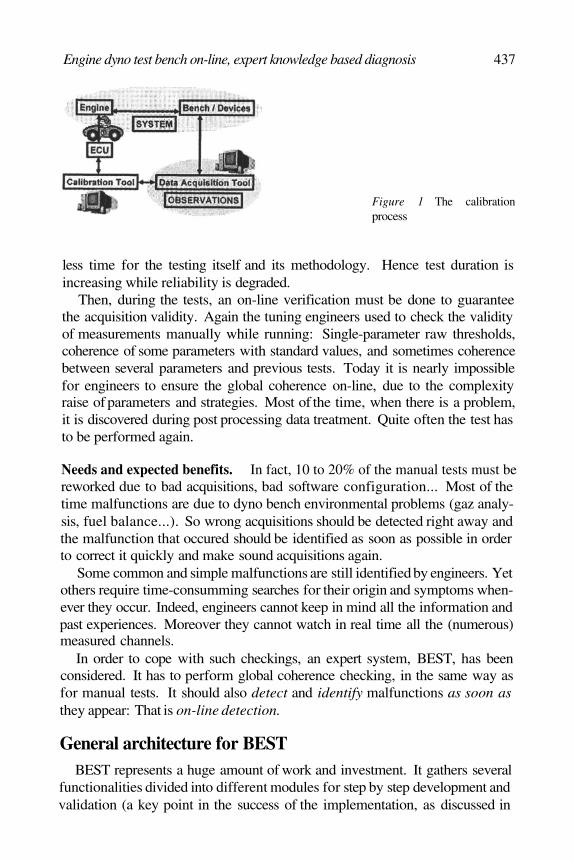
Figure 2 The architecture ofBEST
section 4). The general architecture of BEST and the part for which proto-types have been developed are explained below. Some of the ideas underlyingthis architecture can be found in other approaches to industrial diagnosis (e.g.,[Cordier et al., 2000]).
Figure 2 presents the different modules:• FORM: Enables the experts to formalize their knowledge, using fuzzy rules.• ESO: Extracts, Sorts and Organizes the rules w.r.t bench/engine specificities.• AI, which is the Artificial Intelligence part performing the diagnosis: It com-pares the extracted rules to the measurements made on the engine.
Each module, contains the 3 following submodules: OK (diagnosis basedon models of normal behaviour), KO (diagnosis based on models of malfunc-tions) and MASTER (the supervision rules). In the AI module, OK and KOdiagnosis are aggregated in DIAG. BEST_AI_OK gives the models of normalbehaviour which are not reached and BEST_AI_KO tells which malfunctionshave been identified. The use of two different diagnosis is safer in regard toincompleteness and possible inconsistency of some models. Besides, both di-agnosis (OK and KO) can give some feedback explaining why a model of nor-mal behaviour was not reached and why a malfunction was selected. They mayalso ask for other specific measurements in order to improve their diagnosis.Finally, MASTER decides wheather the test may continue, should use anothercomputation for some variables, or should stop. This decision is taken accord-ing to the supervision rules, the test characteristics (necessary variables), the
Engine dyno test bench on-line, expert knowledge based diagnosis 439
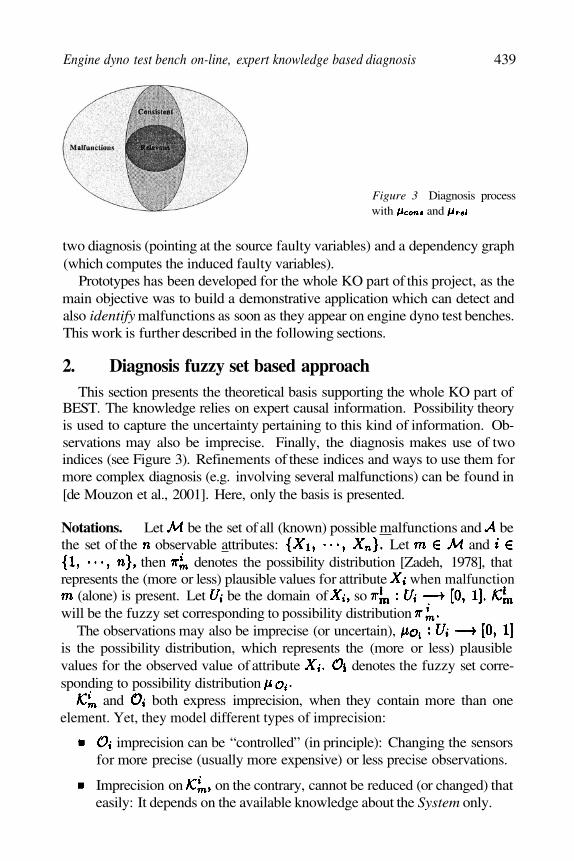
Figure 3 Diagnosis processwith and
two diagnosis (pointing at the source faulty variables) and a dependency graph(which computes the induced faulty variables).
Prototypes has been developed for the whole KO part of this project, as themain objective was to build a demonstrative application which can detect andalso identify malfunctions as soon as they appear on engine dyno test benches.This work is further described in the following sections.
2. Diagnosis fuzzy set based approachThis section presents the theoretical basis supporting the whole KO part of
BEST. The knowledge relies on expert causal information. Possibility theoryis used to capture the uncertainty pertaining to this kind of information. Ob-servations may also be imprecise. Finally, the diagnosis makes use of twoindices (see Figure 3). Refinements of these indices and ways to use them formore complex diagnosis (e.g. involving several malfunctions) can be found in[de Mouzon et al., 2001]. Here, only the basis is presented.
Notations. Let be the set of all (known) possible malfunctions and bethe set of the observable attributes: Let and
then denotes the possibility distribution [Zadeh, 1978], thatrepresents the (more or less) plausible values for attribute when malfunction
(alone) is present. Let be the domain of sowill be the fuzzy set corresponding to possibility distribution
The observations may also be imprecise (or uncertain),is the possibility distribution, which represents the (more or less) plausiblevalues for the observed value of attribute denotes the fuzzy set corre-sponding to possibility distribution
and both express imprecision, when they contain more than oneelement. Yet, they model different types of imprecision:
imprecision can be “controlled” (in principle): Changing the sensorsfor more precise (usually more expensive) or less precise observations.
Imprecision on on the contrary, cannot be reduced (or changed) thateasily: It depends on the available knowledge about the System only.
440
When attribute is not yet observed, its value is not known, so it could beany value of Similarly, when malfunction has noknown effect on attribute all values are allowed:
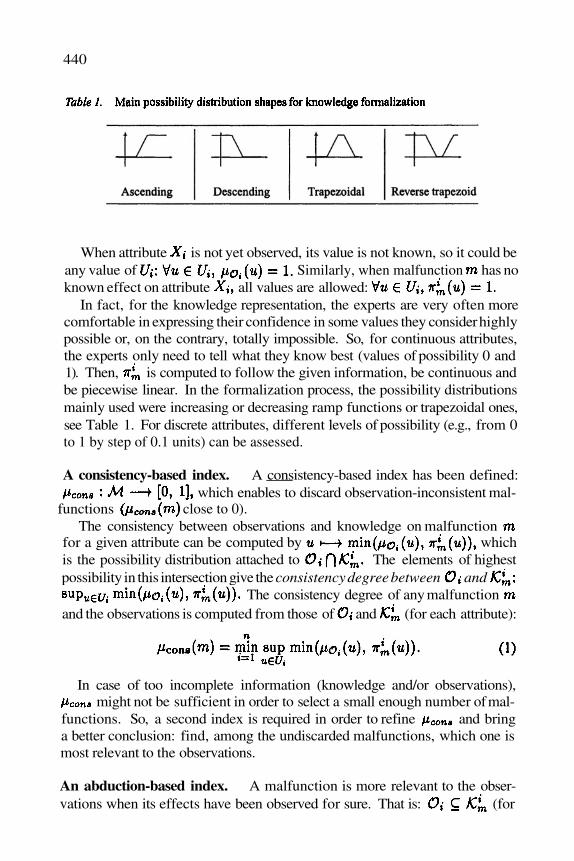
In fact, for the knowledge representation, the experts are very often morecomfortable in expressing their confidence in some values they consider highlypossible or, on the contrary, totally impossible. So, for continuous attributes,the experts only need to tell what they know best (values of possibility 0 and1). Then, is computed to follow the given information, be continuous andbe piecewise linear. In the formalization process, the possibility distributionsmainly used were increasing or decreasing ramp functions or trapezoidal ones,see Table 1. For discrete attributes, different levels of possibility (e.g., from 0to 1 by step of 0.1 units) can be assessed.
A consistency-based index. A consistency-based index has been defined:which enables to discard observation-inconsistent mal-
functions close to 0).The consistency between observations and knowledge on malfunction
for a given attribute can be computed by whichis the possibility distribution attached to The elements of highestpossibility in this intersection give the consistency degree between and
The consistency degree of any malfunctionand the observations is computed from those of and (for each attribute):
In case of too incomplete information (knowledge and/or observations),might not be sufficient in order to select a small enough number of mal-
functions. So, a second index is required in order to refine and bringa better conclusion: find, among the undiscarded malfunctions, which one ismost relevant to the observations.
An abduction-based index. A malfunction is more relevant to the obser-vations when its effects have been observed for sure. That is: (for
Engine dyno test bench on-line, expert knowledge based diagnosis 441
crisp sets). In order to single out most relevant malfunctions, fuzzy inclusionof in has to be defined.
Inclusion can be defined by implication (for crisp sets, is equivalentto So, several fuzzy implications have beenchecked for this purpose. Thus a second index is defined, which evaluates therelevance of a malfunction:
The worst implication degree tells the extent to which the malfunction is rel-evant to the observations. Hence selects the most relevant malfunctions
close to 1).Dienes’ strong implication was chosen because
it is the most dicriminating and it keeps the following natural crisp property: Ifthen That is:
This index is abductive in nature: It selects from the knowledge of therelation between cause and effects, and from the observation of these effects.
Note that is useful because observations are imprecise. Indeed,in case of precise observations. But a totally precise observation is fea-
sible only for discrete attributes. In case of continuous attributes (e.g., temper-ature, pressure), the observations given by sensors always have some impreci-sion (even if it can be made very small with high precision sensors).
Hence, the diagnosis is first based on in order to discard and rankthe malfunctions and then on in case of ties, as schematically shown onFigure 3. See [de Mouzon et al., 2001] for a more complete discussion on theuse of fuzzy sets in this diagnosis process and the extension to multiple-faultdiagnosis (not yet implemented).
3. Actual applicationThis section describes the current complete prototypes which have been
(incrementally) developed for the single fault diagnosis on engine dyno testbenches, based on the framework presented above. They implement the KO-part (see Figure 2): The first prototype is off-line and integrates FORM andESO modules. The second is on-line and corresponds to the AI-module.
Off-line prototype: Knowledge formalization and selectionKnowledge is essential to diagnosis. Sometimes it can be computed from
a database. None existed here, for reporting normal behaviour data and/ordata under each specific malfunction. So, only expert knowledge could beconsidered. Hence a tool was needed to make both collecting and formalizingknowledge as easy and confortable as possible (BEST_KO_FORM module) forthe engine dyno engineers. This creates a centralized knowledge base.
442
For ease of use, the same tool also enables to select from the knowledge basethe pieces to be used, taking into account the state of the ECU calibration, thetests to make, and the test bench specificities. This generates the correspondingformalized knowledge file (BEST_KO_ESO module) directly used by the on-line diagnosis tool.
First, the FORM part contains friendly windows to express the knowledgestep by step:
1) Express the malfunction definition: the user has to enter a unique defini-tion with four characteristics: A group, a type, an identification and the natureof default (some choices are proposed for each). E.g., bench equipment [group]temperature sensor [type] 203 (inlet cylinder 3) [identification] dirty [default].
2) Give and structure the malfunction symptoms in an AND/OR tree.3) Express each symptom through four elements: i) The attribute definition
(function of the measurements and time). ii) A possibility distribution (as ex-emplified in Table 1). iii) Some conditions (engine running, ful load...). iv)An environment (bench and engine specificities).
Then the ESO part enables to easily select (or even modify) the knowledgeto give to the diagnosis. When a new ESO file is created, the user has toparameter its environment. Only malfunctions of the knowledge base havingcompatible symptoms with this environment are automatically added into thefile. For the incoherent symptoms, the user can choose to modify their envi-ronment in order to make them compatible or to remove them. The generatedfiles are unreadable for the expert, which ensures that they will not be mod-ified by hand. When necessary, modification can be done using this off-lineapplication.
This tool has been a key point of the development of BEST, as knowledge isa root of diagnosis. The FORM part has enabled to express and formalize morethan 250 malfunctions (about one third of the estimated total number) in 21environments (about 75% of all). The ESO part not only supports knowledgeselection for each specific environment, but also enables to test and validateknowledge immediately on the on-line diagnosis tool.
On-line prototype: DiagnosisThis prototype is an on-line tool: it reads the data from the engine dyno test
bench (through a Dynamic Data Exchange connection) while the calibration istuning, and warns as soon as possible when a malfunction is detected (in lessthan 3 minutes today). There are two levels of information:
i) An efficient diagnosis mode (a small icon sits in the system tray of Win-dows NT taskbar): While performing on engine dyno test, the prototype be-comes active and works without human intervention. When an event occurs,i.e. detection of the possible presence of a malfunction, a popup window is
Engine dyno test bench on-line, expert knowledge based diagnosis 443
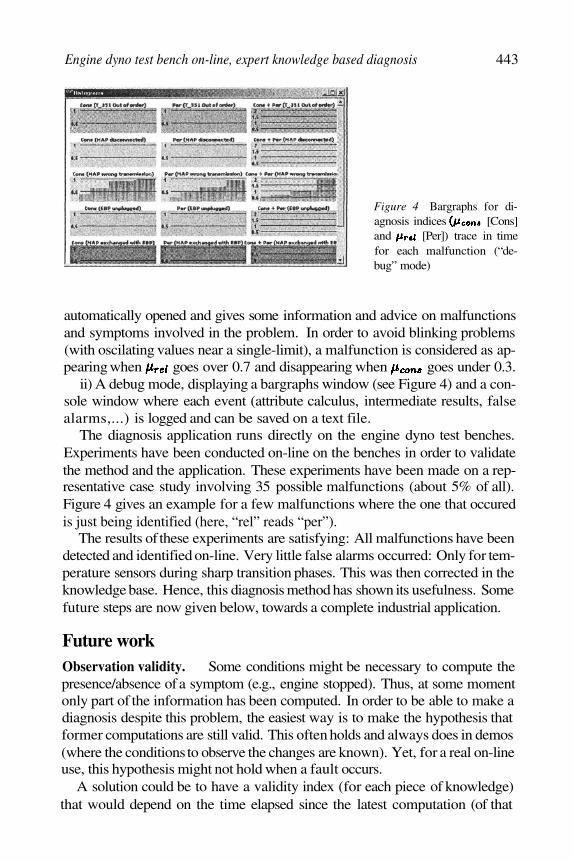
Figure 4 Bargraphs for di-agnosis indices [Cons]and [Per]) trace in timefor each malfunction (“de-bug” mode)
automatically opened and gives some information and advice on malfunctionsand symptoms involved in the problem. In order to avoid blinking problems(with oscilating values near a single-limit), a malfunction is considered as ap-pearing when goes over 0.7 and disappearing when goes under 0.3.
ii) A debug mode, displaying a bargraphs window (see Figure 4) and a con-sole window where each event (attribute calculus, intermediate results, falsealarms,...) is logged and can be saved on a text file.
The diagnosis application runs directly on the engine dyno test benches.Experiments have been conducted on-line on the benches in order to validatethe method and the application. These experiments have been made on a rep-resentative case study involving 35 possible malfunctions (about 5% of all).Figure 4 gives an example for a few malfunctions where the one that occuredis just being identified (here, “rel” reads “per”).
The results of these experiments are satisfying: All malfunctions have beendetected and identified on-line. Very little false alarms occurred: Only for tem-perature sensors during sharp transition phases. This was then corrected in theknowledge base. Hence, this diagnosis method has shown its usefulness. Somefuture steps are now given below, towards a complete industrial application.
Future workObservation validity. Some conditions might be necessary to compute thepresence/absence of a symptom (e.g., engine stopped). Thus, at some momentonly part of the information has been computed. In order to be able to make adiagnosis despite this problem, the easiest way is to make the hypothesis thatformer computations are still valid. This often holds and always does in demos(where the conditions to observe the changes are known). Yet, for a real on-lineuse, this hypothesis might not hold when a fault occurs.
A solution could be to have a validity index (for each piece of knowledge)that would depend on the time elapsed since the latest computation (of that
444
piece of knowledge). Then a too old information would not be taken intoaccount when it is contradictory to other more recently computed pieces ofknowledge. On the contrary, if they still give the same information, this couldalso be taken into account as giving more support to the overall result.
Observation errors. For the moment, only a general evaluation of the erroris computed. In fact, the real error (attached to each sensor) should be used.
This error is usually modelized by a probability distribution (as a gaussian).Yet, a possibility distribution like a fuzzy number (centered triangular distribu-tion, with the maximum error as support) would be very convenient: It coversany symmetric probabilistic distribution on this support, [Dubois et al., 2002].
Besides, this solution is computationnally much more simple when it comesto computing the error of a complex attribute from the channels it combines.
4. Incremental developmentThe previous section presented the prototype complete version of BEST_KO.
The current section explains the problems which had to be tackled and the de-velopment process which was adopted: A successful incremental approach.The first step was to analyse the type of knowledge accessible for the diagno-sis. The second step was to test off-line the diagnosis method (see section 2).The third step was to test it on-line. The last step was to add a complete andmore convenient tool for knowledge formalization, as presented in section 3.All prototypes were developed in Visual C++ V6, under Windows NT4.
First step: Knowledge analysis – Towards formalizationBEST_AI_KO (Figure 2) is based on human beings’ experience. Thus,
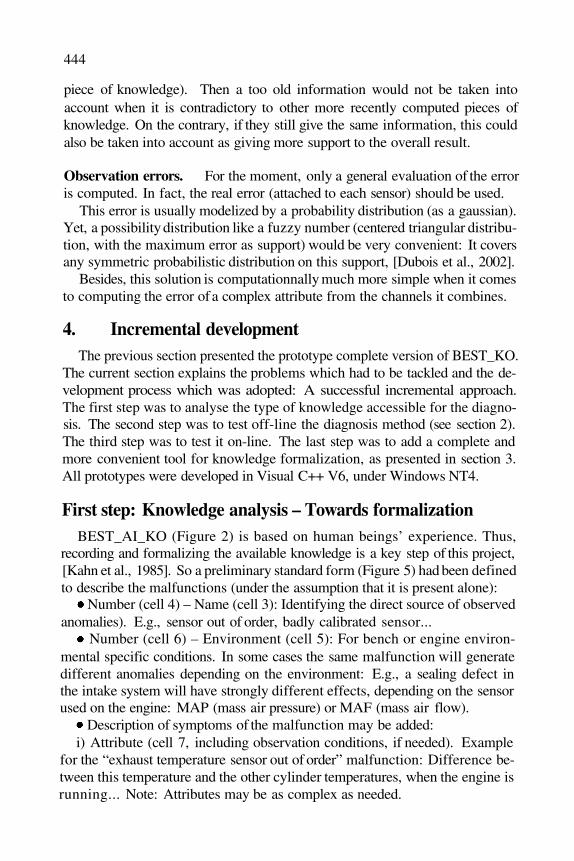
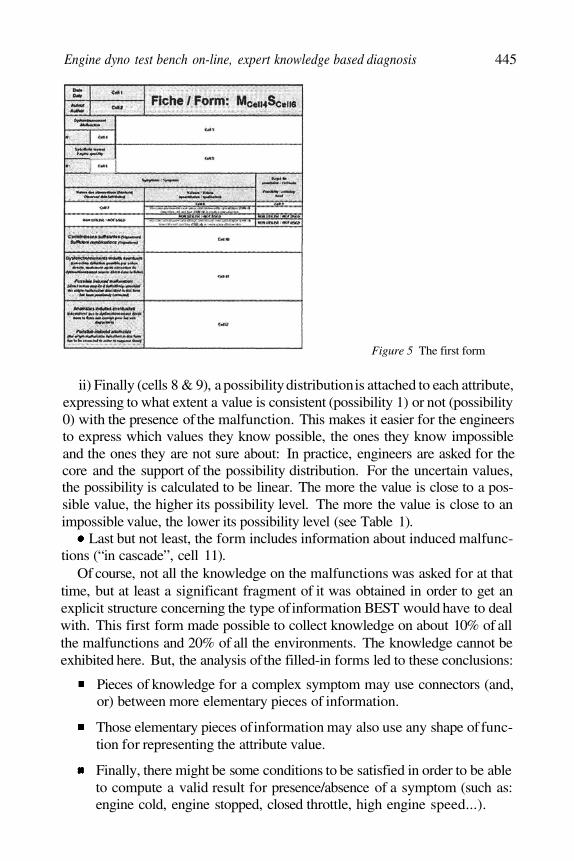
recording and formalizing the available knowledge is a key step of this project,[Kahn et al., 1985]. So a preliminary standard form (Figure 5) had been definedto describe the malfunctions (under the assumption that it is present alone):
Number (cell 4) – Name (cell 3): Identifying the direct source of observedanomalies). E.g., sensor out of order, badly calibrated sensor...
Number (cell 6) – Environment (cell 5): For bench or engine environ-mental specific conditions. In some cases the same malfunction will generatedifferent anomalies depending on the environment: E.g., a sealing defect inthe intake system will have strongly different effects, depending on the sensorused on the engine: MAP (mass air pressure) or MAF (mass air flow).
Description of symptoms of the malfunction may be added:i) Attribute (cell 7, including observation conditions, if needed). Example
for the “exhaust temperature sensor out of order” malfunction: Difference be-tween this temperature and the other cylinder temperatures, when the engine isrunning... Note: Attributes may be as complex as needed.
Engine dyno test bench on-line, expert knowledge based diagnosis 445
Figure 5 The first form
ii) Finally (cells 8 & 9), a possibility distribution is attached to each attribute,expressing to what extent a value is consistent (possibility 1) or not (possibility0) with the presence of the malfunction. This makes it easier for the engineersto express which values they know possible, the ones they know impossibleand the ones they are not sure about: In practice, engineers are asked for thecore and the support of the possibility distribution. For the uncertain values,the possibility is calculated to be linear. The more the value is close to a pos-sible value, the higher its possibility level. The more the value is close to animpossible value, the lower its possibility level (see Table 1).
Last but not least, the form includes information about induced malfunc-tions (“in cascade”, cell 11).
Of course, not all the knowledge on the malfunctions was asked for at thattime, but at least a significant fragment of it was obtained in order to get anexplicit structure concerning the type of information BEST would have to dealwith. This first form made possible to collect knowledge on about 10% of allthe malfunctions and 20% of all the environments. The knowledge cannot beexhibited here. But, the analysis of the filled-in forms led to these conclusions:
Pieces of knowledge for a complex symptom may use connectors (and,or) between more elementary pieces of information.
Those elementary pieces of information may also use any shape of func-tion for representing the attribute value.
Finally, there might be some conditions to be satisfied in order to be ableto compute a valid result for presence/absence of a symptom (such as:engine cold, engine stopped, closed throttle, high engine speed...).
446
So, the knowledge collected from the forms could be formalized in a struc-tured text file. Of course, not all the knowledge on the malfunctions was usedat that time: This step is really time consumming and some basic tests aboutthe diagnosis approach were first needed before going further in that direction.Efforts of formalization were first made on a case study, large enough to berepresentative of the kind of malfunctions to be taken into account in this fieldof application: The case study considered malfunctions that have an incidencein the engine gaz circulation. And to start on some real basic testing, the for-malized knowledge was even restricted to some 15% of the case study.
Second step: Off-line diagnosisThis first diagnosis prototype was implemented for a preliminary evaluation
of this approach applied to ECU calibration on engine dyno test benches.The knowledge was given through the structured text file discussed above.
The data used for off-line tests were yet directly measured on the engine dynotest benches. They came from files where the measurements had been stored.
To reduce complexity for the first tests, data in each file had been collectedat a stabilized running point. Transition phases were kept for later. Files werecreated for different running points, representative of the calibration process:engine speed and MAP table, and also richness and spark advance table.
Each file contained at least 131 measured channels during a 5 minute (ormore) time period. The time frequency for measurements was every 100 ms.So each file contained at least 400 000 values (differents files for nominal be-haviour and for each malfunction). The total number of files used for the testswas 181. For confidential resons, data are not given here (but the numbersgiven above give some indication on the complexity of the problem) and theresults aim only at providing feedback on the implementation process.
Note that the first evaluation could not state whether this approach was goodor not: The conclusion was that off-sets and noise (mainly 50 Hz) had first tobe filtred. Then, the results of the tests were computed once more. As a generalremark, too little knowledge was used for testing this diagnosis approach: 1)Some attributes were too complex to be included in the first tests. 2) Othersneeded special measurement equipment or conditions not possible at that time.3) Too little knowledge had been collected. 4) Last but not least some piecesof knowledge turned out to be false. Nonetheless, some tests could be carriedout. In fact, this situation is rather logical: Great efforts cannot be asked forwith no clue on whether they will be worthwhile. Finally, the very first testsshowed that this approach to BEST is all the more efficient as more formalizedand validated (e.g. through some experiments) knowledge is provided. Forinstance, note that no false alarms were raised during normal behaviour andthat they were all the less frequent as more specific symptoms were formalized.
Engine dyno test bench on-line, expert knowledge based diagnosis 447
Third step: On-line diagnosisThe off-line evaluation not only was good enough to go forward for the on-
line version, but also gave even more resons to do so: The necessary knowledgevalidation is much easier if it is possible to test/change right away pieces ofknowledge. Besides, transitions phases had to be taken into account (as theyare frequent on-line) and thus BEST would take advantage of observationsgathered through out the whole calibration process, going from one runningpoint to another. This is even more needed, as more knowledge is asked for,which means more symptoms that may need specific observations conditions.
In fact, the knowledge used took benefit from the important validation taskpointed in the previous section and from the more numerous measurementsaccessible on-line. Besides, other functions had been implemented to take intoaccount more complex attributes. Finally, transition phases were taken intoaccount so that observation of several stabilized running points was possible,as well as the transition phases themselves. Hence, the previous malfunctionswere described both more properly and in greater details.
But the main change in this prototype is that data are now read directly(using a Dynamic Data Exchange link) from the data acquisition tool (see Fig-ure 1). As the acquisition tool has time priority, our prototype only reads dataevery 500 ms (formerly 100 ms) in order to keep enough time for and
computations. All those operations are very little time consumming, butthe constraints are very high. Time could also be gained with less feedback, butsuch a feedback (see Figure 4, for instance) is essential during the developmentprocess.
Another point to keep in mind is that only the measurements specified forthe data acquisition tool are seen. In other words, there may be up to morethan 200 measured channels or less than the 131 former ones. Thus, it maybe necessary to add some channels during a calibration (that usually does notneed them) for the sake of diagnosability.
An example of result is given in Figure 4. This section gives the main issuesfor a complete 20 minutes demo, testing the prototype on-line and even forsome multiple malfunctions.
The results are better with this on-line prototype: Each malfunction is de-tected when it occurs and there are no false alarms for normal behaviour. Thisis mainly a benefit from knowledge validation. Besides some multiple (non-dependant) malfunctions were successfully tested. On top of that, all malfunc-tions are detected within 10 s time after they occur. Yet, this should be recon-sidered, as, in the demo, the running points which are important to reach toobserve the symptoms are known. It is very likely that a malfunction could beignored for hours otherwise. This is one more point that asks for more knowl-edge, so that at least the presence/absence of one symptom may be computed
448
for each malfunction, whatever the running point. Moreover, the malfunctionsthat still have too little knowledge provided, give some false alarms. Morespecific knowledge is needed to avoid them.
5. ConclusionThis paper has presented the prototyping results of a long term project in
fault diagnosis applied to engine dyno test benches. Thus, it gives the wholeevolution from the very first prototype to the actual. It takes into account notonly the diagnosis process, but also all the necessary knowledge considerationsfor such a tool to be effective. It explains the results obtained at each stage, theproblems we encountered and how they were solved.
This incremental process is one of the key of the success of this project.The begining of the project was quite unsure as huge amount of work hadto be carried out, including promoting BEST inside the company. Today, afull prototype is implemented, from knowledge formalization to malfunctiondetection and the database contains about half of the malfunctions.
Some work still need be done, as implementing the real observation validityand errors. The extensions of the approach presented in [de Mouzon et al.,2001] should also be implemented to allow for multiple and cascading mal-function diagnosis.
ReferencesBuisson, J.-C. (1999). Practical Applications of Fuzzy Technologies, chapter Approximate rea-
soning in computer-aided medical decision systems, pages 337–361. The Handbooks ofFuzzy Sets Series. Kluwer Academic, Boston/London/Dordrecht.
Cordier, M.-O., Dague, P., Dumas, M., Lévy, F., Montmain, J., Staroswiecki, M., and Travé-Massuyès, L. (2000). AI and automatic control approches of model-based diagnosis: Linksand underlying hypotheses. In Proc. of the IFAC Symp. on Fault Detection Supervisionand Safety for Technical Processes (SAFEPROCESS’2000), volume 1, pages 274–279.
de Mouzon, O., Dubois, D., and Prade, H. (2001). Twofold fuzzy sets in single and multiplefault diagnosis, using information about normal values. In Proceedings of the IEEEInternational Conference on Fuzzy Systems (FUZZ-IEEE 2001), volume 3, Melbourne.
Dubois, D., Foulloy, L., Mauris, G., and Prade, H. (2002). Probability-possibility transforma-tions, triangular fuzzy sets and probabilisitc inequalities. In Proc. Int. Conf. Info. Pro-cessing and Management of Uncertainty in Knowledge-based Syst., pages 1077–1083.
Kahn, G., Nowlan, S., and Mc Dermott, J. (1985). Strategies for knowledge acquisition. IEEETransactions on Pattern Analysis and Machine Intelligence (PAMI), 7(5):511–522.
Sanchez, E. (1977). Solutions in composite fuzzy relation equations: application to medicaldiagnosis in Brouwerian logic. In Gupta, M. M., Saridis, G. N., and Gaines, B. R., editors,Fuzzy Automata and Decision Processes, pages 221–234. North-Holland, Amsterdam.
Ulieru, M., editor (2000). Intelligent Manufacturing and Fault Diagnosis (II). Soft computingapproaches to fault diagnosis, volume 127 of Information Science. Elsevier. Special issue.
Zadeh, Lofti Asker (1978). Fuzzy sets as a basis for a theory of possibility. Fuzzy Sets andSystems, 1(1):3–28.