Review Omics in major cereals: applications, challenges ...
39
Review Omics in major cereals: applications, challenges, and prospects Balwinder Kaur 1, † , Karansher S. Sandhu 2, † , Roop Kamal 3 , Kawalpreet Kaur 4 , Jagmohan Singh 5 , Marion S. Röder 3 , and Quddoos H. Muqaddasi 3,6, * 1 Everglades Research and Education Center, University of Florida, Institute of Food and Agricultural Sci- ences, 3200 E. Palm Beach Rd., Belle Glade, FL, USA, 33430; [email protected] (B.K.) 2 Department of Crop and Soil Sciences, Washington State University, Pullman, WA, USA, 99163; [email protected] (K.S.S.) 3 Leibniz Institute of Plant Genetics and Crop Plant Research (IPK), Corrensstraße 3, D-06466 Stadt Seeland OT Gatersleben, Germany; [email protected] (R.K.), [email protected] (M.S.R.) 4 Department of Agricultural, Food and Nutritional Science, University of Alberta, Edmonton, Alberta, T6G 2P5, Canada; [email protected] (K.K.) 5 Division of Plant Pathology, ICAR-Indian Agricultural Research Institute, New Delhi-110012, India; Jagmo- [email protected] (J.S.) 6 Present address: European Wheat Breeding Center, BASF Agricultural Solutions GmbH, Am Schwabeplan 8, D-06466 Stadt Seeland OT Gatersleben, Germany. † The authors contributed equally in this manuscript. * Correspondence: [email protected]; (Q.H.M.) Simple Summary: Omics, as a set of technologies, viz., genomics, transcriptomics, proteomics, metabolomics, and phenomics, have substantially helped the crop improvement landscape. Here, we review omics' applications and prospects in five major cereals, viz., rice, sorghum, maize, barley, and bread wheat. In Figure 1, we describe how these technologies have evolved to keep pace with crop improvement programs focusing on breeding applications. We section this review according to the technologies mentioned above and, in every section, describe their applications in cereals. Abstract: Omics technologies, viz., genomics, transcriptomics, proteomics, metabolomics, and phe- nomics, are becoming an integral part of virtually every commercial cereal breeding program be- cause they provide substantial dividends per unit time in both pre-breeding and breeding phases. Continuous advances in cereal-omics promise—in combination with time efficiency—the cost ben- efits. In this review, we provide a comprehensive overview of the established cereal-omics methods in five major cereals, viz., rice, sorghum, maize, barley, and bread wheat. We cover the evolution of technologies in each omics section independently and concentrate on their use to improve econom- ically important agronomic as well as biotic and abiotic stress-related traits. Advancements in the (1) identification, mapping, and sequencing of molecular/structural variants, (2) high-density tran- scriptomics data to study gene expression patterns, (3) global and targeted proteome profiling to study protein structure and interaction, (4) metabolomic profiling to quantify organ level small- density metabolites and their composition, and (5) high-resolution high-throughput image-based phenomics approaches are surveyed in this review. Preprints (www.preprints.org) | NOT PEER-REVIEWED | Posted: 20 April 2021 doi:10.20944/preprints202104.0531.v1 © 2021 by the author(s). Distributed under a Creative Commons CC BY license.
Transcript of Review Omics in major cereals: applications, challenges ...
Review
Omics in major cereals: applications, challenges, and prospects
Balwinder Kaur 1, †, Karansher S. Sandhu 2, †, Roop Kamal 3, Kawalpreet Kaur 4, Jagmohan Singh 5,
Marion S. Röder 3, and Quddoos H. Muqaddasi 3,6,*
1 Everglades Research and Education Center, University of Florida, Institute of Food and Agricultural Sci-
ences, 3200 E. Palm Beach Rd., Belle Glade, FL, USA, 33430; [email protected] (B.K.) 2 Department of Crop and Soil Sciences, Washington State University, Pullman, WA, USA, 99163;
[email protected] (K.S.S.) 3 Leibniz Institute of Plant Genetics and Crop Plant Research (IPK), Corrensstraße 3, D-06466 Stadt Seeland
OT Gatersleben, Germany; [email protected] (R.K.), [email protected] (M.S.R.) 4 Department of Agricultural, Food and Nutritional Science, University of Alberta, Edmonton, Alberta, T6G
2P5, Canada; [email protected] (K.K.) 5 Division of Plant Pathology, ICAR-Indian Agricultural Research Institute, New Delhi-110012, India; Jagmo-
[email protected] (J.S.) 6 Present address: European Wheat Breeding Center, BASF Agricultural Solutions GmbH, Am Schwabeplan
8, D-06466 Stadt Seeland OT Gatersleben, Germany. † The authors contributed equally in this manuscript.
* Correspondence: [email protected]; (Q.H.M.)
Simple Summary: Omics, as a set of technologies, viz., genomics, transcriptomics, proteomics,
metabolomics, and phenomics, have substantially helped the crop improvement landscape. Here,
we review omics' applications and prospects in five major cereals, viz., rice, sorghum, maize, barley,
and bread wheat. In Figure 1, we describe how these technologies have evolved to keep pace with
crop improvement programs focusing on breeding applications. We section this review according
to the technologies mentioned above and, in every section, describe their applications in cereals.
Abstract: Omics technologies, viz., genomics, transcriptomics, proteomics, metabolomics, and phe-
nomics, are becoming an integral part of virtually every commercial cereal breeding program be-
cause they provide substantial dividends per unit time in both pre-breeding and breeding phases.
Continuous advances in cereal-omics promise—in combination with time efficiency—the cost ben-
efits. In this review, we provide a comprehensive overview of the established cereal-omics methods
in five major cereals, viz., rice, sorghum, maize, barley, and bread wheat. We cover the evolution of
technologies in each omics section independently and concentrate on their use to improve econom-
ically important agronomic as well as biotic and abiotic stress-related traits. Advancements in the
(1) identification, mapping, and sequencing of molecular/structural variants, (2) high-density tran-
scriptomics data to study gene expression patterns, (3) global and targeted proteome profiling to
study protein structure and interaction, (4) metabolomic profiling to quantify organ level small-
density metabolites and their composition, and (5) high-resolution high-throughput image-based
phenomics approaches are surveyed in this review.
Preprints (www.preprints.org) | NOT PEER-REVIEWED | Posted: 20 April 2021 doi:10.20944/preprints202104.0531.v1
© 2021 by the author(s). Distributed under a Creative Commons CC BY license.
Internal
Figure 1. An overview of the use of "omics" in cereal improvement.
Keywords: cereals; omics; gemomics; transcriptomics; proteomics; metabolomics; phenomics.
1. Cereal genomics: evolution from sparse genetic markers to whole-genome sequenc-
ing
Identification of molecular markers, i.e., the observable polymorphisms among indi-
viduals of a population within a given DNA sequence, laid the foundations of modern
genomics. In the 1980s, the detection of restriction fragment length polymorphisms
(RFLPs) and their subsequent association with several primary agronomic importance
traits forecasted the promises of genomics to improve the genetic gain per unit time. Later,
many other marker systems—most notably microsatellite or simple sequence repeat (SSR)
markers—were used to map quantitative trait loci (QTLs). Nevertheless, albeit their ex-
cellent use in locating the polymorphisms and use in applied breeding, these systems were
time- and cost-inefficient and low throughput. For example, the first SSR map of wheat
harbored only 279 loci [1]. Most economically important traits, e.g., grain yield, disease
resistance, and grain protein content, are polygenic, i.e., they are controlled by the con-
certed action of several small- to medium-effect genetic loci [2]. Therefore, sparse genetic
linkage maps harboring a limited number of genetic loci become inefficient for improving
highly complex or quantitative traits mainly because of the trait-linked loci's absence.
Detection of single nucleotide polymorphisms (SNPs)—the smallest unit of DNA
polymorphism—provides an opportunity to survey virtually millions of sites within a
species’ DNA. Thus, it has become a marker platform of choice. High-throughput, high-
efficiency, reproducibility, and low cost per data point have enabled large-scale
germplasm evaluations in many cereals and, consequently, have resulted in the almost
complete replacement of RFLPs or SSR marker platforms [3]. Major methods for SNP de-
tection in cereals include array-based genotyping and genotyping-by-sequencing. Several
sequencing technologies are available for both forms of SNP detection [3]. High-density
SNP genotyping is invaluable for identifying the genetic underpinning of economically
relevant traits and laying the foundation of whole-genome sequencing.
Preprints (www.preprints.org) | NOT PEER-REVIEWED | Posted: 20 April 2021 doi:10.20944/preprints202104.0531.v1
Internal
While whole-genome sequencing for hundreds of animal species had already been
reported, it is only recently that the genomes of major cereals were fully sequenced (avail-
able online at NCBI). The technological innovations coupled with international collabora-
tive consortia efforts have led to the construction of cereal genome assemblies that may
be used for several applied genetic purposes, e.g., genome-wide scans for genes control-
ling essential traits. However, sequencing of cereal genomes has particularly been chal-
lenging mainly because of their large sizes and abundance of repetitive sequences [4].
Three of the major cereals, viz., rice (Oryza sativa L.), sorghum (Sorghum bicolor L.), and
maize (Zea mays L.), have been very well-sequenced using various technologies—the fore-
most reason being their diploid nature and small genomes. For example, primarily be-
cause of limited genome size and diploid nature, rice became a model choice for the
whole-genome sequencing, and in 2002 working genome drafts of domesticated rice sub-
species (ssp. japonica and indica) were published [5,6]. Following rice, seven years later,
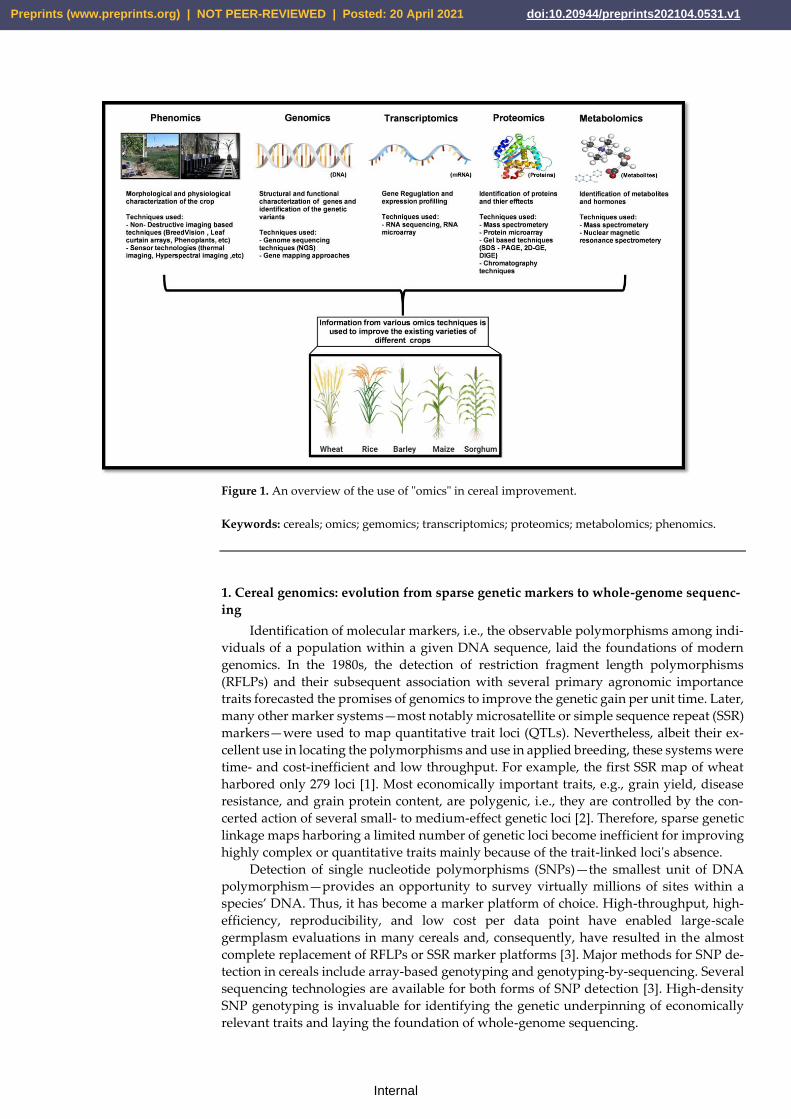
sorghum and maize genomes were published [7,8]. Barley (Hordeum vulgare L.) and bread
wheat—among the most important members of the Triticieae tribe—were difficult to se-
quence mainly because of their large genome sizes (Figure 2). The first draft assembly of
barley (cultivar Morex)—released in 2012—was assembled based on genome-zipper,
whole genome shotgun (WGS) contigs, and bacterial artificial chromosomes (BAC) clones
(TIBGSC 2012). Bread wheat genome assembly was complicated primarily because of its
polyploid nature and its genome size that is more than three times that of barley. In 2014,
the first wheat genome draft assembly based on chromosome sorted WGS sequences were
released by the IWGSC.
Figure 2. Cereal genome features. (a) An approximate genome size in Gb and (b) genetic loci and
the transcripts harbored by top production cereals. The data is mainly gathered from the “Phyto-
zome” website (https://phytozome-next.jgi.doe.gov/), and the references to each sequence are
given in the main text.
1.1. Types of genomic variants: applications in genetics and breeding
Every applied plant breeding program's success hinges on artificial selection—a pro-
cess that involves the selection, preservation, and propagation of plants possessing the
most desirable characters from a diverse population. Artificial selection is determined by
the considerable genotypic variation in a population that results in high heritability of the
traits under selection. Variation, and in this case, genotypic variation, is a type of variation
that is directly ascribed to the genetic differences among individuals of a given population.
Therefore, genomics can help to improve crops because it assesses the genetic or genomic
polymorphisms among individuals.
Differences in the plant species mainly arise due to the structural variations within
its genome. These structural variations vary significantly in size ranging from SNP to
more gigantic insertions, deletions, copy number variations, etc. Some of these variants
are described below as well as in Fig. 3.
Preprints (www.preprints.org) | NOT PEER-REVIEWED | Posted: 20 April 2021 doi:10.20944/preprints202104.0531.v1
Internal
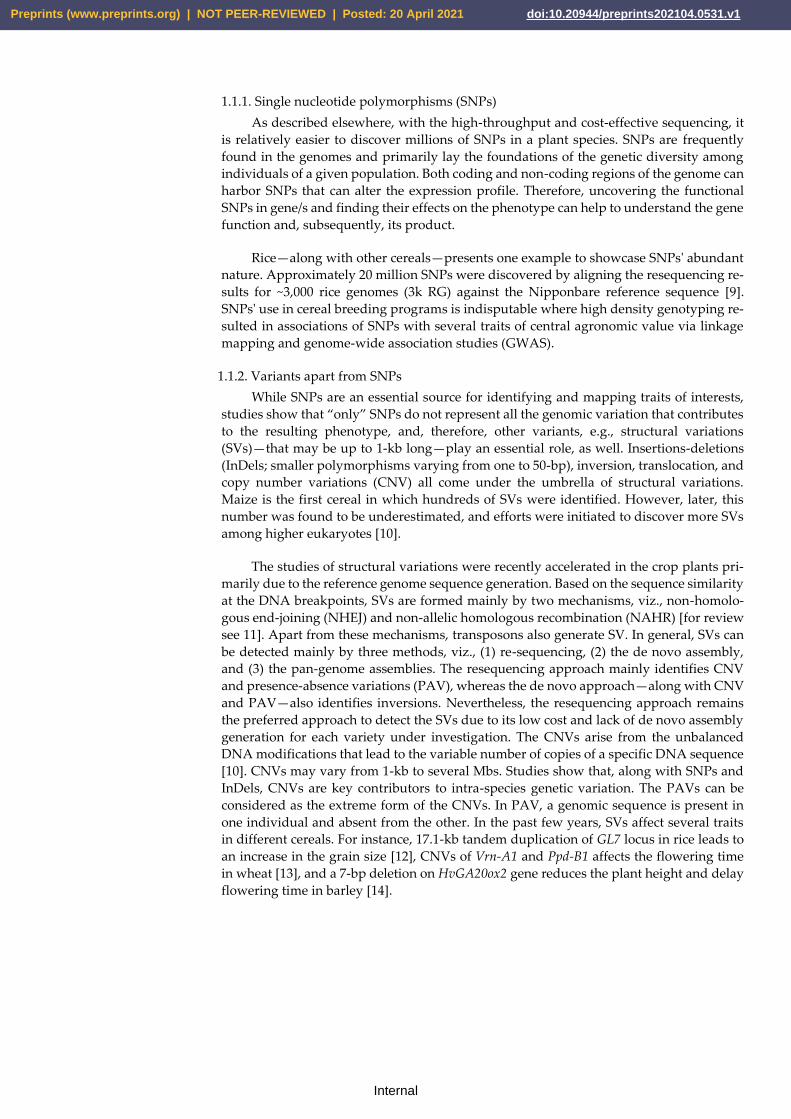
1.1.1. Single nucleotide polymorphisms (SNPs)
As described elsewhere, with the high-throughput and cost-effective sequencing, it
is relatively easier to discover millions of SNPs in a plant species. SNPs are frequently
found in the genomes and primarily lay the foundations of the genetic diversity among
individuals of a given population. Both coding and non-coding regions of the genome can
harbor SNPs that can alter the expression profile. Therefore, uncovering the functional
SNPs in gene/s and finding their effects on the phenotype can help to understand the gene
function and, subsequently, its product.
Rice—along with other cereals—presents one example to showcase SNPs' abundant
nature. Approximately 20 million SNPs were discovered by aligning the resequencing re-
sults for ~3,000 rice genomes (3k RG) against the Nipponbare reference sequence [9].
SNPs' use in cereal breeding programs is indisputable where high density genotyping re-
sulted in associations of SNPs with several traits of central agronomic value via linkage
mapping and genome-wide association studies (GWAS).
1.1.2. Variants apart from SNPs
While SNPs are an essential source for identifying and mapping traits of interests,
studies show that “only” SNPs do not represent all the genomic variation that contributes
to the resulting phenotype, and, therefore, other variants, e.g., structural variations
(SVs)—that may be up to 1-kb long—play an essential role, as well. Insertions-deletions
(InDels; smaller polymorphisms varying from one to 50-bp), inversion, translocation, and
copy number variations (CNV) all come under the umbrella of structural variations.
Maize is the first cereal in which hundreds of SVs were identified. However, later, this
number was found to be underestimated, and efforts were initiated to discover more SVs
among higher eukaryotes [10].
The studies of structural variations were recently accelerated in the crop plants pri-
marily due to the reference genome sequence generation. Based on the sequence similarity
at the DNA breakpoints, SVs are formed mainly by two mechanisms, viz., non-homolo-
gous end-joining (NHEJ) and non-allelic homologous recombination (NAHR) [for review
see 11]. Apart from these mechanisms, transposons also generate SV. In general, SVs can
be detected mainly by three methods, viz., (1) re-sequencing, (2) the de novo assembly,
and (3) the pan-genome assemblies. The resequencing approach mainly identifies CNV
and presence-absence variations (PAV), whereas the de novo approach—along with CNV
and PAV—also identifies inversions. Nevertheless, the resequencing approach remains
the preferred approach to detect the SVs due to its low cost and lack of de novo assembly
generation for each variety under investigation. The CNVs arise from the unbalanced
DNA modifications that lead to the variable number of copies of a specific DNA sequence
[10]. CNVs may vary from 1-kb to several Mbs. Studies show that, along with SNPs and
InDels, CNVs are key contributors to intra-species genetic variation. The PAVs can be
considered as the extreme form of the CNVs. In PAV, a genomic sequence is present in
one individual and absent from the other. In the past few years, SVs affect several traits
in different cereals. For instance, 17.1-kb tandem duplication of GL7 locus in rice leads to
an increase in the grain size [12], CNVs of Vrn-A1 and Ppd-B1 affects the flowering time
in wheat [13], and a 7-bp deletion on HvGA20ox2 gene reduces the plant height and delay
flowering time in barley [14].
Preprints (www.preprints.org) | NOT PEER-REVIEWED | Posted: 20 April 2021 doi:10.20944/preprints202104.0531.v1
Internal
Figure 3. Types of structural variants. Inverted triangles show the position of a given variation
with respect to the reference genome.
1.2. Genetic mapping
Several statistical methods can be employed to link the polymorphism to the traits
under investigation—most common of which are regression analyses. In cereals—as for
many other crops—polymorphisms or variations among individuals can be (1) artificially
generated, i.e., via crossing different parents, and (2) surveyed in a natural population,
e.g., set of elite lines, gene bank accessions, etc. In the following, we provide most common
methods to link genetic polymorphisms to the traits under investigation.
1.2.1. Linkage mapping
Linkage mapping refers to mapping the quantitative trait loci (QTLs) in mostly arti-
ficially created segregating population/s. Many traits of economic importance, such as
grain yield, stress tolerance, and disease resistance, are of quantitative nature, i.e., they
are governed by a concerted action of many genetic loci [2]. Therefore, segregating popu-
lations harboring virtually hundreds of individuals are required to dissect the genetic na-
ture of a quantitative trait. Different types of segregating populations such as F2 popula-
tion, recombinant inbred lines (RILs), doubled haploid (DH) population, heterogeneous
inbred family (HIF), near-isogenic lines (NIL), advanced intercross recombinant inbred
lines (AI-RIL), backcross inbred lines, and multiparent advanced generation intercross
(MAGIC) are developed based mainly on the available resources and research objectives.
These segregating populations are mostly based on crosses between contrasting parents,
resulting in a limited genetic diversity. Linkage mapping is the most commonly used
method to detect genes underlying essential traits. Nevertheless, resources and time to
develop these mapping populations coupled with a narrow genetic base plus low allelic
richness and mapping resolution are some of the drawbacks of linkage mapping.
1.2.2. Genome-wide association studies
Genome-wide association studies (GWAS) take advantage of the long history of re-
combination events in the diverse natural population to dissect the genetic nature of a
trait. The use of natural population overcomes the constraints of the linkage mapping as
it increases the mapping resolution and reduces the research time [15] GWAS was initially
used to study the human’s complex traits, and then it was adopted for animals and some
model organisms. In the last decade, with the improvements in genotyping techniques,
decreased cost of sequencing, and robust statistical methods, researchers have adopted
the GWAS for dissecting the genetic architecture of complex traits in plants. GWAS iden-
tifies marker-trait associations (MTA) that can be attributed to the strength of linkage dis-
equilibrium (LD) between polymorphic markers across a set of diverse germplasm. In a
nutshell, GWAS analysis is performed to evaluate each genotyped marker's association
with a trait of interest that has been scored across a diverse natural population. GWAS
analysis can be used to study both qualitative and quantitative traits. Several aspects must
Preprints (www.preprints.org) | NOT PEER-REVIEWED | Posted: 20 April 2021 doi:10.20944/preprints202104.0531.v1
Internal
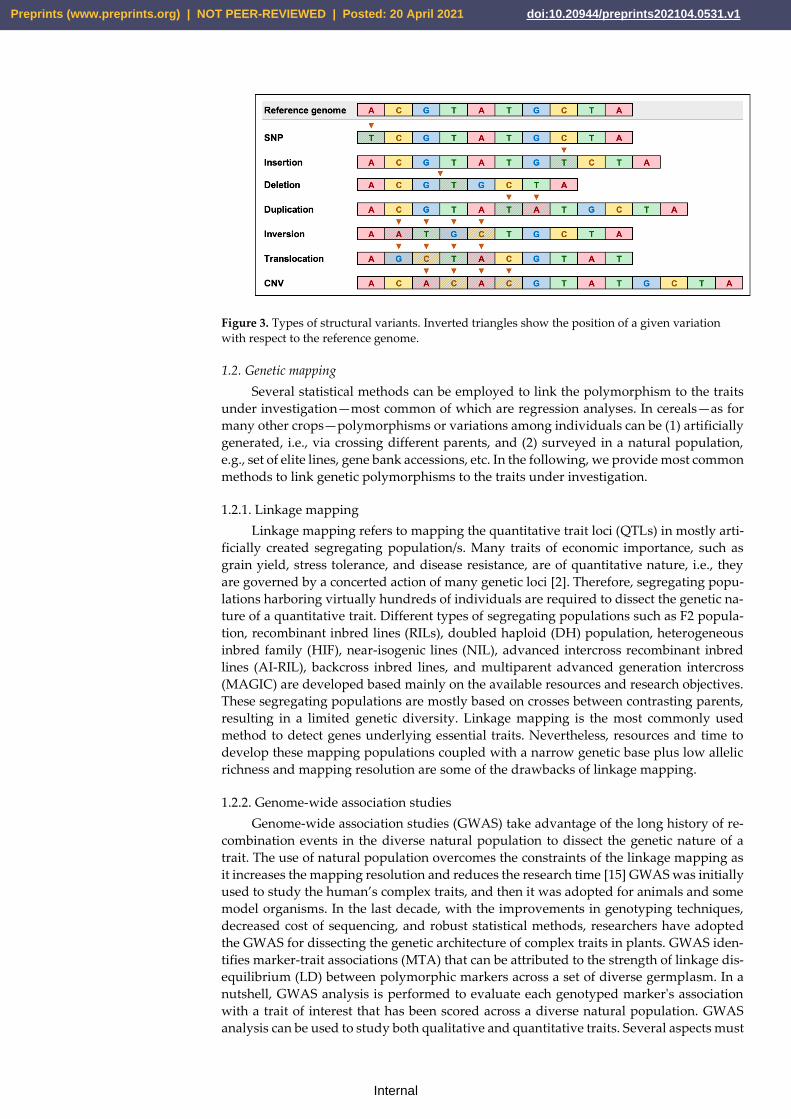
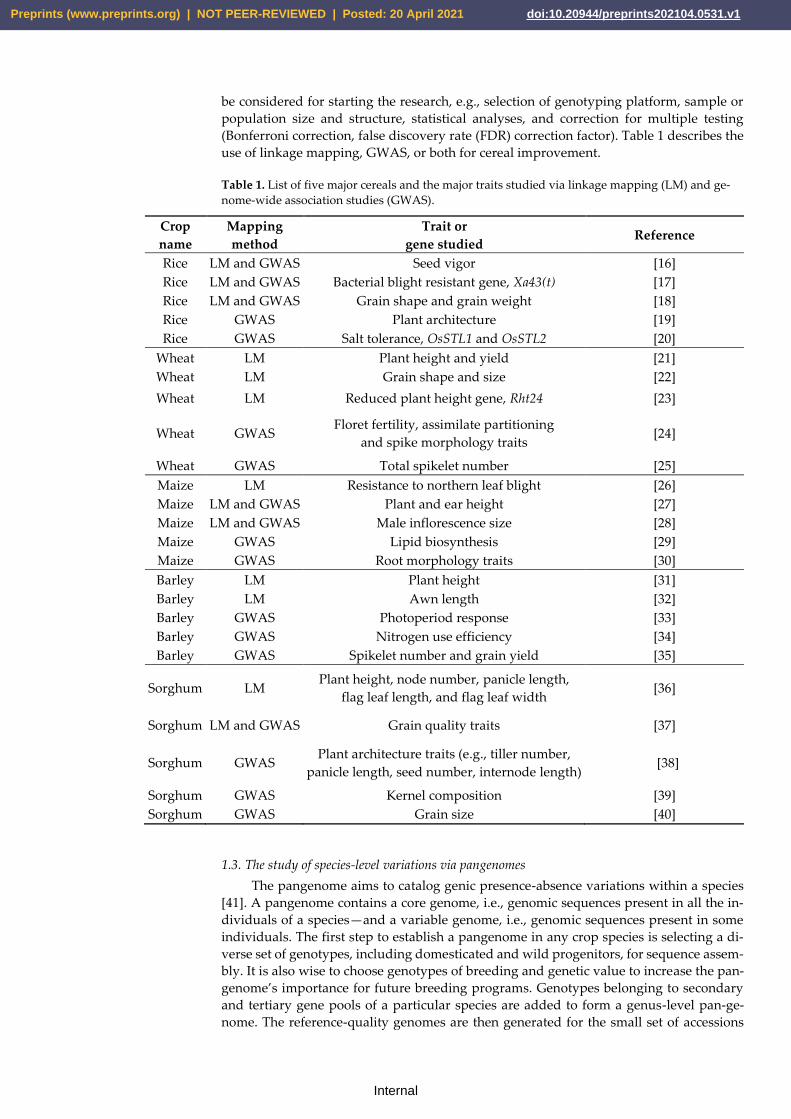
be considered for starting the research, e.g., selection of genotyping platform, sample or
population size and structure, statistical analyses, and correction for multiple testing
(Bonferroni correction, false discovery rate (FDR) correction factor). Table 1 describes the
use of linkage mapping, GWAS, or both for cereal improvement.
Table 1. List of five major cereals and the major traits studied via linkage mapping (LM) and ge-
nome-wide association studies (GWAS).
Crop
name
Mapping
method
Trait or
gene studied Reference
Rice LM and GWAS Seed vigor [16]
Rice LM and GWAS Bacterial blight resistant gene, Xa43(t) [17]
Rice LM and GWAS Grain shape and grain weight [18]
Rice GWAS Plant architecture [19]
Rice GWAS Salt tolerance, OsSTL1 and OsSTL2 [20]
Wheat LM Plant height and yield [21]
Wheat LM Grain shape and size [22]
Wheat LM Reduced plant height gene, Rht24 [23]
Wheat GWAS Floret fertility, assimilate partitioning
and spike morphology traits [24]
Wheat GWAS Total spikelet number [25]
Maize LM Resistance to northern leaf blight [26]
Maize LM and GWAS Plant and ear height [27]
Maize LM and GWAS Male inflorescence size [28]
Maize GWAS Lipid biosynthesis [29]
Maize GWAS Root morphology traits [30]
Barley LM Plant height [31]
Barley LM Awn length [32]
Barley GWAS Photoperiod response [33]
Barley GWAS Nitrogen use efficiency [34]
Barley GWAS Spikelet number and grain yield [35]
Sorghum LM Plant height, node number, panicle length,
flag leaf length, and flag leaf width [36]
Sorghum LM and GWAS Grain quality traits [37]
Sorghum GWAS Plant architecture traits (e.g., tiller number,
panicle length, seed number, internode length) [38]
Sorghum GWAS Kernel composition [39]
Sorghum GWAS Grain size [40]
1.3. The study of species-level variations via pangenomes
The pangenome aims to catalog genic presence-absence variations within a species
[41]. A pangenome contains a core genome, i.e., genomic sequences present in all the in-
dividuals of a species—and a variable genome, i.e., genomic sequences present in some
individuals. The first step to establish a pangenome in any crop species is selecting a di-
verse set of genotypes, including domesticated and wild progenitors, for sequence assem-
bly. It is also wise to choose genotypes of breeding and genetic value to increase the pan-
genome’s importance for future breeding programs. Genotypes belonging to secondary
and tertiary gene pools of a particular species are added to form a genus-level pan-ge-
nome. The reference-quality genomes are then generated for the small set of accessions
Preprints (www.preprints.org) | NOT PEER-REVIEWED | Posted: 20 April 2021 doi:10.20944/preprints202104.0531.v1
Internal
and aligned to the reference genome to detect the structural variations. k-mers present in
the SVs are extracted and determined in the form of short-read data from a diversity panel
to genotype the underlying SV, and the matrices of the k-mers count are used as biallelic
markers in the QTL mapping or genome-wide association studies [42]. Pangenome has
already been established in various cereals, viz, rice [43], wheat [44], and barley [41]. In
barley, a pangenome of 20 barley assemblies was constructed, single-copy k-mers from
the structural variants in these 20 assemblies were detected, and a k-mer abundance ma-
trix was used to perform the GWAS for lemma adherence [41].
1.4. Challenges and prospects in crop-genomics
In the past, whole-genome sequencing efforts were hindered mainly by the (1) ex-
tensive and repetitive genome sequences of the cereals and (2) the absence of current tech-
nologies and algorithms that are robust and exact in generating and assembling the large
and correct sequences. Therefore, this has been perhaps the most important reason why
considerable international consortia efforts were required. Although large-scale genome
sequence production and assembling are currently costly, with continuous innovation in
technologies, future large-scale reference-quality genome assemblies will be easier mainly
because of the small cost-outcome differential. It can be safely speculated that the con-
struction of genome assemblies will continue to the point where the difference between
whole-genome genotyping and whole-genome sequencing will be negligible [4]. With the
improvements in sequencing and computing facilities, the production per unit of input
will be improved, which will be beneficial for cereal geneticists and breeders. As described
elsewhere, robust QTL mapping and gene cloning hinge on dense genetic/physical maps'
availability. Advances in genomics will help in fast and accurate mapping of the traits.
Also, with the availability of the dense marker information, the methods of prediction of
genotypic (in case of inbreeding crops) or breeding (additive) value (in case of outcrosses)
will become more efficient to improve the genetic gains per unit time and cost.
2. Cereal transcriptomics
The genetic content in all the cells of an organism is the same; even then, different
cells perform different functions and possess varying compositions under diverse circum-
stances. As per the central dogma of molecular biology, DNA is transcribed to RNA, and
further RNA is translated to proteins, which are functional units [45]. Therefore, mRNA
serves as transient molecules in the execution of genetic information stored in DNA. The
whole set of RNA transcripts produced by an organism under any specific conditions is
called transcriptome, and the study of this transcriptome is known as transcriptomics [46].
2.1. Transcriptomics techniques
The first attempt to study RNA transcripts was made in the 1970s when mRNA li-
braries of silk moths were converted to cDNA using reverse transcriptase [47]. Later in
the 1980s, Sanger sequencing was used to sequence the RNA transcripts, called Expressed
Sequence Tags (ESTs) [46]. EST was used as a technique to determine the gene content of
an organism. Later, RNA transcript quantification was also performed using various tech-
niques such as northern blotting and then by qRT-PCR [48]. However, these techniques
do not cover the entire transcriptome, but only a small part of it. In 1995, the first method
developed and used for transcriptomics was sequencing-based called Serial Analysis of
Gene Expression (SAGE) [49].
SAGE methodology involved preparing a short sequence tag (10-14 bp) from each
transcript's unique positions, which can be used to identify a transcript. Sequence tags are
then linked together to form long serial molecules. These molecules are then cloned and
sequenced. To check the expression of a specific gene, a total number of tags are counted.
Quantification of the number of times a particular tag provides the expression level of the
corresponding gene. SAGE can also help to identify new genes expressing in a tissue or
under specific conditions [49].
Preprints (www.preprints.org) | NOT PEER-REVIEWED | Posted: 20 April 2021 doi:10.20944/preprints202104.0531.v1
Internal
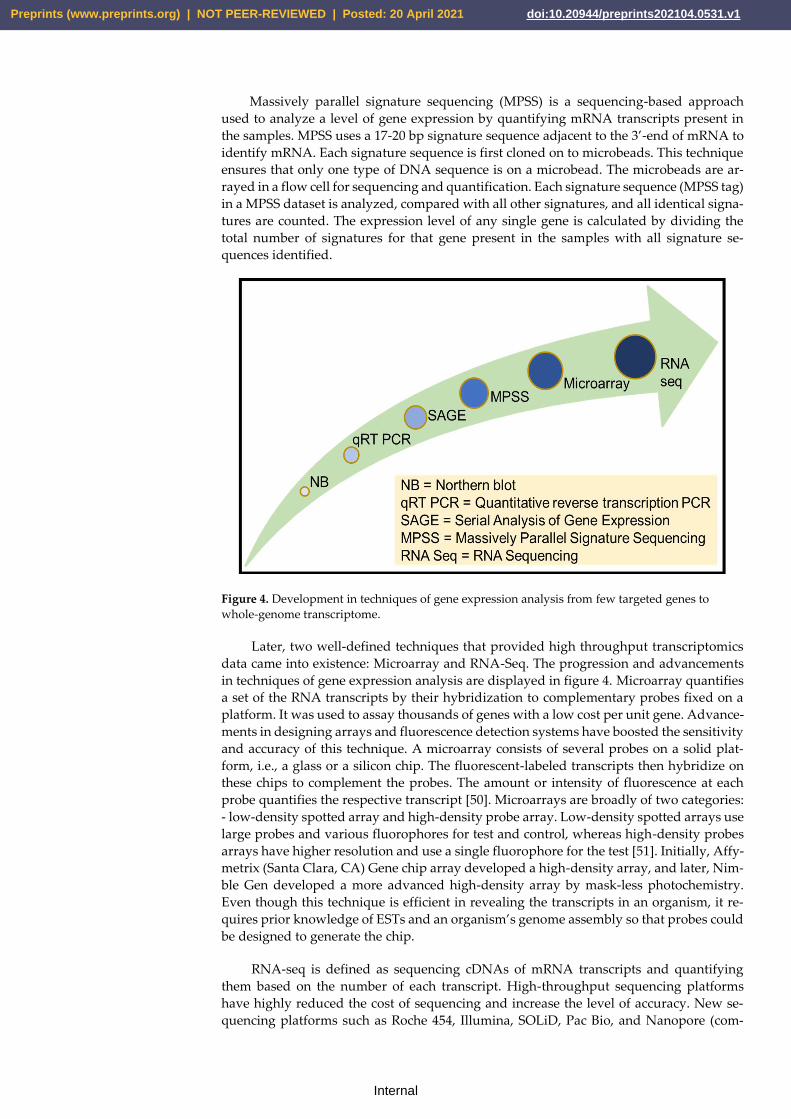
Massively parallel signature sequencing (MPSS) is a sequencing-based approach
used to analyze a level of gene expression by quantifying mRNA transcripts present in
the samples. MPSS uses a 17-20 bp signature sequence adjacent to the 3’-end of mRNA to
identify mRNA. Each signature sequence is first cloned on to microbeads. This technique
ensures that only one type of DNA sequence is on a microbead. The microbeads are ar-
rayed in a flow cell for sequencing and quantification. Each signature sequence (MPSS tag)
in a MPSS dataset is analyzed, compared with all other signatures, and all identical signa-
tures are counted. The expression level of any single gene is calculated by dividing the
total number of signatures for that gene present in the samples with all signature se-
quences identified.
Figure 4. Development in techniques of gene expression analysis from few targeted genes to
whole-genome transcriptome.
Later, two well-defined techniques that provided high throughput transcriptomics
data came into existence: Microarray and RNA-Seq. The progression and advancements
in techniques of gene expression analysis are displayed in figure 4. Microarray quantifies
a set of the RNA transcripts by their hybridization to complementary probes fixed on a
platform. It was used to assay thousands of genes with a low cost per unit gene. Advance-
ments in designing arrays and fluorescence detection systems have boosted the sensitivity
and accuracy of this technique. A microarray consists of several probes on a solid plat-
form, i.e., a glass or a silicon chip. The fluorescent-labeled transcripts then hybridize on
these chips to complement the probes. The amount or intensity of fluorescence at each
probe quantifies the respective transcript [50]. Microarrays are broadly of two categories:
- low-density spotted array and high-density probe array. Low-density spotted arrays use
large probes and various fluorophores for test and control, whereas high-density probes
arrays have higher resolution and use a single fluorophore for the test [51]. Initially, Affy-
metrix (Santa Clara, CA) Gene chip array developed a high-density array, and later, Nim-
ble Gen developed a more advanced high-density array by mask-less photochemistry.
Even though this technique is efficient in revealing the transcripts in an organism, it re-
quires prior knowledge of ESTs and an organism’s genome assembly so that probes could
be designed to generate the chip.
RNA-seq is defined as sequencing cDNAs of mRNA transcripts and quantifying
them based on the number of each transcript. High-throughput sequencing platforms
have highly reduced the cost of sequencing and increase the level of accuracy. New se-
quencing platforms such as Roche 454, Illumina, SOLiD, Pac Bio, and Nanopore (com-
Preprints (www.preprints.org) | NOT PEER-REVIEWED | Posted: 20 April 2021 doi:10.20944/preprints202104.0531.v1
Internal
pared in Table 2) have aided the RNA seq technique to provide extensive genome cover-
age [52,53]. RNA seq provides a tremendous amount of information about the genes pre-
sent & activation of these genes at a particular time point under specific conditions. In
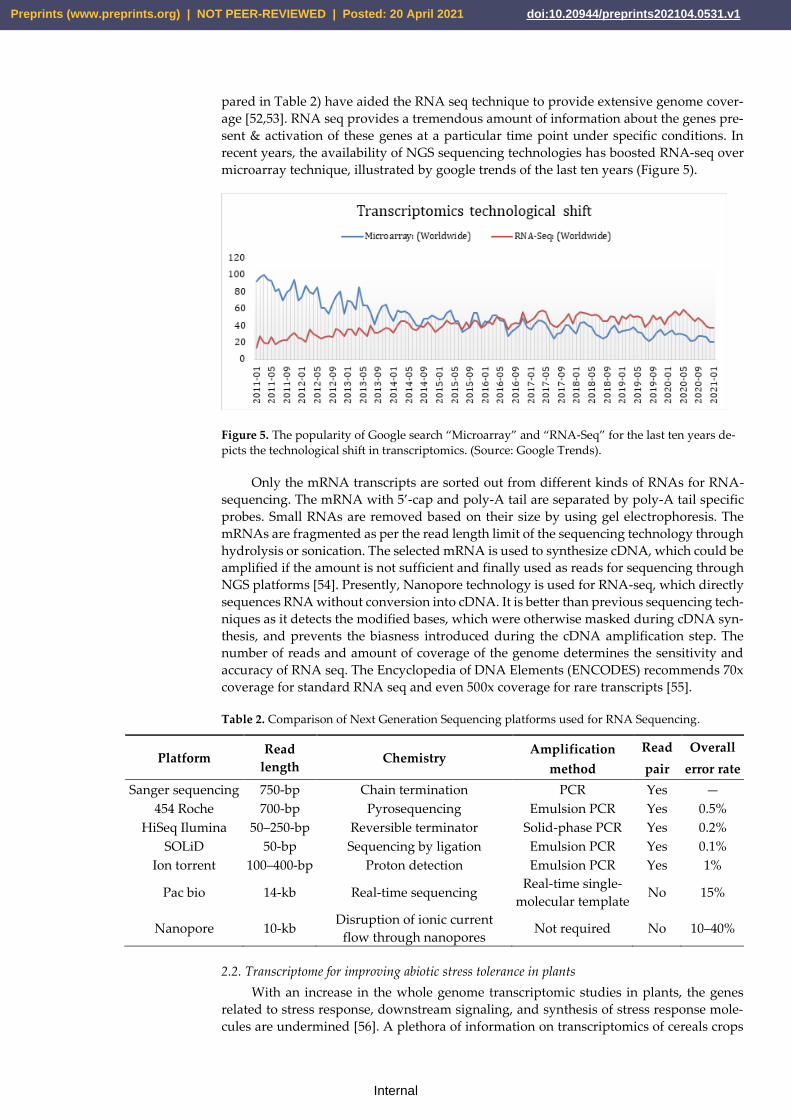
recent years, the availability of NGS sequencing technologies has boosted RNA-seq over
microarray technique, illustrated by google trends of the last ten years (Figure 5).
Figure 5. The popularity of Google search “Microarray” and “RNA-Seq” for the last ten years de-
picts the technological shift in transcriptomics. (Source: Google Trends).
Only the mRNA transcripts are sorted out from different kinds of RNAs for RNA-
sequencing. The mRNA with 5’-cap and poly-A tail are separated by poly-A tail specific
probes. Small RNAs are removed based on their size by using gel electrophoresis. The
mRNAs are fragmented as per the read length limit of the sequencing technology through
hydrolysis or sonication. The selected mRNA is used to synthesize cDNA, which could be
amplified if the amount is not sufficient and finally used as reads for sequencing through
NGS platforms [54]. Presently, Nanopore technology is used for RNA-seq, which directly
sequences RNA without conversion into cDNA. It is better than previous sequencing tech-
niques as it detects the modified bases, which were otherwise masked during cDNA syn-
thesis, and prevents the biasness introduced during the cDNA amplification step. The
number of reads and amount of coverage of the genome determines the sensitivity and
accuracy of RNA seq. The Encyclopedia of DNA Elements (ENCODES) recommends 70x
coverage for standard RNA seq and even 500x coverage for rare transcripts [55].
Table 2. Comparison of Next Generation Sequencing platforms used for RNA Sequencing.
Platform Read
length Chemistry
Amplification
method
Read
pair
Overall
error rate
Sanger sequencing 750-bp Chain termination PCR Yes —
454 Roche 700-bp Pyrosequencing Emulsion PCR Yes 0.5%
HiSeq Ilumina 50–250-bp Reversible terminator Solid-phase PCR Yes 0.2%
SOLiD 50-bp Sequencing by ligation Emulsion PCR Yes 0.1%
Ion torrent 100–400-bp Proton detection Emulsion PCR Yes 1%
Pac bio 14-kb Real-time sequencing Real-time single-
molecular template No 15%
Nanopore 10-kb Disruption of ionic current
flow through nanopores Not required No 10–40%
2.2. Transcriptome for improving abiotic stress tolerance in plants
With an increase in the whole genome transcriptomic studies in plants, the genes
related to stress response, downstream signaling, and synthesis of stress response mole-
cules are undermined [56]. A plethora of information on transcriptomics of cereals crops
Preprints (www.preprints.org) | NOT PEER-REVIEWED | Posted: 20 April 2021 doi:10.20944/preprints202104.0531.v1
Internal
such as rice, wheat, maize, barley, and sorghum are available. This information has pro-
vided insight into the coordination of different biological processes in various plant tis-
sues under stress conditions [57]. The study of drought stress during the flowering or
fruiting stage of the plant gives information about the reproductive system's interaction,
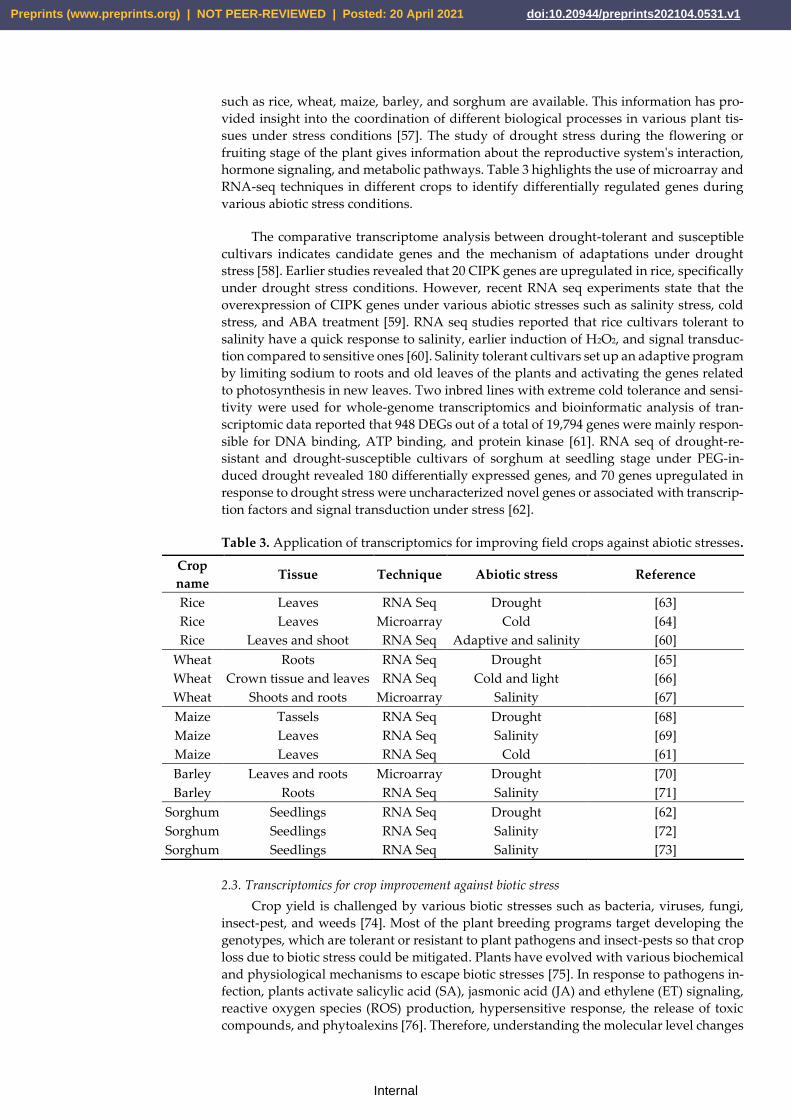
hormone signaling, and metabolic pathways. Table 3 highlights the use of microarray and
RNA-seq techniques in different crops to identify differentially regulated genes during
various abiotic stress conditions.
The comparative transcriptome analysis between drought-tolerant and susceptible
cultivars indicates candidate genes and the mechanism of adaptations under drought
stress [58]. Earlier studies revealed that 20 CIPK genes are upregulated in rice, specifically
under drought stress conditions. However, recent RNA seq experiments state that the
overexpression of CIPK genes under various abiotic stresses such as salinity stress, cold
stress, and ABA treatment [59]. RNA seq studies reported that rice cultivars tolerant to
salinity have a quick response to salinity, earlier induction of H2O2, and signal transduc-
tion compared to sensitive ones [60]. Salinity tolerant cultivars set up an adaptive program
by limiting sodium to roots and old leaves of the plants and activating the genes related
to photosynthesis in new leaves. Two inbred lines with extreme cold tolerance and sensi-
tivity were used for whole-genome transcriptomics and bioinformatic analysis of tran-
scriptomic data reported that 948 DEGs out of a total of 19,794 genes were mainly respon-
sible for DNA binding, ATP binding, and protein kinase [61]. RNA seq of drought-re-
sistant and drought-susceptible cultivars of sorghum at seedling stage under PEG-in-
duced drought revealed 180 differentially expressed genes, and 70 genes upregulated in
response to drought stress were uncharacterized novel genes or associated with transcrip-
tion factors and signal transduction under stress [62].
Table 3. Application of transcriptomics for improving field crops against abiotic stresses.
Crop
name Tissue Technique Abiotic stress Reference
Rice Leaves RNA Seq Drought [63]
Rice Leaves Microarray Cold [64]
Rice Leaves and shoot RNA Seq Adaptive and salinity [60]
Wheat Roots RNA Seq Drought [65]
Wheat Crown tissue and leaves RNA Seq Cold and light [66]
Wheat Shoots and roots Microarray Salinity [67]
Maize Tassels RNA Seq Drought [68]
Maize Leaves RNA Seq Salinity [69]
Maize Leaves RNA Seq Cold [61]
Barley Leaves and roots Microarray Drought [70]
Barley Roots RNA Seq Salinity [71]
Sorghum Seedlings RNA Seq Drought [62]
Sorghum Seedlings RNA Seq Salinity [72]
Sorghum Seedlings RNA Seq Salinity [73]
2.3. Transcriptomics for crop improvement against biotic stress
Crop yield is challenged by various biotic stresses such as bacteria, viruses, fungi,
insect-pest, and weeds [74]. Most of the plant breeding programs target developing the
genotypes, which are tolerant or resistant to plant pathogens and insect-pests so that crop
loss due to biotic stress could be mitigated. Plants have evolved with various biochemical
and physiological mechanisms to escape biotic stresses [75]. In response to pathogens in-
fection, plants activate salicylic acid (SA), jasmonic acid (JA) and ethylene (ET) signaling,
reactive oxygen species (ROS) production, hypersensitive response, the release of toxic
compounds, and phytoalexins [76]. Therefore, understanding the molecular level changes
Preprints (www.preprints.org) | NOT PEER-REVIEWED | Posted: 20 April 2021 doi:10.20944/preprints202104.0531.v1
Internal
in plants in response to pathogen attack is crucial to develop disease-resistant crop varie-
ties.
Various transcriptomic studies are conducted in cereal crops to decipher the disease
resistance mechanisms and to identify resistance (R)-genes. The whole-genome transcrip-
tome analysis of four wheat cultivars Wuhan 1, Nyubai, HC374, and Shaw, after head
inoculation with Fusarium graminearum, revealed upregulation of leucine-rich repeats –
receptor kinases (LRR-RKs), a class of receptor kinases involved in disease resistance dur-
ing different time points resistant and susceptible cultivars and differential expression
profile of different genotypes shows various genotype-specific defense responses [77]. Ta-
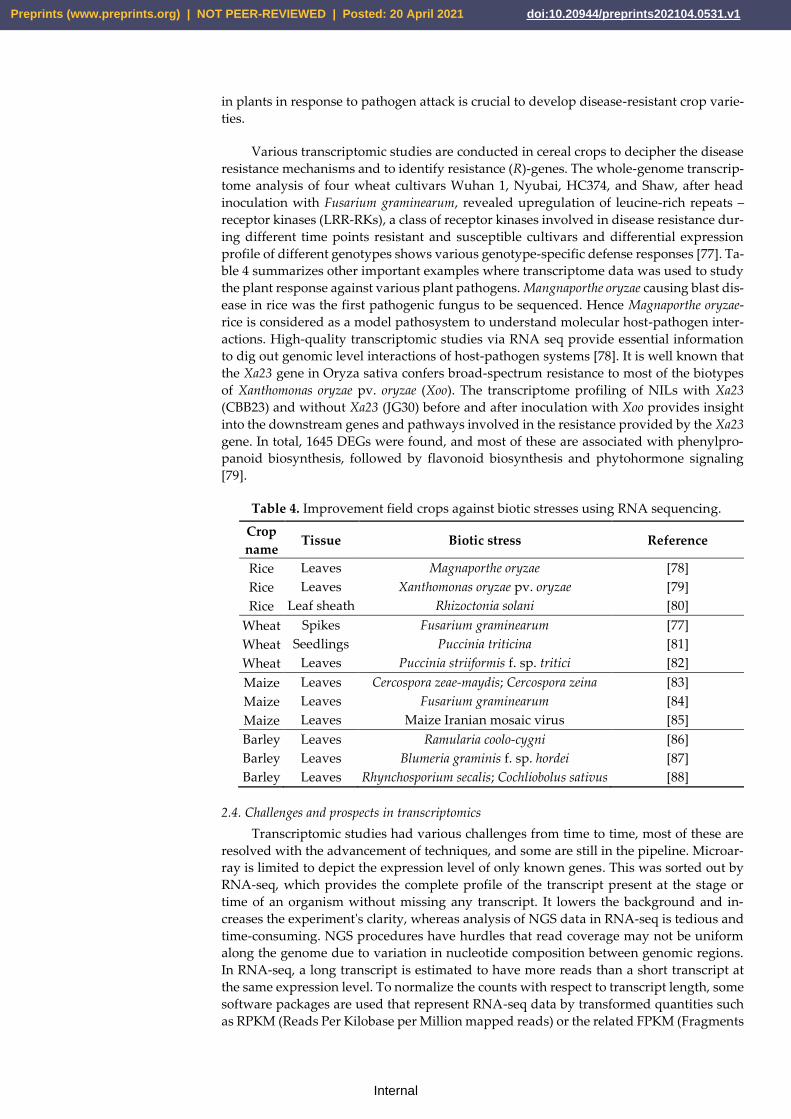
ble 4 summarizes other important examples where transcriptome data was used to study
the plant response against various plant pathogens. Mangnaporthe oryzae causing blast dis-
ease in rice was the first pathogenic fungus to be sequenced. Hence Magnaporthe oryzae-
rice is considered as a model pathosystem to understand molecular host-pathogen inter-
actions. High-quality transcriptomic studies via RNA seq provide essential information
to dig out genomic level interactions of host-pathogen systems [78]. It is well known that
the Xa23 gene in Oryza sativa confers broad-spectrum resistance to most of the biotypes
of Xanthomonas oryzae pv. oryzae (Xoo). The transcriptome profiling of NILs with Xa23
(CBB23) and without Xa23 (JG30) before and after inoculation with Xoo provides insight
into the downstream genes and pathways involved in the resistance provided by the Xa23
gene. In total, 1645 DEGs were found, and most of these are associated with phenylpro-
panoid biosynthesis, followed by flavonoid biosynthesis and phytohormone signaling
[79].
Table 4. Improvement field crops against biotic stresses using RNA sequencing.
Crop
name Tissue Biotic stress Reference
Rice Leaves Magnaporthe oryzae [78]
Rice Leaves Xanthomonas oryzae pv. oryzae [79]
Rice Leaf sheath Rhizoctonia solani [80]
Wheat Spikes Fusarium graminearum [77]
Wheat Seedlings Puccinia triticina [81]
Wheat Leaves Puccinia striiformis f. sp. tritici [82]
Maize Leaves Cercospora zeae-maydis; Cercospora zeina [83]
Maize Leaves Fusarium graminearum [84]
Maize Leaves Maize Iranian mosaic virus [85]
Barley Leaves Ramularia coolo-cygni [86]
Barley Leaves Blumeria graminis f. sp. hordei [87]
Barley Leaves Rhynchosporium secalis; Cochliobolus sativus [88]
2.4. Challenges and prospects in transcriptomics
Transcriptomic studies had various challenges from time to time, most of these are
resolved with the advancement of techniques, and some are still in the pipeline. Microar-
ray is limited to depict the expression level of only known genes. This was sorted out by
RNA-seq, which provides the complete profile of the transcript present at the stage or
time of an organism without missing any transcript. It lowers the background and in-
creases the experiment's clarity, whereas analysis of NGS data in RNA-seq is tedious and
time-consuming. NGS procedures have hurdles that read coverage may not be uniform
along the genome due to variation in nucleotide composition between genomic regions.
In RNA-seq, a long transcript is estimated to have more reads than a short transcript at
the same expression level. To normalize the counts with respect to transcript length, some
software packages are used that represent RNA-seq data by transformed quantities such
as RPKM (Reads Per Kilobase per Million mapped reads) or the related FPKM (Fragments
Preprints (www.preprints.org) | NOT PEER-REVIEWED | Posted: 20 April 2021 doi:10.20944/preprints202104.0531.v1
Internal
Per Kilobase per Million mapped reads). The software, such as Cufflinks/Cuffdiff, pro-
vides an integrated analysis pipeline from the aligned reads to the differential expression
results, where the inference is based on FPKM values. Further improvements in RNA-seq
are revolutionizing the transcriptomics studies in plants to develop crop varieties in the
near future which can withstand biotic and abiotic stress and produce a higher yield.
3. Cereal proteomics
The advances in genomic techniques provide a blueprint of possible gene products
that have changed our way of studying biological systems. As the genome is static, it lacks
to provide the correlation between mRNA and protein abundance due to post-transla-
tional modifications, protein function, and localization. Also, it does not give the biologi-
cal snapshot of an organism at a particular developmental time point. Therefore, it is es-
sential to study the protein structure, their interactions to explore their role during plant
growth and development. Proteomics is a systemic, high-throughput approach for com-
prehensive identification and analysis of protein expression in a cell, tissue, or organelle
of an organism at a particular time under specific conditions [89]. The very first report of
2-DE dates back to 1975, which provided the first glimpse of the protein levels and the
isoforms of the cells. Marc Wilkins coined the term proteomics in 1994 as the extension of
the word “proteome” (PROTein complement of the genOME) at the first 2-DE meeting in
Siena, Italy [90]. The study of proteome profiles provides deep insight into various meta-
bolic processes and their interaction with different regulatory pathways in a biological
system. Proteomics is a powerful tool providing robust and better representation of the
cell functioning than other techniques, including genomics tools.
The advancements in proteomics in the last decade have led to new and improved
technologies, including two-dimensional polyacrylamide gel electrophoresis (2D-PAGE),
liquid chromatography (LC), mass spectrometry (MS), etc. which have enabled fast and
accurate protein identifications.
3.1. Technical advances in proteomics
In the recent past, various proteomics approaches have been developed and adopted
in plants. These tools pave the way for high-throughput proteome analysis for quantifica-
tion, localization, protein-protein interactions, and post-translational modifications
(PTMs). All proteomics technologies have three main steps, including protein extraction,
separation (gel-based or gel-free/Column-based methods), and identification or quantifi-
cation (Mass Spectrometry, MS) [91]. The Gel-free techniques can be label-free such as
liquid chromatography coupled with mass spectrometry, LC-MS or tag-based such as
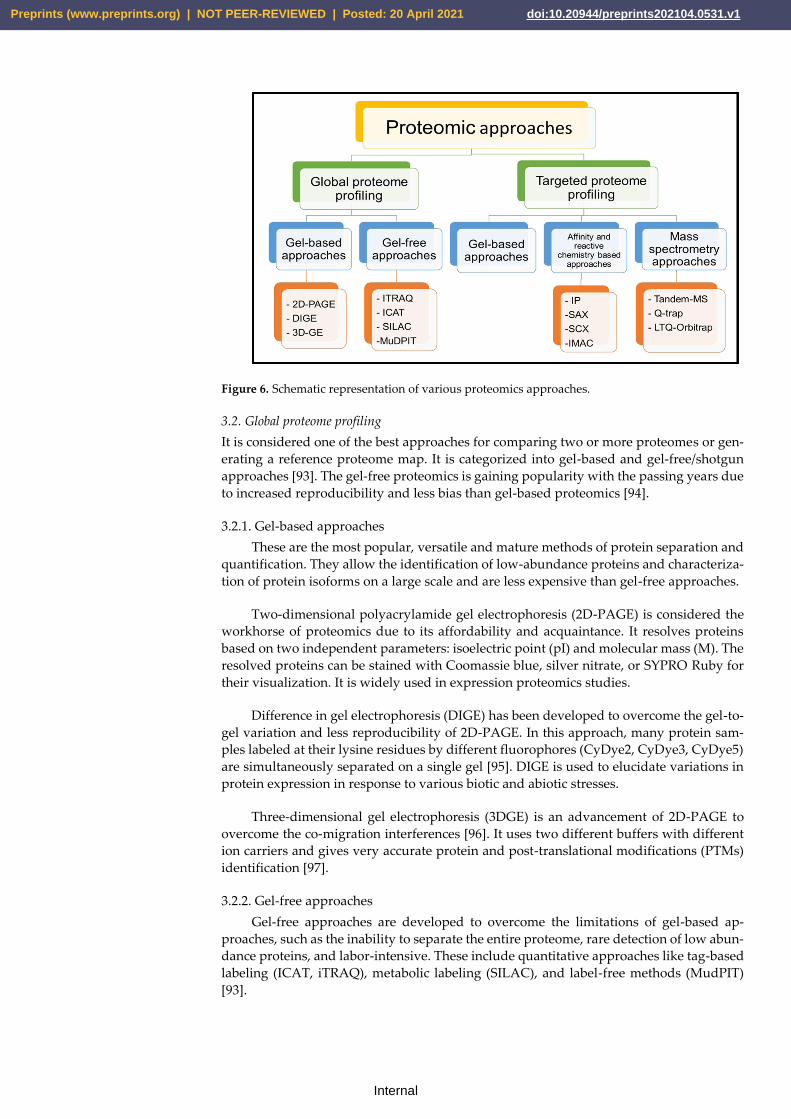
ICAT, iTRAQ, etc. [92] (Figure 6). A single technology cannot comprehensively analyze
complete plant proteome due to its complex and dynamic nature. Therefore, multiple ap-
proaches are used to improve the understanding, resolution, and coverage of plant prote-
ome. Table 5 provides knowledge about different proteomics techniques used to study
abiotic and biotic stress responses in cereal crops, including wheat, barley, rice, maize,
and sorghum. Various factors such as availability of resources, facilities, and applications
like global or targeted profiling decide the proteome's approaches [91].
Preprints (www.preprints.org) | NOT PEER-REVIEWED | Posted: 20 April 2021 doi:10.20944/preprints202104.0531.v1
Internal
Figure 6. Schematic representation of various proteomics approaches.
3.2. Global proteome profiling
It is considered one of the best approaches for comparing two or more proteomes or gen-
erating a reference proteome map. It is categorized into gel-based and gel-free/shotgun
approaches [93]. The gel-free proteomics is gaining popularity with the passing years due
to increased reproducibility and less bias than gel-based proteomics [94].
3.2.1. Gel-based approaches
These are the most popular, versatile and mature methods of protein separation and
quantification. They allow the identification of low-abundance proteins and characteriza-
tion of protein isoforms on a large scale and are less expensive than gel-free approaches.
Two-dimensional polyacrylamide gel electrophoresis (2D-PAGE) is considered the
workhorse of proteomics due to its affordability and acquaintance. It resolves proteins
based on two independent parameters: isoelectric point (pI) and molecular mass (M). The
resolved proteins can be stained with Coomassie blue, silver nitrate, or SYPRO Ruby for
their visualization. It is widely used in expression proteomics studies.
Difference in gel electrophoresis (DIGE) has been developed to overcome the gel-to-
gel variation and less reproducibility of 2D-PAGE. In this approach, many protein sam-
ples labeled at their lysine residues by different fluorophores (CyDye2, CyDye3, CyDye5)
are simultaneously separated on a single gel [95]. DIGE is used to elucidate variations in
protein expression in response to various biotic and abiotic stresses.
Three-dimensional gel electrophoresis (3DGE) is an advancement of 2D-PAGE to
overcome the co-migration interferences [96]. It uses two different buffers with different
ion carriers and gives very accurate protein and post-translational modifications (PTMs)
identification [97].
3.2.2. Gel-free approaches
Gel-free approaches are developed to overcome the limitations of gel-based ap-
proaches, such as the inability to separate the entire proteome, rare detection of low abun-
dance proteins, and labor-intensive. These include quantitative approaches like tag-based
labeling (ICAT, iTRAQ), metabolic labeling (SILAC), and label-free methods (MudPIT)
[93].
Preprints (www.preprints.org) | NOT PEER-REVIEWED | Posted: 20 April 2021 doi:10.20944/preprints202104.0531.v1
Internal
Isotope-Coded Affinity Tagging (ICAT) is an in-vitro isotopic labeling approach for
protein quantification, which involves the use of an affinity tag (biotin), linker having sta-
ble isotope, and a reactive group that binds to thiol groups (cysteines) of proteins. The
labeled tryptic peptides are first fractionated by chromatography and then identified by
mass spectrometry (MS) [98]. ICAT mainly contributes to identify novel proteins control-
ling a vital biological function in a particular cultivar [99].
Isobaric Tagging for Relative and Absolute Quantification (iTRAQ) is a multiplex
protein quantification technique utilizing the isobaric tags for labeling the N-terminus and
side-chain amine groups of proteins. The sensitivity of protein quantification from differ-
ent sources in one test is much higher than ICAT [100]. Crop breeders use this technique
to elucidate markers for biotic and abiotic stresses, and those later can be used in design-
ing genetically modified crops.
Stable Isotope Labelling by Amino Acid in Cell Culture (SILAC) is a metabolic label-
ing technique that is the most potent approach for dynamic quantitative plant proteome
studies. It utilizes in-vivo labeling of cell population grown in either N14 or N15 contain-
ing medium [101]. It is advantageous to identify proteome changes in signaling pathways
triggered by PTMs in response to stress [102].
Multi-dimensional protein identification technology (MudPIT) is a shotgun prote-
omics tool used for complex multi-dimensional protein analysis [94]. It is a less complex
and highly sensitive technique for the identification of low abundance proteins. In this
approach, the biphasic or triphasic microcapillary columns are used to separate digested
proteins, followed by performing tandem MS. This technology has been used to unravel
the mechanisms involved in controlling tiller numbers in rice.
3.3. Targeted proteome profiling
It is a selective proteome analysis of interacting proteins or post-transcriptionally
modified proteins using PTM-specific stains, antibodies, or targeted MS assays [91]. It can
be classified into gel-based, affinity and reactive chemistry-based and MS-based targeted
proteomics.
3.3.1. Gel-based proteomics
The global proteome analysis is undertaken using 2D-PAGE, followed by staining
with Phosphoprotein specific gel stain (Pro-Q Diamond) (PTM specific stain). However,
these approaches are not used these days due to a lack of identification of less abundant
proteins [91].
3.3.2. Affinity and Reactive chemistry-based proteomics
In this approach, specific proteins are isolated, enriched, and purified by different
techniques such as immunoprecipitation (IP), strong cation exchange (SCX), strong anion
exchange (SAX), and immobilized metal affinity chromatography (IMAC). These tech-
niques can be used individually or coupled with one another to enhance efficiency.
3.3.3. MS-based proteomics
They are based on detecting signals resulting from transitions in the ions during the frag-
mentation in the mass spectrometer. Various tools like tandem MS, Quadrupole trap (Q-
trap), triple quadrupole, and Linear Trap Quadrupole Orbitrap (LTQ- Orbitrap) are com-
monly used. Selected Reaction Monitoring (SRM) is the process of detection of transitions
in triple quadrupole, whereas Multiple Reaction Monitoring (MRM) is the detection of
multiple modifications [103]. However, the afore-mentioned techniques suffer from pre-
cision errors between samples. To overcome this shortcoming, SRM/MRM techniques are
isotopically labeled [104].
Preprints (www.preprints.org) | NOT PEER-REVIEWED | Posted: 20 April 2021 doi:10.20944/preprints202104.0531.v1
Internal
Table 5. Application of various proteomics technologies for improving field crops
against abiotic and biotic stresses during the last decade.
Crop
name
Abiotic/
Biotic stresses Techniques References
Rice Drought LC-MS/MS [105]
Rice Response to selenium 2DE [106]
Rice Bakanae disease TMT-MS [107]
Rice Bacterial blight 2DE/MudPIT, MALDI-TOF/MS [108]
Wheat Drought 2D-PAGE [109]
Wheat Drought 2DE, MALDI-TOF-TOF-MS [110]
Wheat Yellow rust nanoLC ESI-MS/MS [111]
Wheat Yellow rust 2D-PAGE [112]
Maize Salinity iTRAQ, LC-MS/MS [113]
Maize Heavy metal iTRAQ, LC-MS/MS [114]
Maize Ear rot disease iTRAQ [115]
Maize Maize rough dwarf disease LC-MS/MS, TMT labeling [116]
Barley Drought DIGE & LTQ-Orbitrap [117]
Barley Salinity 2D-PAGE [118]
Barley Leaf rust LC-MS/MS [119]
Barley Fusarium head blight 2D-PAGE, MS [120]
Barley Powdery mildew LC-MS [121]
Sorghum Heavy metal toxicity 2D-PAGE [122]
Sorghum Drought DIGE [123]
Sorghum Downy mildew 2D-PAGE, MLADI-TOF/MS [124]
3.4. Bioinformatics in Proteomics
The technical advances in proteomics approaches have made it possible to achieve a
massive amount of high-quality protein expression data. It is challenging to associate this
data with other –omics technologies like genomics, transcriptomics, metabolomics, and
phenomics. Bioinformatics plays a fundamental role in overcoming this bottleneck by re-
ducing the analysis time and providing statistically significant results. Some of the major
proteomics databases currently used are PRoteomics IDEntification database (PRIDE)
[125], Peptide Atlas [126], and Mass Spectrometry Interactive Virtual Environment (Mas-
sIVE). Various comprehensive databases for plant proteomics such as Plant Proteomics
Database (PPDB), 1001 Proteomes, Pep2 Pro Database, DIPOS, etc. [127-130] as well as
different web-based prediction tools like GelMap [131], MRMaid [132], Peptide Atlas SRM
Experiment Library (PASSEL) [133], etc. have been developed to assist proteome analysis.
3.5. Challenges and prospects in proteomics
The proteomic analysis complements both transcriptomics and metabolomics for
elucidating plants' cellular mechanism and, thus, is a vital tool for crop improvement. The
recent advancements in proteomics techniques have enabled us to unravel plant biology.
However, we still need to overcome the various limitations of these techniques to develop
smart crops with high grain quality and capable of withstanding multiple stresses. New
emerging technologies such as peptidome, phosphoproteomics, and redox proteomics
will provide in-depth insight into molecular interactions and protein function [134]. With
the ever-changing climate, new plant variants are being introduced continuously to cope
with these fluctuations. Novel proteomic tools will enable us to generate more stress-tol-
erant or stress-adaptive cultivars.
4. Cereal metabolomics
Preprints (www.preprints.org) | NOT PEER-REVIEWED | Posted: 20 April 2021 doi:10.20944/preprints202104.0531.v1
Internal
Metabolomics is a relatively new “-omics” technology for deciphering the plant
metabolomes and, hence understanding the complex biological systems. Metabolomics
allows a comprehensive profiling and comparison of a small molecules (<1500 Da) of a
cell, tissue, organ, or organism [135]. Metabolomics deals with the identification and quan-
tification of metabolites in a biological system for investigating their compositions and
interactions with environment [136]. Moreover, compared with genomics, transcriptom-
ics, and proteomics, metabolomics focuses on investigating the biological activities, and,
therefore, is relatively easier to relate to the phenotype [137].
Based on the purpose of the study, metabolomics can be differentiated into two types,
viz., targeted and untargeted. Targeted metabolomics deals with the absolute quantifica-
tion of one or a few metabolites in a set of predefined known substances. The targeted
approach, therefore, tends to be highly sensitive and quantitative, and can be useful to
trail the metabolites known to be associated with specific stress. Thus, targeted metabo-
lomics is a discovery-based approach and measures the relative abundances of several
hundred to thousands of all detectable metabolites. The Untargeted approach, on the
other hand, can measure mass spectrometric features of unknown metabolites, and thus
enhances the chances of sensing unintended effects [136].
In recent years, metabolomics has been used to understand biotic and abiotic stresses
in crop plants, and many studies summarize the metabolomic advances in corn, sorghum,
wheat, rice, and barley, investigating the composition of these crops and/or their products
and their applications for crop improvement (reviewed in [138-140]). Understanding the
plant metabolomic processes would be beneficial for improving crop yield and human
nutrition aspects in crop breeding programs Future perspectives of metabolomics inte-
grating other “-omics” technologies were also highlighted.
4.1. Overview of metabolomic pipeline
The workflow for metabolomics involves a series of steps, including experimental
design, sample preparation and extraction, metabolite detection using analytical tech-
niques, and data processing and analysis using bioinformatics techniques. Since metabo-
lomics involves a wide range of diverse compounds, variations in metabolite concentra-
tion (∼106) can complicate the downstream analyses [137]. Thus, it is essential to carefully
choose (1) the appropriate experimental design, (2) optimize sample preparation and ex-
traction protocols, and (3) detection technologies for comprehensive metabolomic anal-
yses.
Numerous extraction protocols are available for metabolomics analysis [141,142].
Standard sample preparation protocols involve plant material collection in liquid nitrogen
followed by rapid cooling or freeze-drying of sample and then extraction using 80% or
100% methanol [143]. Furthermore, experimental parameters such as the concentration of
solvents, extraction time, and temperature can also influence the observed metabolite pro-
files. Hence, optimizing the metabolomic protocol is an essential step mics, and prote-
omics, metabolomics focuses on investigating biological activities and is relatively easier
to relate to the phenotype [137]. For example, targeted metabolomics can be optimized to
increase the signal-to-noise (s/n) ratio of the desired metabolite or decrease the time and
cost of experimentation [136]. The untargeted approach must be optimized for reproduc-
ibility of the protocol to detect the ratio of the actual variation in a biological sample to the
variation due to experimental errors. Several approaches, such as fractional factorial anal-
ysis or D-Optimal design to experimental design, can optimize metabolomic protocols
[136].
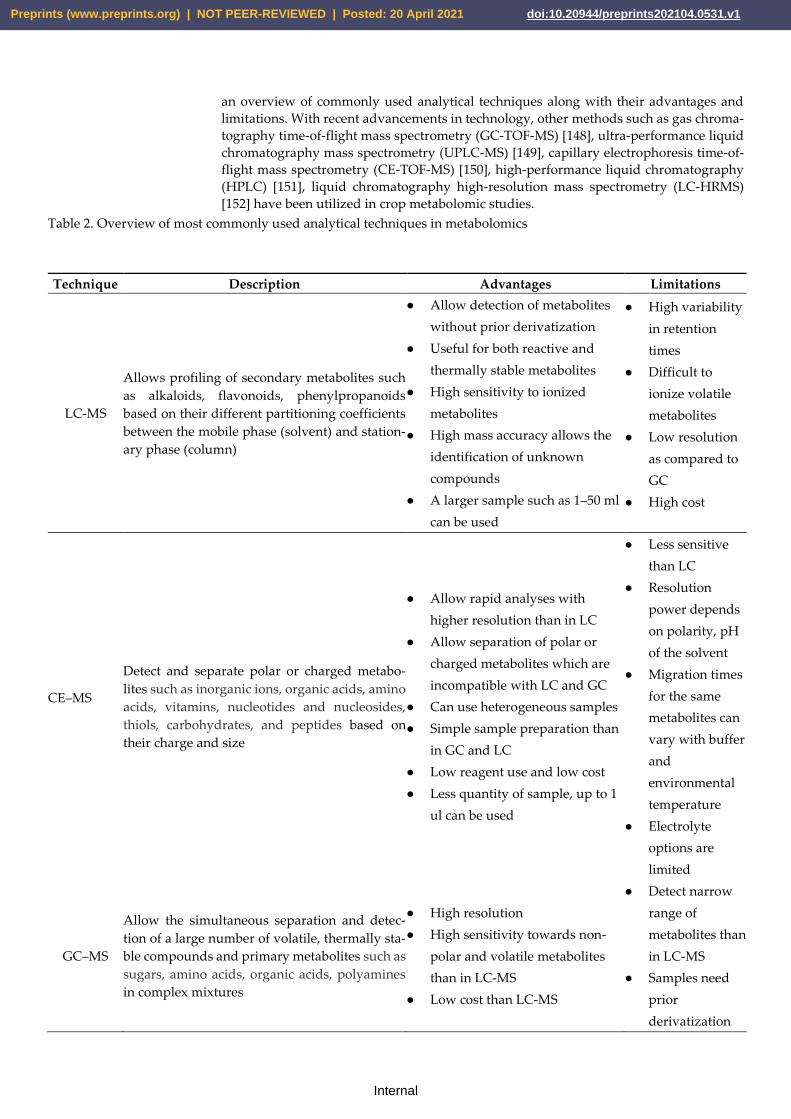
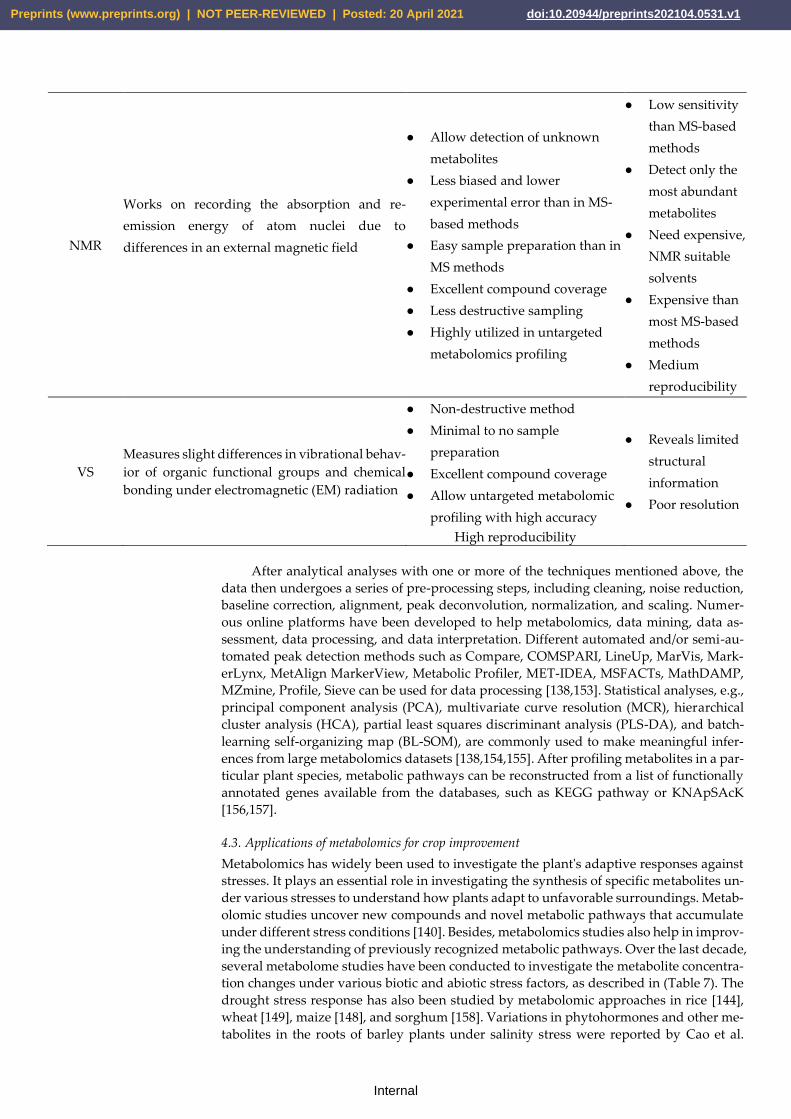
4.2. Analytical and data processing techniques in crop metabolomics
Several techniques, e.g., gas chromatography mass spectrometry (GC–MS) [144], liq-
uid chromatography mass spectrometry (LC-MS) [145], capillary electrophoresis mass
spectrometry (CE-MS) [146], nuclear magnetic resonance (NMR) [147], and vibrational
spectroscopy (VS) [136] have been applied in crop metabolomic studies. Table 6 provides
Preprints (www.preprints.org) | NOT PEER-REVIEWED | Posted: 20 April 2021 doi:10.20944/preprints202104.0531.v1
Internal
an overview of commonly used analytical techniques along with their advantages and
limitations. With recent advancements in technology, other methods such as gas chroma-
tography time-of-flight mass spectrometry (GC-TOF-MS) [148], ultra-performance liquid
chromatography mass spectrometry (UPLC-MS) [149], capillary electrophoresis time-of-
flight mass spectrometry (CE-TOF-MS) [150], high-performance liquid chromatography
(HPLC) [151], liquid chromatography high-resolution mass spectrometry (LC-HRMS)
[152] have been utilized in crop metabolomic studies.
Table 2. Overview of most commonly used analytical techniques in metabolomics
Technique Description Advantages Limitations
LC-MS
Allows profiling of secondary metabolites such
as alkaloids, flavonoids, phenylpropanoids
based on their different partitioning coefficients
between the mobile phase (solvent) and station-
ary phase (column)
● Allow detection of metabolites
without prior derivatization
● Useful for both reactive and
thermally stable metabolites
● High sensitivity to ionized
metabolites
● High mass accuracy allows the
identification of unknown
compounds
● A larger sample such as 1–50 ml
can be used
● High variability
in retention
times
● Difficult to
ionize volatile
metabolites
● Low resolution
as compared to
GC
● High cost
CE–MS
Detect and separate polar or charged metabo-
lites such as inorganic ions, organic acids, amino
acids, vitamins, nucleotides and nucleosides,
thiols, carbohydrates, and peptides based on
their charge and size
● Allow rapid analyses with
higher resolution than in LC
● Allow separation of polar or
charged metabolites which are
incompatible with LC and GC
● Can use heterogeneous samples
● Simple sample preparation than
in GC and LC
● Low reagent use and low cost
● Less quantity of sample, up to 1
ul can be used
● Less sensitive
than LC
● Resolution
power depends
on polarity, pH
of the solvent
● Migration times
for the same
metabolites can
vary with buffer
and
environmental
temperature
● Electrolyte
options are
limited
GC–MS
Allow the simultaneous separation and detec-
tion of a large number of volatile, thermally sta-
ble compounds and primary metabolites such as
sugars, amino acids, organic acids, polyamines
in complex mixtures
● High resolution
● High sensitivity towards non-
polar and volatile metabolites
than in LC-MS
● Low cost than LC-MS
● Detect narrow
range of
metabolites than
in LC-MS
● Samples need
prior
derivatization
Preprints (www.preprints.org) | NOT PEER-REVIEWED | Posted: 20 April 2021 doi:10.20944/preprints202104.0531.v1
Internal
NMR
Works on recording the absorption and re-
emission energy of atom nuclei due to
differences in an external magnetic field
● Allow detection of unknown
metabolites
● Less biased and lower
experimental error than in MS-
based methods
● Easy sample preparation than in
MS methods
● Excellent compound coverage
● Less destructive sampling
● Highly utilized in untargeted
metabolomics profiling
● Low sensitivity
than MS-based
methods
● Detect only the
most abundant
metabolites
● Need expensive,
NMR suitable
solvents
● Expensive than
most MS-based
methods
● Medium
reproducibility
VS
Measures slight differences in vibrational behav-
ior of organic functional groups and chemical
bonding under electromagnetic (EM) radiation
● Non-destructive method
● Minimal to no sample
preparation
● Excellent compound coverage
● Allow untargeted metabolomic
profiling with high accuracy
High reproducibility
● Reveals limited
structural
information
● Poor resolution
After analytical analyses with one or more of the techniques mentioned above, the
data then undergoes a series of pre-processing steps, including cleaning, noise reduction,
baseline correction, alignment, peak deconvolution, normalization, and scaling. Numer-
ous online platforms have been developed to help metabolomics, data mining, data as-
sessment, data processing, and data interpretation. Different automated and/or semi-au-
tomated peak detection methods such as Compare, COMSPARI, LineUp, MarVis, Mark-
erLynx, MetAlign MarkerView, Metabolic Profiler, MET-IDEA, MSFACTs, MathDAMP,
MZmine, Profile, Sieve can be used for data processing [138,153]. Statistical analyses, e.g.,
principal component analysis (PCA), multivariate curve resolution (MCR), hierarchical
cluster analysis (HCA), partial least squares discriminant analysis (PLS-DA), and batch-
learning self-organizing map (BL-SOM), are commonly used to make meaningful infer-
ences from large metabolomics datasets [138,154,155]. After profiling metabolites in a par-
ticular plant species, metabolic pathways can be reconstructed from a list of functionally
annotated genes available from the databases, such as KEGG pathway or KNApSAcK
[156,157].
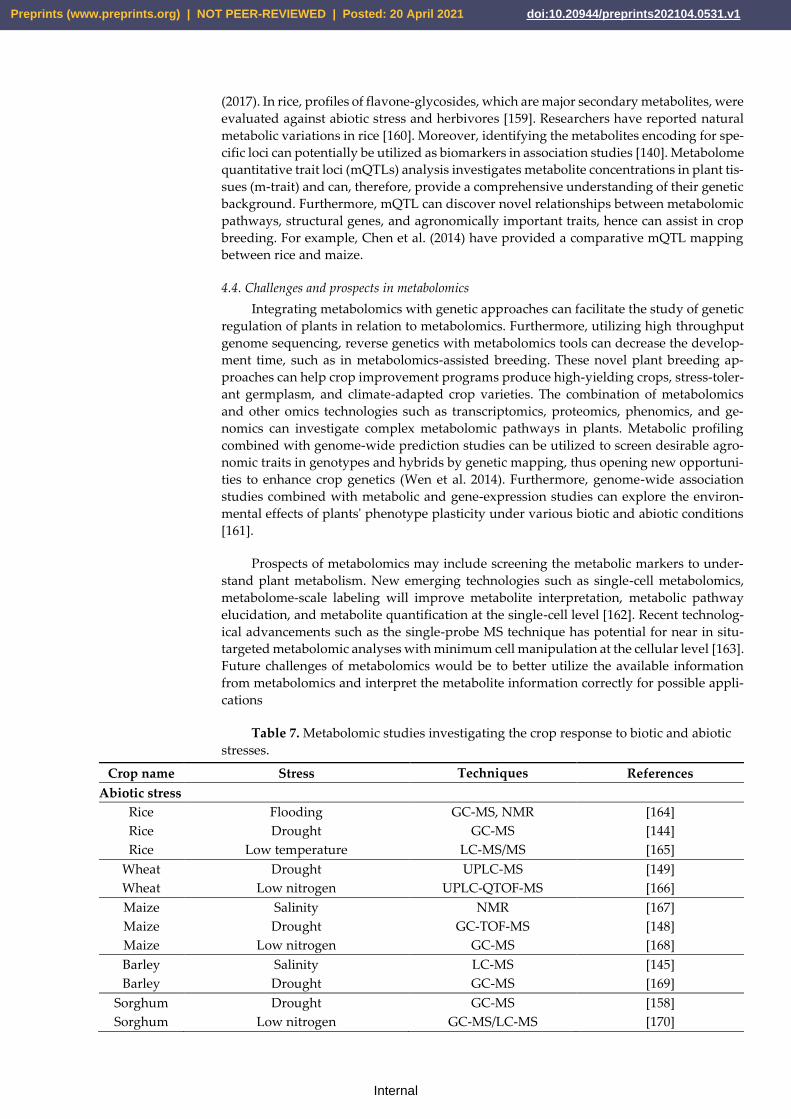
4.3. Applications of metabolomics for crop improvement
Metabolomics has widely been used to investigate the plant's adaptive responses against
stresses. It plays an essential role in investigating the synthesis of specific metabolites un-
der various stresses to understand how plants adapt to unfavorable surroundings. Metab-
olomic studies uncover new compounds and novel metabolic pathways that accumulate
under different stress conditions [140]. Besides, metabolomics studies also help in improv-
ing the understanding of previously recognized metabolic pathways. Over the last decade,
several metabolome studies have been conducted to investigate the metabolite concentra-
tion changes under various biotic and abiotic stress factors, as described in (Table 7). The
drought stress response has also been studied by metabolomic approaches in rice [144],
wheat [149], maize [148], and sorghum [158]. Variations in phytohormones and other me-
tabolites in the roots of barley plants under salinity stress were reported by Cao et al.
Preprints (www.preprints.org) | NOT PEER-REVIEWED | Posted: 20 April 2021 doi:10.20944/preprints202104.0531.v1
Internal
(2017). In rice, profiles of flavone-glycosides, which are major secondary metabolites, were
evaluated against abiotic stress and herbivores [159]. Researchers have reported natural
metabolic variations in rice [160]. Moreover, identifying the metabolites encoding for spe-
cific loci can potentially be utilized as biomarkers in association studies [140]. Metabolome
quantitative trait loci (mQTLs) analysis investigates metabolite concentrations in plant tis-
sues (m-trait) and can, therefore, provide a comprehensive understanding of their genetic
background. Furthermore, mQTL can discover novel relationships between metabolomic
pathways, structural genes, and agronomically important traits, hence can assist in crop
breeding. For example, Chen et al. (2014) have provided a comparative mQTL mapping
between rice and maize.
4.4. Challenges and prospects in metabolomics
Integrating metabolomics with genetic approaches can facilitate the study of genetic
regulation of plants in relation to metabolomics. Furthermore, utilizing high throughput
genome sequencing, reverse genetics with metabolomics tools can decrease the develop-
ment time, such as in metabolomics-assisted breeding. These novel plant breeding ap-
proaches can help crop improvement programs produce high-yielding crops, stress-toler-
ant germplasm, and climate-adapted crop varieties. The combination of metabolomics
and other omics technologies such as transcriptomics, proteomics, phenomics, and ge-
nomics can investigate complex metabolomic pathways in plants. Metabolic profiling
combined with genome-wide prediction studies can be utilized to screen desirable agro-
nomic traits in genotypes and hybrids by genetic mapping, thus opening new opportuni-
ties to enhance crop genetics (Wen et al. 2014). Furthermore, genome-wide association
studies combined with metabolic and gene-expression studies can explore the environ-
mental effects of plants' phenotype plasticity under various biotic and abiotic conditions
[161].
Prospects of metabolomics may include screening the metabolic markers to under-
stand plant metabolism. New emerging technologies such as single-cell metabolomics,
metabolome-scale labeling will improve metabolite interpretation, metabolic pathway
elucidation, and metabolite quantification at the single-cell level [162]. Recent technolog-
ical advancements such as the single-probe MS technique has potential for near in situ-
targeted metabolomic analyses with minimum cell manipulation at the cellular level [163].
Future challenges of metabolomics would be to better utilize the available information
from metabolomics and interpret the metabolite information correctly for possible appli-
cations
Table 7. Metabolomic studies investigating the crop response to biotic and abiotic
stresses.
Crop name Stress Techniques References
Abiotic stress
Rice Flooding GC-MS, NMR [164]
Rice Drought GC-MS [144]
Rice Low temperature LC-MS/MS [165]
Wheat Drought UPLC-MS [149]
Wheat Low nitrogen UPLC-QTOF-MS [166]
Maize Salinity NMR [167]
Maize Drought GC-TOF-MS [148]
Maize Low nitrogen GC-MS [168]
Barley Salinity LC-MS [145]
Barley Drought GC-MS [169]
Sorghum Drought GC-MS [158]
Sorghum Low nitrogen GC-MS/LC-MS [170]
Preprints (www.preprints.org) | NOT PEER-REVIEWED | Posted: 20 April 2021 doi:10.20944/preprints202104.0531.v1
Internal
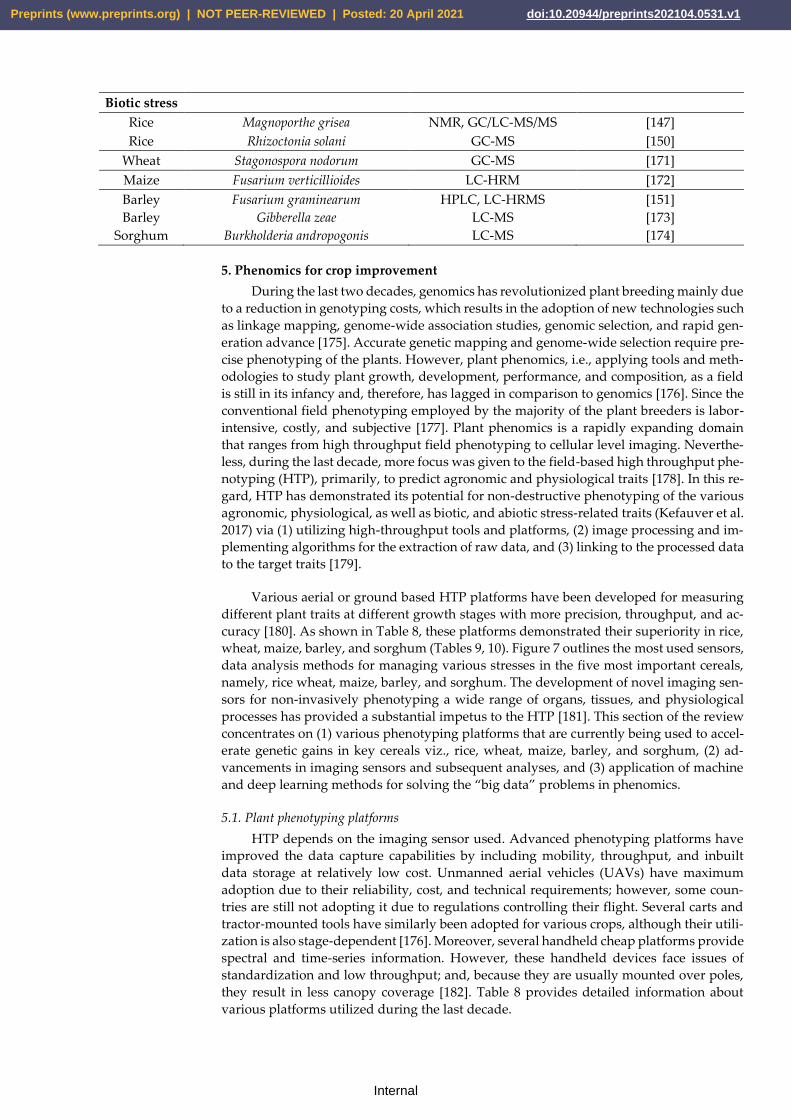
Biotic stress
Rice Magnoporthe grisea NMR, GC/LC-MS/MS [147]
Rice Rhizoctonia solani GC-MS [150]
Wheat Stagonospora nodorum GC-MS [171]
Maize Fusarium verticillioides LC-HRM [172]
Barley
Barley
Fusarium graminearum
Gibberella zeae
HPLC, LC-HRMS
LC-MS
[151]
[173]
Sorghum Burkholderia andropogonis LC-MS [174]
5. Phenomics for crop improvement
During the last two decades, genomics has revolutionized plant breeding mainly due
to a reduction in genotyping costs, which results in the adoption of new technologies such
as linkage mapping, genome-wide association studies, genomic selection, and rapid gen-
eration advance [175]. Accurate genetic mapping and genome-wide selection require pre-
cise phenotyping of the plants. However, plant phenomics, i.e., applying tools and meth-
odologies to study plant growth, development, performance, and composition, as a field
is still in its infancy and, therefore, has lagged in comparison to genomics [176]. Since the
conventional field phenotyping employed by the majority of the plant breeders is labor-
intensive, costly, and subjective [177]. Plant phenomics is a rapidly expanding domain
that ranges from high throughput field phenotyping to cellular level imaging. Neverthe-
less, during the last decade, more focus was given to the field-based high throughput phe-
notyping (HTP), primarily, to predict agronomic and physiological traits [178]. In this re-
gard, HTP has demonstrated its potential for non-destructive phenotyping of the various
agronomic, physiological, as well as biotic, and abiotic stress-related traits (Kefauver et al.
2017) via (1) utilizing high-throughput tools and platforms, (2) image processing and im-
plementing algorithms for the extraction of raw data, and (3) linking to the processed data
to the target traits [179].
Various aerial or ground based HTP platforms have been developed for measuring
different plant traits at different growth stages with more precision, throughput, and ac-
curacy [180]. As shown in Table 8, these platforms demonstrated their superiority in rice,
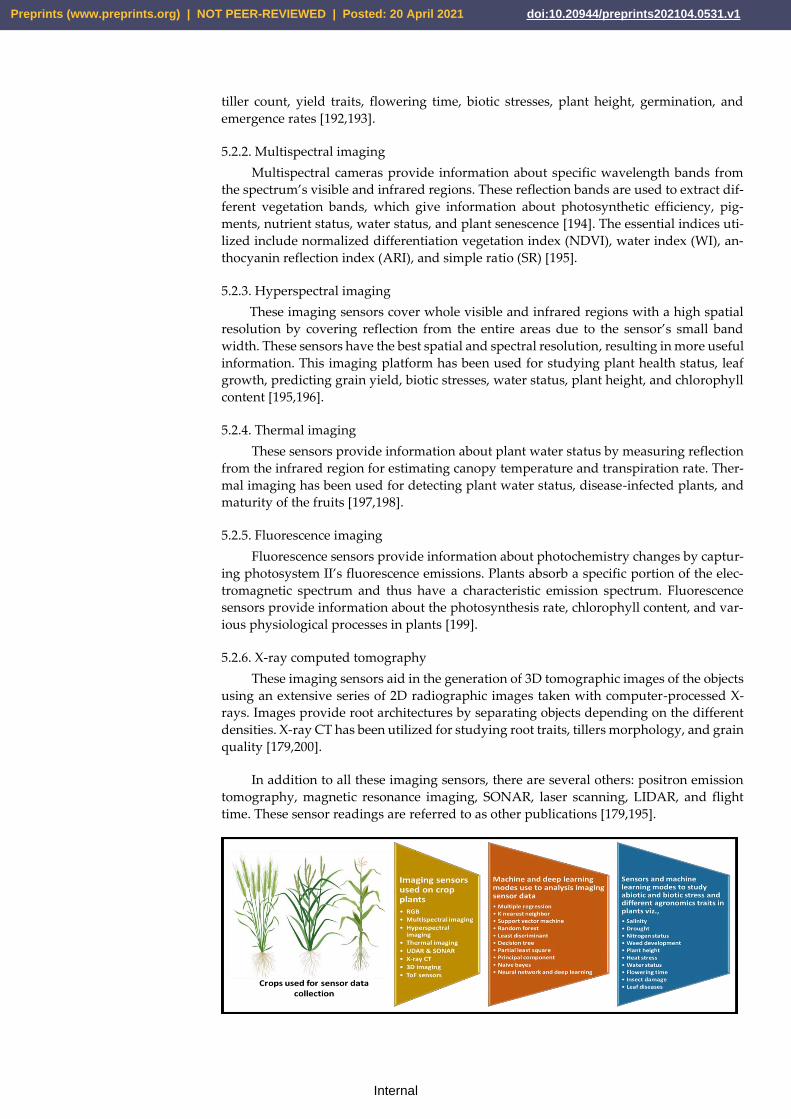
wheat, maize, barley, and sorghum (Tables 9, 10). Figure 7 outlines the most used sensors,
data analysis methods for managing various stresses in the five most important cereals,
namely, rice wheat, maize, barley, and sorghum. The development of novel imaging sen-
sors for non-invasively phenotyping a wide range of organs, tissues, and physiological
processes has provided a substantial impetus to the HTP [181]. This section of the review
concentrates on (1) various phenotyping platforms that are currently being used to accel-
erate genetic gains in key cereals viz., rice, wheat, maize, barley, and sorghum, (2) ad-
vancements in imaging sensors and subsequent analyses, and (3) application of machine
and deep learning methods for solving the “big data” problems in phenomics.
5.1. Plant phenotyping platforms
HTP depends on the imaging sensor used. Advanced phenotyping platforms have
improved the data capture capabilities by including mobility, throughput, and inbuilt
data storage at relatively low cost. Unmanned aerial vehicles (UAVs) have maximum
adoption due to their reliability, cost, and technical requirements; however, some coun-
tries are still not adopting it due to regulations controlling their flight. Several carts and
tractor-mounted tools have similarly been adopted for various crops, although their utili-
zation is also stage-dependent [176]. Moreover, several handheld cheap platforms provide
spectral and time-series information. However, these handheld devices face issues of
standardization and low throughput; and, because they are usually mounted over poles,
they result in less canopy coverage [182]. Table 8 provides detailed information about
various platforms utilized during the last decade.
Preprints (www.preprints.org) | NOT PEER-REVIEWED | Posted: 20 April 2021 doi:10.20944/preprints202104.0531.v1
Internal
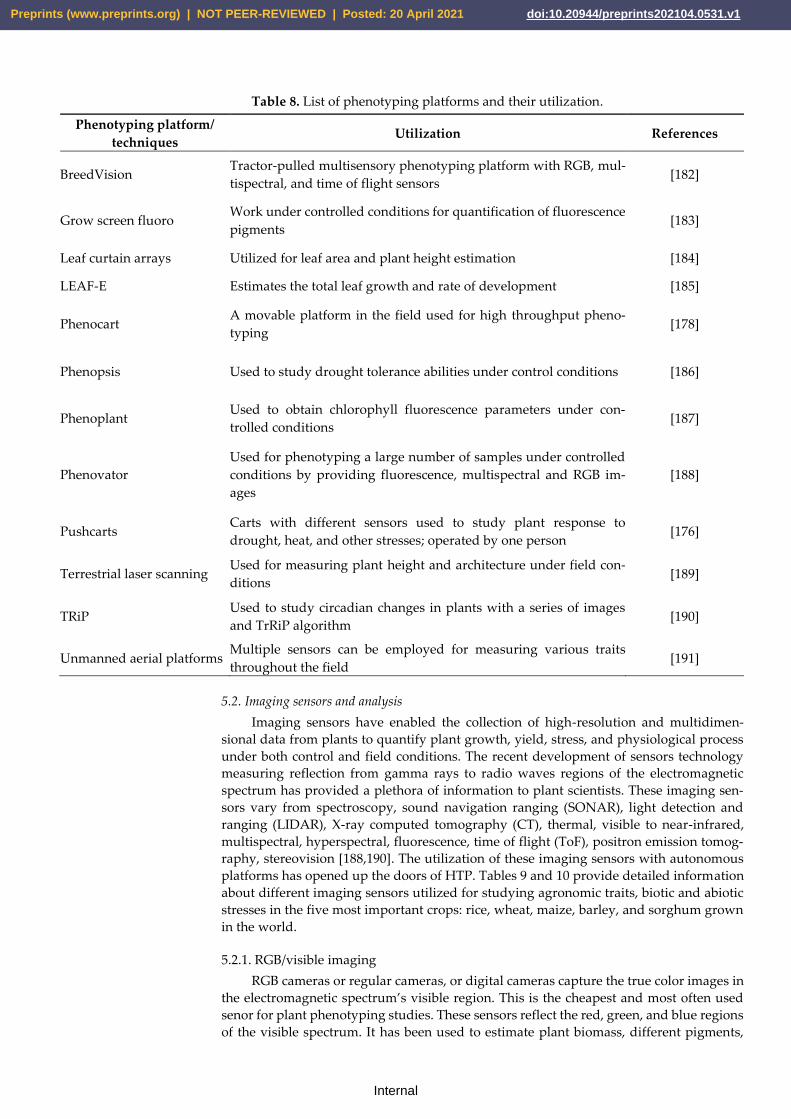
Table 8. List of phenotyping platforms and their utilization.
Phenotyping platform/
techniques Utilization References
BreedVision Tractor-pulled multisensory phenotyping platform with RGB, mul-
tispectral, and time of flight sensors [182]
Grow screen fluoro Work under controlled conditions for quantification of fluorescence
pigments [183]
Leaf curtain arrays Utilized for leaf area and plant height estimation [184]
LEAF-E Estimates the total leaf growth and rate of development [185]
Phenocart A movable platform in the field used for high throughput pheno-
typing [178]
Phenopsis Used to study drought tolerance abilities under control conditions [186]
Phenoplant Used to obtain chlorophyll fluorescence parameters under con-
trolled conditions [187]
Phenovator
Used for phenotyping a large number of samples under controlled
conditions by providing fluorescence, multispectral and RGB im-
ages
[188]
Pushcarts Carts with different sensors used to study plant response to
drought, heat, and other stresses; operated by one person [176]
Terrestrial laser scanning Used for measuring plant height and architecture under field con-
ditions [189]
TRiP Used to study circadian changes in plants with a series of images
and TrRiP algorithm [190]
Unmanned aerial platforms Multiple sensors can be employed for measuring various traits
throughout the field [191]
5.2. Imaging sensors and analysis
Imaging sensors have enabled the collection of high-resolution and multidimen-
sional data from plants to quantify plant growth, yield, stress, and physiological process
under both control and field conditions. The recent development of sensors technology
measuring reflection from gamma rays to radio waves regions of the electromagnetic
spectrum has provided a plethora of information to plant scientists. These imaging sen-
sors vary from spectroscopy, sound navigation ranging (SONAR), light detection and
ranging (LIDAR), X-ray computed tomography (CT), thermal, visible to near-infrared,
multispectral, hyperspectral, fluorescence, time of flight (ToF), positron emission tomog-
raphy, stereovision [188,190]. The utilization of these imaging sensors with autonomous
platforms has opened up the doors of HTP. Tables 9 and 10 provide detailed information
about different imaging sensors utilized for studying agronomic traits, biotic and abiotic
stresses in the five most important crops: rice, wheat, maize, barley, and sorghum grown
in the world.
5.2.1. RGB/visible imaging
RGB cameras or regular cameras, or digital cameras capture the true color images in
the electromagnetic spectrum’s visible region. This is the cheapest and most often used
senor for plant phenotyping studies. These sensors reflect the red, green, and blue regions
of the visible spectrum. It has been used to estimate plant biomass, different pigments,
Preprints (www.preprints.org) | NOT PEER-REVIEWED | Posted: 20 April 2021 doi:10.20944/preprints202104.0531.v1
Internal
tiller count, yield traits, flowering time, biotic stresses, plant height, germination, and
emergence rates [192,193].
5.2.2. Multispectral imaging
Multispectral cameras provide information about specific wavelength bands from
the spectrum’s visible and infrared regions. These reflection bands are used to extract dif-
ferent vegetation bands, which give information about photosynthetic efficiency, pig-
ments, nutrient status, water status, and plant senescence [194]. The essential indices uti-
lized include normalized differentiation vegetation index (NDVI), water index (WI), an-
thocyanin reflection index (ARI), and simple ratio (SR) [195].
5.2.3. Hyperspectral imaging
These imaging sensors cover whole visible and infrared regions with a high spatial
resolution by covering reflection from the entire areas due to the sensor’s small band
width. These sensors have the best spatial and spectral resolution, resulting in more useful
information. This imaging platform has been used for studying plant health status, leaf
growth, predicting grain yield, biotic stresses, water status, plant height, and chlorophyll
content [195,196].
5.2.4. Thermal imaging
These sensors provide information about plant water status by measuring reflection
from the infrared region for estimating canopy temperature and transpiration rate. Ther-
mal imaging has been used for detecting plant water status, disease-infected plants, and
maturity of the fruits [197,198].
5.2.5. Fluorescence imaging
Fluorescence sensors provide information about photochemistry changes by captur-
ing photosystem II’s fluorescence emissions. Plants absorb a specific portion of the elec-
tromagnetic spectrum and thus have a characteristic emission spectrum. Fluorescence
sensors provide information about the photosynthesis rate, chlorophyll content, and var-
ious physiological processes in plants [199].
5.2.6. X-ray computed tomography
These imaging sensors aid in the generation of 3D tomographic images of the objects
using an extensive series of 2D radiographic images taken with computer-processed X-
rays. Images provide root architectures by separating objects depending on the different
densities. X-ray CT has been utilized for studying root traits, tillers morphology, and grain
quality [179,200].
In addition to all these imaging sensors, there are several others: positron emission
tomography, magnetic resonance imaging, SONAR, laser scanning, LIDAR, and flight
time. These sensor readings are referred to as other publications [179,195].
Preprints (www.preprints.org) | NOT PEER-REVIEWED | Posted: 20 April 2021 doi:10.20944/preprints202104.0531.v1
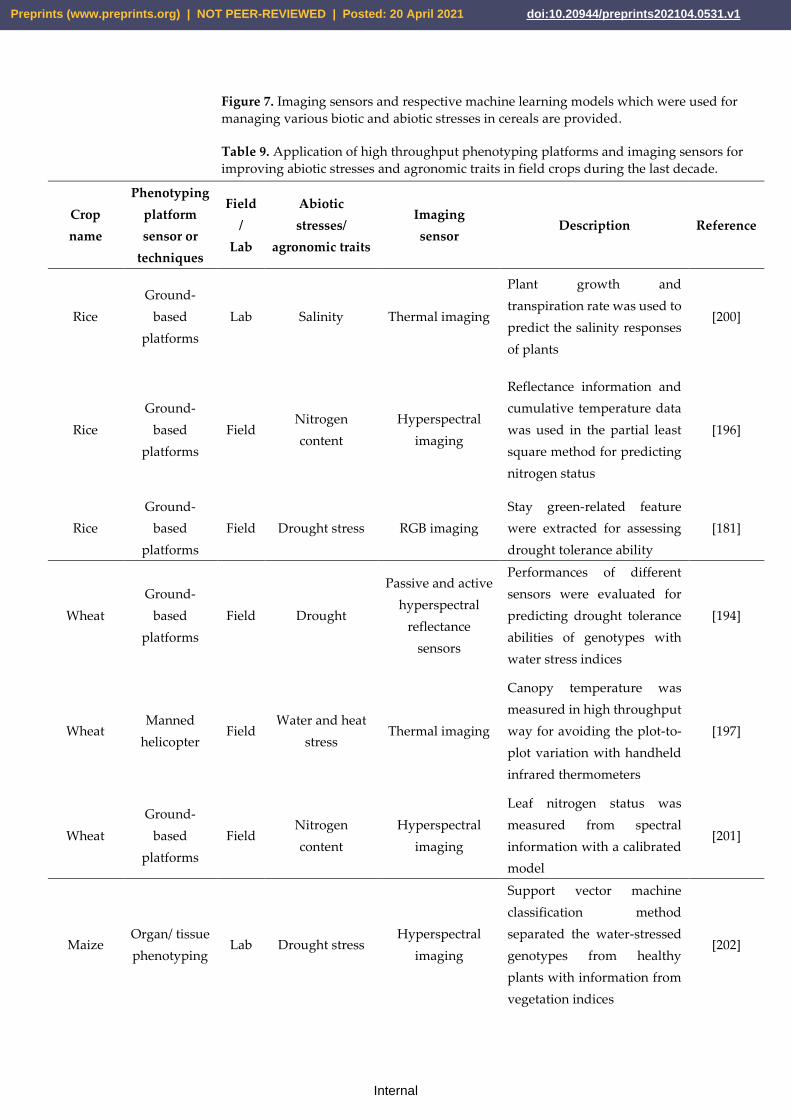
Internal
Figure 7. Imaging sensors and respective machine learning models which were used for
managing various biotic and abiotic stresses in cereals are provided.
Table 9. Application of high throughput phenotyping platforms and imaging sensors for
improving abiotic stresses and agronomic traits in field crops during the last decade.
Crop
name
Phenotyping
platform
sensor or
techniques
Field
/
Lab
Abiotic
stresses/
agronomic traits
Imaging
sensor Description Reference
Rice
Ground-
based
platforms
Lab Salinity Thermal imaging
Plant growth and
transpiration rate was used to
predict the salinity responses
of plants
[200]
Rice
Ground-
based
platforms
Field Nitrogen
content
Hyperspectral
imaging
Reflectance information and
cumulative temperature data
was used in the partial least
square method for predicting
nitrogen status
[196]
Rice
Ground-
based
platforms
Field Drought stress RGB imaging
Stay green-related feature
were extracted for assessing
drought tolerance ability
[181]
Wheat
Ground-
based
platforms
Field Drought
Passive and active
hyperspectral
reflectance
sensors
Performances of different
sensors were evaluated for
predicting drought tolerance
abilities of genotypes with
water stress indices
[194]
Wheat Manned
helicopter Field
Water and heat
stress Thermal imaging
Canopy temperature was
measured in high throughput
way for avoiding the plot-to-
plot variation with handheld
infrared thermometers
[197]
Wheat
Ground-
based
platforms
Field Nitrogen
content
Hyperspectral
imaging
Leaf nitrogen status was
measured from spectral
information with a calibrated
model
[201]
Maize Organ/ tissue
phenotyping Lab Drought stress
Hyperspectral
imaging
Support vector machine
classification method
separated the water-stressed
genotypes from healthy
plants with information from
vegetation indices
[202]
Preprints (www.preprints.org) | NOT PEER-REVIEWED | Posted: 20 April 2021 doi:10.20944/preprints202104.0531.v1
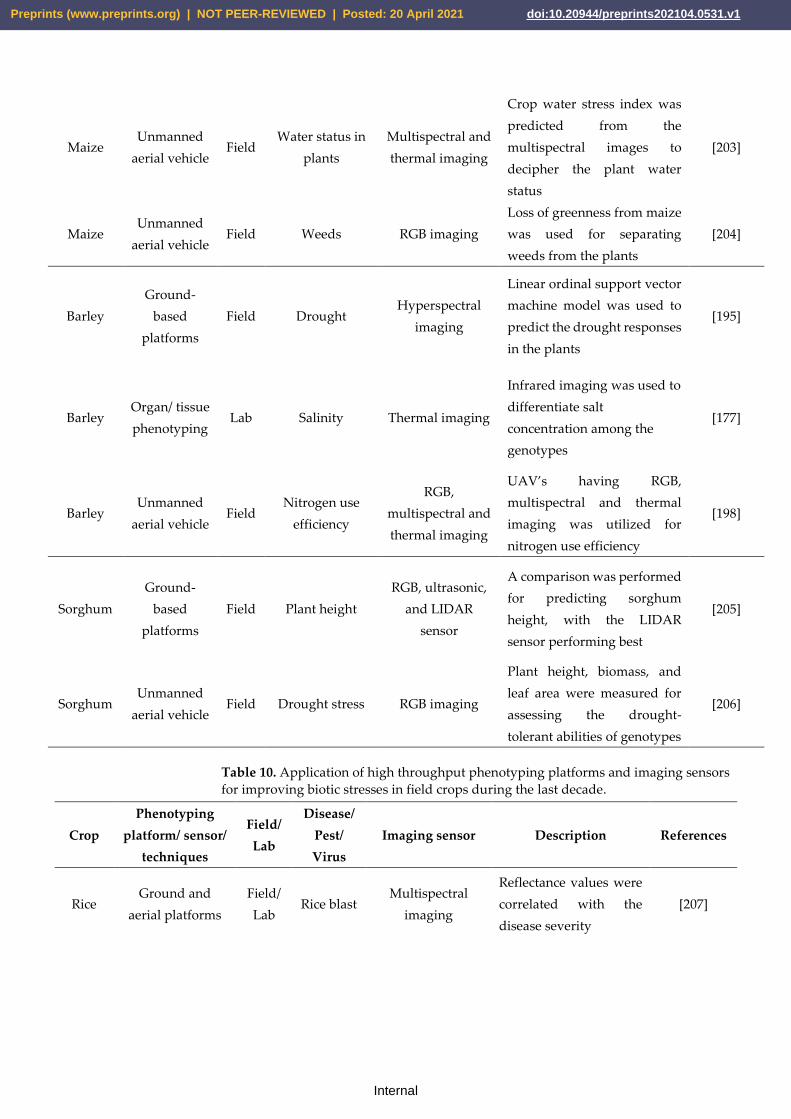
Internal
Maize Unmanned
aerial vehicle Field
Water status in
plants
Multispectral and
thermal imaging
Crop water stress index was
predicted from the
multispectral images to
decipher the plant water
status
[203]
Maize Unmanned
aerial vehicle Field Weeds RGB imaging
Loss of greenness from maize
was used for separating
weeds from the plants
[204]
Barley
Ground-
based
platforms
Field Drought Hyperspectral
imaging
Linear ordinal support vector
machine model was used to
predict the drought responses
in the plants
[195]
Barley Organ/ tissue
phenotyping Lab Salinity Thermal imaging
Infrared imaging was used to
differentiate salt
concentration among the
genotypes
[177]
Barley Unmanned
aerial vehicle Field
Nitrogen use
efficiency
RGB,
multispectral and
thermal imaging
UAV’s having RGB,
multispectral and thermal
imaging was utilized for
nitrogen use efficiency
[198]
Sorghum
Ground-
based
platforms
Field Plant height
RGB, ultrasonic,
and LIDAR
sensor
A comparison was performed
for predicting sorghum
height, with the LIDAR
sensor performing best
[205]
Sorghum Unmanned
aerial vehicle Field Drought stress RGB imaging
Plant height, biomass, and
leaf area were measured for
assessing the drought-
tolerant abilities of genotypes
[206]
Table 10. Application of high throughput phenotyping platforms and imaging sensors
for improving biotic stresses in field crops during the last decade.
Crop
Phenotyping
platform/ sensor/
techniques
Field/
Lab
Disease/
Pest/
Virus
Imaging sensor Description References
Rice Ground and
aerial platforms
Field/
Lab Rice blast
Multispectral
imaging
Reflectance values were
correlated with the
disease severity
[207]
Preprints (www.preprints.org) | NOT PEER-REVIEWED | Posted: 20 April 2021 doi:10.20944/preprints202104.0531.v1
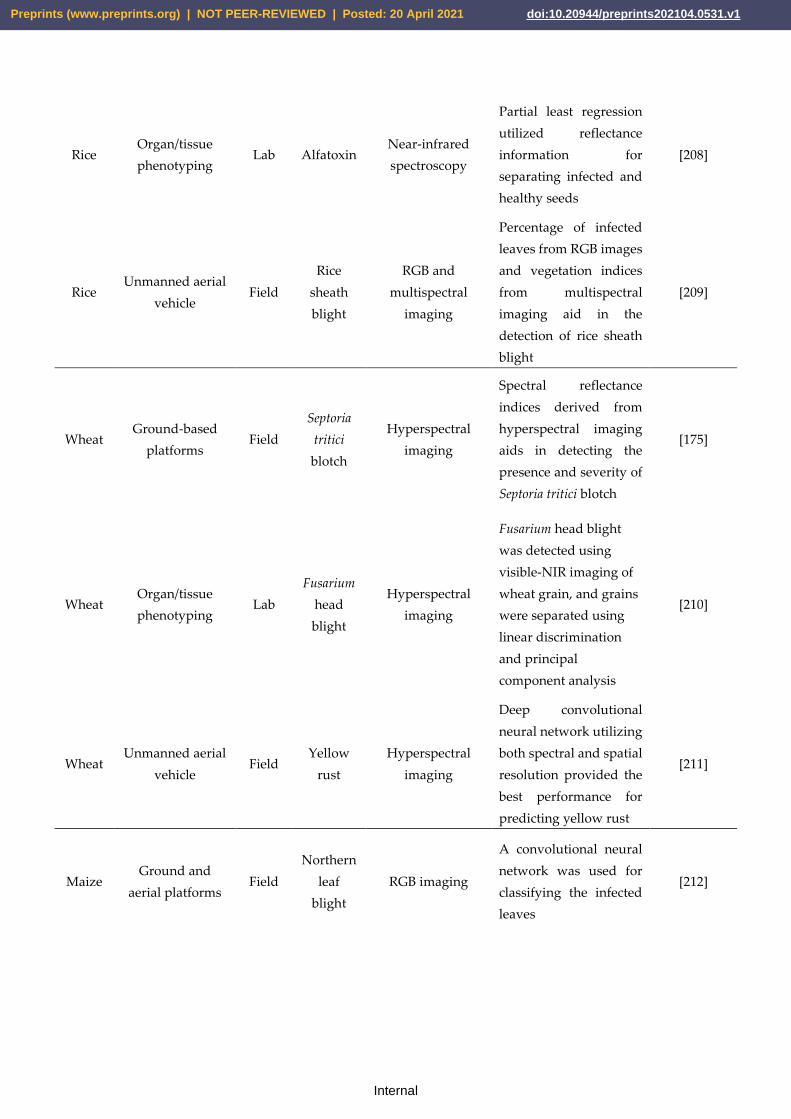
Internal
Rice Organ/tissue
phenotyping Lab Alfatoxin
Near-infrared
spectroscopy
Partial least regression
utilized reflectance
information for
separating infected and
healthy seeds
[208]
Rice Unmanned aerial
vehicle Field
Rice
sheath
blight
RGB and
multispectral
imaging
Percentage of infected
leaves from RGB images
and vegetation indices
from multispectral
imaging aid in the
detection of rice sheath
blight
[209]
Wheat Ground-based
platforms Field
Septoria
tritici
blotch
Hyperspectral
imaging
Spectral reflectance
indices derived from
hyperspectral imaging
aids in detecting the
presence and severity of
Septoria tritici blotch
[175]
Wheat Organ/tissue
phenotyping Lab
Fusarium
head
blight
Hyperspectral
imaging
Fusarium head blight
was detected using
visible-NIR imaging of
wheat grain, and grains
were separated using
linear discrimination
and principal
component analysis
[210]
Wheat Unmanned aerial
vehicle Field
Yellow
rust
Hyperspectral
imaging
Deep convolutional
neural network utilizing
both spectral and spatial
resolution provided the
best performance for
predicting yellow rust
[211]
Maize Ground and
aerial platforms Field
Northern
leaf
blight
RGB imaging
A convolutional neural
network was used for
classifying the infected
leaves
[212]
Preprints (www.preprints.org) | NOT PEER-REVIEWED | Posted: 20 April 2021 doi:10.20944/preprints202104.0531.v1
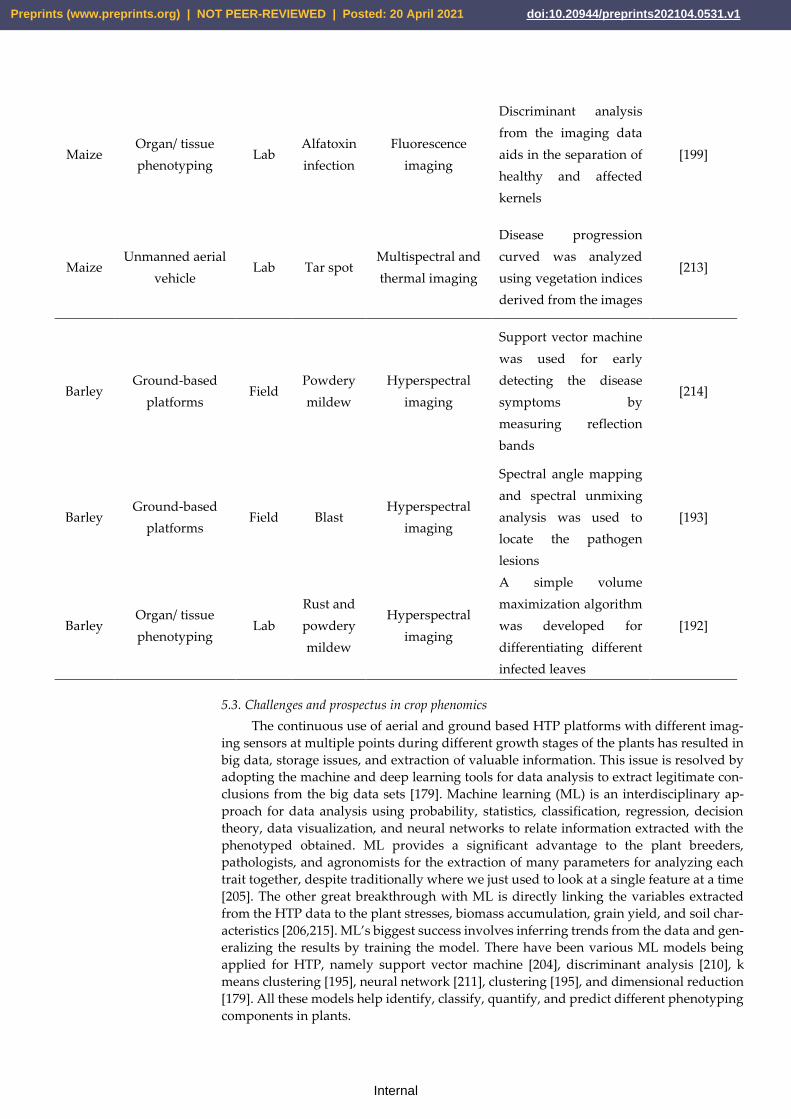
Internal
Maize Organ/ tissue
phenotyping Lab
Alfatoxin
infection
Fluorescence
imaging
Discriminant analysis
from the imaging data
aids in the separation of
healthy and affected
kernels
[199]
Maize Unmanned aerial
vehicle Lab Tar spot
Multispectral and
thermal imaging
Disease progression
curved was analyzed
using vegetation indices
derived from the images
[213]
Barley Ground-based
platforms Field
Powdery
mildew
Hyperspectral
imaging
Support vector machine
was used for early
detecting the disease
symptoms by
measuring reflection
bands
[214]
Barley Ground-based
platforms Field Blast
Hyperspectral
imaging
Spectral angle mapping
and spectral unmixing
analysis was used to
locate the pathogen
lesions
[193]
Barley Organ/ tissue
phenotyping Lab
Rust and
powdery
mildew
Hyperspectral
imaging
A simple volume
maximization algorithm
was developed for
differentiating different
infected leaves
[192]
5.3. Challenges and prospectus in crop phenomics
The continuous use of aerial and ground based HTP platforms with different imag-
ing sensors at multiple points during different growth stages of the plants has resulted in
big data, storage issues, and extraction of valuable information. This issue is resolved by
adopting the machine and deep learning tools for data analysis to extract legitimate con-
clusions from the big data sets [179]. Machine learning (ML) is an interdisciplinary ap-
proach for data analysis using probability, statistics, classification, regression, decision
theory, data visualization, and neural networks to relate information extracted with the
phenotyped obtained. ML provides a significant advantage to the plant breeders,
pathologists, and agronomists for the extraction of many parameters for analyzing each
trait together, despite traditionally where we just used to look at a single feature at a time
[205]. The other great breakthrough with ML is directly linking the variables extracted
from the HTP data to the plant stresses, biomass accumulation, grain yield, and soil char-
acteristics [206,215]. ML’s biggest success involves inferring trends from the data and gen-
eralizing the results by training the model. There have been various ML models being
applied for HTP, namely support vector machine [204], discriminant analysis [210], k
means clustering [195], neural network [211], clustering [195], and dimensional reduction
[179]. All these models help identify, classify, quantify, and predict different phenotyping
components in plants.
Preprints (www.preprints.org) | NOT PEER-REVIEWED | Posted: 20 April 2021 doi:10.20944/preprints202104.0531.v1
Internal
However, the recent transformation by deep learning (DL) in other fields such as
traffic signaling, health care, voice and image recognition, consumer analytics, and medi-
cal diagnostics has provided a new tool to plant scientists for image analysis in HTP [215].
DL models involve automatically learning the pattern from the extensive data set using
non-linear activation functions for making conclusions such as classification or predic-
tions. The important DL models used for phenomics include but are not limited to a mul-
tilayer perceptron, generative adversarial networks, convolutional neural network, and
recurrent neural network [212]. These potential data analysis tools open up a new path
for opening the prospectus of HTP in plant breeding.
Overall, in this phenomics section, we provided a comprehensive review of the ad-
vent of high throughput phenotyping, aerial and ground-based platforms, imaging sen-
sors and analysis, and finally, data analysis methods and phenotyping bottlenecks and
prospectus to deliver the whole pipeline of the HTP utilization in the programs.
Supplementary Materials: The following are available online at www.mdpi.com/xxx/s1, Figure S1:
title, Table S1: title, Video S1: title.
Author Contributions: BK and KSS conceived the idea. QHM and RK outlined the manuscript. BK,
KSS, RK, KK, JS, and QHM contributed to the writing of the manuscript. RK contributed to figure
editing. QHM, MSR, and RK edited the manuscript. All authors have read and agreed to the pub-
lished version of the manuscript.
Funding: This research received no external funding.
Institutional Review Board Statement: Not applicable.
Informed Consent Statement: Not applicable.
Data Availability Statement: Data is contained within the article.
Acknowledgments: RK thanks drawing tool BioRender that helped create the crop images in Figs.
1 and 7.
Conflicts of Interest: The authors declare no conflict of interest.
References
1. Röder, M.S.; Korzun, V.; Wendehake, K.; Plaschke, J.; Tixier, M.-H.; Leroy, P.; Ganal, M.W. A microsatellite map of wheat.
Genetics 1998, 149, 2007-2023.
2. Bernardo, R. Breeding for quantitative traits in plants. Press S, editor. Woodbury: 2010.
3. Ganal, M.W.; Plieske, J.; Hohmeyer, A.; Polley, A.; Röder, M.S. High-throughput genotyping for cereal research and
breeding. In Applications of Genetic and Genomic Research in Cereals, Elsevier: 2019; pp. 3-17.
4. Rabanus-Wallace, M.T.; Stein, N. Progress in sequencing of Triticeae genomes and future uses. In Applications of Genetic and
Genomic Research in Cereals, Elsevier: 2019; pp. 19-47.
5. Goff, S.A.; Ricke, D.; Lan, T.-H.; Presting, G.; Wang, R.; Dunn, M.; Glazebrook, J.; Sessions, A.; Oeller, P.; Varma, H. A draft
sequence of the rice genome (Oryza sativa L. ssp. japonica). Science (New York, N.Y.) 2002, 296, 92-100.
6. Yu, J.; Hu, S.; Wang, J.; Wong, G.K.-S.; Li, S.; Liu, B.; Deng, Y.; Dai, L.; Zhou, Y.; Zhang, X. A draft sequence of the rice
genome (Oryza sativa L. ssp. indica). Science (New York, N.Y.) 2002, 296, 79-92.
7. Paterson, A.H.; Bowers, J.E.; Bruggmann, R.; Dubchak, I.; Grimwood, J.; Gundlach, H.; Haberer, G.; Hellsten, U.; Mitros, T.;
Poliakov, A. The Sorghum bicolor genome and the diversification of grasses. Nature 2009, 457, 551-556.
8. Schnable, P.S.; Ware, D.; Fulton, R.S.; Stein, J.C.; Wei, F.; Pasternak, S.; Liang, C.; Zhang, J.; Fulton, L.; Graves, T.A. The B73
maize genome: complexity, diversity, and dynamics. Science (New York, N.Y.) 2009, 326, 1112-1115.
9. Alexandrov, N.; Tai, S.; Wang, W.; Mansueto, L.; Palis, K.; Fuentes, R.R.; Ulat, V.J.; Chebotarov, D.; Zhang, G.; Li, Z. SNP-
Seek database of SNPs derived from 3000 rice genomes. Nucleic acids research 2015, 43, D1023-D1027.
Preprints (www.preprints.org) | NOT PEER-REVIEWED | Posted: 20 April 2021 doi:10.20944/preprints202104.0531.v1
Internal
10. Żmieńko, A.; Samelak, A.; Kozłowski, P.; Figlerowicz, M. Copy number polymorphism in plant genomes. Theoretical and
applied genetics 2014, 127, 1-18.
11. Saxena, R.K.; Edwards, D.; Varshney, R.K. Structural variations in plant genomes. Brief Funct Genomics 2014, 13, 296-307,
doi:10.1093/bfgp/elu016.
12. Wang, Y.; Xiong, G.; Hu, J.; Jiang, L.; Yu, H.; Xu, J.; Fang, Y.; Zeng, L.; Xu, E.; Xu, J. Copy number variation at the GL7 locus
contributes to grain size diversity in rice. Nature genetics 2015, 47, 944-948.
13. Würschum, T.; Boeven, P.H.; Langer, S.M.; Longin, C.F.H.; Leiser, W.L. Multiply to conquer: copy number variations at
Ppd-B1 and Vrn-A1 facilitate global adaptation in wheat. BMC genetics 2015, 16, 96.
14. Teplyakova, S.; Lebedeva, M.; Ivanova, N.; Horeva, V.; Voytsutskaya, N.; Kovaleva, O.; Potokina, E. Impact of the 7-bp
deletion in HvGA20ox2 gene on agronomic important traits in barley (Hordeum vulgare L.). BMC Plant Biology 2017, 17, 181,
doi:10.1186/s12870-017-1121-4.
15. Yu, J.; Buckler, E.S. Genetic association mapping and genome organization of maize. Current opinion in biotechnology 2006,
17, 155-160.
16. Guo, T.; Yang, J.; Li, D.; Sun, K.; Luo, L.; Xiao, W.; Wang, J.; Liu, Y.; Wang, S.; Wang, H. Integrating GWAS, QTL, mapping
and RNA-seq to identify candidate genes for seed vigor in rice (Oryza sativa L.). Molecular Breeding 2019, 39, 87.
17. Kim, S.-M.; Reinke, R.F. A novel resistance gene for bacterial blight in rice, Xa43 (t) identified by GWAS, confirmed by QTL
mapping using a bi-parental population. PloS one 2019, 14, e0211775.
18. Kang, J.-W.; Kabange, N.R.; Phyo, Z.; Park, S.-Y.; Lee, S.-M.; Lee, J.-Y.; Shin, D.; Cho, J.H.; Park, D.-S.; Ko, J.-M. Combined
Linkage Mapping and Genome-Wide Association Study Identified QTLs Associated with Grain Shape and Weight in Rice
(Oryza sativa L.). Agronomy 2020, 10, 1532.
19. Yano, K.; Morinaka, Y.; Wang, F.; Huang, P.; Takehara, S.; Hirai, T.; Ito, A.; Koketsu, E.; Kawamura, M.; Kotake, K., et al.
GWAS with principal component analysis identifies a gene comprehensively controlling rice architecture. Proceedings of the
National Academy of Sciences 2019, 116, 21262-21267, doi:10.1073/pnas.1904964116.
20. Yuan, J.; Wang, X.; Zhao, Y.; Khan, N.U.; Zhao, Z.; Zhang, Y.; Wen, X.; Tang, F.; Wang, F.; Li, Z. Genetic basis and
identification of candidate genes for salt tolerance in rice by GWAS. Scientific reports 2020, 10, 1-9.
21. Gao, F.; Wen, W.; Liu, J.; Rasheed, A.; Yin, G.; Xia, X.; Wu, X.; He, Z. Genome-wide linkage mapping of QTL for yield
components, plant height and yield-related physiological traits in the Chinese wheat cross Zhou 8425B/Chinese Spring.
Frontiers in Plant Science 2015, 6, 1099.
22. Wu, Q.-H.; Chen, Y.-X.; Zhou, S.-H.; Fu, L.; Chen, J.-J.; Xiao, Y.; Zhang, D.; Ouyang, S.-H.; Zhao, X.-J.; Cui, Y. High-density
genetic linkage map construction and QTL mapping of grain shape and size in the wheat population Yanda1817× Beinong6.
PloS one 2015, 10, e0118144.
23. Tian, X.; Wen, W.; Xie, L.; Fu, L.; Xu, D.; Fu, C.; Wang, D.; Chen, X.; Xia, X.; Chen, Q. Molecular mapping of reduced plant
height gene Rht24 in bread wheat. Frontiers in plant science 2017, 8, 1379.
24. Guo, Z.; Chen, D.; Alqudah, A.M.; Roder, M.S.; Ganal, M.W.; Schnurbusch, T. Genome-wide association analyses of 54 traits
identified multiple loci for the determination of floret fertility in wheat. New Phytol 2017, 214, 257-270, doi:10.1111/nph.14342.
25. Muqaddasi, Q.H.; Brassac, J.; Koppolu, R.; Plieske, J.; Ganal, M.W.; Röder, M.S. TaAPO-A1, an ortholog of rice ABERRANT
PANICLE ORGANIZATION 1, is associated with total spikelet number per spike in elite European hexaploid winter wheat
(Triticum aestivum L.) varieties. Scientific Reports 2019, 9, 1-12.
26. Poland, J.A.; Bradbury, P.J.; Buckler, E.S.; Nelson, R.J. Genome-wide nested association mapping of quantitative resistance
to northern leaf blight in maize. Proceedings of the National Academy of Sciences 2011, 108, 6893-6898.
27. Li, X.; Zhou, Z.; Ding, J.; Wu, Y.; Zhou, B.; Wang, R.; Ma, J.; Wang, S.; Zhang, X.; Xia, Z. Combined linkage and association
mapping reveals QTL and candidate genes for plant and ear height in maize. Frontiers in plant science 2016, 7, 833.
Preprints (www.preprints.org) | NOT PEER-REVIEWED | Posted: 20 April 2021 doi:10.20944/preprints202104.0531.v1
Internal
28. Wu, X.; Li, Y.; Shi, Y.; Song, Y.; Zhang, D.; Li, C.; Buckler, E.S.; Li, Y.; Zhang, Z.; Wang, T. Joint‐linkage mapping and
GWAS reveal extensive genetic loci that regulate male inflorescence size in maize. Plant Biotechnology Journal 2016, 14, 1551-
1562.
29. Li, H.; Thrash, A.; Tang, J.D.; He, L.; Yan, J.; Warburton, M.L. Leveraging GWAS data to identify metabolic pathways and
networks involved in maize lipid biosynthesis. The Plant Journal 2019, 98, 853-863.
30. Wang, H.; Wei, J.; Li, P.; Wang, Y.; Ge, Z.; Qian, J.; Fan, Y.; Ni, J.; Xu, Y.; Yang, Z. Integrating GWAS and Gene Expression
Analysis Identifies Candidate Genes for Root Morphology Traits in Maize at the Seedling Stage. Genes 2019, 10, 773.
31. Wang, J.; Yang, J.; Jia, Q.; Zhu, J.; Shang, Y.; Hua, W.; Zhou, M. A new QTL for plant height in barley (Hordeum vulgare L.)
showing no negative effects on grain yield. PLoS One 2014, 9, e90144, doi:10.1371/journal.pone.0090144.
32. Liller, C.B.; Walla, A.; Boer, M.P.; Hedley, P.; Macaulay, M.; Effgen, S.; von Korff, M.; van Esse, G.W.; Koornneef, M. Fine
mapping of a major QTL for awn length in barley using a multiparent mapping population. Theoretical and Applied Genetics
2017, 130, 269-281.
33. Alqudah, A.M.; Sharma, R.; Pasam, R.K.; Graner, A.; Kilian, B.; Schnurbusch, T. Genetic Dissection of Photoperiod Response
Based on GWAS of Pre-Anthesis Phase Duration in Spring Barley. PLoS ONE 2014, 9, e113120,
doi:10.1371/journal.pone.0113120.
34. Karunarathne, S.D.; Han, Y.; Zhang, X.-Q.; Zhou, G.; Hill, C.B.; Chen, K.; Angessa, T.; Li, C. Genome-wide association study
and identification of candidate genes for nitrogen use efficiency in barley (Hordeum vulgare L.). Frontiers in Plant Science
2020, 11, 1361.
35. Thabet, S.G.; Moursi, Y.S.; Karam, M.A.; Börner, A.; Alqudah, A.M. Natural variation uncovers candidate genes for barley
spikelet number and grain yield under drought stress. Genes 2020, 11, 533.
36. Zou, G.; Zhai, G.; Feng, Q.; Yan, S.; Wang, A.; Zhao, Q.; Shao, J.; Zhang, Z.; Zou, J.; Han, B. Identification of QTLs for eight
agronomically important traits using an ultra-high-density map based on SNPs generated from high-throughput
sequencing in sorghum under contrasting photoperiods. Journal of experimental botany 2012, 63, 5451-5462.
37. Boyles, R.E.; Pfeiffer, B.K.; Cooper, E.A.; Rauh, B.L.; Zielinski, K.J.; Myers, M.T.; Brenton, Z.; Rooney, W.L.; Kresovich, S.
Genetic dissection of sorghum grain quality traits using diverse and segregating populations. Theoretical and applied genetics
2017, 130, 697-716.
38. Zhao, J.; Mantilla Perez, M.B.; Hu, J.; Salas Fernandez, M.G. Genome‐wide association study for nine plant architecture
traits in sorghum. The plant genome 2016, 9, 1-14.
39. Rhodes, D.H.; Hoffmann, L.; Rooney, W.L.; Herald, T.J.; Bean, S.; Boyles, R.; Brenton, Z.W.; Kresovich, S. Genetic
architecture of kernel composition in global sorghum germplasm. BMC genomics 2017, 18, 1-8.
40. Tao, Y.; Zhao, X.; Wang, X.; Hathorn, A.; Hunt, C.; Cruickshank, A.W.; van Oosterom, E.J.; Godwin, I.D.; Mace, E.S.; Jordan,
D.R. Large‐scale GWAS in sorghum reveals common genetic control of grain size among cereals. Plant Biotechnology Journal
2020, 18, 1093-1105.
41. Jayakodi, M.; Padmarasu, S.; Haberer, G.; Bonthala, V.S.; Gundlach, H.; Monat, C.; Lux, T.; Kamal, N.; Lang, D.; Himmelbach,
A., et al. The barley pan-genome reveals the hidden legacy of mutation breeding. Nature 2020, 10.1038/s41586-020-2947-8,
doi:10.1038/s41586-020-2947-8.
42. Jayakodi, M.; Schreiber, M.; Stein, N.; Mascher, M. Building pan-genome infrastructures for crop plants and their use in
association genetics. DNA Res 2021, 10.1093/dnares/dsaa030, doi:10.1093/dnares/dsaa030.
43. Zhao, Q.; Feng, Q.; Lu, H.; Li, Y.; Wang, A.; Tian, Q.; Zhan, Q.; Lu, Y.; Zhang, L.; Huang, T. Pan-genome analysis highlights
the extent of genomic variation in cultivated and wild rice. Nature genetics 2018, 50, 278-284.
44. Walkowiak, S.; Gao, L.; Monat, C.; Haberer, G.; Kassa, M.T.; Brinton, J.; Ramirez-Gonzalez, R.H.; Kolodziej, M.C.; Delorean,
E.; Thambugala, D., et al. Multiple wheat genomes reveal global variation in modern breeding. Nature 2020, 10.1038/s41586-
020-2961-x, doi:10.1038/s41586-020-2961-x.
Preprints (www.preprints.org) | NOT PEER-REVIEWED | Posted: 20 April 2021 doi:10.20944/preprints202104.0531.v1
Internal
45. Pérez-Ortín, J.E.; Tordera, V.; Chávez, S. Homeostasis in the Central Dogma of molecular biology: the importance of mRNA
instability. RNA Biology 2019, 16, 1659-1666.
46. Lowe, R.; Shirley, N.; Bleackley, M.; Dolan, S.; Shafee, T. Transcriptomics technologies. PLoS Computational Biology 2017, 13,
e1005457.
47. Sim, G.; Kafatos, F.; Jones, C.; Koehler, M.; Efstratiadis, A.; Maniatis, T. Use of a cDNA library for studies on evolution and
developmental expression of the chorion multigene families. Cell 1979, 18, 1303-1316.
48. Singh, J.; Aggarwal, R.; Gurjar, M.; Sharma, S.; Jain, S.; Saharan, M. Identification and expression analysis of pathogenicity-
related genes in Tilletia indica inciting Karnal bunt of wheat. Australasian Plant Pathology 2020, 49, 393-402.
49. Velculescu, V.E.; Zhang, L.; Vogelstein, B.; Kinzler, K.W. Serial analysis of gene expression. Science (New York, N.Y.) 1995,
270, 484-487.
50. Itzkovitz, S.; Van Oudenaarden, A. Validating transcripts with probes and imaging technology. Nature Methods 2011, 8, S12-
S19.
51. LaFratta, C.N.; Walt, D.R. Very high density sensing arrays. Chemical Reviews 2008, 108, 614-637.
52. Darshan, K.; Aggarwal, R.; Bashyal, B.M.; Singh, J.; Shanmugam, V.; Gurjar, M.S.; Solanke, A.U. Transcriptome profiling
provides insights into potential antagonistic mechanisms involved in Chaetomium globosum against Bipolaris sorokiniana.
Frontiers in Microbiology 2020, 11.
53. Le Nguyen, K.; Grondin, A.; Courtois, B.; Gantet, P. Next-generation sequencing accelerates crop gene discovery. Trends in
Plant Science 2019, 24, 263-274.
54. Knierim, E.; Lucke, B.; Schwarz, J.M.; Schuelke, M.; Seelow, D. Systematic comparison of three methods for fragmentation
of long-range PCR products for next generation sequencing. PloS ONE 2011, 6, e28240.
55. Luo, Y.; Hitz, B.C.; Gabdank, I.; Hilton, J.A.; Kagda, M.S.; Lam, B.; Myers, Z.; Sud, P.; Jou, J.; Lin, K. New developments on
the Encyclopedia of DNA Elements (ENCODE) data portal. Nucleic Acids Research 2020, 48, D882-D889.
56. Zhang, M.; Hong, L.-Z.; Gu, M.-F.; Wu, C.-D.; Zhang, G. Transcriptome analyses revealed molecular responses of Cynanchum
auriculatum leaves to saline stress. Scientific Reports 2020, 10, 1-11.
57. Ahanger, M.A.; Akram, N.A.; Ashraf, M.; Alyemeni, M.N.; Wijaya, L.; Ahmad, P. Plant responses to environmental
stresses—from gene to biotechnology. AoB Plants 2017, 9.
58. Selvi, A.; Devi, K.; Manimekalai, R.; Prathima, P. Comparative analysis of drought-responsive transcriptomes of sugarcane
genotypes with differential tolerance to drought. 3 Biotech 2020, 10, 1-14.
59. Le, D.T.; Nishiyama, R.; Watanabe, Y.; Tanaka, M.; Seki, M.; Yamaguchi-Shinozaki, K.; Shinozaki, K.; Tran, L.-S.P.
Differential gene expression in soybean leaf tissues at late developmental stages under drought stress revealed by genome-
wide transcriptome analysis. PloS ONE 2012, 7, e49522.
60. Formentin, E.; Sudiro, C.; Perin, G.; Riccadonna, S.; Barizza, E.; Baldoni, E.; Lavezzo, E.; Stevanato, P.; Sacchi, G.A.; Fontana,
P. Transcriptome and cell physiological analyses in different rice cultivars provide new insights into adaptive and salinity
stress responses. Frontiers in Plant Science 2018, 9, 204.
61. Li, Z.; Hu, G.; Liu, X.; Zhou, Y.; Li, Y.; Zhang, X.; Yuan, X.; Zhang, Q.; Yang, D.; Wang, T. Transcriptome sequencing
identified genes and gene ontologies associated with early freezing tolerance in maize. Frontiers in Plant Science 2016, 7, 1477.
62. Abdel-Ghany, S.E.; Ullah, F.; Ben-Hur, A.; Reddy, A.S. Transcriptome analysis of drought-resistant and drought-sensitive
sorghum (Sorghum bicolor) genotypes in response to peg-induced drought stress. International Journal of Molecular Sciences
2020, 21, 772.
63. Yoo, Y.-H.; Nalini Chandran, A.K.; Park, J.-C.; Gho, Y.-S.; Lee, S.-W.; An, G.; Jung, K.-H. OsPhyB-mediating novel regulatory
pathway for drought tolerance in rice root identified by a global RNA-Seq transcriptome analysis of rice genes in response
to water deficiencies. Frontiers in Plant Science 2017, 8, 580.
Preprints (www.preprints.org) | NOT PEER-REVIEWED | Posted: 20 April 2021 doi:10.20944/preprints202104.0531.v1
Internal
64. Hong, W.-J.; Jiang, X.; Ahn, H.R.; Choi, J.; Kim, S.-R.; Jung, K.-H. Systematic analysis of cold stress response and diurnal
rhythm using transcriptome data in rice reveals the molecular networks related to various biological processes. International
Journal of Molecular Sciences 2020, 21, 6872.
65. Hu, L.; Xie, Y.; Fan, S.; Wang, Z.; Wang, F.; Zhang, B.; Li, H.; Song, J.; Kong, L. Comparative analysis of root transcriptome
profiles between drought-tolerant and susceptible wheat genotypes in response to water stress. Plant Science 2018, 272, 276-
293.
66. Winfield, M.O.; Lu, C.; Wilson, I.D.; Coghill, J.A.; Edwards, K.J. Cold-and light-induced changes in the transcriptome of
wheat leading to phase transition from vegetative to reproductive growth. BMC Plant Biology 2009, 9, 1-14.
67. Kawaura, K.; Mochida, K.; Yamazaki, Y.; Ogihara, Y. Transcriptome analysis of salinity stress responses in common wheat
using a 22k oligo-DNA microarray. Functional & Integrative Genomics 2006, 6, 132-142.
68. Wang, N.; Li, L.; Gao, W.; Wu, Y.; Yong, H.; Weng, J.; LI, M.-s.; Zhang, D.; Hao, Z.; Li, X. Transcriptomes of early developing
tassels under drought stress reveal differential expression of genes related to drought tolerance in maize. Journal of Integrative
Agriculture 2018, 17, 1276-1288.
69. Wang, M.; Wang, Y.; Zhang, Y.; Li, C.; Gong, S.; Yan, S.; Li, G.; Hu, G.; Ren, H.; Yang, J. Comparative transcriptome analysis
of salt-sensitive and salt-tolerant maize reveals potential mechanisms to enhance salt resistance. Genes & Genomics 2019, 41,
781-801.
70. Janiak, A.; Kwasniewski, M.; Sowa, M.; Kuczyńska, A.; Mikołajczak, K.; Ogrodowicz, P.; Szarejko, I. Insights into barley root
transcriptome under mild drought stress with an emphasis on gene expression regulatory mechanisms. International Journal
of Molecular Sciences 2019, 20, 6139.
71. Hill, C.B.; Cassin, A.; Keeble-Gagnère, G.; Doblin, M.S.; Bacic, A.; Roessner, U. De novo transcriptome assembly and analysis
of differentially expressed genes of two barley genotypes reveal root-zone-specific responses to salt exposure. Scientific
Reports 2016, 6, 1-14.
72. Sun, X.; Zheng, H.; Li, J.; Liu, L.; Zhang, X.; Sui, N. Comparative transcriptome analysis reveals new lncRNAs responding
to salt stress in sweet sorghum. Frontiers in Bioengineering and Biotechnology 2020, 8, 331.
73. Punia, H.; Tokas, J.; Bhadu, S.; Mohanty, A.K.; Rawat, P.; Malik, A. Proteome dynamics and transcriptome profiling in
sorghum [Sorghum bicolor (L.) Moench] under salt stress. 3 Biotech 2020, 10, 1-10.
74. Atkinson, N.J.; Urwin, P.E. The interaction of plant biotic and abiotic stresses: from genes to the field. Journal of Experimental
Botany 2012, 63, 3523-3543.
75. Bilgin, D.D.; Zavala, J.A.; Zhu, J.; Clough, S.J.; Ort, D.R.; DeLUCIA, E.H. Biotic stress globally downregulates photosynthesis
genes. Plant, cell & environment 2010, 33, 1597-1613.
76. Garrett, K.A.; Dendy, S.P.; Frank, E.E.; Rouse, M.N.; Travers, S.E. Climate change effects on plant disease: genomes to
ecosystems. Annu. Rev. Phytopathol. 2006, 44, 489-509.
77. Pan, Y.; Liu, Z.; Rocheleau, H.; Fauteux, F.; Wang, Y.; McCartney, C.; Ouellet, T. Transcriptome dynamics associated with
resistance and susceptibility against Fusarium head blight in four wheat genotypes. BMC Genomics 2018, 19, 1-26.
78. Jeon, J.; Lee, G.-W.; Kim, K.-T.; Park, S.-Y.; Kim, S.; Kwon, S.; Huh, A.; Chung, H.; Lee, D.-Y.; Kim, C.-Y. Transcriptome
profiling of the rice blast fungus Magnaporthe oryzae and its host Oryza sativa during infection. Molecular Plant-Microbe
Interactions 2020, 33, 141-144.
79. Tariq, R.; Wang, C.; Qin, T.; Xu, F.; Tang, Y.; Gao, Y.; Ji, Z.; Zhao, K. Comparative transcriptome profiling of rice near-
isogenic line carrying Xa23 under infection of Xanthomonas oryzae pv. oryzae. International Journal of Molecular Sciences 2018,
19, 717.
80. Zhang, J.; Chen, L.; Fu, C.; Wang, L.; Liu, H.; Cheng, Y.; Li, S.; Deng, Q.; Wang, S.; Zhu, J. Comparative transcriptome
analyses of gene expression changes triggered by Rhizoctonia solani AG1 IA infection in resistant and susceptible rice varieties.
Frontiers in Plant Science 2017, 8, 1422.
Preprints (www.preprints.org) | NOT PEER-REVIEWED | Posted: 20 April 2021 doi:10.20944/preprints202104.0531.v1
Internal
81. Sharma, C.; Saripalli, G.; Kumar, S.; Gautam, T.; Kumar, A.; Rani, S.; Jain, N.; Prasad, P.; Raghuvanshi, S.; Jain, M. A study
of transcriptome in leaf rust infected bread wheat involving seedling resistance gene Lr28. Functional Plant Biology 2018, 45,
1046-1064.
82. Hao, Y.; Wang, T.; Wang, K.; Wang, X.; Fu, Y.; Huang, L.; Kang, Z. Transcriptome analysis provides insights into the
mechanisms underlying wheat plant resistance to stripe rust at the adult plant stage. PLoS ONE 2016, 11, e0150717.
83. Yu, Y.; Shi, J.; Li, X.; Liu, J.; Geng, Q.; Shi, H.; Ke, Y.; Sun, Q. Transcriptome analysis reveals the molecular mechanisms of
the defense response to gray leaf spot disease in maize. BMC Genomics 2018, 19, 1-17.
84. Kebede, A.Z.; Johnston, A.; Schneiderman, D.; Bosnich, W.; Harris, L.J. Transcriptome profiling of two maize inbreds with
distinct responses to Gibberella ear rot disease to identify candidate resistance genes. BMC Genomics 2018, 19, 1-12.
85. Ghorbani, A.; Izadpanah, K.; Dietzgen, R.G. Changes in maize transcriptome in response to maize Iranian mosaic virus
infection. PLoS ONE 2018, 13, e0194592.
86. Sjokvist, E.; Lemcke, R.; Kamble, M.; Turner, F.; Blaxter, M.; Havis, N.H.; Lyngkjær, M.F.; Radutoiu, S. Dissection of
Ramularia leaf spot disease by integrated analysis of barley and Ramularia collo-cygni transcriptome responses. Molecular
Plant-Microbe Interactions 2019, 32, 176-193.
87. Liu, H.; Li, G.; Yang, X.; Kuijer, H.N.J.; Liang, W.; Zhang, D. Transcriptome profiling reveals phase-specific gene expression
in the developing barley inflorescence. The Crop Journal 2020, 8, 71-86, doi:10.1016/j.cj.2019.04.005.
88. Shoaib, A.; Aldaoude, A.; Arabi, M.; Al-Shehadah, E.; Jawhar, M. Transcriptome profiling reveals distinct gene activations
in barley responding to scald and spot blotch. Cereal Research Communications 2018, 46, 490-498.
89. Tan, L.; Chen, S.; Wang, T.; Dai, S. Proteomic insights into seed germination in response to environmental factors. Proteomics
2013, 13, 1850-1870.
90. Eldakak, M.; Milad, S.I.; Nawar, A.I.; Rohila, J.S. Proteomics: a biotechnology tool for crop improvement. Frontiers in Plant
Science 2013, 4, 35.
91. Ashwin, N.; Barnabas, L.; Sundar, A.R.; Malathi, P.; Viswanathan, R.; Masi, A.; Agrawal, G.K.; Rakwal, R. Advances in
proteomic technologies and their scope of application in understanding plant–pathogen interactions. Journal of Plant
Biochemistry and Biotechnology 2017, 26, 371-386.
92. Anguraj Vadivel, A.K. Gel-based proteomics in plants: time to move on from the tradition. Frontiers in Plant Science 2015, 6,
369.
93. Tan, B.C.; Lim, Y.S.; Lau, S.-E. Proteomics in commercial crops: an overview. Journal of Proteomics 2017, 169, 176-188.
94. Lee, J.; Jiang, W.; Qiao, Y.; Cho, Y.I.; Woo, M.O.; Chin, J.H.; Kwon, S.W.; Hong, S.S.; Choi, I.Y.; Koh, H.J. Shotgun proteomic
analysis for detecting differentially expressed proteins in the reduced culm number rice. Proteomics 2011, 11, 455-468.
95. Beckett, P. The basics of 2D DIGE. In Difference gel electrophoresis (DIGE), Springer: 2012; pp. 9-19.
96. Colignon, B.; Raes, M.; Dieu, M.; Delaive, E.; Mauro, S. Evaluation of three‐dimensional gel electrophoresis to improve
quantitative profiling of complex proteomes. Proteomics 2013, 13, 2077-2082.
97. Rabilloud, T. When 2 D is not enough, go for an extra dimension. Proteomics 2013, 13, 2065-2068.
98. Shiio, Y.; Aebersold, R. Quantitative proteome analysis using isotope-coded affinity tags and mass spectrometry. Nature
protocols 2006, 1, 139.
99. Das, A.; Paudel, B.; Rohila, J.S. Potentials of proteomics in crop breeding. In Advances in plant breeding strategies: breeding,
biotechnology and molecular tools, Springer: 2015; pp. 513-537.
100. Evans, C.; Noirel, J.; Ow, S.Y.; Salim, M.; Pereira-Medrano, A.G.; Couto, N.; Pandhal, J.; Smith, D.; Pham, T.K.; Karunakaran,
E. An insight into iTRAQ: where do we stand now? Analytical and bioanalytical chemistry 2012, 404, 1011-1027.
101. Ong, S.-E.; Blagoev, B.; Kratchmarova, I.; Kristensen, D.B.; Steen, H.; Pandey, A.; Mann, M. Stable isotope labeling by amino
acids in cell culture, SILAC, as a simple and accurate approach to expression proteomics. Molecular & Cellular Proteomics
2002, 1, 376-386.
Preprints (www.preprints.org) | NOT PEER-REVIEWED | Posted: 20 April 2021 doi:10.20944/preprints202104.0531.v1
Internal
102. Mastrobuoni, G.; Irgang, S.; Pietzke, M.; Aßmus, H.E.; Wenzel, M.; Schulze, W.X.; Kempa, S. Proteome dynamics and early
salt stress response of the photosynthetic organism Chlamydomonas reinhardtii. BMC Genomics 2012, 13, 1-13.
103. Liebler, D.C.; Zimmerman, L.J. Targeted quantitation of proteins by mass spectrometry. Biochemistry 2013, 52, 3797-3806.
104. Jorrín‐Novo, J.V.; Pascual, J.; Sánchez‐Lucas, R.; Romero‐Rodríguez, M.C.; Rodríguez‐Ortega, M.J.; Lenz, C.;
Valledor, L. Fourteen years of plant proteomics reflected in Proteomics: Moving from model species and 2DE‐based
approaches to orphan species and gel‐free platforms. Proteomics 2015, 15, 1089-1112.
105. Wu, Y.; Mirzaei, M.; Pascovici, D.; Chick, J.M.; Atwell, B.J.; Haynes, P.A. Quantitative proteomic analysis of two different
rice varieties reveals that drought tolerance is correlated with reduced abundance of photosynthetic machinery and
increased abundance of ClpD1 protease. Journal of Proteomics 2016, 143, 73-82.
106. Gong, C.Y.; Li, Q.; Yu, H.T.; Wang, Z.; Wang, T. Proteomics insight into the biological safety of transgenic modification of
rice as compared with conventional genetic breeding and spontaneous genotypic variation. Journal of Proteome Research 2012,
11, 3019-3029.
107. Ji, Z.; Zeng, Y.; Liang, Y.; Qian, Q.; Yang, C. Proteomic dissection of the rice-Fusarium fujikuroi interaction and the correlation
between the proteome and transcriptome under disease stress. BMC Genomics 2019, 20, 1-11.
108. Wang, Y.; Kim, S.G.; Wu, J.; Huh, H.H.; Lee, S.J.; Rakwal, R.; Kumar Agrawal, G.; Park, Z.Y.; Young Kang, K.; Kim, S.T.
Secretome analysis of the rice bacterium Xanthomonas oryzae (Xoo) using in vitro and in planta systems. Proteomics 2013,
13, 1901-1912.
109. Hao, P.; Zhu, J.; Gu, A.; Lv, D.; Ge, P.; Chen, G.; Li, X.; Yan, Y. An integrative proteome analysis of different seedling organs
in tolerant and sensitive wheat cultivars under drought stress and recovery. Proteomics 2015, 15, 1544-1563.
110. Kacem, N.; Mauro, S.; Muhovski, Y.; Delporte, F.; Renaut, J.; Djekoun, A.; Watillon, B. Diagonal two-dimensional
electrophoresis (D-2DE): a new approach to study the effect of osmotic stress induced by polyethylene glycol in durum
wheat (Triticum durum Desf.). Molecular Biology Reports 2016, 43, 897-909.
111. Maytalman, D.; Mert, Z.; Baykal, A.; Inan, C.; Gunel, A.; Hasançebi, S. Proteomic analysis of early responsive resistance
proteins of wheat (Triticum aestivum) to yellow rust (Puccinia striiformis f. sp. tritici) using ProteomeLab PF2D. Plant Omics
2013.
112. Day, J.; Gietz, R.D.; Rampitsch, C. Proteome changes induced by Pyrenophora tritici-repentis ToxA in both insensitive and
sensitive wheat indicate senescence-like signaling. Proteome Science 2015, 13, 1-10.
113. Cui, D.; Wu, D.; Liu, J.; Li, D.; Xu, C.; Li, S.; Li, P.; Zhang, H.; Liu, X.; Jiang, C. Proteomic analysis of seedling roots of two
maize inbred lines that differ significantly in the salt stress response. PLoS One 2015, 10, e0116697.
114. Li, G.; Gao, J.; Peng, H.; Shen, Y.; Ding, H.; Zhang, Z.; Pan, G.; Lin, H. Proteomic changes in maize as a response to heavy
metal (lead) stress revealed by iTRAQ quantitative proteomics. Genetics and Molecular Research 2016, 15, 10.4238.
115. Mohammadi, M.; Anoop, V.; Gleddie, S.; Harris, L.J. Proteomic profiling of two maize inbreds during early gibberella ear
rot infection. Proteomics 2011, 11, 3675-3684.
116. Yue, R.; Lu, C.; Han, X.; Guo, S.; Yan, S.; Liu, L.; Fu, X.; Chen, N.; Guo, X.; Chi, H. Comparative proteomic analysis of maize
(Zea mays L.) seedlings under rice black-streaked dwarf virus infection. BMC Plant Biology 2018, 18, 1-11.
117. Ashoub, A.; Baeumlisberger, M.; Neupaertl, M.; Karas, M.; Brüggemann, W. Characterization of common and distinctive
adjustments of wild barley leaf proteome under drought acclimation, heat stress and their combination. Plant Molecular
Biology 2015, 87, 459-471.
118. Mostek, A.; Börner, A.; Weidner, S. Comparative proteomic analysis of β-aminobutyric acid-mediated alleviation of salt
stress in barley. Plant Physiology and Biochemistry 2016, 99, 150-161.
119. Bernardo, L.; Prinsi, B.; Negri, A.S.; Cattivelli, L.; Espen, L.; Valè, G. Proteomic characterization of the Rph15 barley resistance
gene-mediated defence responses to leaf rust. BMC Genomics 2012, 13, 1-16.
120. Eggert, K.; Pawelzik, E. Proteome analysis of Fusarium head blight in grains of naked barley (Hordeum vulgare subsp. nudum).
Proteomics 2011, 11, 972-985.
Preprints (www.preprints.org) | NOT PEER-REVIEWED | Posted: 20 April 2021 doi:10.20944/preprints202104.0531.v1
Internal
121. Pennington, H.G.; Gheorghe, D.M.; Damerum, A.; Pliego, C.; Spanu, P.D.; Cramer, R.; Bindschedler, L.V. Interactions
between the powdery mildew effector BEC1054 and barley proteins identify candidate host targets. Journal of Proteome
Research 2016, 15, 826-839.
122. Roy, S.K.; Cho, S.-W.; Kwon, S.J.; Kamal, A.H.M.; Kim, S.-W.; Oh, M.-W.; Lee, M.-S.; Chung, K.-Y.; Xin, Z.; Woo, S.-H.
Morpho-physiological and proteome level responses to cadmium stress in sorghum. PLoS ONE 2016, 11, e0150431.
123. Jedmowski, C.; Ashoub, A.; Beckhaus, T.; Berberich, T.; Karas, M.; Brüggemann, W. Comparative analysis of Sorghum bicolor
proteome in response to drought stress and following recovery. International Journal of Proteomics 2014, 2014.
124. Jadhav, K.; Ranjani, R.V.; Senthil, N.; Arulkumar, N.; Tamilarasi, P.; Sumathi, K.; Ganesan, K.; Paranidharan, V.; Raveendran,
M.; Kim, G.S. Proteomic Analysis of a Compatible Interaction between Sorghum Downy Mildew Pathogen (Peronosclerospora
sorghi) and Maize (Zea mays L.). Int. J. Curr. Microbiol. App. Sci 2018, 7, 653-670.
125. del Toro, N.; Reisinger, F.; Foster, J.M.; Contell, J.; Fabregat, A.; Safont, P.R.; Hermjakob, H.; Vizcaíno, J.A. PRIDE Proteomes:
a condensed view of the plethora of public proteomics data available in the PRIDE repository. DILS 2014 2014, 21.
126. Kusebauch, U.; Deutsch, E.W.; Campbell, D.S.; Sun, Z.; Farrah, T.; Moritz, R.L. Using PeptideAtlas, SRMAtlas, and PASSEL:
comprehensive resources for discovery and targeted proteomics. Current Protocols in Bioinformatics 2014, 46, 13.25. 11-13.25.
28.
127. Sun, Q.; Zybailov, B.; Majeran, W.; Friso, G.; Olinares, P.D.B.; Van Wijk, K.J. PPDB, the plant proteomics database at Cornell.
Nucleic acids research 2009, 37, D969-D974.
128. Joshi, H.J.; Christiansen, K.M.; Fitz, J.; Cao, J.; Lipzen, A.; Martin, J.; Smith-Moritz, A.M.; Pennacchio, L.A.; Schackwitz, W.S.;
Weigel, D. 1001 Proteomes: a functional proteomics portal for the analysis of Arabidopsis thaliana accessions. Bioinformatics
2012, 28, 1303-1306.
129. Sapkota, A.; Liu, X.; Zhao, X.-M.; Cao, Y.; Liu, J.; Liu, Z.-P.; Chen, L. DIPOS: database of interacting proteins in Oryza sativa.
Molecular BioSystems 2011, 7, 2615-2621.
130. Hirsch-Hoffmann, M.; Gruissem, W.; Baerenfaller, K. pep2pro: the high-throughput proteomics data processing, analysis,
and visualization tool. Frontiers in plant science 2012, 3, 123.
131. Braun, H.-P.; Senkler, M. Functional annotation of 2D protein maps: the GelMap portal. Frontiers in Plant Science 2012, 3, 87.
132. Fan, J.; Mohareb, F.; Jones, A.M.; Bessant, C. MRMaid: the SRM assay design tool for Arabidopsis and other species. Frontiers
in Plant Science 2012, 3, 164.
133. Farrah, T.; Deutsch, E.W.; Kreisberg, R.; Sun, Z.; Campbell, D.S.; Mendoza, L.; Kusebauch, U.; Brusniak, M.Y.; Hüttenhain,
R.; Schiess, R. PASSEL: The Peptide Atlas SRM experiment library. Proteomics 2012, 12, 1170-1175.
134. Baslam, M.; Mitsui, T. Proteomic for quality: mining the proteome as a strategy to elucidate the protein complex applied for
quality improvement. In The Future of Rice Demand: Quality Beyond Productivity, Springer: 2020; pp. 473-494.
135. Deborde, C.; Moing, A.; Roch, L.; Jacob, D.; Rolin, D.; Giraudeau, P. Plant metabolism as studied by NMR spectroscopy.
Progress in Nuclear Magnetic Resonance Spectroscopy 2017, 102, 61-97.
136. Khakimov, B.; Bak, S.; Engelsen, S.B. High-throughput cereal metabolomics: Current analytical technologies, challenges and
perspectives. Journal of Cereal Science 2014, 59, 393-418.
137. Ibarra-Estrada, E.; Soto-Hernández, R.M.; Palma-Tenango, M. Metabolomics as a tool in agriculture. Metabolomics:
Fundamentals and Applications 2016, 148-168.
138. Balmer, D.; Flors, V.; Glauser, G.; Mauch-Mani, B. Metabolomics of cereals under biotic stress: current knowledge and
techniques. Frontiers in Plant Science 2013, 4, 82.
139. Piasecka, A.; Kachlicki, P.; Stobiecki, M. Analytical methods for detection of plant metabolomes changes in response to biotic
and abiotic stresses. International Journal of Molecular Sciences 2019, 20, 379.
140. Wen, W.; Li, D.; Li, X.; Gao, Y.; Li, W.; Li, H.; Liu, J.; Liu, H.; Chen, W.; Luo, J. Metabolome-based genome-wide association
study of maize kernel leads to novel biochemical insights. Nature Communications 2014, 5, 1-10.
Preprints (www.preprints.org) | NOT PEER-REVIEWED | Posted: 20 April 2021 doi:10.20944/preprints202104.0531.v1
Internal
141. Vuckovic, D. Current trends and challenges in sample preparation for global metabolomics using liquid chromatography–
mass spectrometry. Analytical and Bioanalytical Chemistry 2012, 403, 1523-1548.
142. Wu, X.; Li, N.; Li, H.; Tang, H. An optimized method for NMR-based plant seed metabolomic analysis with maximized
polar metabolite extraction efficiency, signal-to-noise ratio, and chemical shift consistency. Analyst 2014, 139, 1769-1778.
143. Kim, H.K.; Verpoorte, R. Sample preparation for plant metabolomics. Phytochemical Analysis: An International Journal of Plant
Chemical and Biochemical Techniques 2010, 21, 4-13.
144. Casartelli, A.; Riewe, D.; Hubberten, H.M.; Altmann, T.; Hoefgen, R.; Heuer, S. Exploring traditional aus-type rice for
metabolites conferring drought tolerance. Rice 2018, 11, 1-16.
145. Cao, D.; Lutz, A.; Hill, C.B.; Callahan, D.L.; Roessner, U. A quantitative profiling method of phytohormones and other
metabolites applied to barley roots subjected to salinity stress. Frontiers in Plant Science 2017, 7, 2070.
146. Zhang, W.; Ramautar, R. CE‐MS for metabolomics: Developments and applications in the period 2018–2020. Electrophoresis
2020.
147. Jones, O.A.; Maguire, M.L.; Griffin, J.L.; Jung, Y.-H.; Shibato, J.; Rakwal, R.; Agrawal, G.K.; Jwa, N.-S. Using metabolic
profiling to assess plant-pathogen interactions: an example using rice (Oryza sativa) and the blast pathogen Magnaporthe
grisea. European Journal of Plant Pathology 2011, 129, 539-554.
148. Witt, S.; Galicia, L.; Lisec, J.; Cairns, J.; Tiessen, A.; Araus, J.L.; Palacios-Rojas, N.; Fernie, A.R. Metabolic and phenotypic
responses of greenhouse-grown maize hybrids to experimentally controlled drought stress. Molecular Plant 2012, 5, 401-417.
149. Zhao, Y.-Y.; Wu, S.-P.; Liu, S.; Zhang, Y.; Lin, R.-C. Ultra-performance liquid chromatography–mass spectrometry as a
sensitive and powerful technology in lipidomic applications. Chemico-Biological Interactions 2014, 220, 181-192.
150. Suharti, W.S.; Nose, A.; Zheng, S.-H. Metabolomic study of two rice lines infected by Rhizoctonia solani in negative ion mode
by CE/TOF-MS. Journal of Plant Physiology 2016, 206, 13-24.
151. Karre, S.; Kumar, A.; Dhokane, D.; Kushalappa, A.C. Metabolo-transcriptome profiling of barley reveals induction of chitin
elicitor receptor kinase gene (HvCERK1) conferring resistance against Fusarium graminearum. Plant Molecular Biology 2017,
93, 247-267.
152. Benincasa, P.; D’Amato, R.; Falcinelli, B.; Troni, E.; Fontanella, M.C.; Frusciante, S.; Guiducci, M.; Beone, G.M.; Businelli, D.;
Diretto, G. Grain endogenous selenium and moderate salt stress work as synergic elicitors in the enrichment of bioactive
compounds in maize sprouts. Agronomy 2020, 10, 735.
153. Kessler, N.; Neuweger, H.; Bonte, A.; Langenkämper, G.; Niehaus, K.; Nattkemper, T.W.; Goesmann, A. MeltDB 2.0–
advances of the metabolomics software system. Bioinformatics 2013, 29, 2452-2459.
154. Chun, H.; Keleş, S. Sparse partial least squares regression for simultaneous dimension reduction and variable selection.
Journal of the Royal Statistical Society: Series B (Statistical Methodology) 2010, 72, 3-25.
155. Xu, Y.; Goodacre, R. Multiblock principal component analysis: an efficient tool for analyzing metabolomics data which
contain two influential factors. Metabolomics 2012, 8, 37-51.
156. Afendi, F.M.; Okada, T.; Yamazaki, M.; Hirai-Morita, A.; Nakamura, Y.; Nakamura, K.; Ikeda, S.; Takahashi, H.; Altaf-Ul-
Amin, M.; Darusman, L.K. KNApSAcK family databases: integrated metabolite–plant species databases for multifaceted
plant research. Plant and Cell Physiology 2012, 53, e1-e1.
157. Kanehisa, M. KEGG bioinformatics resource for plant genomics and metabolomics. In Plant Bioinformatics, Springer: 2016;
pp. 55-70.
158. Pavli, O.I.; Vlachos, C.E.; Kalloniati, C.; Flemetakis, E.; Skaracis, G.N. Metabolite profiling reveals the effect of drought on
sorghum ('Sorghum bicolor'L. Moench) metabolism. Plant Omics 2013, 6.
159. Matsuda, F.; Okazaki, Y.; Oikawa, A.; Kusano, M.; Nakabayashi, R.; Kikuchi, J.; Yonemaru, J.I.; Ebana, K.; Yano, M.; Saito,
K. Dissection of genotype–phenotype associations in rice grains using metabolome quantitative trait loci analysis. The Plant
Journal 2012, 70, 624-636.
Preprints (www.preprints.org) | NOT PEER-REVIEWED | Posted: 20 April 2021 doi:10.20944/preprints202104.0531.v1
Internal
160. Chen, W.; Gao, Y.; Xie, W.; Gong, L.; Lu, K.; Wang, W.; Li, Y.; Liu, X.; Zhang, H.; Dong, H. Genome-wide association analyses
provide genetic and biochemical insights into natural variation in rice metabolism. Nature genetics 2014, 46, 714-721.
161. Brunetti, C.; George, R.M.; Tattini, M.; Field, K.; Davey, M.P. Metabolomics in plant environmental physiology. Journal of
Experimental Botany 2013, 64, 4011-4020.
162. Misra, B.B.; Assmann, S.M.; Chen, S. Plant single-cell and single-cell-type metabolomics. Trends in Plant Science 2014, 19,
637-646.
163. Sun, M.; Yang, Z.; Wawrik, B. Metabolomic fingerprints of individual algal cells using the single-probe mass spectrometry
technique. Frontiers in Plant Science 2018, 9, 571.
164. Barding Jr, G.A.; Fukao, T.; Béni, S.; Bailey-Serres, J.; Larive, C.K. Differential metabolic regulation governed by the rice
SUB1A gene during submergence stress and identification of alanylglycine by 1H NMR spectroscopy. Journal of Proteome
Research 2012, 11, 320-330.
165. Yang, M.; Yang, J.; Su, L.; Sun, K.; Li, D.; Liu, Y.; Wang, H.; Chen, Z.; Guo, T. Metabolic profile analysis and identification of
key metabolites during rice seed germination under low-temperature stress. Plant Science 2019, 289, 110282.
166. Zhang, Y.; Ma, X.-m.; Wang, X.-c.; Liu, J.-h.; Huang, B.-y.; Guo, X.-y.; Xiong, S.-p.; La, G.-X. UPLC-QTOF analysis reveals
metabolomic changes in the flag leaf of wheat (Triticum aestivum L.) under low-nitrogen stress. Plant Physiology and
Biochemistry 2017, 111, 30-38.
167. Gavaghan, C.L.; Li, J.V.; Hadfield, S.T.; Hole, S.; Nicholson, J.K.; Wilson, I.D.; Howe, P.W.; Stanley, P.D.; Holmes, E.
Application of NMR‐based metabolomics to the investigation of salt stress in maize (Zea mays). Phytochemical Analysis
2011, 22, 214-224.
168. Amiour, N.; Imbaud, S.; Clément, G.; Agier, N.; Zivy, M.; Valot, B.; Balliau, T.; Armengaud, P.; Quilleré, I.; Cañas, R. The
use of metabolomics integrated with transcriptomic and proteomic studies for identifying key steps involved in the control
of nitrogen metabolism in crops such as maize. Journal of Experimental Botany 2012, 63, 5017-5033.
169. Swarcewicz, B.; Sawikowska, A.; Marczak, Ł.; Łuczak, M.; Ciesiołka, D.; Krystkowiak, K.; Kuczyńska, A.; Piślewska-
Bednarek, M.; Krajewski, P.; Stobiecki, M. Effect of drought stress on metabolite contents in barley recombinant inbred line
population revealed by untargeted GC–MS profiling. Acta Physiologiae Plantarum 2017, 39, 1-16.
170. Sheflin, A.M.; Chiniquy, D.; Yuan, C.; Goren, E.; Kumar, I.; Braud, M.; Brutnell, T.; Eveland, A.L.; Tringe, S.; Liu, P.
Metabolomics of sorghum roots during nitrogen stress reveals compromised metabolic capacity for salicylic acid
biosynthesis. Plant Direct 2019, 3, e00122.
171. Vincent, D.; Du Fall, L.A.; Livk, A.; Mathesius, U.; Lipscombe, R.J.; Oliver, R.P.; Friesen, T.L.; Solomon, P.S. A functional
genomics approach to dissect the mode of action of the Stagonospora nodorum effector protein SnToxA in wheat. Molecular
Plant Pathology 2012, 13, 467-482.
172. Ciasca, B.; Lanubile, A.; Marocco, A.; Pascale, M.; Logrieco, A.F.; Lattanzio, V.M. Application of an Integrated and Open
Source Workflow for LC-HRMS Plant Metabolomics Studies. Case-Control Study: Metabolic Changes of Maize in Response
to Fusarium verticillioides Infection. Frontiers in Plant Science 2020, 11, 664.
173. Kumaraswamy, K.G.; Kushalappa, A.C.; Choo, T.M.; Dion, Y.; Rioux, S. Mass spectrometry based metabolomics to identify
potential biomarkers for resistance in barley against fusarium head blight (Fusarium graminearum). Journal of Chemical Ecology
2011, 37, 846-856.
174. Mareya, C.R.; Tugizimana, F.; Piater, L.A.; Madala, N.E.; Steenkamp, P.A.; Dubery, I.A. Untargeted metabolomics reveal
defensome-related metabolic reprogramming in Sorghum bicolor against infection by Burkholderia andropogonis. Metabolites
2019, 9, 8.
175. Anderegg, J.; Hund, A.; Karisto, P.; Mikaberidze, A. In-Field Detection and Quantification of Septoria tritici Blotch in Diverse
Wheat Germplasm Using Spectral–Temporal Features. Frontiers in Plant Science 2019, 10, 1355.
176. White, J.W.; Conley, M.M. A flexible, low‐cost cart for proximal sensing. Crop Science 2013, 53, 1646-1649.
Preprints (www.preprints.org) | NOT PEER-REVIEWED | Posted: 20 April 2021 doi:10.20944/preprints202104.0531.v1
Internal
177. Sirault, X.R.; James, R.A.; Furbank, R.T. A new screening method for osmotic component of salinity tolerance in cereals
using infrared thermography. Functional Plant Biology 2009, 36, 970-977.
178. Crain, J.; Mondal, S.; Rutkoski, J.; Singh, R.P.; Poland, J. Combining high‐ throughput phenotyping and genomic
information to increase prediction and selection accuracy in wheat breeding. The plant genome 2018, 11, 170043.
179. Singh, A.; Ganapathysubramanian, B.; Singh, A.K.; Sarkar, S. Machine learning for high-throughput stress phenotyping in
plants. Trends in Plant Science 2016, 21, 110-124.
180. Sandhu, K.S.; Mihalyov, P.D.; Lewiwn, M.J.; Pumphre, y.M.O.; Carter, A.H. Combining genomic and phenomic information
for predicting grain protein content and grain yield in spring wheat. Frontiers in Plant Science 2021, 12,
doi:10.3389/fpls.2021.613300.
181. Duan, L.; Han, J.; Guo, Z.; Tu, H.; Yang, P.; Zhang, D.; Fan, Y.; Chen, G.; Xiong, L.; Dai, M. Novel digital features discriminate
between drought resistant and drought sensitive rice under controlled and field conditions. Frontiers in Plant Science 2018,
9, 492.
182. Busemeyer, L.; Mentrup, D.; Möller, K.; Wunder, E.; Alheit, K.; Hahn, V.; Maurer, H.P.; Reif, J.C.; Würschum, T.; Müller, J.
BreedVision—A multi-sensor platform for non-destructive field-based phenotyping in plant breeding. Sensors 2013, 13,
2830-2847.
183. Jansen, M.; Gilmer, F.; Biskup, B.; Nagel, K.A.; Rascher, U.; Fischbach, A.; Briem, S.; Dreissen, G.; Tittmann, S.; Braun, S.
Simultaneous phenotyping of leaf growth and chlorophyll fluorescence via GROWSCREEN FLUORO allows detection of
stress tolerance in Arabidopsis thaliana and other rosette plants. Functional Plant Biology 2009, 36, 902-914.
184. Fanourakis, D.; Briese, C.; Max, J.F.; Kleinen, S.; Putz, A.; Fiorani, F.; Ulbrich, A.; Schurr, U. Rapid determination of leaf area
and plant height by using light curtain arrays in four species with contrasting shoot architecture. Plant Methods 2014, 10, 1-
11.
185. Voorend, W.; Lootens, P.; Nelissen, H.; Roldán-Ruiz, I.; Inzé, D.; Muylle, H. LEAF-E: a tool to analyze grass leaf growth
using function fitting. Plant Methods 2014, 10, 1-13.
186. Granier, C.; Aguirrezabal, L.; Chenu, K.; Cookson, S.J.; Dauzat, M.; Hamard, P.; Thioux, J.J.; Rolland, G.; Bouchier‐
Combaud, S.; Lebaudy, A. PHENOPSIS, an automated platform for reproducible phenotyping of plant responses to soil
water deficit in Arabidopsis thaliana permitted the identification of an accession with low sensitivity to soil water deficit. New
Phytologist 2006, 169, 623-635.
187. Rousseau, C.; Hunault, G.; Gaillard, S.; Bourbeillon, J.; Montiel, G.; Simier, P.; Campion, C.; Jacques, M.-A.; Belin, E.; Boureau,
T. Phenoplant: a web resource for the exploration of large chlorophyll fluorescence image datasets. Plant Methods 2015, 11,
1-12.
188. Flood, P.J.; Kruijer, W.; Schnabel, S.K.; van der Schoor, R.; Jalink, H.; Snel, J.F.; Harbinson, J.; Aarts, M.G. Phenomics for
photosynthesis, growth and reflectance in Arabidopsis thaliana reveals circadian and long-term fluctuations in heritability.
Plant Methods 2016, 12, 1-14.
189. Friedli, M.; Kirchgessner, N.; Grieder, C.; Liebisch, F.; Mannale, M.; Walter, A. Terrestrial 3D laser scanning to track the
increase in canopy height of both monocot and dicot crop species under field conditions. Plant Methods 2016, 12, 1-15.
190. Greenham, K.; Lou, P.; Remsen, S.E.; Farid, H.; McClung, C.R. TRiP: Tracking Rhythms in Plants, an automated leaf
movement analysis program for circadian period estimation. Plant Methods 2015, 11, 1-11.
191. Zaman-Allah, M.; Vergara, O.; Araus, J.; Tarekegne, A.; Magorokosho, C.; Zarco-Tejada, P.; Hornero, A.; Albà, A.H.; Das,
B.; Craufurd, P. Unmanned aerial platform-based multi-spectral imaging for field phenotyping of maize. Plant Methods 2015,
11, 1-10.
192. Wahabzada, M.; Mahlein, A.-K.; Bauckhage, C.; Steiner, U.; Oerke, E.-C.; Kersting, K. Metro maps of plant disease
dynamics—automated mining of differences using hyperspectral images. PLoS ONE 2015, 10, e0116902.
193. Zhou, R.-Q.; Jin, J.-J.; Li, Q.-M.; Su, Z.-Z.; Yu, X.-J.; Tang, Y.; Luo, S.-M.; He, Y.; Li, X.-L. Early detection of Magnaporthe oryzae-
infected barley leaves and lesion visualization based on hyperspectral imaging. Frontiers in Plant Science 2019, 9, 1962.
Preprints (www.preprints.org) | NOT PEER-REVIEWED | Posted: 20 April 2021 doi:10.20944/preprints202104.0531.v1
Internal
194. Becker, E.; Schmidhalter, U. Evaluation of yield and drought using active and passive spectral sensing systems at the
reproductive stage in wheat. Frontiers in Plant Science 2017, 8, 379.
195. Behmann, J.; Schmitter, P.; Steinrücken, J.; Plümer, L. Ordinal classification for efficient plant stress prediction in
hyperspectral data. International Archives of the Photogrammetry, Remote Sensing & Spatial Information Sciences 2014.
196. Onoyama, H.; Ryu, C.; Suguri, M.; Iida, M. Potential of hyperspectral imaging for constructing a year-invariant model to
estimate the nitrogen content of rice plants at the panicle initiation stage. IFAC Proceedings Volumes 2013, 46, 219-224.
197. Deery, D.M.; Rebetzke, G.J.; Jimenez-Berni, J.A.; James, R.A.; Condon, A.G.; Bovill, W.D.; Hutchinson, P.; Scarrow, J.; Davy,
R.; Furbank, R.T. Methodology for high-throughput field phenotyping of canopy temperature using airborne thermography.
Frontiers in Plant Science 2016, 7, 1808.
198. Kefauver, S.C.; Vicente, R.; Vergara-Díaz, O.; Fernandez-Gallego, J.A.; Kerfal, S.; Lopez, A.; Melichar, J.P.; Serret Molins,
M.D.; Araus, J.L. Comparative UAV and field phenotyping to assess yield and nitrogen use efficiency in hybrid and
conventional barley. Frontiers in Plant Science 2017, 8, 1733.
199. Yao, H.; Hruska, Z.; Kincaid, R.; Brown, R.L.; Bhatnagar, D.; Cleveland, T.E. Detecting maize inoculated with toxigenic and
atoxigenic fungal strains with fluorescence hyperspectral imagery. Biosystems Engineering 2013, 115, 125-135.
200. Al-Tamimi, N.; Brien, C.; Oakey, H.; Berger, B.; Saade, S.; Ho, Y.S.; Schmöckel, S.M.; Tester, M.; Negrão, S. Salinity tolerance
loci revealed in rice using high-throughput non-invasive phenotyping. Nature Communications 2016, 7, 1-11.
201. Vigneau, N.; Ecarnot, M.; Rabatel, G.; Roumet, P. Potential of field hyperspectral imaging as a non destructive method to
assess leaf nitrogen content in Wheat. Field Crops Research 2011, 122, 25-31.
202. Behmann, J.; Steinrücken, J.; Plümer, L. Detection of early plant stress responses in hyperspectral images. ISPRS Journal of
Photogrammetry and Remote Sensing 2014, 93, 98-111.
203. Zhang, L.; Zhang, H.; Niu, Y.; Han, W. Mapping maize water stress based on UAV multispectral remote sensing. Remote
Sensing 2019, 11, 605.
204. Guerrero, J.M.; Pajares, G.; Montalvo, M.; Romeo, J.; Guijarro, M. Support vector machines for crop/weeds identification in
maize fields. Expert Systems with Applications 2012, 39, 11149-11155.
205. Wang, X.; Singh, D.; Marla, S.; Morris, G.; Poland, J. Field-based high-throughput phenotyping of plant height in sorghum
using different sensing technologies. Plant Methods 2018, 14, 1-16.
206. Spindel, J.E.; Dahlberg, J.; Colgan, M.; Hollingsworth, J.; Sievert, J.; Staggenborg, S.H.; Hutmacher, R.; Jansson, C.; Vogel,
J.P. Association mapping by aerial drone reveals 213 genetic associations for Sorghum bicolor biomass traits under drought.
BMC Genomics 2018, 19, 1-18.
207. Kobayashi, T.; Kanda, E.; Kitada, K.; Ishiguro, K.; Torigoe, Y. Detection of rice panicle blast with multispectral radiometer
and the potential of using airborne multispectral scanners. Phytopathology 2001, 91, 316-323.
208. Sirisomboon, C.D.; Putthang, R.; Sirisomboon, P. Application of near infrared spectroscopy to detect aflatoxigenic fungal
contamination in rice. Food Control 2013, 33, 207-214.
209. Zhang, D.; Zhou, X.; Zhang, J.; Lan, Y.; Xu, C.; Liang, D. Detection of rice sheath blight using an unmanned aerial system
with high-resolution color and multispectral imaging. PLoS ONE 2018, 13, e0187470.
210. Shahin, M.A.; Symons, S.J. Detection of Fusarium damaged kernels in Canada Western Red Spring wheat using visible/near-
infrared hyperspectral imaging and principal component analysis. Computers and Electronics in Agriculture 2011, 75, 107-112.
211. Zhang, X.; Han, L.; Dong, Y.; Shi, Y.; Huang, W.; Han, L.; González-Moreno, P.; Ma, H.; Ye, H.; Sobeih, T. A deep learning-
based approach for automated yellow rust disease detection from high-resolution hyperspectral UAV images. Remote
Sensing 2019, 11, 1554.
212. DeChant, C.; Wiesner-Hanks, T.; Chen, S.; Stewart, E.L.; Yosinski, J.; Gore, M.A.; Nelson, R.J.; Lipson, H. Automated
identification of northern leaf blight-infected maize plants from field imagery using deep learning. Phytopathology 2017, 107,
1426-1432.
Preprints (www.preprints.org) | NOT PEER-REVIEWED | Posted: 20 April 2021 doi:10.20944/preprints202104.0531.v1

Internal
213. Loladze, A.; Rodrigues Jr, F.A.; Toledo, F.; San Vicente, F.; Gérard, B.; Boddupalli, M.P. Application of remote sensing for
phenotyping tar spot complex resistance in maize. Frontiers in Plant Science 2019, 10, 552.
214. Thomas, S.; Behmann, J.; Steier, A.; Kraska, T.; Muller, O.; Rascher, U.; Mahlein, A.-K. Quantitative assessment of disease
severity and rating of barley cultivars based on hyperspectral imaging in a non-invasive, automated phenotyping platform.
Plant Methods 2018, 14, 1-12.
215. Sandhu, K.S.; Lozada, D.N.; Zhang, Z.; Pumphrey, M.O.; Carter, A.H. Deep learning for predicting complex traits in spring
wheat breeding program. Frontiers in Plant Science 2020, 11, 2084.
Preprints (www.preprints.org) | NOT PEER-REVIEWED | Posted: 20 April 2021 doi:10.20944/preprints202104.0531.v1